document resume - eric · vocational and occupational education to approximately 3,000 children ......
TRANSCRIPT

DOCUMENT RESUME
ED 227 195 UD 022 688
TITLE Title I Institutionalized Facilities Program. O.E.E.Evaluation Report, 1981-82.
INSTITUTION New York City Board of Education, Brooklyn, N.Y.
Office of Educational Evaluation.PUB DATE Nov 82NOTE 31p.; For related document, see ED 213 807.
PUB TYPE Reports Evaluative/Feasibility (142)
EDRS PRICE MF01/PCO2 Plus Postage.DESCRIPTORS *Achievement Gains; Basic Skills; Career Education;
Delinquency; Diagnostic Teaching; Elementary3
Secondary Education; Emotional Disturbances;Institutionalized Persons; Mathematics Achievement;Mental Retardation; *Program Effectiveness; ProgramEvaluation; Reading Achievement; RemedialInsteuction; *Residential Institutions; *ResidentialPrograms; *Special Education; *VocationalEducation
IDENTIFIERS Elementary Secondary Education Act Title I; *New York
(New York)
ABSTRACTThis report documents the 1981-82 evaluation of the
Elementary and Secondary Education Act, Title I, Part B,Institutional Facilities Program carried out through the Division of
Special Education of the New York City public schools. Using adiagnostic-prescriptive methodology, the program providedafter-school and pull-out individualized remedial instruction in
vocational and occupational education to approximately 3,000 children
and adolescents residing in 172 facilities for the neglected or
delinquent. Some students also received reading and math instruction.Evaluation focused on physical setting, materials, supplies, program
goals, instruCtional activities, student records, planning,assessment, staff background, orientation, supervision, as well as
problems in implementation and administrative concerns. Also
evaluated were,pupil achievement objectives in reading andmathematics. Measures of the relationship between mastery of new
skills and amount of instruction indicated that the program met or
exceeded its proposed goals in all pupil achievement areas. It isrecommended, however, that the program (1) focus on elements otherthan vocational skills for some retarded and the very young children;
(2' establish instructional policy for transient pupils; (3) modifytesting requirements; and (4) provide more inservice training.
(Author/WAM)
************************************************************************ Reproductions supplied by EDRS are the best that can be made *
* from the original document.*
***********************$f***********************************************
O.E.E. EVALUATION REPORTNovember, 1982
TITLE IThe Division of Special EducationAlan Gartner, Executive Director
INSTITUTIONAL IZED FACILITIESPROGRAM1981-82
Prepared by:
D.S.E. Reimbursable Programs Unit
Al 1 i son Tupper
Shirley Tempro, Coordinator
(O.E.E. Special Education EvaluatIon Unit
Robert Tobias, Evaluation Manager
Jercme Margolis, Evaluation Specialist
Christine Halfar, Evaluation Associate
Frances Francois, Consultant
New York City Public SchoolOffice of Educational Evaluation
Richard Guttenberg, Director
2
-PERMISSION TO REPRODUCE THISMATERIAL HAS BEEN GRANTED BY
_---ii<, t-k,,,,-\-....,-
TO THE EDUCATIONAL RESOURCESINFORMATION CENTER (ERIC)."
US DEPARTMENT OF EDUCATIONNATIONAL INSTITUTE OF EDUCATION
TIM( A TIONAL RESOURCES INFORMATIONCENTER (ERIC)
/Th, do, amen, has been repunluted asottt 1,41 front the person or orgarniatonotttprt,otti,i ft
NI,Elitr t rrrrqes pow been made to iMplove11,11(t.illl tql11 geal,ty
en ,4,,t if ,, w 0, ()p.vor), v oed m th.s dmu
,,,,td,w,essar0y,mesentuttNIE
A SUMMARY OF THE EVALUATIONFOR THE
1981-1982 E.S.E.A. TITLE I, PART 8
INSTITUTIONALIZED FACILITIES PROGRAM
During 1981-82, its thirteenth year; the Institutionalized Facilities
Program provided after-school and pull-out remedial instruction to over
3,000 children and adolescents residing in facilities for the neglected
or delinquent. The major focus of the current program cycle was vocational
and occupational education, a departure from previous years' emphasis
on reading', math, and writing skills; this year all students received
career education instruction and one-third each received reading and math.
Measures of the relationship between mastery of new skills and amount
of instruction indicated that the program met or exceeded its proposed
goals in all pupil achievement areas. Students mastered career education
skills at an average rate of 3.6 skills for every five hours of instruc-
tion; the rate of mastery for reading skills was 2.5 per five hours and
for math skills it was 3.7. Regression analyses for mastery by amount
of instruction providedfurtfter evidence of program effectiveness.
Overall, the program operated smoothly and no serious problems were
reported. The major obstacle, according to teachers, was substantial
pupil transience; attendance was as high as 90 sessions but the average
was only 20. Frequent student turnover, as well as the marked diversity
in students' abilities and backgrounds, gave rise to the following recom-
mendations for further improvement:
.Choice of program goals and assessment instruments
should be more flexible. In particular, vocational/
occupational skills are not the most appropriate
goals for certainmentally-retarded or very young
children. In such cases, activities of daily living
might serve as an effective alternative.
.A program policy needs to be established concerning the
instructional goals and curriculcA for transient pupils.
Individual instructional planning ought to consider
probable length of residence.
.The testing requirement should be more discretionary.
In sites where populations are stable, pre- and post-
testing presents no problems; in highly transient sites,
however, this is often impractical. An attempt should
be mace to incorporate data retrieval procedures into
ongoing planning and assessment.
.Additional in-service training in occupational/vocational
education should be attempted particularly in selection
and use of curriculum materials.
TABLE OF CONTENTS
Page
I. INTRODUCTION1
EVALUATION OF PROGRAM IMPLEMENTATION3
PROGRAM DESCRIPTION3
EVALUATION METHODOLOGY4
FINDINGS4
III. EVALUATION OF PUPIL ACHIEVEMENT OBJECTIVES 9
FINDINGS9
IV. CONCLUSIONS AND RECOMMENDATIONS20

LIST OF TABLES
TitlePage
Table 1Frequency distribution of rates of mastery of career education
skills, expressed as number of skills mastered per five hours of
instruction12
Table 2Frequency distribution of rates of mastery of reading skills,
expressed as number of skills mastered per five hours of
instruction
Table 3Frequency distribution of rates of mastery of mathematics
skills, expressed as number of skills mastered per five hours
of instruction
16
18
LIST OF FIGURES
Figure 1Average number of career education skills by amount of
instruction
Figure 2Average number of reading skills, by amount of instruction
Page
'11
14
Figure 3Average number of mathematics skills, by amount of instruction 19
I. INTRODUCTION
This report documents the evaluation of the thirteenth year of the
E.S.E.A. Title I, Part B Institutionalized Facilities Program sponsored
by the DiVision of Special Education of the New York City Public Schools.
The program provided twice-weekly, after-school or pull-out remedial
instruction to approximately 3,000 children and adolescents residing in
172 facilities for the neglected or delinquent; pull-out remediation was
provided to the day-school programs at Riker's Island (P.S. 233 Q and P.S.
256 Q), Spofford Juvenile Center, four upstate drug rehabilitation centers,
and the, Mission of Mount Loretto School (P.S. 25 R). The major focus of
the 1981-82 program was vocational and occupational education, a departure
from the previous years' emphasis on reading,.math, and writing skills.
All students in the 1981-82 program received indivi,dualized instructiOn
in career education using a diagnostic-prescriptive methodology. In
addition, roughly one-third each were given reading and math remediation
in the career-vocational content area. Pupil achievement objectives4
for the program were that students would master new skills in each of these
areas at a rate of one skill for every five weeks of instruction. Staff
included the program coordinator, 11 itinerant superviser-s, 263 teachers,
and three paraprofessionals.
Findings of the evaluation of the previous program cycle, which served
approximately 2,000 students, indicated that pupil achievement objectives
were only partially met. Specifically, the 1980-81 criterion of mastery
of one skill for each six weeks of instruction was attained by 65 percent
of the students in reading, 62 percent in mathematics, and 27 percent in
writing, as opposed to the proposed 80 percent. Further analyses suggested
that despite the program's full implementation and smooth operation, its
7
effectiveness was impaired by the marked transiency of the population;
average attendance was 28 sessions for the fall term and 23 sessions for0
the spring. Correlation coefficients of ,41 and .34 between attendance
.and mastery of reading skills .and mastery of math skills, respectively,
indicated that the program did have an effect on skills acquisition in
both areas, although not at the level proposed. Poor student motivation
was also seen as limiting achievement.
Major recommendations for improvement of the program based on the 1980-
81 evaluation were to continue the diagnostic-prescriptive approach, to
give consideration to designing an integrated system of pupil reinforcement,
and to ensure that sufficient additional training be provided to any program
staff member requesting it.
As in past program cycles, the current 1981-82 Institutionalized Facili-
ties Program was evaludted by the Office of Educational Evaluation (0.E.E.)
.through the collection and analysis of data from pupil achievement tests and
observation and interview records from visits to randomly-selected program
sites. Site visits were conducted by O.E.E. field consultants between
January and May, 1982. The following chapters present the findings on
program implementation and pupil achievement for the current program year
and relate these to findings and conclusions from previous cycles.
i
II. EVALUATION OF PROGRAM IMPLEMENTATION
PROGRAM DESCRIPTION
The Ihstitutionalized Facilities Program supplemented basic education
for 3,087 students, aged six to 22 years, residing in facilities for the
neglected or delinquent by providing remedial instruction in vocational
and occupational education, reading, and mathematics. The backgrounds,
needs, and abilities -cif these students varied widely; the program served
delinquent adolescents in houses of detention, court-referred youth
waiting placement, mentally retarded and emotionally handicapped children
in group homes, and pregnant adolescents. The 59 institutions which0
operated the 172 residential facilities were both publicly- and privately-
-funded and in roughly half the cases also provided the basic educational
program for their student residents. Most of the students who attended
school on-site were detained in locked facilities for delinquent youth:
with the exception of some handicapped students who also went to school
at their residentral sites, all other students attended neighborhood
public schools and returned to the residences in the evening.
The typical length of residence varied markedly among sites. In facili-
ties to which students were referred by the courts the stay was often less
than ont. month; length of residence for pregnant adolescents ranged from a
few weeks to several months; handicapped children in group homes, in, con-
trast, often stayed in these facilities for a year or more.
For the most part instruction was provided after regular school hdurs.
Pupil progress was assessed through ongoing administration of the following
individually-administered,criterion-referenced tests: the Career Education/
-3-
Prevocational Skills Assessment Inventory, the Fountain Valley Reading Test,
and the Basic Arithematic Skills Evaluation (BASE).
EVALUATION METHODOLOGY
Field consultants-from O.E.E. visited a randomly-selected sample of
program facilities, observing instruction and interviewing program staff
at 52 sites (30 percent). Data were recordea on 0.E.E.-developed obser-
vation records and interview guides.
FINDINGS
Physical Setting, Materials, and Supplies
At 15 of the 52 sites programinstruction took place in the same class-
rooms used by students during the regular school day. As such, these set-
tings were optimal for displaying curriculum materials and student work,
storing supplie, and providing clearly-defined pupil work areas. The
remaining 37 sites were residences for students who attended neighborhood
public schools during the day. In these sites, many of which were apart-
ments or houses, program instruction was held in offices, students' roans,
living rooms, dining rooms, and, in one case, a laundry room. Despite
the diversity in settings, 42 of the 52 teachers interviewed found the
facilities adequate. Some, in fact, preferred the residential spaces to
regular classrooms as more private, cheerful, and conficive to learning
for poorly motivated students.
Materials and supplies were provided, for the most part, by the program
but were supplemented by other sources. At 37 of the sites visited materials
were purchased with funds from the current program year, at 12 of the sites
-4-
ma,terials were provided by the sponsoring institutions or were drawn from
stockpiles from previous program cycles, and in three of the sites teachA
relied on their own noncommercial materials.
Program Goals and Instructional Activities
The overall program mandate was to improve the prevocational and career
s'kills and reading and mathematics abilities of participating students.
Program teachers who were interviewed were asked to deAribe their own
A
specific goals for their students. The responses varied somewhat according
to the population served but alMost all teachers stated the following: im-
proved sense of self-worth; upgrading of reading and math skills, especially
in the context of acquiring and keeping a job; and the development of realis-
tic occupational goals and vocational skills. Mentioned among the latter
were career-seeking skills, societal and survival skill,s;, and, for lower
functioning students, activities of daily living.
The instructional activities which were observed were by-and-large in
keeping with these stated goals. Job-related lessons included studying
the classifieds fo- available positions and discussing job-application
procedures; identification of abilities Aecessary for particular jobs;
discussion of appropriate work attitudes; conputation of wages and taxes;
and comparison of consumer goods and prices. Reading and math instruction
were integrated into the context of career education. In two cases in which
the students were mentally handicapped the instruction was in prevocational
life skills rather than vocational skills; lessons observed involved
changing money, recognizing traffic signals, and identifying social situ-
ations depicted in drawings.
-5-
ii
The materials in use also reflected program'goals. Twenty-two of the
52 sites used the Globe VOcational Series and 14 used the ,Janus.,series,
both of which a\refteading ser.ies with vocational, occupational content.
The teachers preferred these to all other reading material.s. Other voca-
tionally-oriented reading material included the S.R.A. Reading for Survival
series, the Arco Job Handbook, kife Skills Reading, and t ,Pal Practical
Vocational Series; math materials included Math and Your Career, Math Life
Skills, and RASE Math; and regular reading series inclred McCall-Crabbs,
Barnell-Loft, and Cloze. Non-commercial materials useil in lessons included
newspaper help-wanted listings, application forms fftm public and private
institutions, tax furms, and teacher-made worksheets.
Class sizes were generally small permitting individualized instruction.
Class registers averaged seven students and ranged from two to 17; average
attendance was five. Teachers typically worked with one student at a time
and, less often, with small groups. Nearly all the teachers interviewed
stated that a one-to-one tutorial approach was most effedive for building
rapport and improving student motivation.
Student Records, Planning, and Assessment
Up-to-date records were maintained at every site. ,Student folders
typically included student work samples, teacher logs and anecdotal mate-
rials, test results, attendance records, individualized educational plans,
and pupil contracts.
At most sites criterion-referenced testing was proceeding as proposed;
however, only the teachers at the long-term facilities expressed satisfacticn
-6-
with the assessment procedures. At sites with high rates of turnover, tea-
chers found testing to be burdensome and time-consuming and 20 reported
that often Chey were not able to carry out posttesting because students were
tranferred or discharged with little or no advance notice. Seven teachers
stated that students should be assessed informally and 19 teachers substituted
tests that they considered more appropriate fgr their populations.
Staff Background, Orientation, and Supervision
The staff was experienced, including teachers who held full-time posi-
tions during the regular school day. Almost all (47 out of 52) had taught more
'than five years and most (39) ten years or more. Similarly, most (39) taught
special education more than five years.
With the_exception of two who were h'ired mid-year, all teachers atten-
ded an orientation sessia conducted by the program coordinator. The orien-
tation covered program goals and objectives, test administration, and ad-
ministrative and clerical issues and was seen by teachers as adequate. A
number of teacheri suggested that additional smaller meetings with their
supervisors would be helpful to address specific concerns and, in parti-
cular, methods and materials for career education. However, about one-half
of the teachers stated that they had been incorporating vocational and
t....occupational goals into the:3r reading and math instruction for a number
Of years and were thus prepared for the shift in program emphasis.
\ Most teachers also described supervision as satisfactory, though some
,
teacher4s stated they would have benefited from more frequent supervisory
\.. contact.
-7-
......... 13
Problems in Implementation and Administrative Concerns
Teachers reported that the greatest obstacle was student transience;
almost every teacher at the sites with frequent student turnover commented
on the difficulties this presented for program implementation. In addition,
uncertainity regarding the length of stay for any particular student fur-
ther hampered effective planning and instruction. Since the courts decided
length of residence, the program teachers could not anticipate exactly
how long a student would be in the program. In contrast, at long-term
residence sites, most of the teachers said that the program was viable
and provided meaningful instruction in a non-threatening atmosphere. At
four of the sites, for example, students were looking forward to attaining
their General Equivalency Diplomas, which teachers attributed to partici-
pation in the program.
Teachers noted other problems in implementation including conflicts
,. between the schedules of the program and facilitiesand variation among
sites in student participation policy; in cases where participation was
voluntary, sporadic attendance reportedly compounded the effects of pupil
transience. Finally, 22 of the teachers said that the schedule of only
1
AN1 sessions per week limited program effectiveness and suggested increases
in both number and length of the sessions. Five teachers recommended that
a summer program be included to improve continuity.
The large majority of teachers indicated that the residential facilities
supported the program by providing suitable settings for instruction, en-
couraging students to attend, and providing relevant information.
III, EVALUATION OF PUPIL ACHIEVEMENT OBJECTIVES
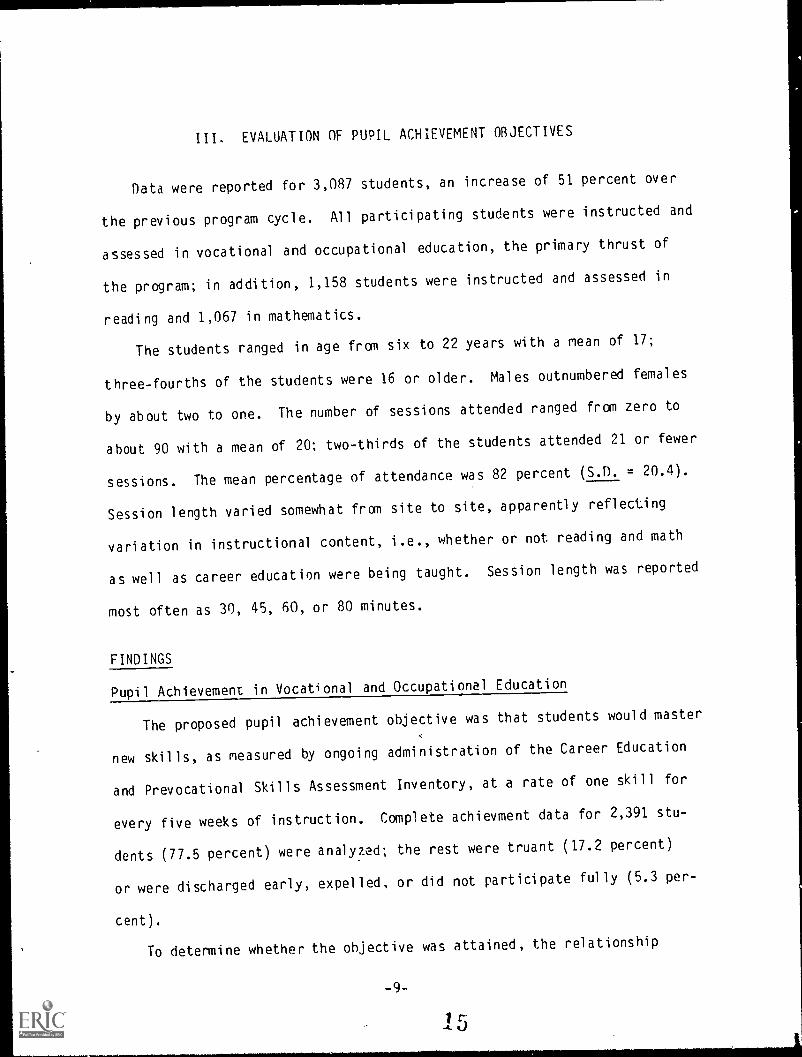
Data were reported for 3,087 students, an increase of 51 percent over
the previous program cycle. All participating students were instructed and
assessed in vocational and occupational education, the primary thrust of
the program; in addition, 1,158 students were instructed and assessed in
reading and 1,067 in mathematics.
The students ranged in age from six to 22 years with a mean of 17;
three-fourths of the students were 16 or older. Males outnumbered females
by about two to one. The number of sessions attended ranged from zero to
about 90 with a mean of 20: two-thirds of the students attended 21 or fewer
sessions. The mean percentage of attendance was 82 percent (S.D. = 20.4).
Session length varied somewhat from site to site, apparently reflecting
variation in instructional content, i.e., whether or not reading and math
as well as career education were being taught. Session length was reported
most often as 30, 45, 60, or 80 minutes.
FINDINGS
Pupil Achievement in Vocational and Occupational Education
The proposed pupil achievement objective was that students would master
,
new skills, as measured by ongoing administration of the Career Education
and Prevocational Skills Assessment Inventory, at a rate of one skill for
every five weeks of instruction. Complete achievment data for 2,391 stu-
dents (77.5 percent) were analyzed; the rest were truant (17.2 percent)
or were discharged early, expelled, or did not participate fully (5.3 per-
cent).
To determine whether the ohjective was attained, the relationship
-9-
1,5
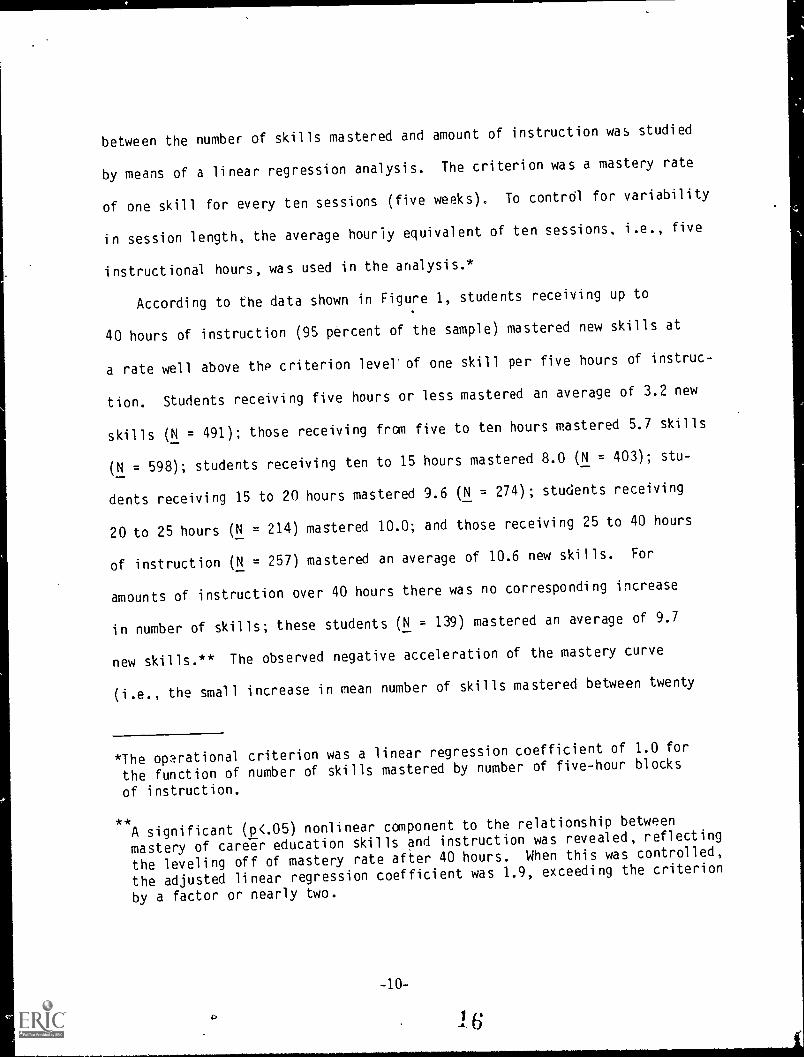
between the number of skills mastered and amount of instruction was studied
by means of a linear regression analysis. The criterion was a mastery rate
of one skill for every ten sessions (five weeks). To contrOl for variability
in session length, the average hourly equivalent of ten sessions, i.e., five
instructional hours, was used in the analysis.*
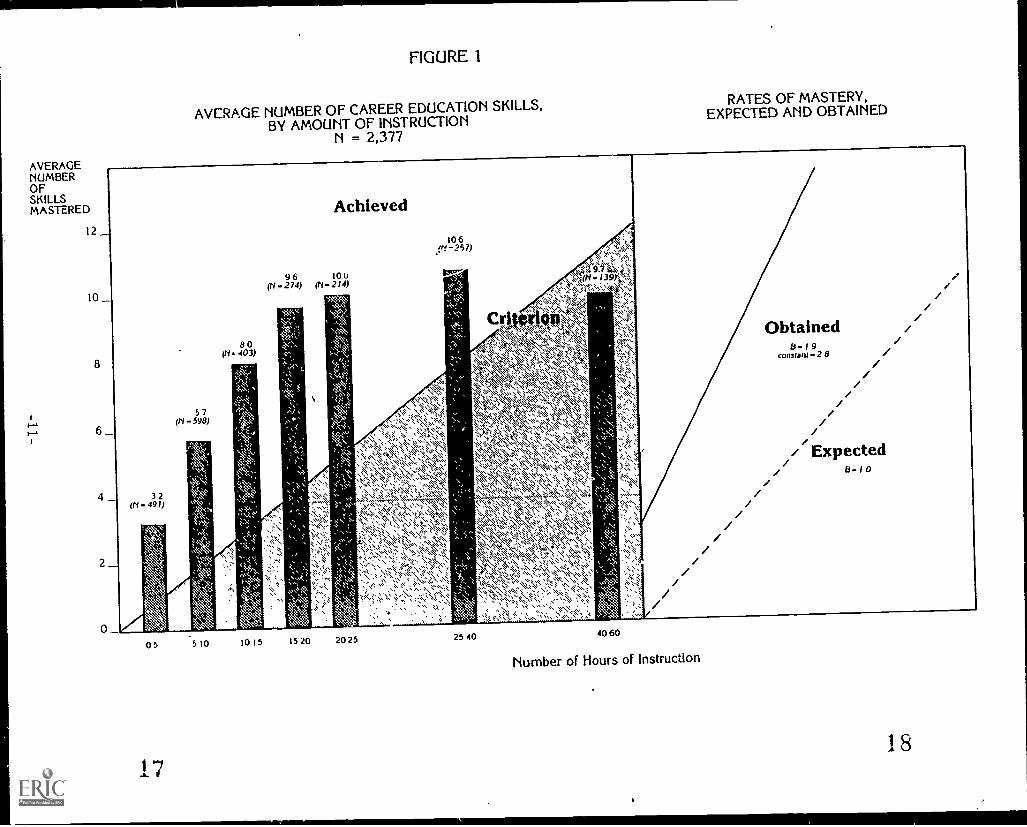
According to the data shown in Figure 1, students receiving up to
40 hours of instruction (95 percent of the sample) mastered new skills at
a rate well above the criterion level'of one skill per five hours of instruc-
tion. Students receiving five hours or less mastered an average of 3.2 new
skills (N = 491); those receiving from five to ten hours mastered 5.7 skills_
(N = 598); students receiving ten to 15 hours mastered 8.0 (N = 403); stu-
dents receiving 15 to 20 hours mastered 9.6 (N = 274); students receiving
20 to 25 hours (N = 214) mastered 10.0; and those receiving 25 to 40 hours
of instruction (N = 257) mastered an average of 10.6 new skills. For_
amounts of instruction over 40 hours there was no corresponding increase
in number of skills; these students (N = 139) mastered an average of 9.7_
new skills.** The observed negative acceleration of the mastery curve
(i.e., the small increase in mean number of skills mastered between twenty
*The oparational criterion was a linear regression coefficient of 1.0 for
the function of number of skills mastered by number of five-hour blocks
of instruction.
**A significant (p<.05) nonlinear component to the relationship between
mastery of career education skills and instruction was revealed, reflecting
the leveling off of mastery rate after 40 hours. When this was controlled,
the adjusted linear regression coefficient was 1.9, exceeding the criterion
by a factor or nearly two.
AVERAGENUMBEROFSKILLSMASTERED
12
10
FIGURE 1
AVERAGE NUMBER OF CAREER EDUCATION SKILLS,BY AMOUNT OF INSTRUCTION
N = 2,377
Achieved
RATES OF MASTERY,EXPECTED AND OBTAINED
10 6257)
9 6 101.,(1'1 - 274) (1'1.. 214)
8 0403)
6 ,
2
5 7(N -598)
3 2(N 491)
0 5 5 10 10 15 15 20 20 25 25 40 40 60
Number of Hours of Instruction
18
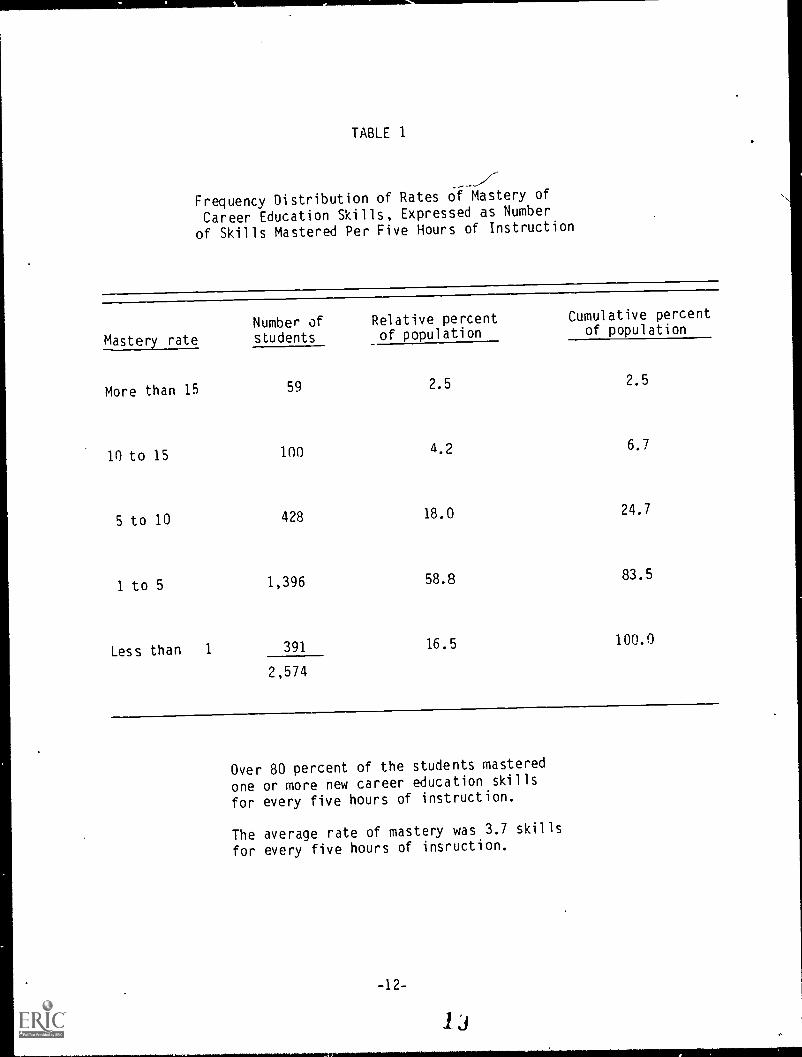
TABLE 1
Frequency Distribution of Rates of Mastery of
Career Education Skills, Expressed as Number
of Skills Mastered Per Five Hours of Instruction
Number of
Mastery rate students
More than 15 59
10 to 15 100
5 to 10 428
1 to 5 1,396
Less than 1 391
2,574
Relative percent Cumulative percent
of population of population
2.5 2.5
4.2 6.7
18.0 24.7
58.8 83.5
16.5 100.0
Over 80 percent of the students mastered
one or more new career education skills
for every five hours of instruction.
The average rate of mastery was 3.7 skills
for every five hours of insruction.
-12-
Li
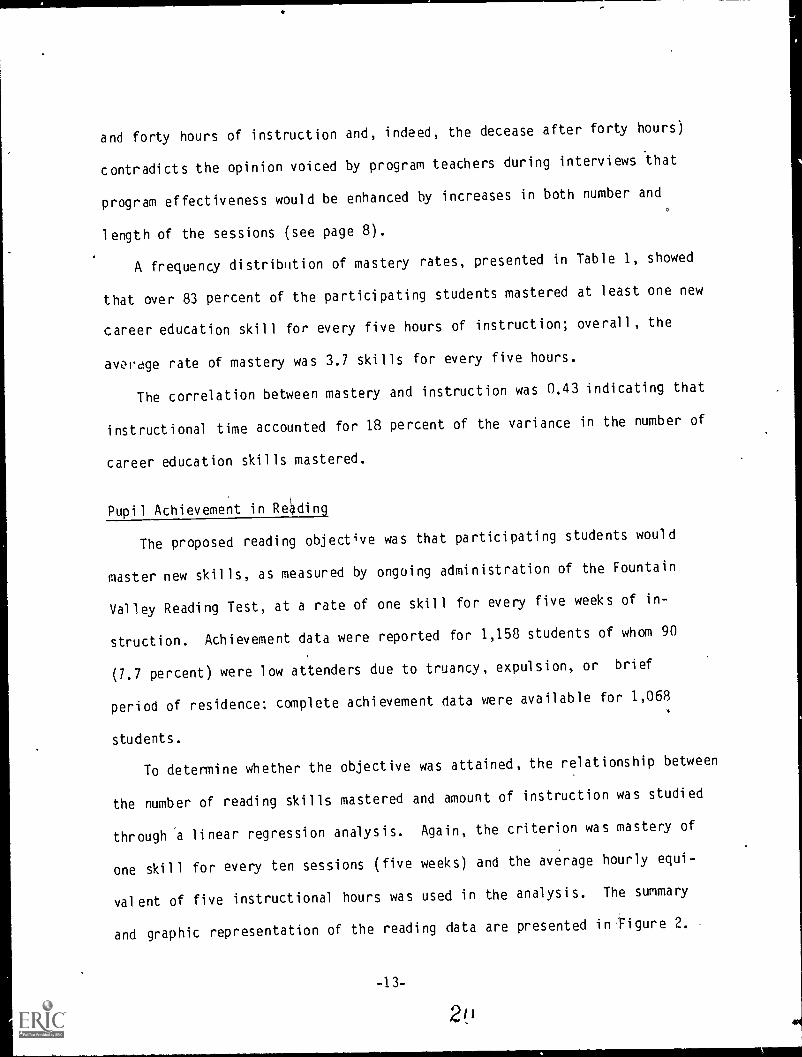
and forty hours of instruction and, indeed, the decease after forty hours)
contradicts the opinion voiced by program teachers during interviews *that
program effectiveness would be enhanced by increases in both number and
length of the sessions (see page 8).
A frequency distribution of mastery rates, presented in Table 1, showed
that over 83 percent of the participating students mastered at least one new
career education skill for every five hours of instruction; overall, the
avo,rdge rate of mastery was 3.7 skills for every five hours.
The correlation between mastery and instruction was 0.43 indicating that
instructional time accounted for 18 percent of the variance in the nmnber of
career education skills mastered.
0
Pupil Achievement in Reading
The proposed reading objective was that participating students would
master new skills, as measured by ongoing administration of the Fountain
Valley Reading Test, at a rate of one skill for every five weeks of in-
struction. Achievement data were reported for 1,158 students of whom 90
(7.7 percent) were low attenders due to truancy, expulsion, or brief
period of residence; complete achievement data were available for 1,0684
students.
To determine whether the objective was attained, the relationship between
the number of reading skills mastered and amount of instruction was studied
through 'a linear regression analysis. Again, the criterion was mastery of
one skill for every ten sessions (five weeks) and the average hourly equi-
valent of five instructional hours was used in the analysis. The summary
and graphic representation of the reading data are presented in 'Figure 2. .
-13-
2!)

AVERAGENUMBEROFSKILLSMASTERED
1 2
0
'V
FIGURE 2
AVERAGE NUMBER OF READING SKILLS,BY AMOUNT OF INSTRUCTION
N = 1,067
RATES OF MASTERY,EXPECTED AND OBTAINED
2 211`1 - 209,
3 5-332)
5 1(N. 184)
Achieved
6 0 5 8(( -123) 8"1 88)
8.1 5constant.. 1.4
0 5
21
5 10 10 15 15 20 20 25 25.10 10 60
Number of Hours of Instruction
Expected8-10
0 9a.
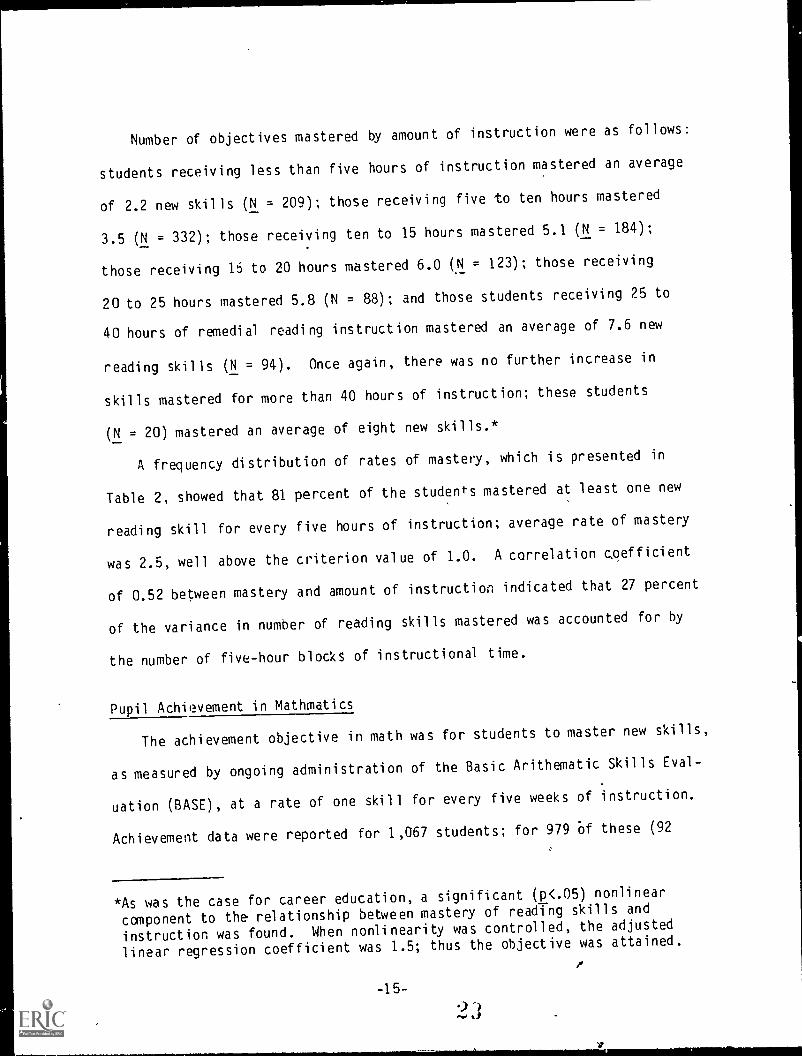
Number of objectives mastered by amount of instruction were as follows:
students receiving less than five hours of instruction mastered an average
of 2.2 new skills (N = 209); those receiving five to ten hours mastered_
3.5 (N = 332); those receiving ten to 15 hours mastered 5.1 (N = 184);
those receiving 15 to 20 hours mastered 6.0 (N = 123); those receiving
20 to 25 hours mastered 5.8 (N = 88); and those students receiving 25 to
40 hours of remedial reading instruction mastered an average of 7.6 new
reading skills (N = 94). Once again, there was no further increase in
skills mastered for more than 40 hours of instruction; these students
(N = 20) mastered an average of eight new skills.*_
A frequency distribution of rates of mastery, which is presented in
Table 2, showed that 81 percent of the students mastered at least one new
reading skill for every five hours of instruction; average rate of mastery
was 2.5, well above the criterion value of 1.0. A correlation coefficient
of 0.52 between mastery and amount of instruction indicated that 27 percent
of the variance in number of reading skills mastered was accounted for by
the number of five-hour blocks of instructional time.
Pupil Achievement in Mathmatics
The achievement objective in math was for students to master new skills,
as measured by ongoing administration of the Basic Arithematic Skills Eval-
uation (BASE), at a rate of one skill for every five weeks of instruction.
Achievement data were reported for 1,067 students; for 979 Of these (92
*As was the case for career education, a significant (p<.05) nonlinear
component to the relationship between mastery of reading skills and
instruction was found. When nonlinearity was controlled, the adjusted
linear regression coefficient was 1.5; thus the objective was attained.
-15-93
1.,
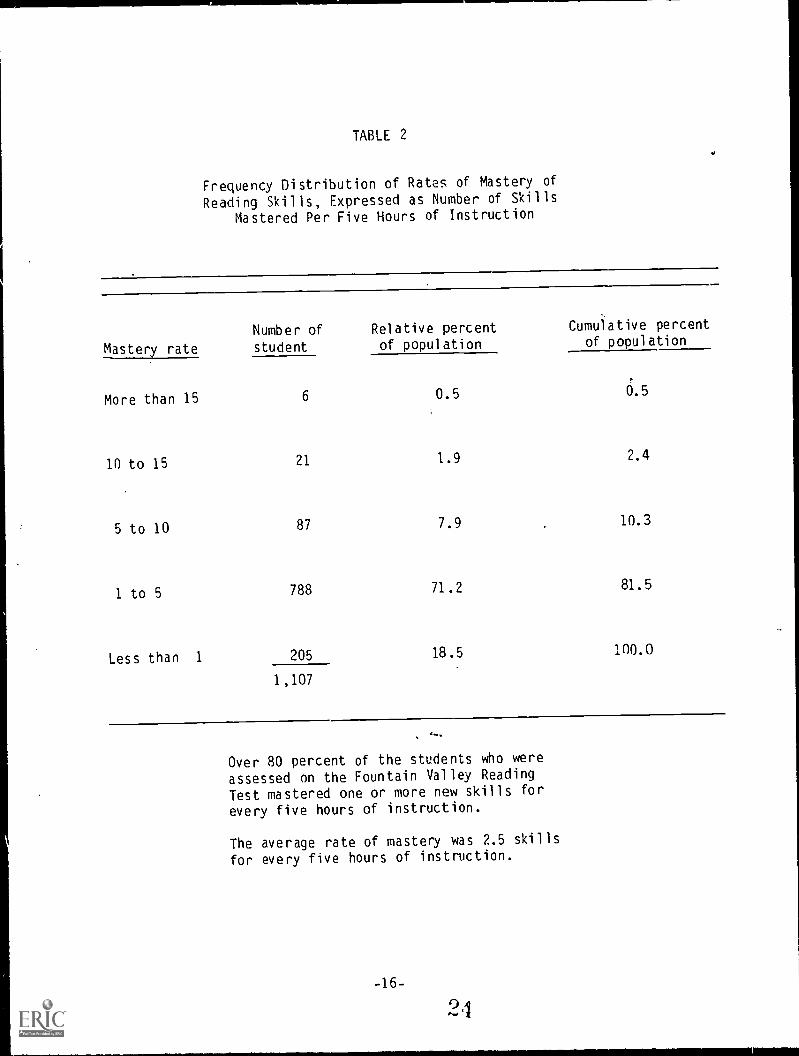
TABLE 2
Frequency Distribution of Rates of Mastery of
Reading Skills, Expressed as Number of Skills
Mastered Per Five Hours of Instruction
,
Number of Relative percent Cumulative percent
Mastery rate student of population of population
6.5More than 15 6 0.5
10 to 15 21 1.9
5 to 10 87 7.9
1 to 5 788 71.2
Less than 1 205 18.5
1,107
2.4
10.3
81.5
100.0
Over 80 percent of the students who were
assessed on the Fountain Valley Reading
Test mastered one or more new skills for
every five hours of instruction.
The average rate of mastery was 2.5 skills
for every five hours of instruction.
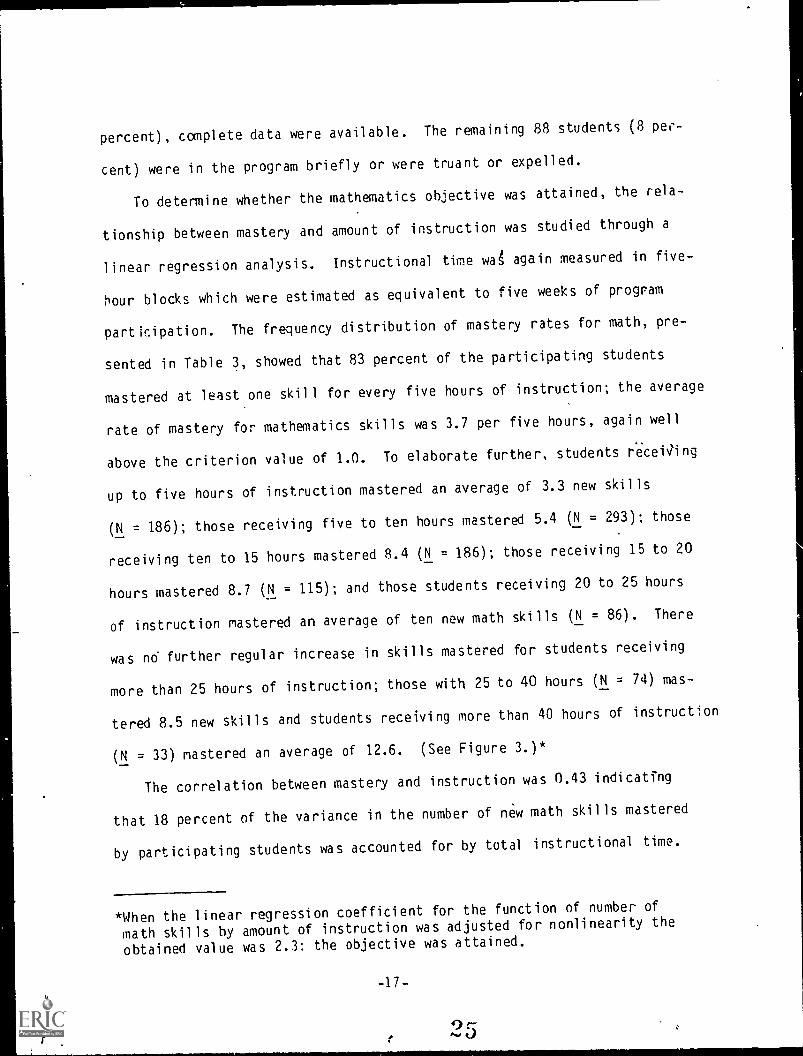
percent), complete data were available. The remaining 88 students (8 per-
cent) were in the program briefly or were truant or expelled.
To determine whether the mathematics objective was attained, the rela-
tionship between mastery and amount of instruction was studied through a
linear regression analysis. Instructional time w,A again measured in five-
hour blocks which were estimated as equivalent to five weeks of program
participation. The frequency distribution of mastery rates for math, pre-
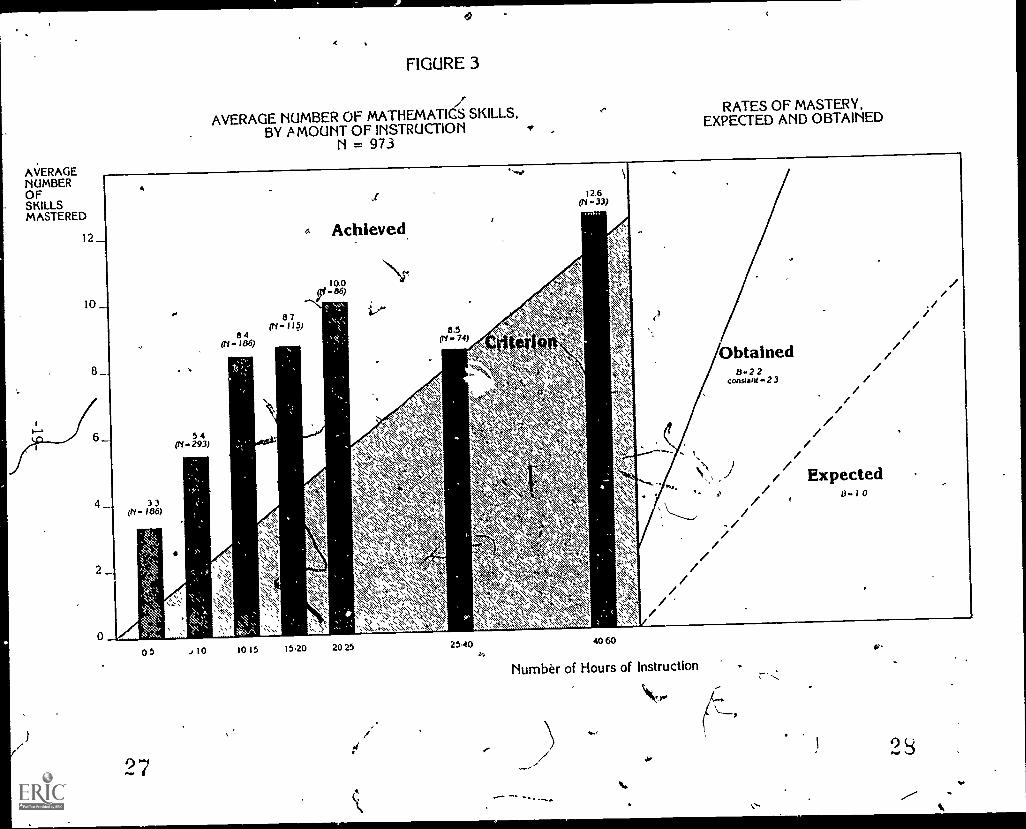
sented in Table 3, showed that 83 percent of the participating students
mastered at least one skill for every five hours of instruction; the average
rate of mastery for mathematics skills was 3.7 per five hours, again well
above the criterion value of 1.0. To elaborate further, students receWing
up to five hours of instruction mastered an average of 3.3 new skills
(N = 186); those receiving five to ten hours mastered 5.4 (N . 293); those
receiving ten to 15 hours mastered 8.4 (N = 186); those receiving 15 to 20
hours mastered 8.7 (N = 115); and those students receiving 20 to 25 hours._
of instruction mastered an average of ten new math skills (N . 86). There
was nd further regular increase in skills mastered for students receiving
more than 25 hours of instruction; those with 25 to 40 hours (N = 74) mas-
tered 8.5 new skills and students receiving more than 40 hours of instruction
(N . 33) mastered an average of 12.6. (See Figure 3.)*
The correlation between mastery and instruction was 0.43 indicating
that 18 percent of the variance in the number of new math skills mastered
by participating students was accounted for by total instructional time.
*When the linear regression coefficient for the function of number of
math skills by amount of instruction was adjusted for nonlinearity the
obtained value was 2.3: the objective was attained.
-17-
r
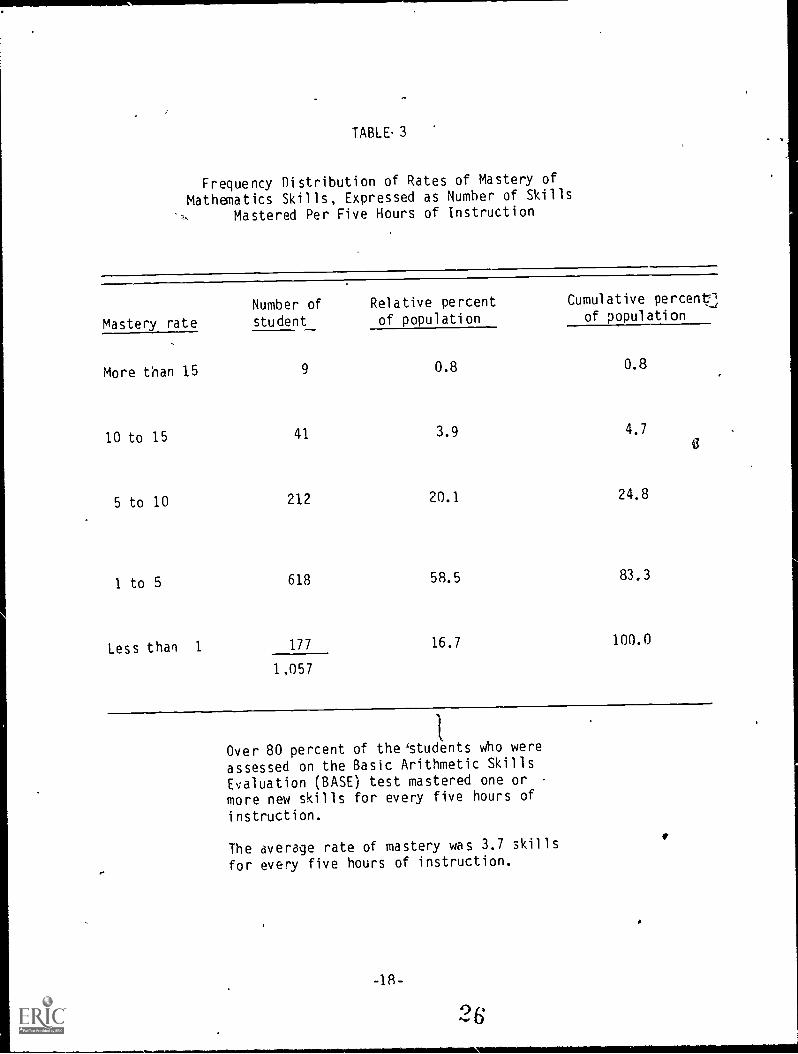
TABLE- 3
Frequency Distribution of Rates of Mastery of
Mathematics Skills, Expressed as Number of Skills
Mastered Per Five Hours of Instruction
Mastery rate
Number of
student
Relative percentof population
Cumulative percentlof population
More than 15 9 0.8 0.8
10 to 15 41 3.9 4.7
5 to 10 212 20.1 24.8
1 to 5 618 58.5 83.3
Less than 1 177 16.7 100.0
1,057
Over 80 percent of the 'students who were
assessed on the Basic Arithmetic Skills
Evaluation (BASE) test mastered one ormore new skills for every five hours of
instruction.
The average rate of mastery was 3.7 skills
for every five hours of instruction.
AVERAGENUMBEROFSKILLSMASTERED
FIGURE 3
AVERAGE NUMBER OF MATHEMATICS SKILLS,BY AMOUNT OF INSTRUCTION
N = 973
RATES OF MASTERY,EXPECTED AND OBTAINED
12 _
A
10_
a_
Achieved,
10.0r.86)
12.6(N .33)
8 7(ti - 115)
4(N.186)
kqs,st
8.5(H. 74)
6_ 5 4(11 293)
4 _
2
3 3(H. 186)
0 5
27
1015 15.20 20 25 2540 4060
Number of Hours of Instruction
\ryo,
J.
Obtained
%
8.2 2constant 2 3
Expected
23

IV. CONCLUSIONS AND RECOMMENDATIONS
The analyses of data from 1981-82 pupil achievement records and program
observations and interviews indicated that, as in previous cycles, the In-
stitutionalized Facilities Program provided effective after-school remedial
instruction to approximately 3,000 children and adolescents residing in
facilities for the delinquent or neglected. Although not strictly comparable
because of the shift in program focus from reading, math, and writing skills
to career education skills, pupil achievement apparentlyjOroved over the
previous cycle as indicated by measures of the relationship between mastery
of new skills and participation in the program. Specifically, during the
1981-82 cycle students mastered new career education skills at an average
rate of 3.6 new skills for every five hours of instruction; for over 83
percent of the.students the mastery rate was at least one skill per five-
hour block. In reading, students mastered an average of 2.5 new skills
for every five hours of instruction; 81 percent showed mastery rates equal
to or greater than one. In mathematics, new skills were mastered at an
average rate of 3.7 per five hours of instruction and 83 percent of the
students showed mastery rates of one or more. In comparison, for the
1980-81 cycle, the pupil achievement criterion of one new skill for every
six weeks of instruction was met by only 65 percent of the student in
reading and 62 percent in math.
Direct comparison of the relationship between instruction and masterye o
for the past and present program cycles provided further evidence for in-
creased effectiveness. Correlation coefficients between mastery and in-
structional time for 1981-82 were 0.43 for career education, C.52 for read-
-20- 93
ing, and 0.43 for math; for the 1980-81 cycle the correlation coefficients
were 0.41 for reading and 0.34 for math. Comparison of these correlation
coefficients through che Fisher r to Z transformation, indicated that the
correlation between reading and instruction was significantly higher in
1981-82 (Z = 2.85, n = 1822, 1-68, p<.01); the correlations for mathematics
did not differ significantly.
Attendance data for the 1981-82 cycle were not as impressive as the pupil
achievement data. Population transience, which was substantial in the pre-
vious cycle, was apparently even more pronounced in the current one. Average
attendance figures for the two semesters of 1980-81 were 28 days in the fall
and 23 days in the spring. In 1981-82 only one full-year attendance figure
for each student was reported; mean attendance was 20 sessions and the median
was 13.
Program teachers reportedly found pupil transience the single most dis-
ruptive factor in providing an effective remedial program. The frequent
student turnover, in combination with uncertainty as to the length.of
residence for any particular student, made the requirements of pre- and
post-testing burdensome and, in many cases, impossible to fulfill. Almost
a.11 teachers favored the emphasis on career education although some felt
it was not appropriate for all students served.
Overall, the program was highly effective in meeting its proposed goals.
However, in light- the diverse and often transient population and also the
change in pr am focus, the following recommendations are offered to further
.--/
imprqve program effectiveness:
Choice of program goals and assessment instruments
should be more flexible. In particular, vocational/
-21-
3i)
occupational skills are not the most appropriate
goals for certain mentally-retarded or very young
children. In such cases, activities of daily living
skills might serve as an effective alternative. i
A program policy needs to be established concerning the
instructional goals and curriculum for transient pupils.
Individual instructional planning ought to consider
probable length of residence.
The testing requirement should be more discretionary.
In sites Where populations are stable, pre- and post-testing presents no problems; in highly transient sites,
however, th2.'s is often impractical. An attempt should
be made to incorporate data retrieval procedures into
ongoing planning and assessment.
More in-service training in occupational/vocational
education should be attempted particularly in selec-
tion and use of curriculum materials.
Increasing the number of program sessions per week
should be considered to offset the effects of pupil
transience.
/)