document resure author title supply and … · supply and demand of public administrators in...
TRANSCRIPT

ED 123 793. .
AUTHORTITLE
DOCUMENT RESURE
El 008 350
Booker,. Clifford P.'Supply and Demand of Public Administrators in "esota. [Revised].
INSTITUTION ,vsota.,Univ.; St. pial; 0.v. of EducationalAd nistration.
PUB DATE 76NOTE 69p.; Published as v9 n1 of Administrative
Leadership; for a related docUment see ED 079 809AVAILABLY, EfOM' D9partment of Educational Administration, University
o! Minnesota, St.-Paul, Minnesota 5510T ($5.00)
ERRS PRICE MP -50.83 BC --S3. SO Plus postage.DESCRIPTORS *Adminidtrativl Personnel; *Administrator
Characteristics; *Administrator Education;*Administrator Qualifications; .Educational,Administration; Elementary SeCondary Education;*Employment Opportunitiep; Higher Education;-JobApplicants; Job Market; Tables (Data)
IDENTIFIERS *Minnesota
ABSTRACTThis is a revision of a 1973 study of the supply and
demand of public school administrators in Minnesota. The revisionincludes more inforiation on women and minorities. offers aprofile of Minnesota dlinistrators, both their personal andprofessional characteristics, with the understanding that.mottadwimistretiwe positions -will be .filled pool; -A secondpool; a "ready reserve" of .administrators,. is made up of persons who.have been trained- in administration but do, not .hold -administrativepositions- This pool is approached through an examination he
output of Minnes tags administrator preparation institutions. ere' was no way of obt *ning data on third pool, administrators fromstates other than innesoia. The data- for the discussion of'demand,was obtained 'from 0 school, superintendents vho feturned a
Auesteionpaire .that a ed them to predict changes in their districtsthat vi-1 affect the d and for administrators during the next five -years. he flenal chapter, conclusions and policy issued, goes beyond ',
the d a to report informed opinion. uthor/IRTy
4,.1-
****V*********4******************* *******************
t', Doctimentb aciitired. by ,ERIC'include *any, infOrmal 4npublished ` *
*-Materialmenot available from other sources. ERIC .makes eveLy effoit *t.to obtain the best copy available. Nevertheless,,items of marginal -. *
,_,41,4 reproducibility are often, encountered and this affects the quality -*of the microfiche and hardcopy reprodudtions 4RiC mates.aiailable *t.
',* via the ERIC Document Reproduction Seririce (BUS). BORS,is not * -
* responsible for the quality of the original document: Reproductions * '.'
t supplied - by ,EDRS are ;the best that can made ffom the original. *************v**************************04*****************4f**********

Administrative LeadershipUNIiiERSITY OF MINNESOTADEF1ARTMENT OF EDUCATIONAL ADMINISTRATIONCOL,LEGE OF EDUCATION
t
11.
ByCLIFFORD R. HOOKER. ProfeasdrUntverstty Minnesota
SPRING. 1 ;6Volume . Number 1
r
N

i.
t. )
The Supply and Demand Of IRabliO School
. Administratots in ..
Minnesota
BYCLIFFORD P. HOOKER, Professor
University of Minnesota.
.
SPRING. 1976Volume IX, Numberi
3..
M
4

z4
Ito ID
'Copyright-c1918tversfly of Minneiota
4
v

PREFACE ,
In 1973, the Department of Educational Administrationpublished a monograph reporting the results of a study of thesupply and demand of public school administrators byProfessor Clifford P. Hooker. It was a time of unusual interestin admrnstrative poSitions and personnel as training repuire-ments were being advanced and state institutions of highereducation were requesting approval to offer this training.Al . the press for equality in training15 and employment byfe ales and minorities was emerging.
nterest in the 1973 Supply and Demand of Public School--Administrators has remained high, both in Minnesota andthroughout -the nation_ Having expausted .the supply of the ___original study, and recognizing that more current data on thetopic would. be helpful, I have _replicated and expanded theearlier study in this 1976 report. The principal feature of thisenlarged edition is the inclusion of much more materialregarding females and minorities. Also, this second study, ofessentially the same variables, permits a longitudinal analy-sis which of coursewas not possible in the, last study. These
,two time-lapse photographs of the administrators, positions,and the training programs give some perspective on trends.However, caution must be exercised in the interpretation ofthese data. The variables are always in transition. The sW.,iof admmistrative personnel and positions is akin to likRiegphotographs from the window of a moving vehicle.- Thelandscape changes the moment the shutter clicks. With thisdeclaimer, and many more which are stated on various pagesof the report, the author feels that this 1976 Supply andDemand of Ptiblic School Administrators in Minnesota in-Oudes information which is both interesting-and useful.
The authors thanks are due to the hundreds of busy, butgracious, educators who responded to the questionnairesand who otherwise' provided counsel and direction as thestudy progressed. I owe thanks also to Dr. Van D. Mueller',Chairperson of the Department of Educational Administra-tion, University of Minnesota, whose encouragement andfrequent inquiries about the progress of the study communi-cated his interest and.support.
.Fikially, I am grateful to Denise Daniel, and Malathi §a-maiah for their, work on the project. They provided theessential, research assistance, typing, editing, and regularmonitoring which made it possible for me to complete thisstudy while I was involved in many ether professional activi- -ties. ..
. Clifford-P.. Kotiker
J . .
/

i 4.! '4'
. .---..,, I s........N, f
4 1 4.Al
1" A B L E-,.01 CONtENTSt CHAPTER PAGE
ONE 'INTRODUCTION 1
TWO A 1975 PROFILE OF MINNESOTA SCHOOLADMINISTRATORS 5
Personal Characteristics . 5 .
Age 6
Sex ,8
Age and SdxRace .
.12
Teri urd71 Prasent-Postron . 15.
Administrative ExperienceBefore Moving to Minnesota
Ageto Retire21
-g44\ProfessionalCharacteristics
f
DegreesHeld.by MinnesotaAdministrators .. 111InstitutiOn Granting PlighestDegree. . 31
Credits Earned Above HigheatDegree. . . 34'. .
Expiration Date of, Admipistrative'Cililificatd. 34 ;Profiles of Typical Incumbents , . '. 4. *-
..
. -...,,, -4-.
.. , ..THREE OUTPUTS OF PREPARING INSTITVIIONS. .. .. 37
..i....
State.Control of AdmtnistratorPfeparaftA. ,',. .,,p7 '1
Graduate Degrees in Educational, 4 .,_.. 12,.
Administration --- , ;46' lit ., Ali
Sex of Graduates , ..*'.'71. 1- - .- 42i
Race of Graduates . , - ..: .7. .. 4:_:, ,..* 00. .
Positions Held by Graduates ,.. ..,.:.i . . 4tThe boctor's DegreetiniversityOrMirmegaa 54'
' .FOUR FUTURE DEMAND FOR SCHOOL; '
ADMINISTRATORS IN MINNESOTAt '-.. . . :I; -
FIVE CONCLUSIONS AND POLICY IMPLIGATIbNS, .55
Training Capabilities of Minnesota Iristitutions.; 55
Future Directions

7AArk
LIST of ABLESNUMBER PAGE
1 Age of Minnesota I miniStrators 7
2 Sex of Minnesota Scho dministrators .. 9
3 Age and Sex of Min a School Administrators 11
4 Race of Minnesota School Administrators 13
5 Race and Sex of Minnesota School Administrators 14
6 Tenure in Present Position 16
7 Tenure in Present Position According-to Sex 17
8 Years of Employment in Present School-Dtstrict..________ 17______1
-.9._ Sizl' of ,Ditrict. . . ...ham. \ , . . -.. 19
10 Size'of District According to Sex of Administrators 20
11 A ---dministrativeExperience in Another State--, , r22
12 Adminislrative Experience of Female and MaierAdministratomBefore Coming to Minnesota \ 23
'13 Age Expecting to Retire 25
14 Age Female and Male Administraforsi,UpecttoRetire
15 ,,Highest arned Degree
16 Highes arped Degree by Female .andMale dministrators
17 listobtson Granting Highest Degree
18 Institution Granting Highest Degree According toSex of Administrators . .. 33:".
. .
19 Credits Ea ' Above Highest Degree Accordihg toSex of Ad trators . ... .. ..... .. . 85
. ...
20 Expiration Date df Administrative Certificate by Sex. 35
21 Instittitions Prepaiing School Administratorsin. Minnesota .. . . ...... 39
22 Educational Admini§tratiohGraduates From#Minnesota
State Universities, UMD, and St. Thomas During thePast Five Yeats.. .. . 41
26
29
30
32
0

23 University of Minnesota (Twin Cities Campus)Graduates with Majors in Educational Administration
° During the Past Five Years,. , . . . . 41
24 Educational Administration Graduates From MinnesotaState UniverWies, UMD, St. Thomas and TheUniversity (TWin Cities Campus)During the Past Five Years. . . 43
25 Sex of Graduates with'Majors in EducationalAdminiatration During Past Five Years FromState Univeriities, UMD, and St. Thomas ..... .. 43
26 Sdx of Graduates From The University of Minnesota -
(Twin Cities Campus) with Majors inEducational Administration in Past Five Years. . 45
. _
27 . tv1inoriV Students Completing Giaduate Degrees wthMajors in Educational Administration From StateUniversities, UM 7, and St. Thomas During the -
Past Five Years... ... . . .. . 45
28 MinorityStudents Completing Graduate Degrees withMajors in Educational Administration From tieUniversity Of Minnesota (TWin CitiesCampus),in Past Five Years 46
-tr29
I
''Positions Now Held By Educational AdministrationMajors Who 1-01W.Graduat.AFrom Minnesota StateUniversitieS,UM1D, and'Sf..111111tonas During thePast Three Years.. ... . ... . 47
30 Positions Now Held by Graduatqs From The University ofMinnesota (Twin Cities elrnpus) with Majors inEducational Administration, During thePast Three Years. 48
31 Positions Now Held By Education& AdministrationMajors Who Graduated From Minnesota StateUniversities, UMD, St. Thomas and The Universityof Minnesota (Twin Cities Campus)During the Past Three Years 49
32 Positions Now Held By Persons Completing Ph.D. andEd.D. Degrees In Educational Administration atThe University of Minnesota 51
33. 'Number of Administrators Presently Employed andProjected Needs as/Reported by 430 MinnesotaSuperintendents 53
34., Sex and Ricebf Fay in The Departments of_EclucationatAdmi istration in Minnesota Preparing
Institutions, Fall 1975 5
8

CHAPTER ONE
INTRODUCTIONBoth the availability of and demand for trained leadership
for the public schools are elastic and somewhat illusiveconcepts. They tend to contract or expand according tocertain properties and laws which are not, thoroughly-Lin er-stood nor predictable. Investigations in this field, thelack tie sophistication and rigor which are n. Ily assoch
---ated with scientific research. The abi'enc: controls and themappropriateness of the -expeitnie _method strip the in--vestigator of the tools needed for more ork.
Given this state of the art, in personnel forecasting,researcher. like the meteorologist, must create new ways ofexamining the evidence. For instance,.the meteorologist hasdiscovered that a series of photographs of clouds taken frCirna satellite over an extended period Otime'reveal informationwhich is useful' in predicting the weather. -The time lapsebetween photographsis. critical. Similarity, this study of the-supply and demand of school administrators in Minnesota isthe Second in a series which is designed to, provide animportant service to educators and policy makeis rn Minne-sOta. The first study was published int 973, using data whichwere ollected inj1 -72. The base -line data of the previousstudre Cited frequently in this volume:',
Continuing the analogy between the meteorologist anti thepersonnel researcher in educational administration, both areat their best when the area of interest is relativIly large. Forexample, the meteorologist can predict the wgt ther for theRocky Mountains with areat accuracy. However, predictingthe weather for Salt Lake City or even the Stan of Utah ismuch more difficult. Sithilarily, the .supply and demand ofschool administrators in the nation* can -be measured and
projected with spme degree of certainty. But how about the

rsupply of School adnyhistrators and the number of availablepositions in Minnescha? The trained talent, like the clouds,float across state lines..Also, the fot'oe,,s which expand andcontract the supply and demand are illusive and sometimesnefarious.
The supply of individualt tQ n feplacement needS andfill new positions can be identified with three basic- sources.First, there are the indumbenr administrators in the state.
While these people clearly are not a part of a "trainedresenie," they fltai likely tQ fill most of the adminis-
trative position r manyyeaes. Therefore a rather carefullook at these ptople provides a mosaic of Minnesota schooladministrators for the. next several_ years. The results of aquestionnaire study of these administrators 'are reported-----the next chapter of this monograph.
A second source of supply is truly "ready reserve" ineducational administration. The persons in this roup, mostof whom are classroom teachers, are fully treed nd waiting.
. loran opportunity 'to be administrators. Thilgro , howeve
is suprisingly difficult to locai. Records in the State Dep t-
meht oft Education simply fall to reveal in an uncontamin edfashion the content of graduate prograins which are pur uecl
by teachers. Moreover, most candidates for aaminis ative, credentials do not apply for a certificate until they are ctively '
seeking a position. This search foran administrative position
,maybeattractsthat theFinally, sorational adadministratwhich imprteachers.
These problems notwithstanding, it was necessary toget ,
some infornition about the recent' graduates of educationaladministration prograntis, The most available source of infor-mation was the institutionfs'whiCh award graduate degreei.
ed if the incentive for administration is o. Then, too, many eduCators are "place-bound" inwill not move to accept, administrative positions. .
teachers complete graduate programs in eau-inistration with no intention of becoming an
r. They simply collect available graduate creditsye therr standing on the local/galary schedule fjr
2 /

The results of this contact with the admini trator preparationinstitutions ire reported in ChaPter Three.
The final source of administrators for Minnesota scrhools iseven more nebulous than the groups desoribed earlier. Thisis thetnass of trained talept from neighboring states which isattracted by the pay scales and working conditions in Minne-sota schools.' For example, the- list of applicants for everymaj6r superintendency in Minnesota always includes morenon-residents than residents.
Finding no way to measure the potentiarsupply -of adminis-trators who are now employed outside the state, this sourceof supply is not treated further in this report. However, thedata,in several tab! es show that a large number of administre- '
tors' move9 to -Minnesotalro-m-strintar -positions-in other.
states. Also, the data point out that over one-third of theMinnesota school admmistrators completed their highestdegree from an institution outside the state. Conversely, thedata -fail to reveal an exodu,,olik"mesota residents toetraining,or poSitions in other states.
The demand side-of the personnel equation daddressed inChapter Four:The data for this portion of the study wereobtained from 430 school superintendents who returned thequestionnaire. These superintendents were asked to predict
hanges,iriPtheif-districts 'whic Will affect the, demand/foradmmistrators during the ne five years. Again, there areuncertainties in ,the data r-b t rid-better soave of data is
, available. Hopefully, local s hoot superintentlints can makefive year 'projections of their needs for administrative per-
.sonnet.
Chapter Five includes comments about the present supplyand future, needs for administrators, There is a tendency inthe final chapter to go beyond the data to rePort informedopinion,,,whiCh may' aid Minnesota policy Makers in the
°reallocation of s. rce.resources fOr the traiiifig of schooladnunistotors.
The 'status females and Minorities in administrativepositions is ed ratherextensively in is docunient. The'
.3 /

rlimited cussi4 of this topic in the 1973 report attractedcons erable attgtntion, leading to the belief that a morefn- epth investigation fvould be useful While it is dangerous
o o draw conclusions about trends from but two reference'points, there is sufficient evidence in this study and theprevious one to alert pitilicy makers to emp4yment practices
- which° are counter to1
ntemporary rhetoric on this subject.,....2_&tatetr___--
candidly, the ational press to extend eq4a1 employ-ment opportunit to under-represented groups, such as.females and, morales, seems to have escaped the pyblicgelvdts-l-ryMinnesota. This is especially true with,respect to
positions which command high salaries and exercise'power over-the Aystern.
s
12'4
41,
I.
ti

HAPTER
75,P OFIL F MINNESOTASCHOO AD INISTRATORS
It may be trite to p t t that the future supply of school.dministrators is largely a reflection of the current scene.
of the incumbent Administrators will continue in theirresent positions for many years and others will apply forattractive admingtrative positionsli Minnesota as they
become vacant Therefore, it is logical to begin this `as--sessment- of-Pe supplyofischoot-admmistrators with-a-soined."
.. what detailed look at the persohs who now hold.the adminis- .. ' trative posts in th public scboofe. . . '
The personal ancfprofessionalcharactenstics of Minneso-ta school administrators are .described in this c m apter. Thedata were obtained from questionpaireswhich , e.retumed
v ....kby 2686, or spout 80fiereent, of the persons . /rig pbsitionfor Which administrative certification is required. Included inthe data are.the responses of -40, (99.percent) of the schoolIiipeiintendents in the state. Tke,teri superintendents failingto respond are employed in sChooldistricts enrolling' lessthan one percent of the cludents. The principals who did ndt
retu questionnaires are scattered randomly around the
. PERSONAL CHARACTERISTICSAdminisfratOrs were. askt3d to provide the lather usual and-
mundane information about themselves, thea' positions and-che school districts which employ them. The items of interest .
inoluded age. sex, race, certification, Manure in present post- ,. bon; ed9cational ttackgroondi numlier of dents in, the
district, and retirement bia..-n0,fie ar reported in - .
iseries of tAbles which follow. lit "Host instancesipe tables -
shier a comparison between female and male administrators.. Certainly one item of interest here is lhe.starus of women in
school administration in Minnessota. 4.
13-

AGE
The ape of Minnesota school administrators is reported in
Table 1. The results here are strikingly similar to .those
'reported three years earlier. Both,studies show that superin-
Ahirents and other antral -office-adintrustfators-ereserne'what older than the'principals and assistant principals;Also,
it is appareht once more that the administrators are a mature
lot h a media'n age between 41" and 45. Again, there are
!nor superintendents over 60 than under 30.Pnesuperinten-
,de out of six is over.60 Years of age. .
The uncertainty surrounding peresonnel prediction§sin edu-
- cation was emphaSized in the 073 study and repeated in
IChapter One of this volume. The combination of events since
1973 illUstrates the point. The Mkiesota Legislature grettlf '
increased retirement benefits for educators in 1973, dausing
some obseivprs to believe that administrators witrid choose
to "retire early. Indeed, a few administrators did respohd in
this manner,. However, the attractiveness of the increased,
retirement benefits for the most senior administrators. was
dulled by-the realities Of 'double-digit inflationlin` the. mid
11:970's. lt appears now that the improved 1973 retirement plan
providedlitthe. real incentive for earlyritirement. ,
od
'146

40P
. Position ,
TABLE 1
AGE OF MINNESOTA SCHOOL ADMINISTRAT?RS
SUPERINTENDENT
ASSISTANT; ASSOCIATE &DEPUTY SUPERINTENDENT
ADMINISTRATIVEASSISTANT
DIRECTOR
SECONDARY PRINCIPAL,
ASSISTANT SECONDARYPRINCIPAL
ELEMENTARY PRINCIPAL
ASSISTANT ELEMENTARY
4
PRINCIPAL
OTHER
TOTAL
\ 2
Under .26: - 31, 361 41- 46- 51- 56- `Over Total
25. 30 35 - 40 45 :50- 55 . 60 60
, 4 20 61 . 50 96 , 91 54 ,51 4 i= .
0, 2 9 14 15't 22- ,. 16 6 ; ,87
.0 = 3 6 .19 14 It,: 6 :3 6 68
.. -1 4 8 26 42. 29 23 15 8 156
0 33; 94 140 124 117 :75 43 28 $54, .
0 19 66 61' 59 56 24 9 4 297
, . . ' .
,
3i 46. 156 iel, 166 127 85 58- -43 847
0 1 : 4 2 1 1 1' 1 1A-.1, 6.k. ?lik 22 25'. ...*. 11 . 9 I 132.--"
8. 121 3 566 #02 "'144 332 198 449 , 2486
1P116.4.1";50.
g

SEX$
Possidly_the strongest language in the 1973 study was' usedto report the shocking under-representation of women in
4 management positions in education in Minriesotd. The obsere-
--vatic:to-was made:
The extinction of the female species among admitiistra-tors is so nearly complete that only increases in the numberof women In school administration would be worthy, of noteby future investigators."
'Regrettably. to follow the advice given, in the 1973 studywould leave nothing "worthy of note" in this report. The
i. number'of women in school administrative positions in Min-nesota declined from 202 in 197310 181 in 1975. Virtually all ofthe deditrie occurred in the elementary school principalshipwhere the earlier figure was 157 and as shown in Table 2, 134in 1975. Three females were hoping positions as secondaryschocti principals when each study was made. Only onefemale has gained membership in the "white male .club-which dominates the school superintendency in Minnesota..
. Women hold but 6.6 percent of all.administrative posts fn the-public schools of Minnesota, but they account for more than50 percentdf the teaching positions. These facts raise a lot ofserious questions. especially -about the effectiveness of af-iirmative action programs in the public schools of Minnesota.
1_
V
16e

POsition
TABLE 2SEX OF MI ESO A SCHOOL ADM NISpATORS
\
SUPERINTENDENT
AS TANT. ASSOCIATE & DEPUTYS ERINTENDENT
ADM I TR/),TIVE ASSISTANT
DIRECTOR
SECONDARY PRINCIPAL
ASSISTANT SECONDARY PRINCIPAL
ELEMENTARY PRINCIPAL
ASSISTANT ELEMENTARY PRINCIPAL
OTHER
-TOTAL
Female Malea Total
No. No.
1 .4
2 }2.8
0 0.
9 5.8 -
3 .5
8
134 15.8
5 ,33.3
429 99.6
97.2
68 100.
147 94
651 .5-419 97.3
3 84.2
10 66.7 15
19 113 85.6.
181 , 100.0, 2505 100.0
4
11

f
-.. I
AGE AND SEX
"'"
. _ .. .
The data in the first two tables have been combined inTable 3 to show the interaction between the variables of ageand sex. Since this analysis was not made in the earlier study,-no comparison of results Js. ossible.
ltThe message.in Tables nd 3 is clear; unequivocal, andconsistent. Men predominate at all ranks in school admmis-tratiouland they are younger than their femald-colleagues.Table 3 shows a median age between 51 and 55 for womenand 41 and 45 for men. This is espeCially significant when it isrecognized that all but one of the 430 superintendents arementhe positron which is normally held by the most seniorpersons in school administration. Also, since 'so few womerxhave eYer been high school principals, the conclusion one .must draw is that men are replaCing women as they retirefrom the elarnesntary school principal position. If this practicecontinues pnabated the next investigator will have little
--- reason to partition the data<iccording to sex, Men Will hold all
.ortfie aiiministrative poSitions..
r. -,
...
I
-,--'..0
:r"
.r
,
I
1

-
" "'"-
f
TABLE,3< AGE-AND SEX OF ,.---
MINNESOTA SCHOOL ADMINISTRATORS
t
Age , -I
I Female Maie T
/ No. % No. %
UNDER 25 0 0. 8 .3 .8
26-30 8 . 4.4 '110 4.5 118Ale
31-35 11. 6.0 372 14.9 383
36-40 6 8.8 k- 488 19.6 504-
.41-45 /t. 25 13.7 480 19.1 505
46-50 26 14.3 462 18.4 ,488
51:55 31 17.0 305 12.1 336
56-60 34 18.8 164 6.5 , 198 iOVER 60 30 17.0 116 4.6 146 .TOTAL 181' 100.0 2505 100.0 2686
r
19
-
11

-as
RACE
The race of Minnesota school, administrators is shown in,Table 4. Again, comparisons with the earlier study are impos-sible because this question was not asked in 1973.
Educators_ and laymen may find little new information inTable 4. Everyone knows that almost all of the school admin-istrators are white. In fact, 98 percent of such positions areheld by whites in Minnesota, The number of Blacks, AmericanIndians, and Chicanos holtling administrative positions is farbelow what one would expect from the population character-istics of this state. The single surprise in Table 4 is that 17principals reported their race as "other." Gi n the choicesin this question, it is hard to believe that 17 of hem would findit necessary to respond in this rnannec. It "Coul e that mostof these 17 principals confused ethnicity with race.
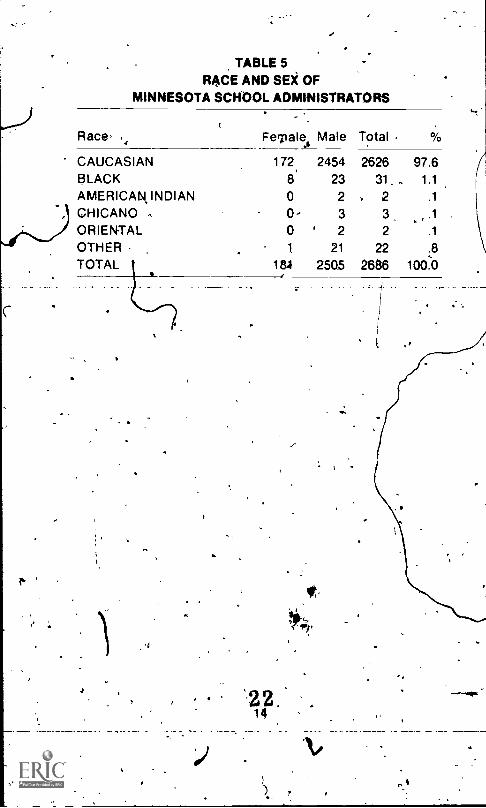
Many of the facts reported in earlierrbles are repeated inTable 5. The predqminance of white males is obvious oncemore. There is one observation about Black administratorswhich is worth reporting, hoWever. While the numbers aresmall, and conclusions are therefore dangerous, it 'doesappear that Black females represent about one in for of allBlack administrators. 'White females are outnumbere six-teen to one by white males.
12
20

41.
V
STABLE 4RACE OF MINNESOTA SCHOOL ADMINISTRATORS
Position Caucasian Black American ChicanoIndian
Other
SUPERINTENDENT 43b 0 0 0 0
ASSISTANT, ASSOCIATE & DEPUTY 82 4 0 0 1'
SUPERINTENDENT
ADMINISTRATIVE ASSISTANT .... 68 0 0 . 0 0
DIRECTOR..,
153 0 2 -0
G) SECONDARY PRINCIPAL 642 7 ,0 0* 5
ASSISTANT SECONDARY PRINCIPAL 283.--,
11, 2 0 1 .
ELEMENTARY PRINCIPAL 829 5 0 1 12
ASSISTANT ELEMENTARY PRINCIPAL 14 1 , 0 ,A ' 0 0.
OTHER
...
127 2 . V0. 0 3
TS,l'AL 2628 31 . 2. 3 22
p
114
-
TABLE 5RACE AND SEX OF
MINNESOTA SCHOOL ADMINISTRATORS
Race= .4
CAUCASIANBLACKAMERICAN INDIANCHICANO ,ORIENTALOTHERTOTAL t
4
172 2454 2626 97.68 23 31.... 1.1
0 2 . 2 .1
0- 3 3 .1
0 ' 2 2 .1
1 21 22 818.1 2505 2686 100.0
Ferpale1 Male Total 07'0
,
. . 22.14
t,

TENURE IN PRESENT POSITION
The nomadic chdracteristic of Minnesota school adminis-
trators is revealed in Table 6., They appear to be searchingconstantly for greener pastures. Almost one-half of them have
been in their positions for five years or less and three.out of
four have moved in the past decade. These data _put to rest
the ster otype of a school administrator as a "permanentfixture." a person on terwre and long term in office. Also,explod d here is the myth that lack of rn-over and declining
, school-enrollments preclude the empl yment of females andminorities in school leadership position
As in 1973, the elementary principals seem to persist thelongest in their, positions. This may be true because of the
limited, opporturiities for advancement from this position,
especially for the females. As employment and promotion
-practices exist presently in Minnesota, the probability okafemale elementary school principal being promoted to super-. -intendent-of sch5iols. for instance, is zero. .
The tenure of Minnesota school administrator y sex isshown in Table 7. Either by choice or becaus of lack ofopportunities for promotion, the females tend .to remain intheir present position longer than men. A full 30 percent of the
females have been in their present position for 16 years orlonger. The comparable.figurefor the males is 18.9 percent:
The lack of mobility for female educato?s is shown once 'more in Table 8. Nearlir7,55 percent have worked in theirpresent district for 16 yeats atmore, whereas', just over 27
percent of the men fall in this c4tegory.
2315

TABLE 6TENURE IN PRESENT POSITION
'Position 0- 11- 16- ' 21- Over Total'
5 10 15 20 .25 30 .SUPERINTENDENT 186 140 ' 45 38 '15,
I..-^
ASSISTANT, ASSOCIATE 54 22 3. 2 3& DEPUTY SUPERINTENDENT
ADMINISTRATIVE 44 15 3 2 . 2ASSISTANT
.-a)1' . DIRECTOR 66 56 19 10 3
SECONDARY PRINCIPAL 328 174 64 48' ,' . 25
ASSISTANT SECONDARY 180 81 24 9 3,--.- 'PRINCIPAL
ELEMENTARY PRINCIPAL 288 260 129 92 59
6 1
1
/ .
430
87/
2 082 0 '156
7 B 654
0 0 297-
14 847
ASSISTAN,T,ELEMENTAAY 9 2 2 . .' 2 , 0 9/PRINCIPAI,
.
..
OTHER .
I,.
. T4 . 40 10 ., 5 1 1
OEFILLENT -45:6 -29;5- 11'.-1` 4:0-- ---1.3--
. 15

TABLE 7TENURE IN PRESS, T POSITION ACCORDING TO SEX
'0/6(Tenure male Male .Total
Nb. No % No. %
0-5v
,67 36.9 1043 42.0 1110 41.5
6-10 35 18.9 723 28.9 758 28.2
11-15 27 15.0 258 10.2 283 , 10,5
1,8 -20 24 114 174 6:9 1.98 7.4
21-25 19 10.6 90' 3.6 109 4.0
26-30 5 2.8 209 8.3 214 7.9
OVER 30 4 2.4, 10 .1 '14 .5
TOTAL - 181 -100.-0 2505 100.0 2686 100:0
TABLE 8YEARS OF EMPLOYMENT IN PRESENT
SCHOOL DISTRICT
Years Female,. Male Total
'No.. % No. °A, No. %
0-5 , 36 20.0 790 , 31.6 826, 30.8
6-10 19 10.41--:638 25.6 657 24.5
-1-5 27 - 14.8 ., 386 15.4 411 15.4,
16- 36 20.0 335 -13.3 371 13.8
21-25 35 19.5 237 9,5 272 10.1
26-30 15 8.2 94 3.7 109 4.0
OVER 30 1 .1 25 1.0 .38 ,1.4TOTAL 181 100.0 2505 ,. 100.0 2686 .1e0.0
Iw
a i
SIZE OF SCHQOt'DI$TRICT
The 'relationship between administrative staffing and thesize of the student enrollment is shown in Table'90ince eachschool distil has one superintendent, regardless the'number pf' tudents enrolled, the row reporting, the distribu-tion osu enntendents can be use a proxy for distract84ZO, in -Mt hesota. Cki-r-sory-,exenurration- of these -figures-reveals that over one-half of the superintendents are ern-
ployed'indis tots enrolling under 'MOO students. AkcCorctingto most on is on the subject; the istricts are very small.-The 'profile -of employrhOt, or sec ndary principalshs
,slightly different from that of suplerin ndents. All distriCtshave at least one high school t larger odes may have'Several. This accounts for th shifting of the median, todOtricts'enroVg up to 2000 s clent§.-
The "typical' ,elementary s hop p ncipal Works* an evenlarger4School district. Abol 50 ercent of the elementaryschool.princips are foun digtricta enrolling Tier, 4000students.
The embloyment patte, for school administrators is ana-lyzed further in Table 10. The dkstribution of female adminis-trators by district size is. esOecially interesting. Over 41percentof them are ernployedlym the smallest diStricts of thestate, but the largest-districts account for another 22 percent .
of the female administrators: The districtsenrafling'between, 1000 and 204:100 are most hesitant to employ female ad'mitnis-.
trdtors, Inclikled in this group are all tut a few of thesuburban districts in the Twin Cities metropolitan area.
e
18 -,_ -**

9 .S ZE OF DISTRICT _S
I
osition Under 1000 2001 poo 11000 200b 3000 4000
4001" 5001 7001 10,001 Over Total6000 7000 10,000 20,000 20,000
0
. s . .
.S111ENDENT 239 , 84 . 321 k 15 15 17 ,.11.. :14 5 430 '...
;., ASSISTANT, ASSOCIATE & 5 6 t. 16 :.9 8.R 20 .21 8e7
DEPUTY SUPERINTENDENTI
a
. -
ADMINISTRATIVE ASSISTANT: 4
DIRECTOR ..0
SECONDARY PRINCIPAL
'ASSISTANT SECONDARYPRINCIPAL
35
7
ELEMENTARY PRINCIPAL 225
r ASSISTANT ELEMENTARYPRINCIPAL 4
1,
QTHER . 9
TOTAL . .721
*
t 13 9 .; 7' 0 10 12 8 68,. t.,.
7 7' 8' 7 15. , 2 34 49 156....
103 IF - 31 '36 t .37 41 , 87' 654
:38 20 23, 11. 23 33 43' 99 297 ..
'-.. .. i ..
83 71 51 31
3 1 0
.18 29 '4 5
.354 228 152 -. 106,
69 66 96 155 847
0 0 -2 6 .15
6
185
4 '
.4 : 22 38 132
193 284 463 2.686
. .

1
SIZE OF DISTRItTOF ADMI
TABLERDING TO SEXTbRS.
No of StudentSIn District
Female - Male TotalAlp
N,o % No. % No. %
UNDER 1000 75 41.4 675 26.8 721 26.8
1000-2000 10 - 5.5 356 14.5 354 13.3
2001-3000 7 3.9, 230 9.2 228 8.4
3001-4000 7 3-.9 145 5.7 152 5.7
4001-5000 2 1.1 94 3.7 J06 3.9
5001-7000 - 4 2.2 183 7.3 ;185 6.9
7001-10,000 10 5.5 173 6.9 193 7.1
10,060-20,000, 18- = 10.0 267 10:i 284 102OVER 20,000 48 26.5 q8-2 --, 15.2 463 '17.2TOTAL 181 - 100.0 2505 10b-.41 2666 100.0
..1
O
A ye.

,
.
ADMINISTRATIVE EXPERIENCE BEFORE, MOVING TO MINNESOTA
6.
As ynentioned earlier. it is difficult to' isolate the s6p'ply ofadministrators for a single state. School ddministrOlors are a
_rather mobile group. They do not hesitate to move acrossstate lines to achieve a professional advancement. CertainlY-the reputation of Minnesota schools and the a ve averagesalaries paid to administrators attract the a ention ,cap-able and ambitiou; administrators in many s tes.
The extent to which school administrator have migrated toItlinrresofa is shown in Table 11. As a group, over 18 percentof ,the Aumbent administrators began their careers in other
------stittek--Holiiever.- the figure ---for school superintertdents-is-a-Mast dauDle this amount. The elementary prinCipals are themost parochialif) --the major groups of administrators, withsomething like 90 percent Of them_having no experience inanother state,
. The administrators who did migrate to Minnesota were _relatively young when they made the move. More than ohalf 6f them Were under 35 years of age. This is somewhatbelow the median age of all incumbents which is between 41and 45, (See Table 1)
Again, the data were partitioned according to sex. Thearesults are shown in Table'12.,Clearly, the female administrfor is more likely to be a product of Minnesota. Onlypercerit,i;if them have had administrative experience in other
The figure for the mates is 19.5 percent. It seems thatfemales ei o not seek:employment outside their home
-.State: or emplo o61 boards in Minnesota are less'frictined "to take a cha on a female than a Mali froManother state.
. '."..
:2921

40-
,
__TABLE 11
ADMINISTRATIVE'EXPERIENCEIN ANOTHER STATE
Position , N Yes Age)
56-
-Total
60Under
35
36-40
41-45
46-50
51-55
Nn,
SUPERINTENDENT ..---
ASSISTANT SUPERINTENDENT
ADMINISTRATIVE ASSISTANT
DIRECTOR
SECONDARY PRINCIPAL
ASSISTANT SECONDARYPRINCIPAL
ELEMENTARY PRINCIPAL
ASSISTANT ELEMENTARYPRINCIPAL
OTHER
TOTAL
66
60.
121
536
_ 265
760
14
122
2200
70- 47 34
0
2
2
0
7
0
1.
27
6
0
0
0
3
0
1
0
0`10
2
2
0 0
0
0
0
0
4 -'
,0 430
0 87
0 98
1 456
0 '654
0 297
0 847
Q iyV 132 .
1 2686
5
616
80
-28
63
1
7
276
W
1
14
22
3
12
0
1
110
1
t1
4
0
1
58

TABLE 12., ADMINISTRATIVE-EXPERIENCE OFFEMALE AND MALE ADMINISTRATORS
BEFORE Comm:4,TO MINNESOTA
priorExperience
Female Male . Total
No. % No. % Np. %.
YESNOTOTAL .
10
171
181
6.594.5
100.0
. 4892016
I
*505
19.580.5
100.0
49921872686
16.681.4
100.0
23
O

.5
AGE TO RETIRE
The.final question of a rather personal nature pertained toplans for retirement. Specifically, the adMinistrators wereasked to indicate the age at which they qx15ect to retire. The
results are displayed in Table 13. About 30 percent of theadministrators plan to work until age 65, which happens tocoincide with the term ination of conti nu ing,contract coverageand maximum retirement benefits. However, a s eable 'lim-ber have selected 62, 60, and under 58 as the Ali g ejt ag e for
retifeonent.As shown in Table 14 the females and Males have selected
similar plans for retirement. The ages o(65, 62; 60 andunderreceived the most responses. However, a significantly
large --Cent of the females plan to work until age 65.
3224

yt
. TABLE 13AGE EXPECTING TO RETIRE
SUPERINTENDENT 148 7 11 117 7 80 2 20 38 430
ASSISTANT, ASSOCIATE & 29 -1 1 22 0 13 : 0 '5 .16 87
DEPUTY SUPERINTENDENT
ADMINISTRATIVE ASSISTANT- 26 0 Ot, 22 0 10 0 . 1 9 68
DIRECTOR ../ 67 3 '5 31 2 27 0 8 13 151K1.a' SECONDARY PRINCIPAL, 156 4 21 184 7 107 8 28 129 65
ASSISTANT SECONDARY 85 2 3 65 2 67 2 16 55 297
PRINCIPA .
ELEMENTAR\ PRINCIPAL 289 8 19 167 4 147 j 36 170 847
ASSISTANT ELEMENTARY .*.6 1 0 1 0 2 0 . 1 . , 4 15
PRINCIPAL
OTHER N % 5-9 2 0 26 1 15 1 , 6 22 132
TOTAL 865 28 70 635 23 468 20 121 456 2686
Position Age To Retire Urlder65 64 63 62 61 60 " - 59 58 58 Total
,33

TABLE 14....AGE FEMALE AND MALE ADMINISTRATORS
EXPECT TO RETIRE
Age Female Male
No, % N.. °/y
65 . 95 52.5 76 30.3
64 6 33 22 .9
63 6 3.3 56 2.2.
62 26 14.3 617 \ 24-.6
61 0 0 23 ' *160 19 10.5' 459 18.3
59 1 . . 20 .7
-58 3 1.6 115- . 4.7UNDER 58 25 14.0 -433 17.3
TOTAL 181 100.0 2505 100.0
lo

PROFESSIONAL CHARACTERISTICS
. Assecond set of questions pertained to the professionalqualifecations of Minnesota school administrators. Specificquestions were asked about the amount of professionalpreparation and the place where it was obtained. Also,, .
inqUirias.were made relative to the certificates held byadministtators and the duration of such certificates.
DEGREES HELD BY AIINNESOTA ADMINISTRATORS
Minnesota BOard '6 Education Regulation Edu 330 readsin part as follows::''
(c) All candidates for certtficittron shall have satisfactorilycompleted a prbgram in school admigistration appro-
. priate for thecertificate requested which is approvedby the departrent 9f education and(1) which resu4.in a specialist or higher degree, or(2) which resul
sisting of aequivalent, beyon
Thesd regulations were adoeffective, date of 'July 1,' 1974.replacedby this. ct of
in the completion of a program con-nimum of 45 quarter credits, or the
ster's degree-.d April 16, 1973 ,with an
regulations which weree Board were ad tedin 1963 with
ber 1, 1967. e principal changee-requ ement of two years of
preparation beyond tha baccal eate degree before initialcertification. The old regula n provided for the first certifi-cate to be issued upon the completion of a- Master's degree,or in the case of school superintendents, the Master'sdegree, plus 15 Credits, In all :instances th'e certificatesgranted under the old regulation's held the expect
' two years of post - baccalaureate training wouidompletedbefore The "Professional 'Certificate" viould be issued. The
-training component in the new certification sTandards is thesame as the requirement for membership in the national.
an effective date ofin the new regulations is t
at
associatiqui jor ohogl.44.1hinistrators.%- 1
EP 27
35,-;
4

The data displayed in Table 15 may be viewed eitherpoditively or negatively depending or which facts one isexamining. The most encouraging fact is the substantialihcrease in the number of administrators with high levels ofpreparation. A total of 512 ,administrators have completedtwo years or more of post-taccalaureate trainingthe cur-rent standard for state certification and membership inprofessional societies. The number With this level of trainingwas but 315 three years ago: Als e number of administra-tors, with-no' graduate degree has dec ed by 100 in threeyears.
The 'negative comments must beleserve for that bulk ofthe administrators (over two - thirds of the to al) who hold theMaster's degree. The number in this grqup as not changedsignificantly in the past three years. Stat d bluntly, overtwo-thirds of the school administrators in Minnesota couldnot be certified under the pew State Boaakti regulations. Theyhold valid adminiitratOr certificates, however. The 1975regulations, like all previous requirements, includeda "grand-father" clause for persons who held certificates at that time.
Thk-number and percent of fqinale*and malg administra-tors holding various college degrees is shown n Table,16.TTe large portion of female 'administrators with no graduatedegree is most significant. Clearly, these administratorsreceived' certificates Many, years ago. The data in severaltables of, this study suggest that males are replacing thisgroup of emale administrators as they retire.
,
36
28
4

Position
TABLE 15HIGHEST.EARMED DEGREE
SUPERINTENDENT 18
ASSISTANT, ASSOCIATE A '2DEPUTY SUPERINTENDENT
ADMINISTRATIVE ASSISTANT 10 46
DIRECTIRge 9 91
SECONDARY PRINCIPAL 25 533
ASSISTANT SECONDARY 8 210PRINCIPAL
ELEMENTARY PRINCIPAL 80 663
ASSISTANT ELEMENTARY O. f 14PRINCIPAL
Bachelor's Master's Specialist'sDegree Degree Degree
OTHER 21 .82* 16
TOTAL 173 2001 306
1973 TOTLS. _ 2025 , tat
3i5 , 53
14
- 3 ,
16
-56
67
80
1
Doctor'S TotalDegree
.44 . 430
24 87
9 -
40
40
12
24
0
13
206 2686
134_ 2613
.68
156
654
297
15
132
ti

TABLE 16HIGHEST EARNED DEGREE BY
FEMALE AND MALE ADMINISTRATORS
Degree Female Male Total
No. % No. % No.
BACHELOR'S 31 28.1 122 4.8 173 6.4
MASTER'S 104 57.7 1897 75.8 , 2001 74.5
SPECIALIST'S 13 7.1 293 1147 306 11.4
DOCTOR'S 13 ,7.1 f93- 7.7 206 7.7
TOTAL 181 100.0 2505.4604. 2686 100.0
A 1.

INSTITUTION GRANTING HIGHEST DEGREE
The institutions which granted the highest degrees held byMinnesota school administrators are identified in Table 17.While longitudinal data on this topic are not available, itseems likely that two variables which are controlled by theState Board of Education are operating in concert tO shift thebulk of administrator preparation from the University to theState Universities and $t. Thomas. The increase in certifica-tion requirements and the approval of more institutions tooffer'the a67anced training seem to be contribWng to-thischange. Certainly there was a time when, the Universitytrained most of the adrn strators in Minnesota. Only oneyear'ofpost:bacc-alaurea training was required forLpertifi-cation.at that time.
,The strong relian on out -of -state preparation programsis possibly the most impressive statistic in Table 17.-Thissource accounts for.over one-third of the administrators inMinnesota and it exceeds the production of the University ofMinnesota. Moreover, the University contribution to the totalhas decreased while- the out-bf-state share has increasedsince the previous study was comgleted three years ago. The,situation respecting superintendents especially inter-eatsing. Well over 50 percent of them have Migrated to Minnesotaor as residents of the state they have obtained/ their prpfes-sional preparation outside the ,state. Sirniiartily, nearly one-
qf, the Secondary principals have',received, their highestdegrte at institutions'ip other states. The elementary prinpals are more inclined to attend Minnesota institutigns.
The data pertaining to the highest degrees held by admin-istrators- were perriloned according "to. sex, in an 'effort toidentify patterns. The results are displayed in Table 18. Acareful examination of ,,the table revealsthat inales'are moreinclined to complete their ighest degree outside the :state.Also, theUniversity trains a relatively large share of femaleadministrators. Conversely, St. Thomas, another -large pro-'ducer-of administrators, trains only a few females. J.

7
-.TABLE.17INSTITUTION GRANIttoa.HIGHEST bEGliEE,
University. Saint Man-, Saint Bemidji Moor- Winona Out Of Total-of ,ThomaS kgto head Sta .te
Minnesota... 4
SUPERINTENDENT 131*
SUPERINTENDENT.
. 33.
ADMINISTRATIVEASSISTANT 25
` .
DIRECTO : 69
SECO ARY PRINCIPAL 207. ASSIITANT SECONDARY
PRINCIPAL is 94 i
ELEMENARYPR1NCIPAL 236 .
-ASSISTANT ELEMENTARY , 4,PRINCIPAL
OTHER, '47.,
TOTA1,'. 846
6 .9 24 , .9 '3 ' 4 4,
3 . 5 3 1, fr 2
(4 .5 6 .1 3 0 .
..6 -10 ,7 4 6 1
31, 57 31 8 . 3 13'
. , ..
,227 3 239 '' .
, ,6
24 142 99 ,. 59 36 28
4/ 1 g. 0 a. 0
,5 14 '13 ? 3,
125 285 . 1/.92 81%
6
.
h
246 430 ,
'34 87,
' .
24 '68... .
54 156
We,: 654.
104 297
223 847
.1
".42 132
1034: -2686

. TABLE 18INSTITUTION GRANTING HIGHEST DEGREEACCORDING TO SEX OF ADMINISTRATORS
Institution Female Male TotalNb 4/0 No: % No.
UNIVERSITYOF MINNESOTA
4ST.62 34.0 r
784. 31.3 846\ 18.0THOMAS 7 4.0 118 4.7 125 1&1
MANKATO 31 17.1 254 10.1. 285 10.0ST.tLOUD' 19 10.5 173 6.9 192 10.0BEMIDJI 7 4.0. 74 3.0 81 5.8MOORHEAD 10 5.5 .53 2.1 63 4:5WINONA 8 4.5 _52 21OUT OF ,
,
STATE t7 20.4 997 39.8 1034 33.7TOTAL 181 100.0 -2505 X100.©. 2686 .100.0-a
41.

CREDITSIARNEDABOVE HIGHEST-DEGREE
4
Many administrators accumulate grad its as aform of nservce education,and-other are working toward a
higher degree while holding. an administrative post. One of
the items on the questionnaire was designed., to identify the
amount of this training and to see if there were any sex
differences The data produced by the question are shown in
Table 19- Unfortunately. the question failed to isolate the_
persons who have completed no credits beyond their highest
deb. FloweVer. it is significant that about 41b percent of the
administrators checked 0-15 credits. Only 18,6 percent have.
corm3leted the equivalent of one year of training beyond that
required for their highest degree.
The data show niS significant differences in the tenden?y of
females and males tO accUifidate credits beyond then-intl`est earned degree.
, -
EXPIRA #fOR -DATE OF ADMINISTRATIVE CERTIFICATE
The last question regarOng the professional characleris- -
tics of the administrators pertained to their administrative
cetlfic.ites. Again, the data were separated according to the
sex of the administrators. As Shciwn in Table 20, over one-half
of the total group reported holding a -life- certificate. The
Iplance At, the groups 'wi41 need to hAve\their certificates4
renewed by 1980.Snce such renewal k-0e:rally teased on
additional graduate training, the outlosli for continued high
. Jevels of attendance at the training institutions is favorable.
While the sample of females in this study is small. chance
alone probably would- not account for the, relatively large
,number of female aciminiqtrators with life ;certificates. The
data here and other tables sugst that -These certificates
were ssed to relatively maturg females mahy years ago. The
-; training institutions have no, produced a large number of
female replacements wbo would need to have their dertift-.,. ,
. cates renewed, during the next several years.,. 444 -
V

. . TABLE 19CREDITS EARNEDABOVE HI6HESTIDEGREEACCOpING TO SEX OF ADMINISTRATORS.
5 N,rCrethts
\ Male\ Total
% . No. % No. %
0 -15'16-3031:454660over 60TOTAL
,; 75 41.8 982 35.2 1057 39.4
54 29.7 598 240 652 "24.2 -.19 10\ 460 18.3 479.* 17.819 10.4 297 11.9 31-6 11.714 7.7- 168 6.6 182 6.5
181 100.0 2505 100.0 2686
EXPRIA.
_.--; ' Date of .
-ExpaatiOn Female2c., 0. .
- go.. % -__,,____
s. .-.s, LIFE 120 66.5 1351 53,9 14 54:8
1%75 . 14 7.8 201 8.0. 215. 01976 s 15 . 8.3 200. 8.0 215 8:049717 -. 9 5.0 214 8,5 223 - &31978 12 6.7 256 ' 10.2: '26p 9.91979 . 8 .5 254 102 262 = 9.8
.
980 - . . '2 1.1. -25 1.0 27 . r 1.01981 0 0 .1 S-- .1
: 1982 1 ' .1 2' .1 3 .tTOTAL 181 :100.0 2505 100:0 2685 100.0
' a
C
- ,
A, ... 4; 'X'..
f ., -.fa ,,,,,t
, 1, ... .
-1/4: ,, .
ri
--- --x :..,i . ,...
, N ,=
sr

PROFILES OF TYPICAL INCUMBENTS
The data in this stidy Make it possible to sketch theprofiles of typical school administrators in Minnesota. Whileall of the variability is bscured in this process, the resultsare interesting, nonetheless. For example, the typioal super-intendent is a White male between 46 end 50 yearsof age. Heis employed. in a., district whiCh enrolls fewer than 1000
, students,,,.His tenure there is between 6,and 10 years. Thechants are aboOt equal that he wasan administrator in'another state before c'Orning to Minneiota. He bolds` a `.,Masters degree which was completed at an institutioutside the state. He has alde certificate, but he expects toretire at age 62.
The secondary school principal differs little from,th person who supervises, himthe superintendent of Scrim
,)s* a younger, -Possibly five years, and he is workingslightly larger school district...Like the superintendent, he
be'a product of an institution outside of Minnesota.Th rofile of the elementiryOncipal is largely a reflec4
\bon of his associates in the front2sofficeand the high school.He Tay show a larger degreeof.parpchialisnf in that hisresidence and -Veining are more likely to have roots in-Minnesota. The likelitiood Mit. the elementary principal willbe a.femalehes 'diminished decidedly since the last.etudyviesdooe in 1973.cl,ther profiles could be drawn from the data. TO a large
extent, hoWemer. this would-be repetitious. -AdMinistratorsin.Minnesota tend to haVe similar-personal and professional,.characterMics:this condition--Seems-likely to.continue untilfemales, minorities, and young people are 'admitted`to theclub in greater numbers.- ".

CHAPTER THREE
OUTPUTS OFEPARING INSTiTUTIOVIS
The graduates of the seven state apprdved administrator'Oreparatign_piogranis represent the roost significant sourcebf personnel for leadership positions in the public schools ofMinnesota. Persons aspiring. to be same( prinCipals andsuperintende4itsinust meet the requirements of these institu-tions, or as noted earlier, complete similar programs in other _7--states:While it is technically possible to meet certificationstandards without completing a graduate degree, and vice.,..
. ./ versa, these are. rather um mon Oractices and somewhat- cancelling in their effectlaft-_ puts:' Due to this close' rel
$ tionshlp tiioteen graduate aegre4 and adminipratqr ce . .cation, ang shice,colle4es and universitiesaissueaegrees
. rather than tilVtes (and therefore. leberl records accord-ing(y), the' pre ring institutions were asked to report-the .
-i. number of degree Warded Turing the past'tivp,years, SinCe lc"--- the same request was made of these instituttcons only three .
years ago, the data. fcir,,this study andthe one in 1973, areovei-lapping for i976z7nrrid 1971-72: ' ' i,
P
_,e,
STATE CONTROL OF _ ti . :-\,e. I. -,AMINISTRATORPREPARATION .. ; .s.
., . a reboil pi-6'g riiiii: in Minnesota, This Etit is qicrcisect, by !--,
The state niatniitins general cant of ':)f adniirritiatei:iire-,, .. , ... -. .-
, r. .
...,.- -the Stati Univetsity Board, the State Bah Edimatiorii,,eng ..--.
`,:',-. iheklegents.oithe Univertity.TheState University (3b idlind...,ttye Ragents ot_the -Unive(sity adhorize,the-grintin of de-- ,igrees in -th'State 'Universities and thl k university ot inner i
'.,s,ota, respectivety..*iiilaity, the; State tbarcliof Eci4cation:.-.,. ,
. Y, cC:6. .
rc: Si:Iv

.
upon the recommendation of its profession stafffin the State
Department of Education. approves adminis for prepara-bon programs. The standards established by the North Cen-
tral of Colleges and Secondary SChools andapproval by that agency *are important considerations.
The procedures described above were used in granting
. approval to the institution's of higher education to offer theprograms which are listed in Table 21. As shown in the table,
..seven institutions offer 'the Master's degree, six have two-.
year prilgrams. and one awards Motor's-degrees. The pat-tern shown in Table 21 also suggests that approval to offer agraduate degree generally includes authorization to trainadministrators for all levels of specialization, e.g., elemen-
tarysecondary, and _general administration, The one eKcep7Iron is at Bemidji where training is limited to elementaryschodl admviistration. The outputs of these seven institutionsare described:iii the following pages.
46
38
1

TABLE 21 ~
INSTITUTIONS PREPARING SCHOOL ADMINISTRATORS INMINNESOTA
InstitutionUNIVERSITY OFMINNESOTA(Twin Cities) -
UMD .
(University ofMinnesota at Duluth)'BEMID..11.
Maste r's 'Degree.ELEMENTARYSECONDARYGEN. AMON. 1,ELEMENTARYSECONDARYGEN. ADMIN,ELEMENTARY
'MANKA'm ELEMENTARYSECONDARYGEN. ADMIN.ELEMENTARYSECONDARYGEN. ADMIN.ELEMENTARYSECONDARYGEN. ADMIN.
ELEMENTARYSECONDARY
ti ST: CLOUD
ST. THOMAS
WINONA
q7
Specialist'sDegreeELEMENTARYSECONDARYGEN. ADMIN.ELEMENTARYSECONDARYGEN. ADMIN.
. Doctor's DegreePh.D. Ed.D.
ELEMENTARYSECONDARYGEN. ADMIN.
(Program Continuation Arrangementwith another University)ELEMENTARYSECONDARY -
GEN. ADMIN.ELEMENTARYSECONDARYGetv. ADMIN.ELEMENTARYSECONDARYGEN. ADMIN
ELEMENTARYSECONDARYGEN...ADMIN
t
C

JP-
GRADUATE DEGREE SIN EDUCATIONAL ADMINISTRATION
Tile outputs of the seven Minnesota administratox training
institutions, for the past five years are summarized in thissection. ,The data for the state universities, WO, and St.Thomas are combined in tables while the same data for the
University of ,MinnesOfa (Tiolin Cities Campus) appear inseparate tables. In most instances a third set of tables sho,ws
the totals for the state,The degrees awarded at the five state,. universities, UMD
and St. Thomas during the past fiveyear'S are shown in Table
22. The increased output of these institutions in recent.yearsis rather pihenomenai. The total has increased by 50 percent.
Not shown. here (becauSe the data fOr 'six InStItuttortrara- ---7, combined) is the fact that Mankato, St. Cloud, and St. Thomas
prdduce approximately 15 percent of the graduates shown in
Table 22-: And, looking. ahead to -Table 3, it as clear thatincluding, the output of Master's and Specialist's degrees,from thellniversiti of Minnesota (Tivi'n Cities Camiiiislwould.
not change the, picture sidnificantly. These three institutions
.(Manka,),O;St. Cloud, and St. 1iomas) still award about two ofeverythree,MasteKs ,and Specialist's degrees in the state of
Minnesota. - _
The tiVe=year output for -the University of Minnesota (Twin
Cities Campus) is shown intable 23. There is little of note inthis table except the, lack of any 'trend. Then, too, it is
significant that the Di dor's gegreeprogram prOduces more
6raduate$ than either the Masteri degree or Specialist's
- degree, programs.
1-

V
,
TABLE 22EDUCATIONAL ADMINISTRATIONGRADUATES FROM MINNESOTA
STATE UNIVERSITIES, UMD, AND ST.-THOMAS DURING THE PAST FIVE YEARS
Year , Master's Specialist's Total
1970-71 133 12 1451971-72 128 43 1411972-73 142 29 1711973-74 196 36 2321974-75 167 52 219 4
'TOTAI, 766 _ 142 908
TABLE 23UNIVERSITY OF MINNESOTA (TWIN CITIESCAMPUS) GRADUATES WITH MAJORB1N
EDUCATIONAL ADMINISTRATIONDURING TH4PAST FIVE YEARS
,Year fylasteeeDegree
Specialist'sDegree.
Doctor;sDegree
Total
1970-71. 18 6 25 ' 491971-72 r 12- ,16 . . 34 42197$2-71 25. 11 -, 25 611973-74 i8 . 14 -.27 691974-75 , 13 ;17 30 60TOTAL 96 64 -140. 01
4-
49
.41
4

e outputs of all sev preparing institutions are com-
ined in Table 24. A. in, the impact of the accelerating
production of a few in: itutions is apparent in the year-to-year
totals, Most of 'the .mments regarding the balance between
supply and dem d are reserved for the final chapter. Suffice
it to say, ho ever, that caution should be exercised in
assuming t t the institutions of higher educttfion in Minneso-
,teare 91 ting the market with trained school administrators.
As no d earlier, initial c rtification now r uites t o years of
pd -baccalaureate tra ing. Achingly less th n 30 per-
c nt of the graduates shown.in Table 24 e certifiable.;
.
SEX OF GRADUATES
The 1973 study revealed huge imbalan in th I-reining-Or
males and females for administrate sts. The five state
diiiversities (then state colleges) tY and St. Thomas were
accused of "not producing thei share of female students."
Further itwasobserved that," innesota puOlic schools in the
'future are destined to repf=tst,,he discriminations of the past
unless external interven ins upset the system::Asshown in Jabl 5.the soght-aftefr external terverr-
(ions have not dev oped.or their impacthasbee !scale.
The shift to th raining of females has-Tnovedietyglaciar-1.
pace. Again t appears thatlOvese igstijaiions or will
not corr the imbalance.-External interventions are sug-
gested once more.
-,. 42

TABLE 24EDUCATIONAL ADMINISTRATION GRADUATES FROM
MINNESOTA STATE UNIVERSITIES, UMD,ST. THOMAS,'AND THE UNIVERSITY
(TWIN CITIES CAMPUS)DURING THE PAST FIVE YEARS
DEGREE
YEAR M.A. Specialist Ph.D, Fd.D. Total
1970-71 151 1[8
'1971-72 140 29
1972-73 ` 167 40
1973 -74 224 . , 50
4974-75- -- -1-613 --L-69
TOTAL , 862 206
1970-71 151 1[8
'1971-72 140 29
1972-73 ` 167 40
1973 -74 224 . , 50
4974-75- -- -1-613 --L-69
TOTAL , 862 206
9 16 194
16 18 . 203
11 14 232
; 10 17 .301
- 15 -1-5. 279
56 75., '1209
/
TABLE 25SEX OF GRADUATES WITH MAJORS
IN EDUCATIONALADMINISTRATION DURING -PAST FIVE YEARS f ROM' SUIT
UNIVERSITIES, UMD, AND ST. THOMAS
1, 171' 94.2.____;
1973-74 , 0 212, 232 91.4
)"1974-75 192 . 219 87.6
TOTAL 74 834 90§ 91.8
. ,
43 -,
51
43 -,
51

The strong language above is only a little less appropria/te
Jortithe University of Minnesota. While the percent of female
graduates is approximately double that of the other training
institutions in Minnesota,'Table 26 i:Qicatelthat about four of
every five degrees are awarded to males: Again, there is
some evidence of change as the percent of female graduates
. has inc4ased,in recent years but the numbers are terribly
small. When the totals of Tables 25 and"26 are combined, only
1.30 of the 1209 degrees-in the past five yearg Were awarded
to females. This is a paltry 10.8 percent.
RACE OF GRADUATES
the ckinqetalistics reported earlier abo0 the dearth of
females in administrator training progiaini-pOlb wh am
pared with the data for minorities. Again, this sweeping
generalization ismost applicable to the state universities, St.
Thomas and UMD. Of the 908 degrees awarded by these
institutions in the past live year's, only 25 of them went to
minorities ---21 of whom were identified as "other: by the
respondents:Four Sleeks' andno American Indians'Or" Chi-
:carps were.graduated, (see table 27)
The Edudationat Administration program at-the twin Cities
Campus of the University has attracted a 'somewhat larger
number of 'minority students. Felldwship programs ana le-
cruitment efforts have been effective, as the data in Table28
indicate. While thiS production of minority graduates is not
impressive,'it is far ahead of the other institutions its Minne-
sota. The Univeisity (Twin Cities *Carripu4 prodUCesbut-
one-fourth of ttie graduate degree% in 'educational adminis-
tration. However, 41 of the p6 'minorities o received de-
grees' in fhe past five years attended the University.
4
52'44

4
TABLE 2e.S OF GRADUATES FROM THE
:.7---ANIVERBITY OF MINNESOTA (TWIN CITIES CAMPUS).WITH MAJORS IN EDUCATIONAL ADMINIkjiTIN1TION
IN PAST FIVE YEARS
Year Female Male Total
197.0-71 7 42 , 491971-72 6, 56 - 621972-73 14 , 47 61
1973-74 15 54 691974-75 14' 4Q 60TOTAL 56. ' '245 3
PercentMale
85.79
7.079.077.Q
' 81.0
-TABI.E27 f
MINORITY STUDENTS COMPLETING GRADUATEDEGREES WITH-MAJORS IN EDUCATIONAL 9
ADMINISTRATION FROM STATEUNIVERSITIES, D, AND ST:THOMAS:
DURING TH PAST-FIVE 'topsYear American Bla -k Chicano Other Totals
Indian
197a771. 1971-72
1972-731973-741974-75TOTAL
t.
'
0
00
0 , 1 - 2
1 0 3 , 4
1 0 6 7:0 . 0 . 5. ,- 51" -(:) , '6 t 7
0 21 ' 25

171.1171171.1.,
-"-----TABLE 28 --
MINORITY STUDENTS COMPLETING GRADUATE`
DEGREESDEGREES WITH MAJORS IN EDUCATIONALADMINISTRATION FROM THE UNIVERSITY
OF MINNESOTA (TWIN CITIES CAMPUS)
IN THE PAST FIVE YEARS
Year, American Black. ChicanoIndian
_ 1970-74 8 2- 0r:-
1971-72 1 ," 2 -1'
1972-73 , 4 2 0
1973-74 1' - 3 1
. 1974-75, ,, 2. 9
T o t A r ------te 1-8 ' --
Other , Total
,.
2 - 12
. . .0 4
1" 7
1 , 6 -,
1 . 12
POSITIONS HELD BY GRAMMES
The positions now held by persons who c'ompleteddegrees
(in edUcational administration during the past three years are
shown in Tables 29, 3D, and 31. the image of the state.
universities and St. ThoMas as major producers_ of schoadministrators for Minnesota is supported by-the data 41
these tables. With nearly 90 percent of thir graduates now;
, empl ed in the state, these institutions far exceed. t e
Unive ity in every position title except "college teachiri '."'
The dis ib,ution of graduates from the University and the
other' institutions is otherwise surprisingly similar:, As Act
example, 16 or the 190 graduates -of 'die University (8.4
percent) are now school superintendents. The-other institit'
hoot placed 45 of their 622 graduates (7.? per6ent) in the
same 'position. tlowever, more of the Univeriity graduates
tend to accept positions outside this' state. Also, as shown iri
'the next section of this report; there is a shift'ih the employ;,
iletp of DOetor's degree holders .from college feeching to
OublicechOOIedministration.". f
I

- TAIPLE 29POSITIONS NOW HELD BY EDUCATIONAL
- ADMINISTRATION MAJORS:WHO HAVE'ARADUATED FROM MINNESOTA STATE .
UNIVERSITIES, UMD, AND ST. THOMAS- THE-OAST THREE YEARS
. ,... - , e
/b. EL 6NTAfirPRINCI I: '-') 169 13 182. ., . .,..&
- ' 411
4-,-
r .1SEC/NO;1/4RY PRINCIPA *...-- '1d 177 ,- 1:15 :: -.. -,..-
?s -, - SUPSRVITENDENT 6#-39-- ' 4. .\ : 7.2.
_ --,-.cotkeGe TEACHIN i .,-...,_:-.
.0' d_ 01 9-Q,.. '... , .
......., QTHel'ADMINISTFIAtORS . 31 ,,, . 4 ,- 36- -.6M -1-1.-1 ...' 19 I 1 -'' 1.83"7"
s-,,
. It.4M tANEOUS *.164
-
-7... .:4 . - RS, STUP6ibiTS1 ...1"'. 11'.' v."' -*:.-. ..
;"- '-- C-; 'T .-i.i.' .° '! 1 --=';.. VO ,.... . , 5? ',-, 'A . 1 ` k 4 1.- : 4 N"
,, -_ -Rae \-, l-. . .'tip if \\.:\ ''....., , --- , : . v4.\-;.: `15
._ (:s1 1j, \ ' vk . s:.
,, Ai. ___'..._____I___ -.:2,4. , rf .C., ` '''. t '-' . .(..\ 44'..' k" .0
. 3'i . . ir-::: - .. . l' ._- .. - , . _,-.1 ., .... . "N... .
. t. i.:.. rf :ii. , ; tk,., -,.. '4',. A.
t, r,
4 1
Mi nesota
-LOCATION, ,- . .
Out-ot, . ,Percent ofState' ,Total Alt Positiorie s
. .-
6 24 k 1 0 0 0

TABLE 31JOSITIONS NOW HEW BYEDUCATIONALADMINI
WHO GRADUATED FROM MINNESOTA STATE UNi SITIES,AND THE UNIVERSITY OF MINNESOTA (TWIN CITIES CAMPU
= PAST THREE YEARS
Position
LOCATION
MinAsota
N MAJORSMD; ST. TH011AS) DURING THE
Out-of- .1 ' tat . Parc"ent ofState AIL PositiOns=
ELEMENTA1,IYA, , (OR ASST. PRINCIPAL)
SECONDARY PRINCIPAL(Ott ASST. PRINCIPAL)
a SUPERINTENDENT" (OR ASSN: SUPT.)
COLLEGE tEACIIER
0TM/A ADMINISTRAtOR
MISCELLANEOUS(TEACHER. STUDENT)
. TOTAL .
\
192F
2b8
. 53
25.0
,
13.9 227 28.0
';r , .1. .
l N..,.
! 't.8 71 -. 8.0
..
--a. . .
9 ) 7 .o
16 2.0. e
60' \> .1 21 . 81 '10.0
196 .. '' __ 25 221 27.0 ,,
318 94 812 100.0
1
r , .
.

THE DOCTOR'S DEGREEUNIVERSITY OF MINNESOTA
'The 1975 Alumni Directory of the Department of Educa-tional -Administration lists 259 persons who have obtainedDoctor's degrees. Many of these degrees were awarded
. during the first half of this century, but significantly, 50percent of them have been completed in the past 'five years.
This recent surge in pro uction and other factors haveintroduced changes in the employment pattern. As shown in
Table 32, 43.8 percent of the recipients of 'Doctor's degrees
prior to 1970 are now employed in four-year post-secondaryinstitutions. Sixteen and eight-tenths percent (16.8) of the
. _ more recent graduates are similar poSitions.tikewise, only---1-21-ofttte-otder group are elementary arid-seeonclacy-ialtoot-
administrators, whereas, 31 of the recent gradtiates areprincpals. The percent of each group in the superinteridency
is about the same. , %
As noted above,. the basic shift in the employment pattern
of Ph.D. and Ed.D. graduates has been from college teaching
and administration to. public school leadership positions.While this transition has been substantial, it is important to,note that only slightly more than one-half of the recerftgraduates are in public school adiriimstration positionS. This
figure seems,to have reached a plateau. suggesting that the
1
professors at the University shouldr prepare twice as-many3persons with Doctor's degrees as they, expect to place in
"public,scheOl administration positions. N
I,
. 8
f
-41i4
. -.

TABLE 32POSITIONS NOW HELD BY PERSONS COMPLETING
PH.D. AND ED.D. DEdREES IN EDUCATIONALAOMINISTRAMON AT THE UNIVERSITY OF
MINNESOTA
Position
SUPERINTENDENT .
CENTRAL OFFICE'
SECONDARY ADM,\
Grad-dated GraduatedPrior To 1970 Since 1970
No. % No. /0
16' 1:2.5 12 . .4.26
12 , 9:5- . 30 22.9 '10 .'.
;-.,.7.8 21 16.0
_.1__-___ ELEMENTARY AUL 4 _3.1 __ Ili.-- -776-----COLLEGETEACHERS
& ADM.,
COMMUNITY COLLEGEADM :\ , :
PRIVATE SCHOOL.._
AGENCIES . -
Se
-..
.10.
4
4t.
43.8
. 7.8
. 3.1
3 \1 ,
22
6
4.
it
16.8
4:6
3.0
. 12 3
-J.-FOREIGN `c 7,i. 5, 7 53.5lAiSCELLANEOU. g 3.9 2.3
TOTAL, 128 '100.6 131 100.0
.
1.
*
a.2/4 , _
5 9
51
S
CHAPTER FOUR
FUTURE DEMAND FOR SCHOOLADMINISTRATORS IN
MINNESOTAII is more than \a tautology to call attention to the hazards
involved in predicting the future need for school administra-
tors in a single state. Every technique has its limitations. ANisi of variables, many of which reside completely outside
the educational establishment, expand or diminish the de-
mand for school administrators.Accepting all of these constraints, the decision was made
to keep the research,procedure as simple as possible, admit-
ting in advance to the boundaries of knowledge reportedhere' Accordingly. superintendents were asked to predictchanges in the next five years which will affect the demand
fur administrators in their district. A special effort was made
to get the respondents to consider additions, reductions, andretirements which they anticipate. Inherent in the research'_design was the assumption that persons closest to the scene
are the best prognosticators of changes in personnel needs.Obviously, a more extended- outlook would be helpful, but
since the art of forecasting in; this field is an imperfect one,distant points tend to be even more obscure. A frequentreplication of rather limited proidctions seems to be a wiser
strategy. 'The basic data produced by the collective prOjections-of
Minnesota school. superintendents are shown in Table 33. :These data are subject to all:uf the uncertainties, discussed
earlier. Also, since nb superintendent was willing to predicthis own demise, or that of any of his 'subordinates before
-retirement age,. in this sense tneteprdiections -or replace-
ment needs must be viewed as'minirrrat-i

.
TABLE 3iNUMBER OF ADMINISTRATORS PRESENTLY EMPLOYED ANDPROJECTED NEEDS
AS REPORTED BY 430 MINNESOTA SUPERINTENDENTS
Predicted Changes in The Next Five Years
PositionNow
EmployedRetire Add
cReduce. Net
Change
SUPERINTENDENT ' -`'''- , 430 89 0 6 +83DEPUTY'SURERINTENDENT 4 1 : 0 1 ''' 0
-'- ----. ASSOCIATE SUPERINTENDENTir.) -`-ASSISTANT SUPERINTENDENT
12
109
0-
4
0
16
1
3
1+17
ADMINISTRATIVE ASSISTANT : 86 13 30 10 +33DIRECTOR
. . 229 17 12 9 +20ELEMENTARY PRINCIPAL , 1134 87 40 64 4:63
.0 ASSISTANT ELEMENTARY PRINCIPAL - 33 3 12 1 + 14** S E C 0 N D A R Y PRINCIPAL -. 715 ., 51., 22 8 +65
ASSISTANT ELEMENTARY PRINCIPAL 470 9 . 40 27 4- 22
'OTHER .
. . . 201 20 5 5 +20TOTAI., .3423 294 177 135 + 336
I -

CHAPTER FIVE
CONCLUSIONS ANDOLICY IMPLICATIONS
' The test of the value of action research of the type reportedhere is the extent to which it provides guidance for policymakers. Persons responsible for settin6 policies respectingboth training programs and the state credentialing function'should be aided in their work if this study is to be anythingmore than an academic exercise. Also, hopef ly, personswho make decisions about selectin9 administrat e erson-nel will be influenced by some of the data and logic cOncern-ing -females and minorities.,The training arid employing fun,-tions are inextricably related. Employment possitiilitieS forfemales and minorities must be.realistic if they are to investtheir time and mo Y in administrative training. Conversely,employers ca of 'be expected to offer &asointments tountrained ividdals simply becaUse of their sex or race.Poss = the material in this chapter will point toward aolution to this "which came first, the chicken or the,egg"
question in educational administration.
TRAINING CAPABILITIES OFMINNESOTA INSTITUTIONS
The recent history of the supply of adminiStrators in Minne-sota has been characterized by both expansion' and contrac-tion as the State board of Education has alternately raisedthe required level of framing and later gr'anted approval tomdre institutioris to provibe it. Also, She State Board-hisnormally included "grandfather" clauses and otherwise ac-commodated persons presently holding certificates. And toadd further to the instability iiiithe flow of-qualified personnel,the _Board always announces that its new regulations wiltbecome effective at some distint, futUre date, This causes a
55
JP
o

A.
rush_ of activity as many persons want to escape the more
stringent requirements. For example, Edu 330, which became
effective July 1, 1974, states:(g) Persons holding standard or provisional certificates for
one of the administrative roles, whose first certificatefor this role was issued prior to September 1, 1967, rhay
be issued a continuing administrative certificate upon.
the next renewal.(h) The continuing certificate may be renewed according
to general regulations of the state board of education .
'-pertaininga to -continuing education, except that. t$e
endorsement of a superintendent's certificate reqUir d
by Edu 547, shall be verified by the clerk of the localboard of education on behalf of the board of education.
(1) In Order to provide means for persons holding standard"administrator's certificates to phase into the -require-
. ments of Edu 330, Sectionsla)through (h), the -follow-
ing provisions of Section '(I) shalt be deleted frorriEdu
330 without further action of the board of education.
(1) Persons holding standard certificates for one of theadministrative rolekwhose first certificate for this role
was issued after Sepaaetr 1, 1967, shall complete therequirements of Edu 330, Sections (a) through (h), by
July 1, 1979, or on the, next date when a'n applicant's
certificate must be renewed if it falls after July 1, 1979.
(2) Any person ,whose standard scertificate as a school
administrator lapses after, JUly 1, 1974, shall meetrequirements of Edu 330, Sections (a) through (h).
Assuming that this scenario will not be repeated4 it is at last
possible to make some more definitiVe projections about the
. supply of adminiitrators which can be provided by the train:-
- ing, institutions. This production can then be adjusted to
pdrallel the projected need for trained talent.
Tire longitudinal perspective provided by the.1973 study,
and this one three years later, suggests that the public
schootsof Mirinesdta need approximately 75 fully trained and
certified administrators each year. Assuming that Minnesota.A
56
64

o
public schools continue to absorb 75 percent of all graduat%sin administrative roles as the data suggest, the combinedannual production of training institutions should be about150,15 Minnesota adMinistrators, 25 for other states, and 50for other administrative roles. These individuals must havetwo years or rnOre of post-baccalaureate preparation. Assum-ing further that 30 percelit of the new administrators inMinnesota should have (or will want) thehigheSt credentialsas they compete with out-of-state -candidates for choiceMinnesota positions,'and. assuming that 50 percent of the--recipients of Doctor's degrees will enter public school admin-istration work, the production should be balanced betweenthe'Specialist and Doctor's degree.
Table 24 indicates that 99 perSans_completed the-Special.ist s and Doctor's degrees at Minnesota institutions in themast recent year of this study. This was by far-the largestnumber ever produced in one year,: However, if there is meritin the analysis above, the production is still well below theneeds of the state. This is especially true at the highest levelof preparations--the DoCtor's degree. Production of gradv-ates with this degree has leveled off at about 30 per year. Adoublingof this production would not be unreasonable.ApprcpciMately 30 per year sholild enter public school work ifMinnesota administrators are to maintain a training levelcomparable to the nation. The balance of this output could be-absorbed by the agencies, universities, private schools, andother organizations which 'normally employ persons with highlevels of preparation.
The foregoing discussion is limited to -the preparation of,
persons, at the 'Specialist's and Doctor's degree level. Anincrease in the production of Master's degrees in .Minnesotano longer makes educational or economic sense. The empha-sis must be shifted to 4igher levels of-preparation: Institutionswhich are unable to provide it efficiently should drop their,administrator training programs. Indeed, it is absurd to haveseven preparation programs in Mihneiota. Presently fourinstitutions are preparing all but a few of the individuals who`,
.
67
os, 65

can be certified according to the new State Board Regula-
tions. Hopefully, the future expansion in' administrator pre-
Oration will come at these-institutions.
FUTURE DIRECTIONS
The discrepancies between the production and demand for
trained administratprs In Minnesota represent a challenge to
the policy makers of the state. Some strategies fo'r respond-,
mg are delineated below., These recommendations have
some foundation in the data which are reported in the tables
of thisstudy.1. EMPLOY MORE FEMALEt AND MINORITIES IN DE-
----PARTMENTS -OF- EDUCATION Al_ ADMINISTRATION.
It is fitting in a way to begin this list.pf iecommenditidng-
with a reminder to,training institutions that they, too, have
failed to adjust employment patterns to contemporary stan-
daida As shown in Table 34, these departments are largely
"white male clubs" as they were in 1973 and for decades
before that. The key to recruiting training, and placing-
females and minorities mar be found. in the type of persons
who populate educational administrAkon departments. Cer-
tainly, to this date, no training institution in Minnesota his
te,sted this hypothesis.
2..ALLOCATE ALL 'AVAILABLE 'RESOORCES INTO
TRAINING AT THE LEVEL OF THESPECIALIST'S AND
DOCTOR'S DEGREES,This volume is replete with references to the lag, between
State certification requirements and 'the level of trainin of
practitioners. This has developed- largely because the State
has perrodicallif .raised certification requirements. Presum-
ably, the highest 'reasonable level has now been establiShed
and the present` standard will remain fixed at two years ofQ
giaduate study. The Master's degree in educational adminis-
tralion .is therefore obsolete.Program planners seem to
recognize that there is not sufficient content in administrator"
58

TABLE 34SEX AND RACE OF -
FACUT,TY INTHE DEPARTMENTS
OF EDUCATIONAL ADMINISTRATION iNMINNESOTA PREPARING INSTI1UTIONS,
FALL 1975*
Faculty Eqrnale Male
.(Ass't Prof. or above) Minority White Minority White/
FULL TIME 1/ 1 4. / 35PART TIME 0 0 1/2** 3' '
'University of MinrieSti (Twin,Olties); UMD, Bemidji, M7kato,St. Cloud, St. Thomasand Winona
, **Full time equivalent-
, ..
training programs to justify two years of study in educatiorialadministration. Students are therefore required to completelarge blocks of credits in other fields. Accordingly..it seems'wiser to,reserve the professional administrationlraining.untilth,e,sdeond year of graduate study.,This approach would openthe choice of potential trainees to all persons completingMaster's degrees regardless of major field. -Also, it would'perzmit more efficient use of the limited resources for adminis-
,Jrator preparation.,. 3. RECRUIT MORE FEMALES AND MINORITIES .NTO
PREPARATION PROGRAMSThe language contained in The 1973 study respecting this
subject is still valid:"The dearth' of trained educational adminiStrators from theranks of Minorities- and females is well documented in thisstudy and elsewhere in the literature. Clearly, there is 'a,rmajoineed in-jhis area and:there is much work yet.to be
k-J done--- in recruiting and ,preparing, members froM theseMajor groups. The programm, at thefwin 'Cities campus of
50.
ti
O
-

-S
the University of Minnesota to train American Indians is a
'model which should be replicated for other minorities and
females."4. EXPAND TRAINING CAPABILITY AT THE DOCTOR'S
DE.GREE LEVEL,This may sound like a self-serifing message 6om a,broken
'record since this 'document is being published by the only
institution' in the state which offers the Doctor's degree, and
the -recommendation to expand production has been made
many times. The fact speak for themselves, rhowever. The
American Association of School Administrators reports that
;about 34 percent of tts'members hold, the Doctor's' degree.
The Minnesota contingenoy to the same, organization in
cludes but 10 percent who hol this highest degree. More-
' over, _a 'Whopping 5b percent fItTr. Minnesota- superinten,.
dents yvhohave Doctor's deg ees obtained them from institu-
tionsoutside the 6tate. Whil no comparable data are avail-
abletor other states, the Minnesota situation is clearly atypi-
cal. The data in This study db show that-very few Minnesota
-administratore are located outside the state.
Similar data for elementary and secondary school princi-
pals Pointin the same-direction. Again, Minnesota lags far
b` iliind the 'nation in the percent of principals with Doctor's
degrees. The Natiohal AssoOiation of Elementary School
Principals reports that 6.8* percent' of its members have
c rhpleted 'the Dc ctoe.s degree. A comparable figure -for
elementary principals in Minn'esota is 2.6 percent. Similarly,
the membership- in the National Association of Secondary
P4rirncipals indiudes 15 percent with a Doctor's degree. The
compagble figiire for Minnesota is 6.1 percent..The comparaTive statistics may not convince policy,m4ers
of the need to keep up with the other states. It can be argued
that proof of the value:ofthe Doctor's degree in school
'administrant isnot.Well estatilished.Without succumbing to
the temptation to debate-that point here;Sufsf ice it to say that
as a, practical matter 'atone- it is- important, for Minnesota_
administrators, and the states as 'a whole, to be.competitiva..60

.. . .
. ', .. .' Level of.traming arid quality of perfcrimance have a positive
correlation in the minds of most educators and laymen:5. EXPAND -THE OOCTOWS DECREE. PRO3RAM FOR
.:is...10PERINTENDEtIT'S At THE UNIVERSITY..0FMiNNE,
TA , ,',The failure of the University of MineetOta to supply super:.
i ntendents foF,the major school districtsin Minnesota is very..: apparent. Recognition of thisproblem provided much of the
- momentum for installing theEd.Ad. degree in1967. However,A fewer University graduates now head the majcir schooldis-
..r.Itricts than t-',any time in the past. University graduates simply: do licit compete- favorably with out-of:state applicants' fox P
choice positions. The situation is especially critical respec-ting_ iiteriitende_nt aositiongwhere__the_noctor:s_ilegree_is '
...
required or at leasepteferred. For example, only 8 df the 29.siverintendents in the Twin CitiesMetropolit area holdingDoctor's degrees obtained them at the Uni ty -of.Minne. ...,
sota. The record of the Oniversity for training enn dents. . -
'for the three firif-clasecities to the State is especlelly dismal.The last person to head the ,Minneapolis' Pptilic Schools.,whoU highest, degree was awarded .by the Upiverty, ac .\cepted-that position in 1922,-St. Paul last poo' edit .niver- ''sity graduate as its superintendent iii 1936'. dU ti has pm- Zs-
ptoyed but tyni University or Minnesota graduates to be the -Chief Administrative Officer dunn tt# century. Moreover, EN, . \
.. . ,University of Minn ita graduate vii 1)actor's degree has -.&
.% ....._ 'never been th ntendent ,,in. MnlipaPotis,' St. Paul' or, ':,..
btilutft.--Furtk e, iversity of Minnertaaweduatef:donot head _the m: 101 :SC I dis,t, ts'airt aft ot\theAlpeti 1forty -nine states. °
1' ' e.i . iWhile the, tack of SLIC of Minnesota traine4t angItifites- ... A
..
may be 'attritiuted to .- eral factors, the limiteil.,pool of, , .
. fraiild ent with 6ielicliMnistreitive -expetience is the :major c T =reedy for thii situation 'een iff"r7nalnie,
,arid aggreisift'apprpacti 'to the -recp.iiting acrdIrliningt of . ;solloot superinferiderris. " , -. 7+ '. -: ,
7 ' -. .,
?az 1t , _ * 4 't - -
' I ... .....1 . . ,...,.. , - .,. '. - r . .,,,. .. , '.-. i a ,
,-.;" V i. . . ..
134: i.. . 'we . , ,8-

8
5
.-
OSITIONS RADUATESFFIQIIHE UNIVERSITY OF
MINNESOTA (TWIN CITIES CAMPUS)- WITH MA4ORS,IN EDUCATION4ADMINISTRATION, DURING THE PAS_ T
YEARS .
--___
.- - :
Position__
.?.
.ELEMENTARY PRINCIPAL
? SECONDARY PRINCIPAL
SUPERINTE&ENT.
COLLEGE TEACHING
O1 ER
MIScELLANEOUS;fTEACHER.,S,TUDENT)
TQTAL
,LOCATION -t:
Minnesota' Out -of-
StateTotal
.
_.
Percent ofAn`Positions
_
.23 , 24 -?* 12.6
41 .50 26:4 t
14 2 16
7 16''. - 8A
2B' '. 17 46 -24.2
132 , 6 38 ?0.0r
,'148 42% *190 100.0
, s_
,
..... s.
c1.

The need for 336 trained educational administrators in the
next five years, as indicated in Table 33, is well below the 407
which was projected by the same method three years ago.The major contributor to this scaling down of future needs
can be traced to the outlook for eliminating, positions. In 1973the siipdrintendents expected to lose but 40 positions duringthe 'next five years. Now they are lacing the lose of 135positions between 1975 and 1980. Curiously,,, the number ofanticipated new poSitions is abOufthe' same for both per--ods-179 in 1973 and now 177. Also, again the superinten-
dents expect to add more administrative positions than they
will lose. However, the dreams of additional administrativepositions are now less ambitious. In 19.73 the addition of
-Positiens-w as expected to exceed theioss.orpOsitionstiy.139The figure for the next five year period is 42. A small increase
in retirements is predicted. The 4 shown in Table 33 is 26rnae than expected in the earlier study.
The largest change in admi istrative staffing seems des-
tined to affect the elementary chool principalship during the
next five years. Superin ndents were predicting furtherexpansion of this position justihree years ago., However, as
shown in Table 33, they now say that 64 positions will beeliminated, Interestingly, they do see an expansion of theassistant elementary principalship in the next five years.'The
net result may be the shifting of some principals to assistant
positions as en tents continue to decline and schools are
closed. The ur of superintendents to forecast similarchanges an shifts at the secondary level is a bit strange.Clearly, the recent enrollment losses in the elementaryschools will soon impact the junior and senior high schools.Perhaps superintendents look with disdain upon the prospect
of closing secondary schools. Afte....all, parents have bittefly
resisted the closing of elements schools. The resistance,atthe secondary level may be more than the superintendents
hare willing to endure.
6 2
54