documentos de trabajo -...
TRANSCRIPT

DOCUMENTOS DE TRABAJO
Characterization of the Chilean Financial Cycle, Early Warning Indicators and Implications for Macro-Prudential Policies
Juan Francisco MartínezDaniel Oda
N° 823 Ju l io 2018BANCO CENTRAL DE CHILE
BANCO CENTRAL DE CHILE
CENTRAL BANK OF CHILE
La serie Documentos de Trabajo es una publicación del Banco Central de Chile que divulga los trabajos de investigación económica realizados por profesionales de esta institución o encargados por ella a terceros. El objetivo de la serie es aportar al debate temas relevantes y presentar nuevos enfoques en el análisis de los mismos. La difusión de los Documentos de Trabajo sólo intenta facilitar el intercambio de ideas y dar a conocer investigaciones, con carácter preliminar, para su discusión y comentarios.
La publicación de los Documentos de Trabajo no está sujeta a la aprobación previa de los miembros del Consejo del Banco Central de Chile. Tanto el contenido de los Documentos de Trabajo como también los análisis y conclusiones que de ellos se deriven, son de exclusiva responsabilidad de su o sus autores y no reflejan necesariamente la opinión del Banco Central de Chile o de sus Consejeros.
The Working Papers series of the Central Bank of Chile disseminates economic research conducted by Central Bank staff or third parties under the sponsorship of the Bank. The purpose of the series is to contribute to the discussion of relevant issues and develop new analytical or empirical approaches in their analyses. The only aim of the Working Papers is to disseminate preliminary research for its discussion and comments.
Publication of Working Papers is not subject to previous approval by the members of the Board of the Central Bank. The views and conclusions presented in the papers are exclusively those of the author(s) and do not necessarily reflect the position of the Central Bank of Chile or of the Board members.
Documentos de Trabajo del Banco Central de ChileWorking Papers of the Central Bank of Chile
Agustinas 1180, Santiago, ChileTeléfono: (56-2) 3882475; Fax: (56-2) 3882231

Documento de Trabajo
N° 823
Working Paper
N° 823
Characterization of the Chilean financial cycle, early warning
indicators and implications for macro-prudential policies
Juan Francisco Martínez Banco Central de Chile
Daniel Oda Banco Central de Chile
Abstract
The latest financial crisis has posed several challenges for policymakers about prevention and mitigation measures regarding these episodes. In this respect, the Basel Committee of Banking Supervision (BCBS) has issued a set of recommendations of macro-prudential policies that have been applied in several economies by accommodating them to their local context. In particular, it emerges the Countercyclical Capital Buffer (CCyB) and the Credit-to-GDP gap as a reference for its activation. In this context, this paper describes the Chilean issues relevant to its application, such as the structure of the credit portfolio, changes in macroeconomic and financial cycles, and data restrictions. Then, a set of early warning indicators (EWI) which conforms to these local particularities is proposed. To do this, we analyze and solve some important limitations in the calculation of these metrics: information gaps, coherence to domestic financial structure, and excessive amplitude of local past episodes of fragility. Finally, we discuss some remaining challenges for the application of CCyB in Chile.
Resumen
La última crisis financiera ha planteado varios desafíos para los reguladores sobre las medidas de prevención y mitigación en relación a estos episodios. En este sentido, el Basel Committee of
Banking Supervision (BCBS) ha emitido un conjunto de recomendaciones de políticas macro-prudenciales que se han aplicado en varias economías adaptándolas a su contexto local. En particular, surge el Colchón de Capital Contracíclico (CCyB) y la brecha de crédito a PIB como referencia para su activación. En tal contexto, este documento describe los puntos relevantes para su aplicación en Chile, tales como la estructura del portafolio de créditos, los cambios en los ciclos macroeconómicos y financieros y las restricciones de datos. Luego, se propone un conjunto de Indicadores de Alerta Temprana (EWI) que se ajustan a estas particularidades locales. Para ello, se analizan y resuelven algunas limitaciones importantes en el cálculo de estas métricas: brechas de información, coherencia con la estructura financiera nacional y la excesiva amplitud de los episodios de fragilidad pasados. Finalmente, se discuten algunos desafíos pendientes para la aplicación del CCyB en Chile. *We are grateful to Pablo Carvajal for his excelent research assistance. Special thanks to Rodrigo Alfaro, Solange Berstein, ChristianCastro, Rodrigo Cifuentes, Andrew Powell and Claudio Raddatz, for their comments and suggestions at different stages of this work.The opinions expressed in this article are the authors' own and do not necessarily represent the views of the Central Bank of Chile or its Board Members. Emails [email protected], [email protected].

1 Introduction
The global �nancial crisis of 2008-2009 has evidenced important banking busi-ness regulation gaps on providing stable and e�cient �nancial markets. On the onehand, banks balance sheets and risk tolerance grew excessively. On the other, riskexposures and system-wide perspective of regulation was only partial (Claessens &Kodres, 2014). Accordingly, the macro-prudential policy frameworks have been re-visited and complemented. The Basel Committee of Banking Supervision (BCBS)has made contributions to enhance the banking regulations frameworks across theworld by including features that limit externalities or systemic e�ects caused byparticular institutions. These are focused on anticipate, prevent and prepare the�nancial system to system wide events of �nancial fragility. In particular, in theBasel III framework, the BCBS has proposed the Counter-Cyclical Capital Bu�er(CCyB) as a macro-prudential policy to limit the e�ects of excessive credit growth.
Although the CCyB has only recently been proposed and implemented, itsrationale goes back several decades ago, and it is based on the cyclical behaviorof the economy. There is a vast research stream that has investigated the cyclicalproperties of the macroeconomy. Systematized statistical work can be traced backto early 20th century research, such as Moore (1914), which studies the relation-ship of economic variables to weather conditions. On a more recent contribution,Harding & Pagan (2002) �nd a quanti�cation and characterization of the businesscycle by using a method based on an algorithm that identi�es turning points. Onthe other hand, there is also evidence that suggests that the �nancial variablesbehave in a cyclical and synchronized fashion (Claessens et al. (2011), Martinez& Oda (2017e)). However, �nancial cycles have di�erent characteristics comparedto macroeconomic ones: they have lower frequency and higher amplitude (Borio(2014)). This work also highlights the properties of credit dynamics on anticipat-ing busts and consequently, �nancial fragility. Thus, it proposes to build bu�ersto deal with �nancial procyclicality.
Additionally, several cross country studies propose that �nancial crises arepreceded by an excessive credit growth and point this out as one of the maindeterminants of �nancial fragility (Gourinchas et al. (2001), Laeven & Valencia(2012), Reinhart & Rogo� (2009))1. Consistent with this evidence, it is also ar-gued that in times of macroeconomic booms the perception of risk is distorted andagents tend to over-leverage, either because of myopia or changes in risk tolerance(Minsky (1972, 1982), Shin (2010)).
1For instance, Laeven & Valencia (2012) indicate that about 1/3 of the �nancial crises were pre-ceded by excessive credit growth.
2

Consequently, �nancial policies that limit credit overruns are designed tosmooth the cycle and attempt to correct aggregate risk externalities (BCBS (2010,2017), IMF (2011)). There are various alternatives, some of these include mone-tary policy, credit growth limits, speci�c eligibility restrictions (e.g. Loan-to-value,Debt-to income, etc), and capital and liquidity requirements2, such as the dynamiccapital requirements or CCyB (Dell'Ariccia et al. (2012)). The latter has beenproposed by the BCBS to target a speci�c objective, which is system wide eventsof �nancial fragility that are originated in excessive credit growth (Drehmann &Tsatsaronis (2014)). Mainly, this policy intends to (i) construct bu�ers in times ofbooms and (ii) avoid over-leverage that leads to perverse incentives (Borio (2014),ESRB (2013)). The BCBS proposes its implementation in the capital agreementof Basel III and it is included within the Chilean proposal for a General BankingAct of 2017.
For the activation of the CCyB, the BCBS guidelines (BCBS, 2010, 2011;Drehmann & Tsatsaronis, 2014) and the ESRB recommendations (Detken et al.2014; ESRB, 2014) introduce the Credit-to-GDP gap as the best single indicatorfor anticipating banking crises and hence as a reference in this phase of the im-plementation. However, they also indicate that other indicators and judgementshould complement the CCyB instrument management. Consequently, interna-tional monetary authorities have proposed a series of leading indicators that com-plement the analysis of the activation.
In this paper, in line with the international practice, we select and test a groupof metrics that in our view are more adequate for the Chilean context regardingthe anticipation of periods of �nancial fragility. We start by describing the lo-cal particularities and issues that obey to our quality as emerging economy, andother idiosyncracies. Speci�cally, in our estimations real credit gap (relative toits historical trend), stands out in terms of its anticipating capacity. However, wealso test complementary indicators that illustrate other features of the cycle and
2As Dell'Ariccia et al. (2012) mentions, capital and liquidity requirements have been successful inits di�erent forms, especially to build bu�ers, but less so to counteract credit booms. In particular,the Spanish Dynamic Loan Loss Provisions (DynP) scheme seems a promising alternative. These haveproven to be signi�cant in partially smoothing the 2000s Spanish credit boom (Jiménez et al. (2017)).Although, in theory, the Dynamic Provisioning should work in a similar manner to the CCyB there aresome di�erences. First, the DynP application intends to be automatic whereas the CCyB guidelinesleaves scope for guided discretion. Second, DynP rules a�ect income statements but not balance sheetsor capital ratios directly, as in the case of CCyB. Finally, DynP cannot be adapted to internationalstandard accounting practices, and hence has been discontinued. For more details see Table (5) inAppendix.
3

should be considered for policy analysis. To do this, we analyze and solve someimportant limitations in the calculation of these metrics: information gaps, co-herence to domestic �nancial structure, and excessive amplitude of past episodesof fragility. Finally, after the empirical analysis, in light on the international ex-perience, we highlight and discuss some remaining challenges for the applicationof CCyB in Chile.
This paper is organized as follows. Section 2 describes Chilean �nancial systemcharacteristics and considerations that are relevant for the design and computationof EWI in the context of the CCyB application. Given the particularities raisedin the previous section, Section 3 explains in detail a proposal for the Chileaneconomy. Section 4 analyzes the results of the associated statistical estimates andits capacity to anticipating periods of �nancial fragility in Chile. Section 5 coversrelevant robustness checks of the estimates. Section 6 frames a more general setof indicators. In light to the recent situation of the Chilean �nancial system andthe proposal of EWI and results, Section 7 highlights the current challenges forthe implementation of the CCyB in Chile. Finally, Section 8 concludes.
2 CCyB in the Chilean context
The Chilean banking regulation has not su�ered from major modi�cationssince the 90s. However the framework is about to be changed under the newBanking Act that will include the use of macro-prudential policies, such as theCCyB. There are relevant considerations that we discuss in this sections in respectto the international experience, as a reference for practical issues of application,and we cover Chilean speci�cities that should be accounted for.
2.1 International experience
Although only few countries have activated the CCyB (BCBS (2017)), mostof them have worked for several years to complement the available material thatunderpins its framework and application of this macro-prudential policy (e.g. Bo-rio (2014), Borio et al. (2014), Drehmann & Tsatsaronis (2014)). For instance,as a reference, we have the cases of UK and Spain. Detken et al. (2014), proposeand test several indicators for the case of UK, they highlight the relevance onrelying on complementary indicators that help in the decision making process ofthe CCyB activation and deactivation. In a similar way, Castro et al. (2016)perform a complete literature review and empirical work to test various EWI forthe Spanish economy. They have found that indicators of credit intensity, privatesector debt sustainability, real state and external imbalances are useful comple-
4
ments of the standard Credit-to-GDP gap.
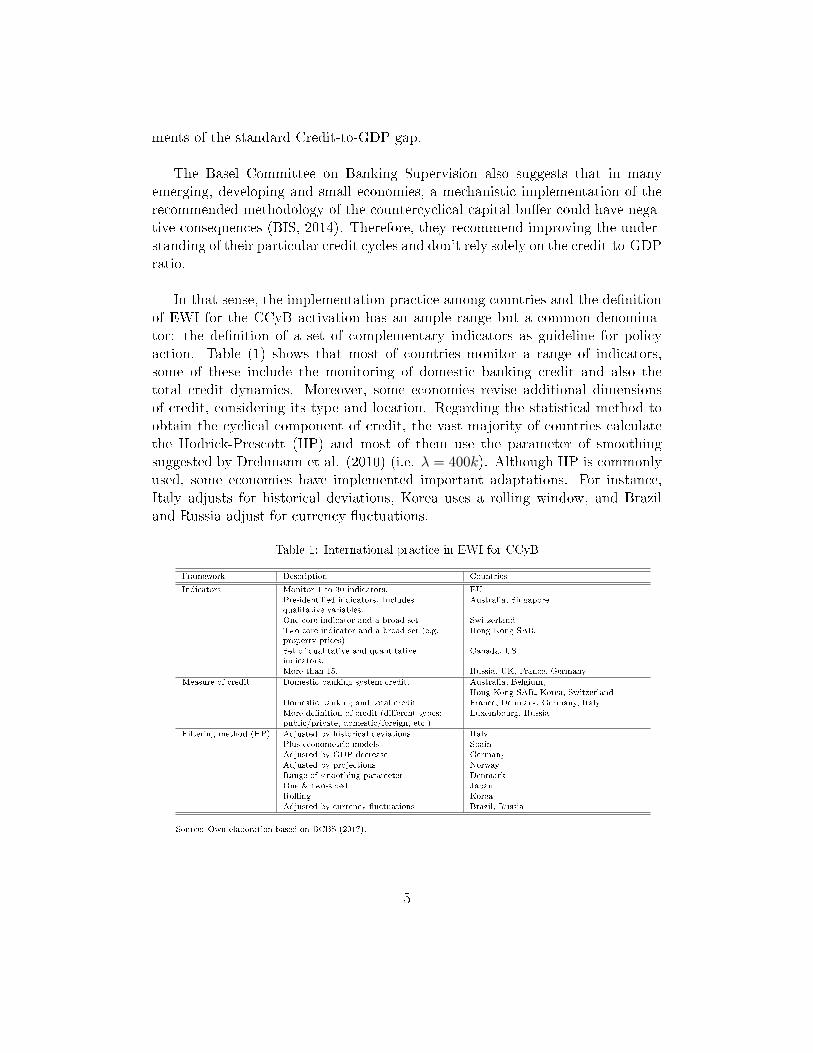
The Basel Committee on Banking Supervision also suggests that in manyemerging, developing and small economies, a mechanistic implementation of therecommended methodology of the countercyclical capital bu�er could have nega-tive consequences (BIS, 2014). Therefore, they recommend improving the under-standing of their particular credit cycles and don't rely solely on the credit-to-GDPratio.
In that sense, the implementation practice among countries and the de�nitionof EWI for the CCyB activation has an ample range but a common denomina-tor: the de�nition of a set of complementary indicators as guideline for policyaction. Table (1) shows that most of countries monitor a range of indicators,some of these include the monitoring of domestic banking credit and also thetotal credit dynamics. Moreover, some economies revise additional dimensionsof credit, considering its type and location. Regarding the statistical method toobtain the cyclical component of credit, the vast majority of countries calculatethe Hodrick-Prescott (HP) and most of them use the parameter of smoothingsuggested by Drehmann et al. (2010) (i.e. λ = 400k). Although HP is commonlyused, some economies have implemented important adaptations. For instance,Italy adjusts for historical deviations, Korea uses a rolling window, and Braziland Russia adjust for currency �uctuations.
Table 1: International practice in EWI for CCyB
Framework Description Countries
Indicators Monitor 1 to 30 indicators. EUPre-identi�ed indicators. Includesqualitative variables.
Australia, Singapore
One core indicator and a broad set SwitzerlandTwo core indicator and a broad set (e.g.property prices)
Hong Kong SAR
Set of qualitative and quantitativeindicators.
Canada, US
More than 15. Russia, UK, France, Germany
Measure of credit Domestic banking system credit. Australia, Belgium,Hong Kong SAR, Korea, Switzerland
Domestic banking and total credit France, Denmark, Germany, ItalyMore de�nition of credit (di�erent types:public/private, domestic/foreign, etc.)
Luxembourg, Russia
Filtering method (HP) Adjusted by historical deviations ItalyPlus econometric models SpainAdjusted by GDP decrease GermanyAdjusted by projections NorwayRange of smoothing parameter DenmarkOne & two-sided JapanRolling KoreaAdjusted by currency �uctuations Brazil, Russia
Source: Own elaboration based on BCBS (2017).
5

2.2 Chilean particularities
The BCBS calculates the Chilean Credit-to-GDP ratio by using the publiclyavailable macro-�nancial data and a standard statistical �lter. According to therecommendations of the Basel Committee of Banking Supervision (BCBS, 2010;Drehmann & Tsatsaronis, 2014), the Credit-to-GDP gap is the best single earlywarning indicator (EWI) of �nancial crisis for a wide range of countries and it isan adequate trigger for the activation of the CCyB. As proposed by Drehmannet al. (2010), this indicator is calculated using a one-sided Hodrick-Prescott �lterwith parameter of trend-smoothing (i.e. lambda) of 400k for quarterly data. Thenumerator of the ratio contains components that meet a broad de�nition of credit,and the denominator includes the quarterly �ow of GDP. For the Chilean case,the BCBS considers series that start in 1983, and the �ltered Credit-to-GDP (i.e.the gap), starts in 1993, after processing 10 years of data.
Although the parameterization and calculations used by the BCBS in estimat-ing the Credit-to-GDP ratio allow them to use a uniform criteria that works wellfor the majority of countries (Drehmann et al., 2010; Drehmann & Tsatsaronis,2014), the Chilean particularities call for taking into account data and method-ological considerations in the estimation of adequate EWI. In this respect, werevise the usage of credit information and data coverage.
2.2.1 Credit de�nition and Chilean �nancial structure
Despite the advantages of using the BCBS core Credit-to-GDP gap indicator,its properties rely heavily on the de�nition of "credit". Additionally, as proposedin Giese et al. (2014) and Castro et al. (2016), di�erent features of �nancialcrises can be anticipated and captured with alternative indicators that may per-form better than the BCBS proposal. Hence, the activation of the CCyB shouldconsider a set complementary indicators as it is the international practice.
Following Drehmann et al. (2011), one of the main advantages of the Credit-to-GDP gap is that - for a variety of countries (mainly advanced economies) - it isthe best in capturing system-wide vulnerabilities that end up a�ecting the bank-ing sector. In the numerator, the BCBS ratio uses a broad de�nition of credit tothe non-�nancial private sector - namely total credit -, which includes local andforeign banking credit, bonds, and debt associated with foreign direct investment(FDI)3.
3The BCBS publishes this indicator for a set of countries in its site and is publicly available.
6

In the case of Chile, as opposed to most advanced economies, the dynamics ofthe local banking loans behaves di�erently to other sources of credit, especiallyto those coming from foreign markets. In particular, the di�erences of the totalcredit growth compared to the local banking credit is explained by the issuance ofexternal bonds during the period from 2009 to 2015, and to obligations associatedwith FDI. As indicated in Chapter III of the Central Bank of Chile's FinancialStability Report for the second half of 2016 (CBC, 2016), the increase in foreigndebt is concentrated in bond instruments of large local corporations, generallywith low credit risk and low exposure to banking sector credit. On the otherhand, the FDI associated debt is originated in a matrix-subsidiary relationship,which distinguishes it from other types of funding sources and is a characteristicof large international commodity producers (e.g. mining companies). Adding upthe two e�ects, the sharp increase in foreign debt in recent years is associatedwith international favorable �nancial conditions, without necessarily augmentingthe exposure of the banking system to the Chilean corporate sector (Figure (1)).
Figure 1: Non-bank credit incidence on the Credit-to-GDP (1)(2)(3)
(percentage)
60
80
100
120
140
160
09 10 11 12 13 14 15 16
Local Bonds Foreign Credit Foreign Debt LFDI BCBS (1) Banking Credit (2)
(1) Excludes other local loans such as leasing and non-bank factoring, loans withcommercial houses. Possible di�erences with external data due to the exchange rateused.(2) Credit from all sectors to the non-�nancial private sector as a percentage ofannual GDP.(3) Banking as a percentage of annual GDP.Source: Own elaboration based on information from BIS and CBCh.
Using the same sample period and �ltering technique than the one proposed
7
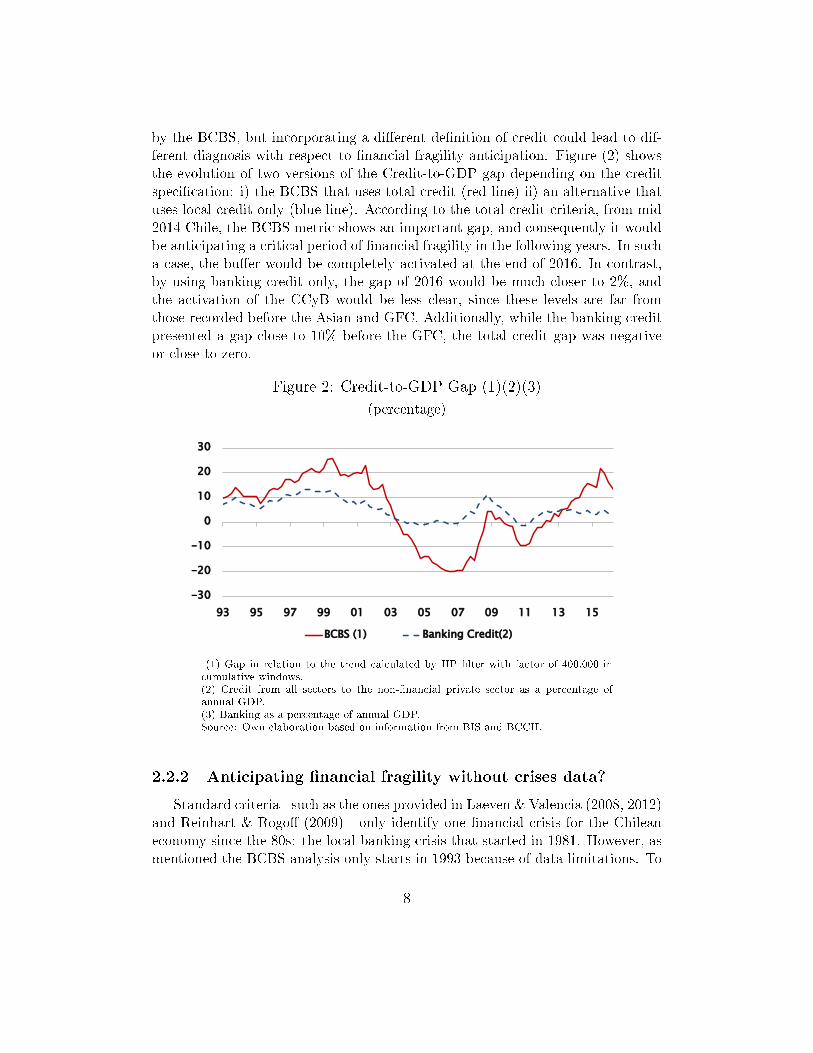
by the BCBS, but incorporating a di�erent de�nition of credit could lead to dif-ferent diagnosis with respect to �nancial fragility anticipation. Figure (2) showsthe evolution of two versions of the Credit-to-GDP gap depending on the creditspeci�cation: i) the BCBS that uses total credit (red line) ii) an alternative thatuses local credit only (blue line). According to the total credit criteria, from mid2014 Chile, the BCBS metric shows an important gap, and consequently it wouldbe anticipating a critical period of �nancial fragility in the following years. In sucha case, the bu�er would be completely activated at the end of 2016. In contrast,by using banking credit only, the gap of 2016 would be much closer to 2%, andthe activation of the CCyB would be less clear, since these levels are far fromthose recorded before the Asian and GFC. Additionally, while the banking creditpresented a gap close to 10% before the GFC, the total credit gap was negativeor close to zero.
Figure 2: Credit-to-GDP Gap (1)(2)(3)
(percentage)
-30
-20
-10
0
10
20
30
93 95 97 99 01 03 05 07 09 11 13 15
BCBS (1) Banking Credit(2)
(1) Gap in relation to the trend calculated by HP �lter with factor of 400,000 incumulative windows.(2) Credit from all sectors to the non-�nancial private sector as a percentage ofannual GDP.(3) Banking as a percentage of annual GDP.Source: Own elaboration based on information from BIS and BCCH.
2.2.2 Anticipating �nancial fragility without crises data?
Standard criteria - such as the ones provided in Laeven & Valencia (2008, 2012)and Reinhart & Rogo� (2009) - only identify one �nancial crisis for the Chileaneconomy since the 80s: the local banking crisis that started in 1981. However, asmentioned the BCBS analysis only starts in 1993 because of data limitations. To
8
overcome this issue, we rely on Martínez et al. (2017) data compilation.
Martínez et al. (2017) de�ne three Chilean �nancial fragility periods for thesame time span: i) the local banking crisis (LBC) (in the early 80s); and themanifestation of external phenomena ii) the Asian crisis (AC) (in the late 90s)and iii) the Global Financial crisis (GFC) (around 2008). The LBC fragility pe-riod roughly coincides with the one de�ned in Laeven & Valencia (2008, 2012)(i.e. 1981-1985) and it is the one with the highest impact on credit contraction,pro�tability and credit risk, whereas the e�ect on these variables for subsequentperiods of fragility is milder but still signi�cant.
The identi�cation of EWI that anticipate �nancial fragility periods becomesdi�cult when the time span does not include a crisis. This is mainly because thesignals that the �ltering procedure produces may not be strong enough to identifyand anticipate milder fragility periods. Therefore, BCBS recommends having asmuch depth historical data as possible. For example, the Banca d'Italia uses thee�ort of De Bonis et al. (2012), to extend its series of credit and economic activ-ity until the nineteenth century (Alessandri et al., 2015), and thus improve theadjustment of the indicators, mainly given that most of the crises in its bankingsystem occurred prior to 1950.
In addition, one bene�t of extending the historical depth of the indicators andincorporating the LBC is that there is a well-documented detail of the channelsthrough which a di�erent kind of shocks were transmitted to the local economyand how this impacted on the banking. It is useful as a case study, particularlyto review the macro-�nancial context that led to the crisis and the need for bankintervention. This is despite the fact that many of the conditions of regulationand macroeconomic framework have changed. Indeed, the drastic change in theamplitude and frequency of the credit cycle in the Chilean economy implies thatan adjustment must be made to the gap estimates (section 2).
2.2.3 CCyB for emerging economies
Chile is an emerging country and as such has su�ered some phenomena thatmust be taken into account when implementing CCyB and develop metrics thatallow its activation. In particular, it highlights the �nancial deepening it has suf-fered in the last 50 years and the status of small and open economy, which makesit relatively more vulnerable to external shocks. Given the above, in relation todetermining the appropriate EWIs as a reference for the activation of CCyB, it isnecessary to have considerations about: i) incorporation/discard of past informa-tion and ii) macroeconomic context and its implications in the credit cycle.
9

As for the considerations related to the information to be used, in a coun-try like Chile the cycles of macroeconomic and �nancial variables have changedradically in their amplitude and frequency since the LBC. The development of amore robust macroeconomic and regulatory framework has reduced the volatilityof cycles and their impact on the real economy. On the other hand, the frequencyof fragility events has tended to increase because the opening of the local economyhas made it more susceptible to global phenomena, such as the Asian and global�nancial crisis, although, as noted by their e�ects have been much lower than inthe past. Thus, the procedure for calculating gaps in relation to historical datashould consider an adjustment that is more relevant to the most recent observa-tions, without losing the advantages of greater historical depth.
A large exposure to the global economy may lead policy makers to focus theactivation of the CCyB on external imbalances of the real and �nancial activ-ity because eventually the local and external cycles would be synchronized. Inparticular, the idea of linking the activation of CCyB with misalignments of theglobal �nancial cycle arises. These mismatches would eventually have e�ects onchanges in capital �ows and consequently on the external �nancial position of theeconomies, which in turn could give rise to episodes of vulnerability (Reinhart &Rogo�, 2009, and others).
Although it is advisable to take external vulnerabilities into account becauseit has some relation to the occurrence of past crises, especially the LBC (Laeven& Valencia, 2008, 2012; Reinhart & Rogo�, 2009, and others), it is necessaryto contrast it with relevant recent evidence. Regarding the relationship betweencapital �ows and the global �nancial cycle, the evidence is mixed. On the onehand, Baskaya et al. (2017) �nd signi�cant e�ects of higher global risk appetitein capital �ows to an emerging economy, such as Turkey. However, Cerutti et al.(2017) �nd little evidence of the global �nancial cycle in capital �ows for a varietyof countries.
Thus, due to their relevance in the possible e�ects, metrics associated with theexternal vulnerabilities of the Chilean economy should be considered, althoughnot as signals, but as a context of vulnerability that favors the transmission ofshocks. For example, it can be noted that only the LBC has relevant movementsassociated with the current account. If the potential activation of the bu�er hadbeen analyzed, then the de�cit should have been taken into account. However,in the more recent crises (AC and GFC), the signaling powerof external situa-tion is more dubious since both episodes occurred in a context of current accountsurplus. Very likely the impact of both recent episodes was mitigated by a more
10
robust internal and external macroeconomic contexts. Put di�erently, the exter-nal macroeconomic situation provided a less favorable context of vulnerability.
Finally, it has to be stressed that the CCyB policy has a very precise target,which is not seeking to protect the local economy against all sources of shocks. In-stead, it is designed and targeted to build bu�ers and avoid the volatility of cyclesin the face of crises caused by excessive credit growth (Drehmann & Tsatsaronis(2014)). In this way, the CCyB is not oriented to avoid the external vulnerabilityper se, for that purpose are available other macro-prudential policies that can beapplied coordinately.
3 EWI for the Chilean �nancial system
The objective of the framework is to de�ne a leading indicator which ade-quately anticipates periods of �nancial distress in order to trigger the CCyB. Inthe Chilean context there are only few attempts to de�ne early warning indicators,but they are focused on a less accurate de�nition of �nancial fragility and with amicro instead of a macro approach.4
The literature suggests the use of the "gaps" as �nancial indicators. Thesegaps are de�ned as deviations of each variable (measured in percentages) from itstrend. The gap also is equivalent to the series cyclical component. In particular,the construction of gaps are based on the estimated cycles by commonly usedtime-series frequency �lters. Borio & Lowe (2002, 2004) proposed the use of theCredit-to-GDP gap as an indicator of the �nancial cycle.
3.1 Filter alternatives5
The symmetric moving-average (SMA) �lters basically estimates the cyclicalcomponent using a weighted average of the leads and lags of the series. Baxterand King (1999) de�ne the BK �lter to be the SMA �lter with q leads and lagsterms that minimized the di�erence between the coe�cients in their �lter and anideal band-pass �lter. The band-pass �lters removed stochastic cycles correspond-ing with the unwanted frequencies (outside of a speci�c range or band of lengthof cycle). There is a trade-o� in choosing q: larger values of q cause the gain
4For instance, Ahumada & Budnevich (2001) uses the past-due loan index as an indicator of creditrisk, which also characterize periods of �nancial fragility. They found that an increase of the capitallevels tends to reduce the credit risk. Also, they establish that a high credit growth is related to anincrement of the nonperforming loans in about 9 to 12 months later, especially for foreign banks.
5For more details, see Borgy et al. (2009)
11

of the BK �lter to be closer to the gain of the ideal �lter, but larger values alsoincrease the number of missing observations in the �ltered series, though. On theother hand, Christiano & Fitzgerald (2003) propose a CF �lter that minimize themean squared error between the estimated component and the true component,with the assumption that the series is a random-walk process. Thus, this �lter isoptimal for random-walk process and is not symmetric.
A di�erent approach is to obtain the cycle of a series by removing its trend.Hodrick & Prescott (1997) state the HP �lter a trend-removal technique. Thetrend is estimated by minimizing the distance of the estimated trend from theseries and the time variation of the trend. Since there is a trade-o� betweenboth objectives, the parameter lambda de�nes the relative weight of the secondcomponent. Therefore, the larger the lambda, the smoother the trend.
Table 2: Filter alternatives
Hodrick-Prescott Baxter-King Christiano-Fitzgerald(1997) (1999) (2003)
Type High-pass Band-pass Band-passParameters Smoothing parameter Lambda Range of low and high fre-
quencies. Number of leadsand lags
Range of low and high fre-quencies
Series Unspeci�ed Covariance-stationary pro-cesses
Random-walk process
Leads/Lagsweighting
None Symmetric Symmetric and Asymmetric
Loss function Weighted function of the errorbetween trend and actual val-ues, and time changes of thetrend
Error between the coe�cientsin their �lter and the idealband-pass �lter
Mean squared error betweenthe estimated component andthe true component
After the cycle is estimated, we evaluate its predictive power of the �nancialfragility episodes. This requires two components, the de�nitions of the fragilityperiods and the metric of anticipation power. The targeted periods are takenfrom Martinez et. al (2017). On the other hand, the Receiver Operating Char-acteristic (ROC) analysis quanti�es the accuracy of a variable to discriminatebetween states. It is based on the sensitivity, the fraction of correctly classi�edpositive cases; and the speci�city, the fraction of correctly classi�ed negative cases.Typically, the procedure use the complement of the speci�city, that is, the falsepositives. Both metrics constructs the ROC curve. Finally, the performance of anindicator is usually summarized by the area under the ROC curve (AUROC) thatcan be interpreted as the probability that the correct classi�cation of the variablewill be greater than a random variable (Detken et al., 2014).
12

3.2 Data
In order to contrast the quality of the signal of the leading indicators, we needto incorporate the maximum number of stress events in the sample. Therefore, weuse quarterly data from 1970q1 to 2017q1. The data contained in this sample pe-riod, especially before the 80's, were collected from the SBIF archives, processedand analyzed in Martinez et. al (2017).
Bank loans before the 80s represented less than the 50% of the annual GDP(Figure (3)). Considering the development of this sector in those years, relativesmall changes respect to the GDP are related to a high volatility in the creditgrowth. Nonetheless, the Credit-to-GDP grew faster and steadily until the �rstfragility period without any evident signal of distortion. This kind of trend hasnot been shown after the local banking crisis. However, we observe that beforefragility periods the credit grew faster than the GDP, which con�rms the evidenceshown in Drehmann et al. (2010).
Figure 3: Banking Credit-to-GDP (1)
(percentage)
10
30
50
70
90
-60
-30
0
30
60
72 75 78 81 84 87 90 93 96 99 02 05 08 11 14 17
GDP Growth Credit Growth Credit-to-GDP (RHA)
(1) The gray areas represent periods of �nancial fragility delimited according toMartínez et al (2017e).Source: Own calculations based on information from the SBIF and Central Bank ofChile.
4 Results
Following the international practice (BCBS, 2017), we test the anticipatingproperties of the Credit-to-GDP gap as a leading indicator making some relevant
13

distinctions. Given the structure of the Chilean �nancial system, we also revisethe cyclical component associated with the real total local banking credit, whichis not a�ected by the dynamic of the GDP. Additionally, we slightly modify thestandard time series �ltering framework - used by the BCBS - to address struc-tural breaks occurred in the Chilean economy.
Typically, the methodologies are based on �lters that uses one-sided samples.In other words, older observations have a permanent in�uence in the estimations.Accordingly, if the cycle drastically changed in terms of frequency, amplitude ortrend, the results are biased. All in all, we opted to use a Hodrick-Precott �lterwith a lambda of 400k using a rolling window of 10 years6.
A relative high Banking Credit-to-GDP gap anticipates the local banking cri-sis and the Asian crisis in about 2 years (Figure (4)). But, the signal was toolow to have foreseen the recent global �nancial crisis. On the other hand, thismethodology outperforms the BCBS calculations. For instance, the latter fails toidentifying the latest crisis, and the crossed the 10% threshold in September 2014(as in December 1995) but there is no evidence of a crisis so far.
6Robustness check of this method is described on the next section.
14

Figure 4: Banking Credit-to-GDP Gap vs BCBS (1)(2)(3)
percentage
-60
-40
-20
0
20
40
60
78 81 84 87 90 93 96 99 02 05 08 11 14 17
BCBS Banking Credit-to-GDP (3)
Local
Banking
Crisis
Asian
Crisis
Global
Financial
Crisis
BCBS
(1) Based on Hodrick-Prescott �lter with lambda equal to 400,000. The BCBS usesthe total private credit to GDP and the proposal only the banking component.(2) The gray areas represent periods of �nancial fragility delimited according toMartínez et al (2017e). The red dotted line represents the threshold of 10%.(3) The proposal also considers a 10 year rolling window for the calculation of thecyclical component.Source: Own calculations based on information from the SBIF, BCBS and CentralBank of Chile.
With the banking credit gap, we are able to anticipate all the fragility periodsin the sample with an average of 3 years, although the signal of the recent crisisis low (Figure (5)).
15

Figure 5: Banking Credit Gap vs BCBS (1)(2)(3)
(percentage)
-80
-40
0
40
80
78 81 84 87 90 93 96 99 02 05 08 11 14 17
BCBS Banking Credit (3)
Local
Banking
Crisis
Asian
Crisis
Global
Financial
Crisis
BCBS
(1) Based on Hodrick-Prescott �lter with lambda equal to 400,000. The BCBS usesthe total private credit to GDP and the proposal only the banking component.(2) The gray areas represent periods of �nancial fragility delimited according toMartínez et al. (2017e). The red dotted line represents the threshold of 10%.(3) The proposal also considers a 10 year rolling window for the calculation of thecyclical component.Source: Own calculations based on information from the SBIF, BIS and CentralBank of Chile.
Besides, we compare the rolling window HP �lter with other commonly used�lters such as Band-pass �lter Christiano-Fitzgerald (CF). Since CF �lter is notsymmetric, it can estimate the cyclical components upon the end of the sample.Notice that the objective of the framework is to formulate real time policies. Say-ing that, we have to use all the available information at moment of the policydecision and without delay7.
According to the AUROC analysis8, the calculation of the Credit-to-GDP gaphas an optimal window of the rolling HP �lter close to 9 years with a lag of 9quarters to anticipate fragility periods. In the case of the CF �lter, the best com-bination is a window of 10 years and a lag of 5 quarters (Figure(6)).
7For example, Baxter-King �lter uses leads. So the value for a particular date cannot be calculateduntil the lead data is observed
8See Detken et al. (2014) for further details.
16

Figure 6: Banking Credit-to-GDP Gap - AUROC
5 7 9 111315
17192123
25
0.0
0.2
0.4
0.6
0.8
1.0
48
1216
20
AUROC
Hodrick-Prescott
0.0-0.2 0.2-0.4 0.4-0.6 0.6-0.8 0.8-1.0
5 7 9 111315
17192123
25
0.0
0.2
0.4
0.6
0.8
1.0
48
1216
20
AUROC
Christiano-Fitzgerald
0.0-0.2 0.2-0.4 0.4-0.6 0.6-0.8 0.8-1.0
Source: Own calculations based on information from the SBIF and Central Bankof Chile.
In the case of Credit gap, the combination of window and lags rest on twooptions, a window of 20 years and a 5 quarters lag, and a 10 year window with alag of 12 quarters (Figure(7)). Since it is recommended an anticipation of about3 years, we choose a rolling window of 10 years. Then, the higher AUROC for theCF �lter is reached with a window of 8 years and a lag of 14 quarters.
Figure 7: Banking Credit Gap - AUROC
5 7 9 111315
17192123
25
0.0
0.2
0.4
0.6
0.8
1.0
48
1216
20
AUROC
Hodrick-Prescott
0.0-0.2 0.2-0.4 0.4-0.6 0.6-0.8 0.8-1.0
5 7 9 111315
17192123
25
0.0
0.2
0.4
0.6
0.8
1.0
48
1216
20
AUROC
Christiano-Fitzgerald
0.0-0.2 0.2-0.4 0.4-0.6 0.6-0.8 0.8-1.0
Source: Own calculations based on information from the SBIF and Central Bankof Chile.
Given the previous calculations, we take a window of 10 years as a standard.
17

The AUROC indicator in this cut shows that the Credit gap has a stronger rela-tion with fragility periods than the Credit-to-GDP gap (Figure (8)). Furthermore,the rolling version of the �lter is more informative than its one-sided counterpart.On the other hand, both HP and CF �lters have an AUROC over 0.8.
Figure 8: AUROC by lag
(index)
0.4
0.6
0.8
1.0
45678910111213141516
Lag (quarters)
Credit CF (Rolling)
Credit HP (Rolling)
Credit HP (One-side)
C/GDP CF (Rolling)
C/GDP HP (Rolling)
C/GDP HP (One-side)
Source: Own calculations based on information from the SBIF and Central Bankof Chile.
Nonetheless, the optimal lag of the rolling HP �lter is 12 quarters (3 years)versus 10 quarters of the CF �lter (Table (3)). In that sense, the proposed method-ology gives a reasonable longer period to accumulate capital. In the case of usingthe Credit-to-GDP gap, the rolling HP provides a better AUROC.
Table 3: Area Under the Receiver Operating Characteristic (AUROC)
3 years Min Max Lag (years)
Banking credit
HP Rolling window 0.88 0.61 0.88 3.00HP One-sided 0.80 0.65 0.86 2.25Christiano-Fitzgerald 0.86 0.76 0.89 2.50
Credit-to-GDP
HP Rolling window 0.74 0.63 0.83 2.00HP One-sided 0.62 0.48 0.80 1.50Christiano-Fitzgerald 0.67 0.61 0.83 1.25
Source: Own calculations based on information from the SBIF and Central Bank of Chile.
As mentioned before, the international evidence suggest a threshold of 2% togradually activate the CCyB and a threshold of 10% to be fully implemented
18
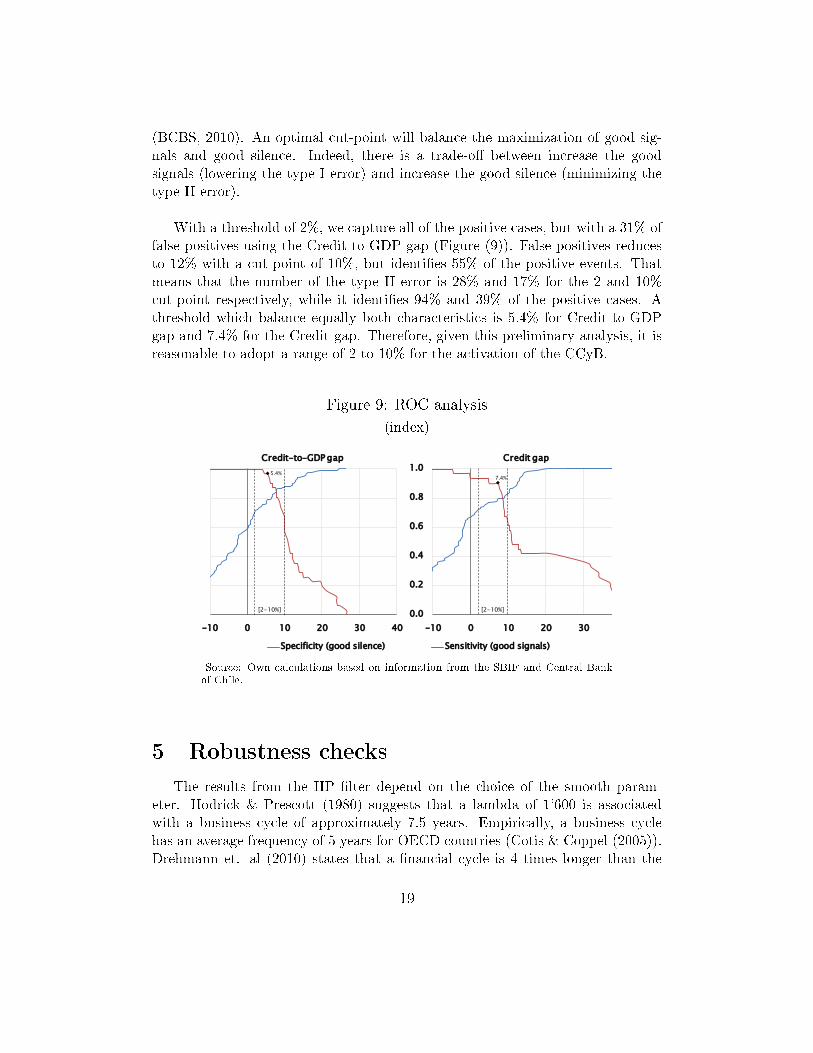
(BCBS, 2010). An optimal cut-point will balance the maximization of good sig-nals and good silence. Indeed, there is a trade-o� between increase the goodsignals (lowering the type I error) and increase the good silence (minimizing thetype II error).
With a threshold of 2%, we capture all of the positive cases, but with a 31% offalse positives using the Credit-to-GDP gap (Figure (9)). False positives reducesto 12% with a cut-point of 10%, but identi�es 55% of the positive events. Thatmeans that the number of the type II error is 28% and 17% for the 2 and 10%cut-point respectively, while it identi�es 94% and 39% of the positive cases. Athreshold which balance equally both characteristics is 5.4% for Credit-to-GDPgap and 7.4% for the Credit gap. Therefore, given this preliminary analysis, it isreasonable to adopt a range of 2 to 10% for the activation of the CCyB.
Figure 9: ROC analysis
(index)
0.0
0.2
0.4
0.6
0.8
1.0
-10 0 10 20 30 40
Credit-to-GDP gap
Specificity (good silence) Sensitivity (good signals)
0.0
0.2
0.4
0.6
0.8
1.0
-10 0 10 20 30 40
Credit gap
[2-10%] [2-10%]
7.4%5.4%
Source: Own calculations based on information from the SBIF and Central Bankof Chile.
5 Robustness checks
The results from the HP �lter depend on the choice of the smooth param-eter. Hodrick & Prescott (1980) suggests that a lambda of 1'600 is associatedwith a business cycle of approximately 7.5 years. Empirically, a business cyclehas an average frequency of 5 years for OECD countries (Cotis & Coppel (2005)).Drehmann et. al (2010) states that a �nancial cycle is 4 times longer than the
19

real cycle. Using the frequency adjustment proposed by Ravn & Uhlig (2002), thelambda for a cycle around of 15 to 20 years corresponds to 400k.
Table 4: HP lambda selection
1'600 25'600 129'600 400'000
Variable US GDP Credit/GDP Credit/GDP Credit/GDPFrequency Quarterly Quarterly Quarterly QuarterlyCycle 7.5 2x 3x 4xEmpirically 5Reference Hodrick-Prescott Drehmann et. al Drehmann et. al Drehmann et. alYear 1980 2010 2010 2010
Fixing a 10 year rolling window, lambdas of 25.6k to 400k do not change dras-tically the results (Figure (10)). The cycle obtained by a lambda of 1600 is notinformative and is not consistent with the recommendations of the BCBS for �-nancial data. Therefore, the analysis suggests the use of a value of 400k.
Figure 10: Banking Credit Gap by parameter value (1)(2)
(percentage)
-80
-40
0
40
80
78 81 84 87 90 93 96 99 02 05 08 11 14 17
1'600 25'600 129'600 400'000
Local
Banking
Crisis
Asian
Crisis
Global
Financial
Crisis
(1) Based on Hodrick-Prescott �lter using a rolling window of 10 years.(2) The gray areas represent periods of �nancial fragility delimited according toMartínez et al (2017e).Source: Own calculations based on information from the SBIF and Central Bank ofChile.
A disadvantage of the �lters is that they su�ers from the end-point bias9. Onepossible solutions is to use an estimation of future values of the series for the
9The end-point bias arises because the lack of futures values for the last observed data. In the caseof �lters such as Baxter-King, the cycle cannot be calculated for the latest observations.
20

end-points. In our case, we assume a perfect forecast model for data previous of2017q1 (e.g. we use observed future data for each date) and the projections of theMonetary Policy Report of the Central Bank of Chile.
The correction of the end-point reduces the amplitude of the estimated cycles,even for the HP �lter (Figure(11)). Despite that, the usually methods only ade-quately anticipates the local banking crisis. One possible explanation is that theuse of futures values already incorporates and adjusts by the crisis information,incorporating it in the trend and reducing the cycle. In that sense, the bias givesimportant information to anticipate fragility periods. Aside, if we have the correctestimation model, we can just use it to directly predict fragility periods. Thus, weopt for the rolling HP without correction because is simpler and more informative.
Figure 11: Banking Credit Gap with End-point correction (1)(2)
(percentage)
-80
-40
0
40
80
-40
-20
0
20
40
78 81 84 87 90 93 96 99 02 05 08 11 14 17
Rolling HP Baxter-King
Christiano-Fitzgerald Rolling HP (w/o corr.)(RHA)
Local
Banking
Crisis
Asian
Crisis
Global
Financial
Crisis
(1) Based on Hodrick-Prescott �lter using a rolling window of 10 years. All �ltersincludes a lead of 3 years of data. Proyections out of sample based on stress testmodels.(2) The gray areas represent periods of �nancial fragility delimited according toMartínez et al (2017e).Source: Own calculations based on information from the SBIF and Central Bank ofChile.
We also separate the loans dynamic by type of credit. However, the avail-able data only cover the recent crisis10. Nonetheless, its analysis suggest thatConsumer credit gap grew before the global �nancial crisis, while the commercial
10Also the data available for housing prices is limited. See Figure (14) in the Appendix.
21

credit and mortgage were on its trend (Figure (12)).
Figure 12: Banking Credit Gap by type of credit (1)(2)
(percentage)
-50
-25
0
25
50
97 00 03 06 09 12 15
Total Commercial Consumer Mortgage
Asian Crisis Global Financial Crisis
(1) Based on Hodrick-Prescott �lter with lambda equal to 400,000 using a rollingwindow of 10 years.(2) The gray areas represent periods of �nancial fragility delimited according toMartínez et al. (2017e).Source: Own calculations based on information from the SBIF and Central Bank ofChile.
6 Complementary Indicators
As we already mentioned, although the banking credit gap is a good indica-tor to anticipates periods of �nancial fragility, it has to be complemented withmore information in the decision making process of the CCyB activation. Anexcessive credit growth is a relevant determinant of �nancial fragility, however,this is not a unique dimension. Therefore, in order to accumulate bu�ers to facethe downward phase of the cycle, the activation of the CCyB has to considerother sources of risk. For example, a sharp fall in housing prices could generatea signi�cant increase in the delinquency rate of mortgages and represent impor-tant loses to the �nancial system, even if the credit have been growing moderately.
There are two relevant issues to be considered in the selection of core indica-tors. On the one hand, the historical coverage of the data. The EWI property ofthe indicator can be only evaluated if it correctly detected past events. Addition-ally, the metrics have to follow a homogeneous construction criteria in order to�lter accounting or methodological changes. On the other, the availability of the
22

Figure
13:CoreIndicatorsof
System
icRiskHeatm
ap
Cre
dit
BC
BS
Cre
dit-to
-G
DP
Com
merc
ial
Consum
er
Mort
gage
Cre
dit
Com
merc
ial
Consum
er
Mort
gage
Cre
dit C
hange-to
-G
DP
Household
Housin
g P
rice
Bankin
gPast-
due L
oans
Loan-to
-d
ep
osits
Loan-to
-tim
e d
ep
osits
RO
A
Mark
et
IPSA
Cop
per
pri
ce
Macro
GD
P G
row
th
GD
P
Curr
ent
Account-
to-G
DP
Curr
ent
Account
Em
plo
ym
ent
11
12
13
14
15
16
05
06
07
08
09
10
99
00
01
02
03
04
93
94
95
96
97
98
87
88
89
90
91
92
16
78
79
80
81
82
83
84
85
86
10
11
12
13
14
15
04
05
06
07
08
09
98
99
00
01
02
03
92
93
94
95
96
97
86
87
88
89
90
91
78
79
80
81
82
83
84
85
(1)BasedonHodrick-Prescott�lter
withlambdaequalto
400,000usingarollingwindow
of10years.
(2)Theredbox
representperiodsof�nancialfragilitydelimited
accordingto
Martínez
etal.(2017e).
(3)Thedashed
linedelimits3yearbefore
theperiodof�nancialfragility.
(4)Colors
are
basedontherangeofeach
variable.Higher
values
are
coloredin
red,whilelower
values
are
green.Past-dueloansandunem
ployment
havethecolorsreversed.
Source:
Owncalculationsbasedoninform
ationfrom
theSBIF,BIS
andCentralBankofChile.
23
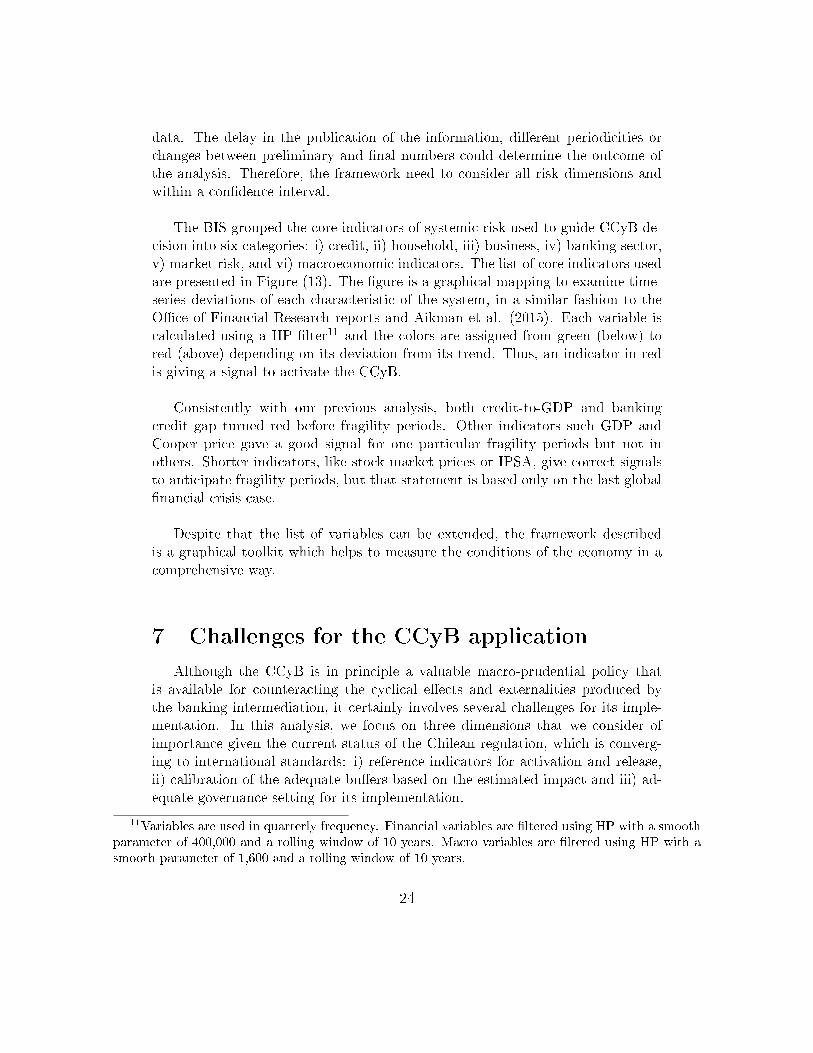
data. The delay in the publication of the information, di�erent periodicities orchanges between preliminary and �nal numbers could determine the outcome ofthe analysis. Therefore, the framework need to consider all risk dimensions andwithin a con�dence interval.
The BIS grouped the core indicators of systemic risk used to guide CCyB de-cision into six categories: i) credit, ii) household, iii) business, iv) banking sector,v) market risk, and vi) macroeconomic indicators. The list of core indicators usedare presented in Figure (13). The �gure is a graphical mapping to examine time-series deviations of each characteristic of the system, in a similar fashion to theO�ce of Financial Research reports and Aikman et al. (2015). Each variable iscalculated using a HP �lter11 and the colors are assigned from green (below) tored (above) depending on its deviation from its trend. Thus, an indicator in redis giving a signal to activate the CCyB.
Consistently with our previous analysis, both credit-to-GDP and bankingcredit gap turned red before fragility periods. Other indicators such GDP andCooper price gave a good signal for one particular fragility periods but not inothers. Shorter indicators, like stock market prices or IPSA, give correct signalsto anticipate fragility periods, but that statement is based only on the last global�nancial crisis case.
Despite that the list of variables can be extended, the framework describedis a graphical toolkit which helps to measure the conditions of the economy in acomprehensive way.
7 Challenges for the CCyB application
Although the CCyB is in principle a valuable macro-prudential policy thatis available for counteracting the cyclical e�ects and externalities produced bythe banking intermediation, it certainly involves several challenges for its imple-mentation. In this analysis, we focus on three dimensions that we consider ofimportance given the current status of the Chilean regulation, which is converg-ing to international standards: i) reference indicators for activation and release,ii) calibration of the adequate bu�ers based on the estimated impact and iii) ad-equate governance setting for its implementation.
11Variables are used in quarterly frequency. Financial variables are �ltered using HP with a smoothparameter of 400,000 and a rolling window of 10 years. Macro variables are �ltered using HP with asmooth parameter of 1,600 and a rolling window of 10 years.
24
The application of the CCyB involves reshaping the traditional macroeconomicmethodology toolkit to account for developments in the �nancial markets and itsinteraction with the real economy. In particular, the state of the art in the designand estimation of metrics that helps decision making process on the CCyB donot involve a major transformation of estimation techniques. Conversely, currentavailable methods are adaptations of well established statistical and economet-ric techniques. The issue is more about the identi�cation of particular charac-teristics of the �nancial and business cycle (Borio, 2014) and its relevance formacro-prudential policy. In this respect, the mere concept of �nancial cycle is asigni�cant digression of the mainstream policy paradigm.
Due to the natural methodological inertia exposed above, in the Chilean casethere are not much gaps in the CCyB associated technical tools. However, in orderto favor its implementation, it is necessary to improve the availability and depthof data for preparing the supporting decision material. The described di�culty isespecially true for �nancial or banking variables, which had been less taken intoaccount, compared to macroeconomic indicators. Despite the work of Martínezet al. (2017) that contributed to extending key �nancial data series until 1970s,it may be still be relevant to increase its coverage.
Although the CCyB guidelines (Drehmann & Nikolau, 2014; ESRB, 2014) in-volves a rigorously guided discretional decision process - given the uncertaintynature of the macroeconomic and �nancial environment - there are several chal-lenges on its application. In fact, there is only little evidence on the e�ects ofthis type of policies as reported by the BCBS (BCBS, 2017)12. This is especiallyrelevant for a country that has not experimented with such policies in the past,as in the case of Chile. In particular, the activation and release timing and theassociated capital charge calibration is key to avoid unintended consequences ofthe CCyB policy, such as exacerbating credit contractions. Additionally, a poten-tial vulnerability associated with this tool is that - despite being well-groundedin theory - it is di�cult to estimate the macro-�nancial economic impact of theCCyB (Drehmann & Tsatsaronis (2014), Kohn (2016), Karstens (2016)). Even ifthe timing and calibration are the correct ones for the CCyB, the policy applica-tion must be coordinated with others to be consistent and e�ective (Borio (2014)).To overcome the di�culty in creating counterfactual scenarios with limited data
12One of the few documented examples es the work of Jimenez et al. (2017) and it regards to thedynamic provisioning (DynP) e�ects in Spain. They �nd that the DynP scheme helped to reduce thee�ects of the global �nancial crisis in the banking credit growth. However, although useful, this policyis not completely equivalent to the CCyB (see Solheim, 2016 for more details).
25

of countries that have implemented the CCyB, an alternative that emerges is thedevelopment of theoretical models that allow to estimate the e�ects of di�erentpolicy measures and regimes in di�erent macroeconomic contexts (Borio (2014)).
An additional problem for CCyB policy is that its target (i.e. �nancial cycle)could re�ect a variety of phenomena which do not necessarily make its applica-tion timely. In particular, when focusing on developments in the credit market,we should be able to distinguish between shocks from demand or supply, whichis not an easy task. If, for example, the excess of credit is caused by a relaxationin the conditions of credit supply, then there is a greater margin of action in thepolicy. If, on the other hand, the shock comes from the demand, then it mayrather be a symptom of e�ective �nancing needs in a growing phase of the busi-ness cycle. Despite the di�culty in distinguishing both phenomena, Jara et al.(2017), provide estimates that allow us to infer the determinants of lending activ-ity, which, when using Senior Loan O�cer Survey (SLOS), distinguish e�ects ofsupply and demand, controlling for macroeconomic and idiosyncratic variables ofbanks. However, this should be further studied and be part of an ample researchagenda, that helps in the CCyB �ne tuning.
Conditional on the institutional arrangement of monetary authorities andbanking supervisors (i.e. whether both institutions are embedded in one au-thority), the corporate governance arrange for the CCyB policy implementationshows multiple alternatives. In the Chilean case, the �nancial supervisor (SBIF)is separated from the CBC what involves a greater e�ort in coordination. How-ever, important steps have already been taken to improve coordination betweenboth authorities, such as the establishment of the Financial Stability Board13 in2014 (Law 20789) and the development of frameworks to monitor aggregate risksfor the stability of the Chilean �nancial system. In addition, the forthcoming re-form of the general banking law and the proposed Financial Market Commission- which has a more focused approach on supervising individual entities - woulddeliver additional bene�ts in terms of the coordinated implementation of macroand micro-prudential policies. Whatever is the coordination framework amongauthorities, international practice (BCBS (2017)) suggests that the activation de-cisions of CCyB are mostly taken according to a framework similar to those ofMonetary Policy. That is, with background provided by the sta� and decisions ofthe board. Once the policy decision scheme is de�ned, it is necessary to preparethe necessary documentation of the policy framework.
13Which is chaired by the Ministry of Finance and where all supervisors are involved, and where itassists in the capacity of hear the CBC.
26
8 Final remarks
Macro-prudential policies are necessary to address the externalities caused bythe behavior of economic agents, especially after the global �nancial crisis, whichhad important consequences for the credit markets of advanced and emergingcountries. In particular, CCyB emerges as an alternative focused on avoiding ex-cessive credit �uctuations and building bu�ers to deal with periods of fragility. Inthis context, the present document analyzes some key aspects in the implementa-tion of CCyB for the Chilean case.
In the case of the Chilean economy, there are some particularities related tothe type and depth of information needed to estimate early warning indicators.Regarding the type of information, an analysis is carried out that shows the typeof exposures of the local �nancial sector and the variability of the economic cy-cle, and it is concluded that the ratio of real bank credit to its historical trendis a good candidate for complementing the BCBS-proposed Credit-to-GDP gapindicator. Then, this hypothesis is con�rmed by comparing several alternativesof indicators and parameterizations, where - according to its 3 year anticipatorypower - the HP �lter is chosen using a smoothing parameter (lambda) of 400kand a rolling window of 10 years.
Subsequently, some relevant challenges for the application of the CCyB inChile are outlined: the improvement of anticipatory properties of EWI over theeconomic cycle, the proper identi�cation of activation of bu�er, the robust estima-tion of impact on �nancial and economic aspects of policy and the organizationalstructure associated with policy decisions.
Finally, although the convergence of banking systems to international stan-dards is recommended, some alternatives for improvement and re�nement in theimplementation of macro-prudential policies, particularly for the Chilean bankingsystem, can be gathered from this analysis.
References
[1] Aikman, D., Kiley, M. T., Lee, S. J., Palumbo, M., and Warusaw-itharana, M. N. Mapping heat in the u.s. �nancial system. Finance andEconomics Discussion Series, 2015-059 (2015).
[2] Alessandri, P., Bologna, P., Fiori, R., and Sette, E. A note onthe implementation of the countercyclical capital bu�er in italy. OccasionalPaper 278, Bank of italy, (2015).
27
[3] Basel Committee on Banking Supervision. Guidance for national au-thorities operating the countercyclical capital bu�er. Working Paper (2010).
[4] Basel Committee on Banking Supervision. Impact and implementa-tion challenges of the basel framework for emerging market, developing andsmall economies. Working Paper, 27 (2014).
[5] Basel Committee on Banking Supervision. Range of practices in im-plementing the countercyclical capital bu�er policy. Implementation (2017).
[6] Baskaya, Y. S., Giovanni, J. d., Kalemli-Ozcan, S., and Ulu, M. F.International spillovers and local credit cycles. Working Paper 23149, Na-tional Bureau of Economic Research, (2017).
[7] Baxter, M., and King, R. G. Measuring business cycles: approximateband-pass �lters for economic time series. The Review of Economics andStatistics 81, 4 (1999), 575�593.
[8] Borgy, V., Clerc, L., and Renne, J.-P. Asset-price boom-bust cyclesand credit: what is the scope of macro-prudential regulation? Working Paper263, Banque de France, (2009).
[9] Borio, C. The �nancial cycle and macroeconomics: What have we learnt?Journal of Banking & Finance 45 (2014), 182�198.
[10] Borio, C., Drehmann, M., and Tsatsaronis, K. Stress-testing macrostress testing: does it live up to expectations? Journal of Financial Stability12 (2014), 3�15.
[11] Borio, C. E., and Lowe, P. W. Asset prices, �nancial and monetarystability: exploring the nexus. Working Paper 114, BIS, (2002).
[12] Borio, C. E., and Lowe, P. W. Securing sustainable price stability:should credit come back from the wilderness? Working Paper 157, BIS,(2004).
[13] Castro, C. E., Estrada, Á., and Martínez-Pagés, J. The counter-cyclical capital bu�er in spain: an analysis of key guiding indicators. Docu-mento de trabajo, 1601 (2016).
[14] Central Bank of Chile. Financial stability report. Tech. Rep. 2016.II,CBC, (2016).
[15] Cerutti, E., Claessens, S., and Rose, A. K. How important isthe global �nancial cycle? evidence from capital �ows. Discussion PaperDP12075, CEPR, (2017).
[16] Christiano, L. J., and Fitzgerald, T. J. The band pass �lter. inter-national economic review 44, 2 (2003), 435�465.
[17] Claessens, S., and Kodres, L. E. The regulatory responses to the global�nancial crisis: Some uncomfortable questions. Working Paper 14/46, IMF,(2014).
[18] Claessens, S., Kose, M., and Terrones, M. Financial cycle: What?how? when? IMF working paper WP/11/76 (2011).
28

[19] Claessens, S., Pazarbasioglu, C., Laeven, M. L., Nedelescu,O. M., Valencia, F., Dobler, M., and Seal, K. Crisis management andresolution: Early lessons from the �nancial crisis. International MonetaryFund, (2011).
[20] Cotis, J. P., and Coppel, J. Business cycle dynamics in oecd countries:Evidence, causes and policy implications. In The Changing Nature of theBusiness Cycle, C. Kent and D. Norman, Eds. Reserve Bank of Australia,(2005).
[21] De Bonis, R., Farabullini, F., Rocchelli, M., and Salvio, A. Aquantitative look at the italian banking system: Evidence from a new datasetsince 1861. Quaderni di storia economica (Economic History Working Pa-pers), 26 (2012).
[22] Dell'Ariccia, G., Igan, D., and Laeven, L. Credit booms and lendingstandards: Evidence from the subprime mortgage market. Journal of Money,Credit and Banking 44, 2-3 (2012), 367�384.
[23] Detken, C., Weeken, O., Alessi, L., Bonfim, D., Boucinha, M. M.,Castro, C., Frontczak, S., Giordana, G., Giese, J., Jahn, N.,et al. Operationalising the countercyclical capital bu�er: indicator selec-tion, threshold identi�cation and calibration options. ESRB Occasional paper5 (2014).
[24] Drehmann, M., Borio, C. E., Gambacorta, L., Jimenez, G., andTrucharte, C. Countercyclical capital bu�ers: exploring options. WorkingPaper 317, BIS, (2010).
[25] Drehmann, M., Borio, C. E., and Tsatsaronis, K. Anchoring coun-tercyclical capital bu�ers: the role of credit aggregates. Working paper 355,BIS, (2011).
[26] Drehmann, M., and Gambacorta, L. The e�ects of countercyclical capi-tal bu�ers on bank lending. Applied Economics Letters 19, 7 (2012), 603�608.
[27] Drehmann, M., Pradhan, K., Wooldridge, P., Santos, M., Vidal,J., and Szemere, R. a. Recent enhancements to the bis statistics. BISQuarterly Review (2016).
[28] Drehmann, M., and Tsatsaronis, K. The credit-to-gdp gap and coun-tercyclical capital bu�ers: questions and answers. BIS Quarterly Review(2014).
[29] European Systemic Risk Board. Recommendation of the european sys-temic risk board of 4 april 2013 on intermediate objectives and instrumentsof macro-prudential policy. O�cial Journal of the European Union C 170/1(2013).
[30] European Systemic Risk Board. Recommendation of the european sys-temic risk board of 18 june 2014 on guidance for setting countercyclical bu�errates. O�cial Journal of the European Union C 293/1 (2014).
29
[31] Gourinchas, P., Valdés, R., and Landerretche, O. Lending booms:Latin america and the world. Working Paper, 8249 (2001).
[32] Harding, D., and Pagan, A. Dissecting the cycle: a methodologicalinvestigation. Journal of monetary economics 49, 2 (2002), 365�381.
[33] Hodrick, R. J., and Prescott, E. C. Postwar us business cycles: anempirical investigation. Journal of Money, credit, and Banking (1997), 1�16.
[34] International Monetary Fund. Macroprudential policy: an organizingframework. Tech. rep., IMF policy paper, (2011).
[35] Jara, A., Martinez, J. F., and Oda, D. Bank's lending growth in chile:The role of the senior loan o�cers survey. Working Papers, 802 (2017).
[36] Jiménez, G., Ongena, S., Peydró, J., and Saurina, J. Macropruden-tial policy, countercyclical bank capital bu�ers, and credit supply: Evidencefrom the spanish dynamic provisioning experiments. Journal of PoliticalEconomy 125(6) (2017), 2126�2177.
[37] Kohn, D. Macroprudential policy: Implementation and e�ectiveness. Speechat European Central Bank, Frankfurt (2016).
[38] Laeven, L., and Valencia, F. Systemic banking crises: a new database.Working Papers, 08/224 (2008).
[39] Laeven, L., and Valencia, F. Systemic banking crises database: Anupdate. Working Papers, 12/163 (2012).
[40] Martinez, J. F., Matus, J., and Oda, D. Taxonomy of chilean �nancialfragility periods from 1975. Mimeo (2017).
[41] Martinez, J. F., and Oda, D. Banking synchronicity index and �nancialcycles. Mimeo (2017).
[42] Minsky, H. P. An evaluation of recent monetary policy. Nebraska Journalof Economics and Business (1972), 37�56.
[43] Minsky, H. P. Financial innovations and �nancial instability: Observationsand theory. (1982).
[44] Moore, H. L. Economic cycles: Their law and cause. New York: TheMacmillan Company, (1914).
[45] Ravn, M. O., and Uhlig, H. On adjusting the hodrick-prescott �lter forthe frequency of observations. The review of economics and statistics 84, 2(2002), 371�376.
[46] Reinhart, C. M., and Rogoff, K. S. This time is di�erent: Eight cen-turies of �nancial folly. Princeton University Press, (2009).
[47] Shin, H. S. Risk and liquidity. Oxford University Press, (2010).[48] Solheim, H. New macroprudential tools: the countercyclical capital bu�er
in norway. Research Paper (2016).
30

9 Appendix
Figure 14: Housing Price Gap (1)(2)
(percentage)
-10
-5
0
5
10
02 04 06 08 10 12 14 16
Rolling HP Christiano-Fitzgerald
Global Financial Crisis
(1) Based on Hodrick-Prescott �lter with lambda equal to 400,000 using a rollingwindow of 10 years.(2) The gray areas represent periods of �nancial fragility delimited according toMartínez et al. (2017e).Source: Own calculations based on information from the CChC.
Table 5: Comparison between CCyB and dynamic provisions
Concept CCyB Dynamic provisions
Instrument Capital ProvisionsLevel Tier 1 Stock/�owType Stock Normative/modelsAccumulation APR Decrease (composition or vol-
ume), capitalizationLoan decrease (it could be recompo-sition). Increase in loan-loss provi-sioning
Liberalization Increase APR Increase loans, write-o�, negativeexpenditures
Limitation Pro-cyclicality of loading risks Pro-cyclicality of risks categoriesE�ects on return Capital (denominator) expenditures (numerator) and capi-
tal (denominator)Activation Policy decision AutomaticUsage System Individual (with aggregated bench-
mark)Externalities incorporation Yes NoPrincipal objetive Capital bu�er (tier 1) Smoothing cycleSecondary objetive Smoothing cycle Capital bu�er (tier 2)
31
Documentos de Trabajo
Banco Central de Chile
NÚMEROS ANTERIORES
La serie de Documentos de Trabajo en versión PDF puede obtenerse gratis en la dirección electrónica: www.bcentral.cl/esp/estpub/estudios/dtbc. Existe la posibilidad de solicitar una copia impresa con un costo de Ch$500 si es dentro de Chile y US$12 si es fuera de Chile. Las solicitudes se pueden hacer por fax: +56 2 26702231 o a través del correo electrónico: [email protected].
Working Papers
Central Bank of Chile
PAST ISSUES
Working Papers in PDF format can be downloaded free of charge from: www.bcentral.cl/eng/stdpub/studies/workingpaper. Printed versions can be ordered individually for US$12 per copy (for order inside Chile the charge is Ch$500.) Orders can be placed by fax: +56 2 26702231 or by email: [email protected].
DTBC – 822 Taxonomy of Chilean Financial Fragility Periods from 1975 Juan Francisco Martínez, José Miguel Matus y Daniel Oda DTBC – 821 Pension Funds and the Yield Curve: the role of Preference for Maturity Rodrigo Alfaro y Mauricio Calani DTBC – 820 Credit Guarantees and New Bank Relationships
William Mullins y Patricio Toro DTBC – 819 Asymmetric monetary policy responses and the effects of a rise in the inflation target
Benjamín García DTBC – 818 Medida de Aversión al Riesgo Mediante Volatilidades Implícitas y Realizadas
Nicolás Álvarez, Antonio Fernandois y Andrés Sagner DTBC – 817 Monetary Policy Effects on the Chilean Stock Market: An Automated Content
Approach Mario González y Raúl Tadle

DTBC – 816 Institutional Quality and Sovereign Flows
David Moreno DTBC – 815 Desarrollo del Crowdfunding en Chile
Iván Abarca DTBC – 814 Expectativas Financieras y Tasas Forward en Chile
Rodrigo Alfaro, Antonio Fernandois y Andrés Sagner DTBC – 813 Identifying Complex Core-Periphery Structures in the Interbank Market
José Gabriel Carreño y Rodrigo Cifuentes DTBC – 812 Labor Market Flows: Evidence for Chile Using Micro Data from Administrative Tax
Records Elías Albagli, Alejandra Chovar, Emiliano Luttini, Carlos Madeira, Alberto Naudon, Matías Tapia DTBC – 811 An Overview of Inflation-Targeting Frameworks: Institutional Arrangements,
Decision-making, & the Communication of Monetary Policy Alberto Naudon y Andrés Pérez DTBC – 810 How do manufacturing exports react to RER and foreign demand? The Chilean case
Jorge Fornero, Miguel Fuentes y Andrés Gatty DTBC – 809 A Model of Labor Supply, Fixed Costs and Work Schedules
Gonzalo Castex y Evgenia Detcher DTBC – 808 Dispersed Information and Sovereign Risk Premia
Paula Margaretic y Sebastián Becerra DTBC – 807 The Implications of Exhaustible Resources and Sectoral Composition for Growth
Accounting: An Application to Chile
Claudia De La Huerta y Emiliano Luttini

DOCUMENTOS DE TRABAJO • Julio 2018