documentos de trabajo spatial price and imperfect ... · pricing systems that may underly...
TRANSCRIPT

Documentos de trabajo
Spatial price and imperfect competition
in regional cattle markets
Alejandro Nin
Documento No. 04/01 Diciembre, 2001

Spatial Price Linkages and Imperfect Competition in
Regional Cattle Markets
Alejandro Nin

1
Spatial Price Linkages and Imperfect Competition in Regional Cattle Markets
Alejandro Nin1
Abstract
This paper analyzes non-competitive market conduct in the U.S. cattle procurement
markets. Rather than relying on estimation of conduct parameters or measures of market
concentration the analysis is based on the dynamics of price adjustment across regional
markets. A VAR model is estimated using a multiple co-integration technique as a test
for spatial market integration. The results are then related with hypotheses about pricing
conduct in spatial markets.
Resumen
Este trabajo analiza la conducta no competitiva en los mercados estadounidenses de
ganado. El análisis está basado en la dinámica de los ajustes de precio entre los mercados
regionales, en lugar de descansar en la estimación de los parámetros de conducta o en las
medidas del grado de concentración del mercado. Se estima un modelo VAR usando una
técnica de co-integración múltiple como una prueba de la integración espacial del
mercado. Los resultados están, por lo tanto, relacionados a la conducta de precios en los
mercados espaciales.
1 The author thanks Janet Netz and Kenneth Foster for their readings and comments of this article at earlierstages of its development.

2
1. Introduction
Market power in the meatpacking industry has been a source of public concern
since the emergence of the “Big Three” (IBP, ConAgra and Excel) during the 1970s and
1980s. The decline in the consumption of red meat in the 1970’s left the industry with
excess slaughter capacity, triggering a wave of mergers and acquisitions that led to
concentration in the number of firms and plants. The result was a drastically changed
industry structure. The industry’s top four firms in 1977 held together about 30 percent of
total beef slaughter capacity. By 1989 concentration measured by the C4, increased to 70
percent. In 1992 these values were further increased to 78 percent and to 82 percent in
1994.
Concern about market power and competition in the industry generated several
studies about the cattle procurement markets in the past years. However, the results are
not definite. Azzam and Anderson (1996) arrive at the conclusion that “the body of
empirical evidence from both Structure-Conduct-Performance (SCP) and New Empirical
Industrial Organization (NEIO) studies is not persuasive enough to conclude that the
(meatpacking) industry is not competitive.” According to these authors, problems of
market definition and data availability at the regional level affect the results of most of
these studies. One of the suggestions for further research made by Azzam and Anderson
is the need to develop empirical pricing conduct models not affected by problems of
market definition, as are the SCP and NEIO models reviewed. “Rather than relying on
estimation of conduct parameters or measures of market concentration, inferences on
coordination could be made from evaluation of price changes between spatially dispersed
locations.”

3
The approach chosen in this work assumes that the phenomenon of spatial
interaction is central to the spatial economic analysis of imperfect competition. Packers
and livestock producers are spatially distributed and the cost of transporting cattle from
producers to packinghouses is significant. The empirical challenge is to deduce non-
competitive conduct from the dynamic price adjustments across the regional cattle
markets. There are two different approaches to this problem in the literature. One is to
formulate hypotheses about pricing conduct consistent with particular price reactions and
feedbacks. This is what Faminow and Benson (1990) do for an analysis of hog prices in
Canada. They assume that both buyers and sellers are spatially dispersed and intra-
regional transport costs are significant. These assumptions imply that the market is a
linked oligopsony. Market integration tests allowed certain predictions of various spatial
pricing systems that may underly oligopsony price formation. Non-competitive pricing,
in the form of a basing-point pricing system for hogs, was detected for a subgroup of
Canadian hog markets between 1965 and 1970.
An alternative approach is structural, where the degree of cointegration between
markets is correlated with concentration. This is the approach adopted by Goodwin and
Schroeder (1991). Their analysis evaluates spatial linkages in cattle markets using
cointegration tests of regional price series. Markets are found to be not fully integrated
but the degree of integration increased with increased concentration. The significant
relationship between increased concentration and increased cointegration is attributed to
either informational economies due to multiplant operations across regions, or increased
coordination among packers because of increased concentration.

4
These studies have some features that limit their contribution to understanding
conduct in a spatially linked oligopsony. The work by Faminow and Benson does not
make a complete use of the time series properties of the data. Specifically there are no
considerations about cointegration of the price series used in the study. Also, the
hypotheses about pricing conduct are formulated using tests for market integration that do
not allow for multiple interactions between markets because they assume that there is a
central market (exogenous) with which all other markets relate (Ravallion, 1986).
Goodwin and Schroeder use cointegration tests to consider long-run price
relationships among regional cattle markets. One of the limitations of this analysis is that
when measuring the relationship between cointegration and concentration, the
concentration variable is national and, hence, out of correspondence with concentration in
the pairs of markets assessed for cointegration. Another limitation is that separate
bivariate analysis, as was used to test for cointegration between regional markets, is a
source of misspecification.
The goal of this paper is to deduce non-competitive market conduct from the
dynamic of price adjustments across the regional cattle procurement markets. This is
achieved by using Johansen’s multiple cointegration technique as a test for spatial market
integration. This technique overcomes the problems of the bivariate analysis used by
Goodwin and Schoeder. It also allows the estimation of a VAR model of market prices
corrected by the cointegration relationship that can be used to test for Granger causality.
This test determines lead-lag relationships and short-run dynamics across markets. The
results will be related with hypotheses about pricing conduct in spatial markets based in
the work by Faminow and Benson and related literature.

5
2. Price Relationships and Competitive Behavior in Spatial Markets
The purpose of this section is to show how prices are linked in spatial markets and
also to relate these linkages to different pricing systems. Faminow and Benson (1990)
use the idea of regional markets being linked through oligopolistic interdependence. The
point is that spatial markets where both buyers and sellers are dispersed and transport
costs are significant should not be characterized as perfectly competitive. Market
integration, that is, the process by which price interdependence occurs, can be directly
deduced by developing a model of spatial oligopolistic competition. The main results
presented by Faminow and Benson are replicated here. Also, references are made to
Scherer (1980). The only differences are in notation. The model refers to oligopoly
relationships, but the relevant conclusions for these study can easily be extended to
oligopsonistic markets.
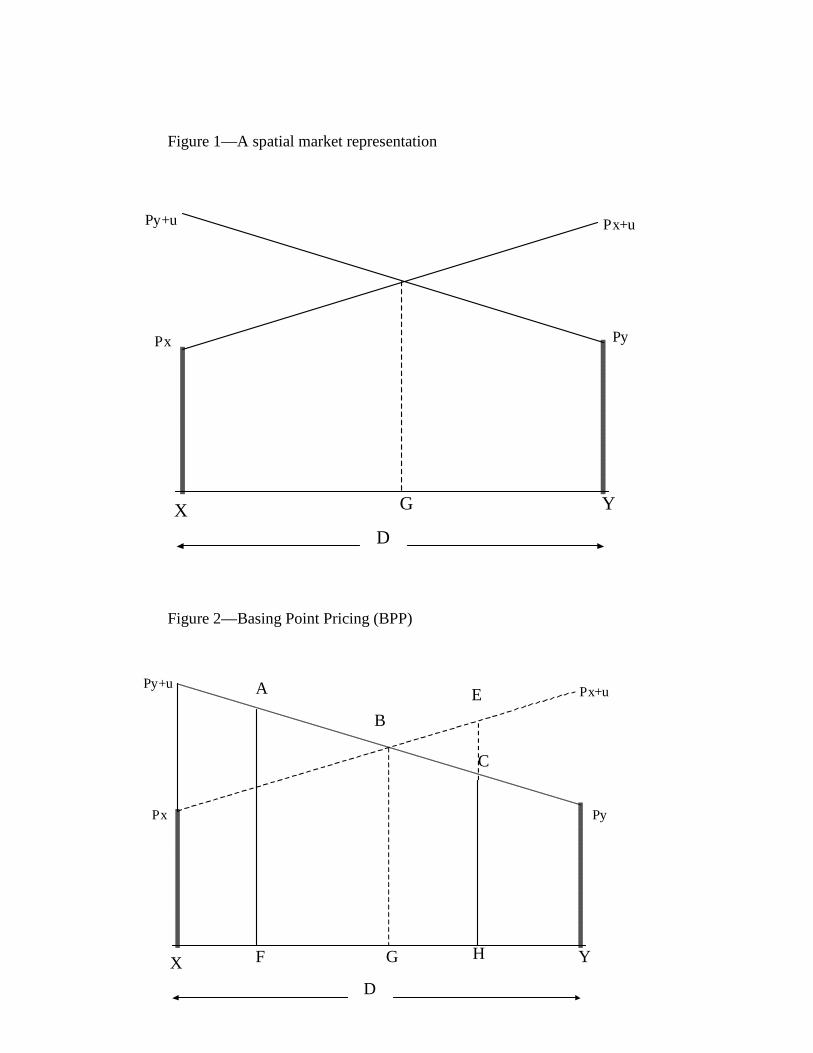
Figure 1 represents a spatial market where the geographic distance between points
is shown in the horizontal axis. There are two firms in the market: a firm located at point
X charging price Px, and a second firm located at Y charging price Py. Firm i has cost
function
(1) iiii QcFC += i = x, y
where Qi is firm i’s output.
Consumers are evenly distributed along the horizontal axis. Assuming for
simplicity that the transportation cost is $1 per unit of distance, the delivered price to any
buying point is

6
(2) P = p + u
where p is the mill price charged by the firm and u is distance. The individual consumer
demand function is defined as
(3) vqv
baup +=+
where q is demand per consumer, a, b and v are constants. Parameter v can be varied to
get a wide range of demand function. If v=1, the demand function is linear. If v>1 the
function is convex upwards. With v<1, the function is concave upwards. If –1<v<0 and
a=0, the function is a constant elasticity demand curve (Benson, 1980).
The total demand faced by each firm is obtained by integrating the individual
quantities demanded by the consumers located over the distance G for firm X and (D-G)
for firm Y.
(4) duupab
vQ
vG
xx
/1
0
)(∫
−−=
(5) duupab
vQ
vGD
yy
/1
0
)(∫−
−−=
Finally, profits for firm i are given by
(6) iiiii FQcp −−= )(π
Using this model we can derive price relationships in spatial markets assuming
different pricing systems. In particular, we need to show how prices are related under
spatial competition (FOB pricing) and compare this with price relationships under
collusion (Basing Point Pricing).

7
FOB pricing
As defined in Scherer (1980), the FOB pricing system implies that “producers
announce a price at which customers can buy, paying their own freight bills. Or if
delivery by the producer is preferred, then actual charges for transportation from the
producing point to the buyer’s destination will be added onto the producer’s price.” As
highlighted by Scherer “this is the only system that entails no geographic price
discrimination, since the price paid by buyers increases in direct relation to shipping
costs, while the seller receives a uniform net price after freight expenses are covered.”
Figure 1 represents competition under FOB pricing. Firm X charges price px and
consumer pays px plus transport cost according to the line px+u. The boundary for firm’s
X market is at G. To the right of this point, consumers will buy from firm Y. The
oligopolistic nature of the FOB pricing model is represented by the boundary conjecture.
The boundary between two FOB pricing firm sales areas occurs where delivered prices
are equal, so G arises where
(7)
)(2
1
)(
DppG
or
GDpGp
xy
yx
+−=
−+=+
The boundary conjecture depends on X’s expectations regarding Y’s price response:
(8)
−= 1
2
1
x
y
x dp
dp
dp
dG
The problem of firm X is then to maximize profit, using price as the decision
variable.
Max xxxxx FQcp −−= )(π

8
Substituting Qx by (4) and taking derivatives with respect to px, the profit maximizing
decision is:
(9)
0)(1)()(1
)()( /1/1/)1(/)1(
=
−−
+−−−++
−−−
−=
++v
xx
vxxx
vv
x
vv
xx
x pab
v
dp
dGGpa
b
vcp
b
vGpa
b
vpa
b
v
dp
dπ
From (9) we can derive an expression for px
(10)
=
xxxx dp
dGGcvbapp ,,,,,
If a firm maximizes profits choosing price, the value of px depends on demand and cost
parameters as well as on the size of firm X’s sales area (G) and the boundary conjecture.
A similar expression can be derived for py
(11)
=
yyyy dp
dGGcvbapp ,,,,,
For given values of the parameters and defining the conjectures, the equilibrium
for the market can be found using equation (7), (10) and (11). This system of equations
shows that the price set by X is, through G, a function of the price at Y. In the same way
py is a function of px. Any change in one of the prices will lead to a reaction of the other
firm, even in the very short run depending on the information available to the firms.
If firms X and Y are located at very distant points in space, we can think of a new
firm selling to consumers in a region between X and Y. Firm Z will sell to an area with
boundary G with firm X and boundary H with firm Y. The price set by Z will have an
expression similar to that of px and py

9
(12)
=
zzzzz dp
dH
dp
dGHGcvbapp ,,,,,,,
Even though X and Y are distant markets, the price set by X is a function of the
price of Y through G, pz and H. If firm Y lowers price py, the boundary of its sales area
would expand. But this change will shrink the areas of firms Z and X in the market,
which will also reduce prices. The price set by X is impacted by the cost and demand
conditions that Z faces and vice versa. This shows that under FOB competition all
markets are related, but the effect of a price change on other markets will depend on the
distance. The larger the number of intermediate selling sites between two specific sellers,
the weaker the price linkage. Initial price reactions and their feedback can lead to
additional price changes as the market adjusts toward a new equilibrium but in this case
the full price adjustments can take time.
Basing Point Pricing
This pricing system has been used by oligopolist selling physically standardized
products whose transportation costs are high relative to the product value and whose
marginal production cost is low relative to total unit cost at less than capacity operation.
The BPP is the result of an oligopoly arrangement, either price leadership or collusion. In
the single basing point system one production point is accepted by common consent as
the basing point, and all prices are quoted as the announced mill price at that point plus
freight to destination (Scherer, 1980).
Figure 2 represents a collusive arrangement between firms X and Y, where Y is
the basing point. Consumers at any point can buy to firm X or Y, because they will be
paying the same price no matter where the product is coming from. Firm Y will charge Py
+ u to any consumer in D. But in this case X will also charge Py + u. On nearby

10
shipments, say at point F, X charge consumers the high freight from Y and consumers
will pay AF. Firm Y can sell all the way up to X, and X can sell at Y if its costs are low
enough to absorb the freight costs that it will incur when selling in the area to the right of
G.
The implications for the relationships between prices of different selling areas are
clear. Prices will move following changes in the basing point and price changes in other
areas will not affect the price in the basing point. So, we can expect that price
determination between markets will go in one direction from the basing point to the rest
of the regions. Also, price relationships between distant markets will be stronger than in
FOB pricing because they will be determined by the leader-follower relationship rather
than being the consequence of reactions between firms in different locations. Under BPP,
producers systematically adhere precisely to pricing rules that enable each to quote
identical delivered prices to buyers at every destination no matter the distance between
the markets. Through such adherence, they avoid independent initiatives that could
threaten pricing discipline. Considering that integrated markets are those where prices are
determined interdependently, we should expect that areas using the BPP will have a
higher degree of integration than areas using the FOB pricing system.
3. Implications for empirical analysis
Based in the previous analysis, two tests will be used to infer behavior in the
cattle spatial markets. The first empirical test measures the degree of market integration.
The existence, degree and evolution of market integration will be an indicator of firm
behavior. As discussed before, markets will be integrated either under FOB pricing or

11
BPP2. However, the degree of market integration will give important information to
identify the different pricing systems. Collusive price arrangements like BPP imply
higher market integration than is the case in FOB pricing.
The second empirical test is the Wald test of Granger causality. This test uses
price relationships to determine “causality” between prices in different markets. A price
from market X is a Granger cause of price from Y, if present Y can be predicted with
better accuracy by using past values of X rather than not doing so, other information
being identical. In terms of the different pricing systems, we expect that under BPP,
Granger causality will go in one direction, from the basing point market to the other
markets. These effects should be noticed in the very short run, e.g. when testing for prices
lagged one period. Also, there should be strong determination of the leading market over
all markets, including distant markets. In the FOB pricing system, Granger causality will
not have a clear pattern as in BPP. The price adjustment between markets could take
longer, and short run relationships between distant markets are not necessarily expected.
Short-run price adjustment will likely show a regional pattern going from the larger
markets to the smaller markets. Table 1 summarizes the contrasting results expected for
the FOB pricing and BPP.
4. The model
A general VAR model of the form presented in equation (13) is used. The model
consists in the regression of each current (non-lagged) price series on all prices in the
2 Faminow and Benson (1990) also discuss the case of spatial price discrimination where the firm set pricesequating marginal revenue to marginal cost. They show that discrimination may break market integration.A complete breakdown requires constant marginal costs.

12
model, lagged a certain number of times. In equation (13), Xt is a px1 vector of prices at
time t; µ is a px1 vector of intercept terms; Dt are seasonal dummies; Ai are pxp matrices
of parameters; et is a px1 vector of independently and normally distributed disturbances
and k is the lag length required to whiten the noise term e.
(13) ∑=
− +Φ++=k
itttit eDXAX
11 µ
Each equation of the system represents the relationship between the price of one
market and the lagged price of all the markets. These equations can be estimated
separately using ordinary least squares given that the VAR model involves only lagged
variables on its right-hand side, and that we assume that these variables are not correlated
with the error term.
The VAR model in equation (13) is used here to determine cointegration between
price series. Among the cointegrating techniques, Johansen and Juselius (1990) presented
a multiple cointegration analysis that enables the testing and estimation of more than one
cointegrating relationship. The model also permits testing for the validity of any
restrictions on cointegrating relationships implied by economic theory. A
reparametrization of the model in (13) assuming all series are integrated of order 1 leads
to:
(14) ∑=
−− +Φ++Π+∆=∆k
ittktitit eDXXBX
1
µ ,
where ∑=
−=k
ii IAD
1
and ∑+=
−=k
ijji AB
1
.
The operator ∆ denotes first differencing of all the variables in a vector of
variables Xt. The equalities of models (13) and (14) can be checked by adding Xt-1, Xt-

13
2,…, Xt-k and A1X1, A2X2, ….., At-kXt-k to both sides in (13) and rearranging. Equation
(14) represents the cointegrating transformation model. The special feature of this model
is the inclusion of a term in levels ( )ktX −Π among the variables in first difference. The
estimation of the matrix of coefficients Π will give the cointegrating relationships
between the different price series. The determination of the rank of Π is equivalent to
finding whether any cointegration relationship exists between the prices at separate
markets. Rank of 0 means no cointegration. If rank( Π ) = r < p, then there are r
cointegrating relationships and (p-r) common trends. In this case matrix Π can be
represented as:
(15) '.βα=Π
where α and β are both rxp matrices. Matrix β is the cointegrating matrix and has the
property that )0(~' IX tβ , while Xt~I(1). This means that the variables in Xt are
cointegrated, with cointegrating vectors 521 ,......,, βββ being particular columns of the
cointegrating matrix β . In a VAR model explaining n variables there can be at most r=n-
1 cointegrating vectors.
For empirical analysis, the essential problems are in the determination of r, the
rank of matrix Π , that is, in identifying the number of cointegrating vectors and in
estimating the cointegrating matrix β . The procedure for this estimation was developed
by Johansen and is used here for the estimation of the model in (14). Its precisely the
possibility of determining multiple cointegration relationships that makes this method
specially suited for the analysis of price relationships between spatial markets where we
expect multiple price relationships in the long run between the different prices.

14
The term Π Xt-k giving the long-run price relationships between markets is used
as an error correction term of the VAR model and the model is estimated by maximum
likelihood.
The estimation of the VAR model as explained before, allows the analysis of the
short-run dynamics between the markets (the term ∑=
−∆k
ititi XB
1
in the model) by the use of
a Wald test to check for Granger causality between prices. The test implies three steps.
First the optimal order of the VAR system must be determined using conventional criteria
(Akaike’s information criterion or the Schwartz-Bayesian criterion). After determining
the optimal order, an additional lag is added to the model. Finally, the Wald statistic is
calculated using parameter estimates for the optimal number of lags. The restriction that
the price of market i does not affect the price of market j is tested for all i and j. If the
restriction is valid, the chi-square value of the Wald test will not be significant.
5. An application to the cattle procurement markets
In this section, the model presented in section IV is estimated and conclusions are
derived from the results, based on the theoretical discussion of section II. The data used
are weekly price series for Choice Yield grade 2-4, 1100-1300 pound slaughter steers
from the U.S. Department of Agriculture’s Livestock, Meat, and Wool Market News. The
period covered is January 1989-December 1998, yielding a total of 522 observations. The
analysis of this period is relevant given that this is the period of historically highest
concentration. Also, most of the studies reviewed in this industry used data for the 70’s
and 80’s and no studies were found covering this period.

15
Prices were collected for most of the relevant cattle markets: Kansas, Texas-
Oklahoma, Iowa, California, Colorado, Illinois, Omaha, Sioux City, St. Paul. Figure 3
shows the size of these markets in terms of cattle volumes.
The VAR model using the Johansen’s methodology imposes a restriction in the
number of markets to include because Johansen developed the tables for critical values
for the test statistics of the number of cointegrating vectors for only five variables.
Because of this, the model is estimated for the markets of Texas and Iowa as the largest
and most important markets of the sample, Colorado as a “marginal” market distant from
the centers of Texas and Iowa, and Omaha and St.Paul, as smaller markets, close to Iowa.
Although Kansas is one of the largest markets, it was not considered because of an
important number of missing observations3.
Basic statistics for the price series are presented in table 2. Figure 4 shows the
evolution of cattle price in Texas during the period 1989-1998. All other markets show
the same pattern.
A drastic change in price behavior can be seen in the last period, if we compare it
with the first years of the series (1989-1992). Prices are on average 11% lower in the last
period in all markets. Moreover, there is a clear trend in the series showing that prices are
decreasing with respect to the price levels in 1989-92. Prices in 1998 are 17% lower than
prices in 1989.
The data suggest that a significant change took place in price behavior in the last
seven years. Given this information, the model is estimated separately for the periods
1989-1992 and 1993-1998. The results are compared to see if the differences in price
3 The other markets have a small number of missing observation and they were proxied by the mean value of the prices
on the week before and the week after the missing value.
16
behavior can be explained by differences in price relationships and integration between
markets.
6. Results
The first step in the estimation of the model is the application of the Dickey-Fuller
unit root tests to the individual price series. The tests are reported with a trend but similar
results are obtained without trend (Table 3). Strong evidence of a single unit root is
revealed. Price data when considered in levels are non stationary. However, first-
differenced prices are stationary in every case. Only for Iowa and Colorado in the second
period the null hypothesis of the existence of a unit root can be rejected, although the
values are close to the critical value. The same test applied on the first differences of the
prices, show clearly that this series are integrated of order one (I(1)).
The optimal number of lags for the VAR model was determined using three
different tests: the Akaike information criterion, the Schwarz Bayesian criterion, and the
adjusted R-squared. All of the three methods indicate that the number of lags for the
model is 2. Given this, k is set equal to 2 in equation (2), and the model is estimated
following Johansen’s procedure.
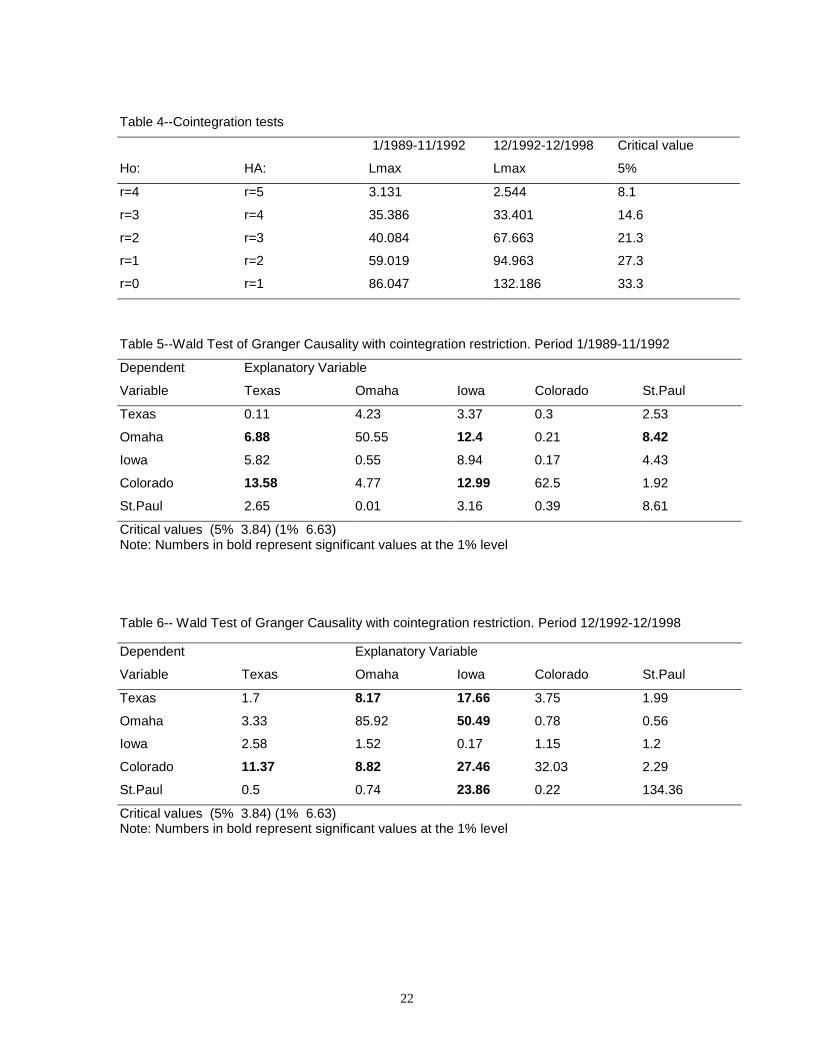
The results of the multivariate cointegration test are presented in the next table.
The maximum eigenvalue test confirms the presence of four cointegrating relationships
in both periods. It is important to notice that cointegration between the price series in
these markets was increased in the last period.

17
Finally, the Granger causality tests are presented in tables 5 and 6. Important
differences in price determination and causality can be found between the two periods.
In the first period, the results agree with what we can expect from a FOB pricing system
as discussed before. Prices in all markets in the short-run react to price changes in Texas
and Iowa, the larger markets in the sample. Also, there is evidence (at the 5% level of
significance) that Texas (the largest market) is affecting Iowa’s price. In conclusion, for
the period 1989-1992, the cattle procurement markets analyzed show a high degree of
integration with causality relationships going mainly from Texas and Iowa to all other
markets.
There is a significant change in the causality relationships in the second period,
where causality effects appear to be moving from Iowa to all other markets, including
Texas. Also, the Chi-square values of the Wald test corresponding to the effect of Iowa’s
price on other markets are all higher than any value for this test in the first period. Omaha
appears to be integrated to Iowa given the very high values of the Granger test. This can
also explain why is Omaha having an effect on Texas prices.
Contrasting the results from both periods, we can conclude that a significant
change in the degree of market integration, price behavior, and causality relationships
between prices from different regions had taken place during the period 1992-1998.
Considering the price causality from Iowa to all other regions and relating this to the
price reduction and increasing concentration during this period, we conclude that there is
evidence of increasing collusive behavior in the cattle procurement markets.

18
7. Summary and Conclusions
The objective of this work is to deduce non-competitive market conduct from the
dynamic of price adjustments across the regional cattle procurement markets. Johansen’s
multiple cointegration technique is used as a test for spatial market integration and
Granger’s causality test is applied to determine the direction of causality between prices
in the different markets. Conduct is inferred relating the results of these tests with
hypotheses about pricing conduct in spatial markets.
A VAR model is estimated for prices from Texas, Iowa, Colorado, Omaha and
St.Paul. The model is estimated separately for the periods 1989-1992 and 1993-1998. The
results are compared to see if the differences in price behavior between periods can be
explained by differences in price relationships and integration between markets.
The results show that a significant change in the degree of market integration,
price behavior and causality relationships between prices from different regions had
taken place during the period 1992-1998. Considering the price causality from Iowa to all
other regions and relating this to the price reduction and increasing concentration, there is
evidence of increasing collusive behavior in the cattle procurement markets.

19
References
Alexander, C. and J.Wyeth. “Cointegration and Market Integration: An Application to theIndonesian Rice Market.” The Journal of Development Studies, Vol.30, No.2, January1994, pp.303-328.
Azzam, A and D.G.Anderson Assessing Competition in Meatpacking: Economic History,Theory, and Evidence. USDA, Grain Inspection, Packers and Stockyards Administration,May 1996.
Benson, B.L. “Loschian Competition under alternative Demand conditions.” AmericanJournal of agricultural Economics, Vol. 67(1985), pp. 296-306.
Benson, B.L. and M.D. Faminow “An Alternative View of Pricing in Retail foodMarkets.” American Journal of agricultural Economics, Vol. 67(1985), pp. 296-306.
Charemza, W., and D.F.Deadman New Directions in Econometric Practice. EdwardElgar Publishing Limited, England.
Faminow, M.D. and B.L.Benson. “Integration of Spatial Markets.” American Journal ofagricultural Economics, Vol. 72(1990), pp. 49-62.
Goodwin, B.K. and T.C. Schroeder. “Cointegration Tests and Spatial Price Linkages inRegional Cattle Markets.” American Journal of agricultural Economics, Vol. 73(1991),pp452-64.
Greenhut, M.L., G. Norman and Chao-Shun Hung, The Economics of ImperfectCompetition. A Spatial Approach. Cambridge University Press, 1988.
Greenhut, M.L. and H. Ohta, Theory of Spatial Pricing and Market Areas. DukeUniversity Press, Durham, N.C. 1975.
Johansen, S.(1988). “Statistical Analysis of Cointegration Vectors.” Journal of EconomicDynamics and Control, 12, 231-254
Johansen, S., K.Juselius (1990). “Maximum Likelihood Estimation and Inference onCointegration with Application to the Demand for Money.” Oxford bulletin of Economicsand Statistics, 52, 169-210”,
Ravallion, M. “Testing Market Integration.” American Journal of agriculturalEconomics, Vol. 68(1986), pp102-09.
Scherer, F.M. Industrial Market Structure and Economic Performance 2nd ed. Chicago:Rand-McNally College Publishing co., 1980.
20
Schroeder, T.C. and B.K.Goodwin,. “Cointegration Tests and Spatial Price Linkages inRegional Cattle Markets.” Western Journal of Agricultural Economics, 15(1): pp 111-122.
Silvapulle, P. and S. Jayasuriya, “Testing for Philippines Rice Market Integration: aMultiple Cointegration Approach.” Journal of Agricultural Economics 45(3)(1994) 369-380.
Smith, V.H., B.K. Goodwin and M. T. Holt. “Price Leadership In International WheatMarkets.” Wheat Expport Trade Education Committee, September 5, 1995.

21
Table 1--Empirical implications of different pricing systemsFOB Pricing
• Markets less integrated than in BPP
• Price interaction will not have a clear patternas in BPP.
• The price adjustment between markets couldtake longer, short run relationships are notnecessarily expected
• short-run price adjustment between distantmarkets should be weaker.
• Short-run price adjustment will likely show aregional pattern going from the largermarkets to the smaller markets.
BPP
• Markets more integrated than in FOB
• Price interaction should go in one direction,from the basing point market to the othermarkets.
• These effects should be noticed in the veryshort run
• Strong determination of the leading marketover all markets, including distant markets
Table 2--Prices basic statistics, weekly data 1989-1998 ($ per 100 pounds)Mean Standard Deviation1989-92 1992-98 1989-92 1992-98
Texas 75.84 67.90 3.64 6.06Omaha 75.14 67.06 3.87 6.02Iowa 75.22 67.37 3.83 5.86Colorado 75.71 67.81 3.66 6.06St.Paul 73.66 66.09 4.06 6.05Source: Livestock, Meat, and Wool Market News, USDA
Table 3—Augmented Dickey-Fuller test for Non-Stationarity.
Period 1/1989-11/1992 Period 12/1992-12/1998
Test Critical Test Critical
Statistics Value (10%) Statistics Value (10%)
Texas -2.53 -3.13 -3.09 -3.13
Omaha -9.08 -18.2 -2.66 -3.13
Iowa -3.02 -3.13 -3.31 -3.13
Colorado -13.61 -18.2 -3.32 -3.13
St.Paul -2.55 -3.13 -3.07 -3.13
22
Table 4--Cointegration tests
1/1989-11/1992 12/1992-12/1998 Critical value
Ho: HA: Lmax Lmax 5%
r=4 r=5 3.131 2.544 8.1
r=3 r=4 35.386 33.401 14.6
r=2 r=3 40.084 67.663 21.3
r=1 r=2 59.019 94.963 27.3
r=0 r=1 86.047 132.186 33.3
Table 5--Wald Test of Granger Causality with cointegration restriction. Period 1/1989-11/1992
Dependent Explanatory Variable
Variable Texas Omaha Iowa Colorado St.Paul
Texas 0.11 4.23 3.37 0.3 2.53
Omaha 6.88 50.55 12.4 0.21 8.42
Iowa 5.82 0.55 8.94 0.17 4.43
Colorado 13.58 4.77 12.99 62.5 1.92
St.Paul 2.65 0.01 3.16 0.39 8.61
Critical values (5% 3.84) (1% 6.63)Note: Numbers in bold represent significant values at the 1% level
Table 6-- Wald Test of Granger Causality with cointegration restriction. Period 12/1992-12/1998
Dependent Explanatory Variable
Variable Texas Omaha Iowa Colorado St.Paul
Texas 1.7 8.17 17.66 3.75 1.99
Omaha 3.33 85.92 50.49 0.78 0.56
Iowa 2.58 1.52 0.17 1.15 1.2
Colorado 11.37 8.82 27.46 32.03 2.29
St.Paul 0.5 0.74 23.86 0.22 134.36
Critical values (5% 3.84) (1% 6.63)Note: Numbers in bold represent significant values at the 1% level
23
Figure 1—A spatial market representation
Figure 2—Basing Point Pricing (BPP)
Px+uPy+u
PyPx
D
GX Y
Px+uPy+u
PyPx
D
GX YF H
A
B
C
E

24
Figure 3—Average annual cattle volumes (1984-1987)
Figure 4—Slaughter steer: weekly prices from Texas (dollars per 100 pounds)
0 5 0 0 1 0 0 0 1 5 0 0 2 0 0 0 2 5 0 0 3 0 0 0 3 5 0 0 4 0 0 0
1 0 0 0 hea ds
Co lora do
Illino is
Io wa
K a ns a s
L a nca s te r
N e bra s ka
O m a ha
S o .St .Paul
Sio ux C ity
T e x a s
S o u rce : S ch ro ed er an d G o o dw i n , 1 99 0
50
55
60
65
70
75
80
85
90
Jan-
89
Jan-
92
Jan-
95
Dec
-98
Weeks: January 1989-December 1998