dodge city public schools usd 443 - kansas state ... finance/budget/budget_at_a...5 orchestra. music...
TRANSCRIPT

Dodge City Public Schools USD 443
• Budget General Information (characteristics of district)
• Supplemental Information for Tables in Summary of Expenditures
• KSDE Website Information Available
• Summary of Expenditures (Sumexpen.xls)

1
2005-2006 Budget General Information USD #: 443
Introduction Dodge City Public Schools operate 13 individual attendance centers. Rich with history, several school buildings date back to the 1920’s. In the 1995-1996 school year the district opened three new district elementary schools. In 2001 the district opened the new Dodge City high school. The $40 million facility is the largest high school in the state of Kansas. In 2002, after a year-long remodeling job, the former high school was reopened as Comanche Intermediate Center serving fifth and sixth grade students. The district attendance centers include: 1 Early Childhood Education Center, 7 Elementary Schools (K-4), 2 Intermediate Centers (5-6), 1 Middle School (7-8), 1 High School (9-12) and 1 Alternative Education Center.
District Mission To prepare our students to be capable, contributing participants in a changing world.
Board Members Dan Reichenborn President 10874 W Park Dodge City, KS 67801 Chris Rostetter Vice-President 1815 Burr Parkway Dodge City, KS 67801 Herminia Gusman Member 3100 Cannery Row, Apt C Dodge City, KS 67801 Kelly Henrichs Member 500 Saint Joseph Dodge City, KS 67801 Ethel Peterson Member 2315 Melencamp Dodge City, KS 67801 Brian Winter Member 1414 E Trail Dodge City, KS 67801 Jeanie Zortman Member 11322 Middle Road Dodge City, KS 67801

2
Key Staff Superintendent: Gloria J. Davis Associate or Assistant Superintendents: Morris Reeves-Interim Asst. Superintendent of
Business & Finance Curriculum & Instruction Staff: Alan Cunningham-Director, Assessment & Curriculum
Development Judy Beedles-Miller-Director, Elementary Education Kathy Taylor-Director, Secondary Education Business Office Staff: Debbie Eddy-Supervisor of Business Services Chris Meyer-Supervisor of Maintenance Katie Ruthi-Supervisor of Transportation Barbara Wilson-Supervisor of School Nutrition Other Key Contacts: Kim Christiansen-Director, Human Resources
Judy Beedles-Miller-Title I Director Robert Vinton-ELS/Migrant Director
Rebecca Clark-Hermocillo-Head Start/Bright Beginnings Director Jonni Clark-21st Century Community Learning Center Coordinator
Randy Smith-Federal Projects & Grants Director Jim Sherer-Kansas Heritage Center Coordinator Seth Eckelman- Public Information Coordinator Tom Waldron-Technology Coordinator Superintendent’s Message By Gloria J. Davis Determination - a characteristic that is found in abundance in Dodge City. Determined school employees and community members work together to offer the best education possible to our students. We take pride in our state-of-the art educational facilities, but more importantly in the quality education we offer to our students. Dodge City Public Schools are rich with the ethnic diversity which made this nation great. Our student body is a true reflection of “The 21st Century”.
To help better prepare our students for the 21st Century we have outlined five basic beliefs. These five beliefs drive the educational process in Dodge City:
We believe we must make “Academic Achievement” a priority - everything else comes second.
We believe we must “raise the bar” by maintaining high expectations and academic quality for all students.
We believe we must “close the gap” in the academic performance of all students.
We believe we must emphasize in-depth learning.
We believe it is essential to actively involve parents, business partners and the community in our district.

3
Our district is at an exciting and challenging point in its development. We are establishing new schools, creating new programs, increasing technology and providing intensive support to our instructional focus. Our determination will result in successful results for all students! District Goals The primary purpose of the Dodge City School District is to successfully educate all students to the highest level. In order to achieve this purpose, the district follows an Academic Enhancement Plan that addresses five primary goals.
These goals are straightforward and fundamental. Each goal is accompanied by a measurement of success - in most cases a 5% annual improvement on the Kansas State Assessments.
I. Reading To ensure all students are successful learners by improving literacy and reading skills. II. Mathematics To ensure all students are successful learners by increasing problem-solving and critical thinking skills in Mathematics.
III. Writing To ensure all students communicate effectively in writing by increasing skills in the Six Traits of Writing.
IV. Diversity To ensure all students are successful learners, regardless of gender, race, ethnicity, socio-economic status.
V. Technology To provide students and staff with appropriate and equal access to current technology resources to enhance instruction and student achievement and support continued professional development and technical support. Programs and Services Dodge City Public Schools offer many programs and services to maximize the educational opportunities for their students. Those programs and services include:
Consolidated Federal Programs Title I, Part A - Disadvantaged Students Title I, Part A - Neglected & Delinquent Students Title I, Part C - Migrant Services Title II - Improving Teacher Quality Title II, Part D - Educational Technology Title III - English Language Acquisition Title IV - Drug Free Schools Title V - Innovative Programs
State & Federal Programs At Risk Program Bilingual Education The Learning Center Carl Perkins Vocational & Applied Technology
Special Education Special Education

4
Early Childhood Handicapped Program Therapeutic Education Center Gifted Education Program
Early Childhood Education Head Start At-Risk Four Year Old Program Early Head Start Parents As Teachers Program
Alternative Education Second Opportunity School Dodge City Education Center Dana Hansen School (Methodist Youthville) Community Education Opportunity
Grants & Projects 21st Century Community Learning Center Grant Gear -Up Program COPS Grant Advanced Placement Program Expansion Kansas Institutional Conservation Program Kansas Equity Foster Grandparents Program
Extended Learning Opportunities Extended Academic Learning Program Summer School Program Concurrent Enrollment - Dodge City Community
Advanced Placement Classes Dodge City High School offers a large selection of Advanced Placement (AP) Classes. In most cases AP classes are attended by Juniors and Seniors, but are open to all high school students. Classes offered in the program include: Government, English Literature, Composition, French, Chemistry and Calculus. Plans are underway to expand AP offerings in Biology, World History and American History. Close to 100 Dodge City High School Students take advantage of AP classes.
Gifted Education Program Dodge City Public Schools offer a gifted education program to students who qualify. The elementary (K-6) gifted education program is held in the newly remodeled Comanche Intermediate Center. Students from schools across the district are bussed to the center by grade level for half a day per week. In addition to elementary students, the district provides gifted education services to the middle school and high school.
Music Program Students in Dodge City Public Schools have access to music classes at all grade levels. All kindergarten through fourth grades have vocal music as well as Music In Education (MIE) classes. Students in MIE are taught basic keyboard (piano) skills as well as introduced to instruments such as guitar and recorders.
In addition to vocal music, students in fifth and sixth grade may choose to also take band or orchestra. Music at the middle school level is optional. Students may choose vocal, band or

5
orchestra. Music participation at the high school is also optional. Students may choose to participate in band, orchestra or a variety of vocal groups.
The Learning Center Located in the basement of the Village Square Shopping Mall, The Learning Center is a resource center for parents, teachers and the community. The Center offers a Make-It/Take-It center complete with all the supplies necessary to create bulletin boards, learning games, signs and anything imaginable. The Center also offers a computer lab, meeting room and instructional library.
The First Stop Enrollment Center Located across the hall from The Learning Center, The First Stop Enrollment Center provides enrollment services for all elementary students to the district. At the center, parents may enroll students in school, be given appropriate evaluations and receive information about Dodge City Public Schools.
The District’s Accomplishments and Challenges Accomplishments Improvement was across the district on the Kansas State Assessment in the subject area of Reading.
Dodge City Public Schools have 151 district staff members with an advanced degree (master’s degree or higher)
Four newcomer’s classrooms across the district – for students new to the country with limited English speaking skills.
A dual-language program at two schools (Northwest Elementary & Dodge City Middle School).
The average score for Dodge City High School students taking the ACT test is 22 – one point above the national average.
The drop-out rate at Dodge City High School is 1.40%.
After-school tutoring and programs at all district schools – provided by the 21st Century Community Learning Center program.
Outstanding teaching staff: 6 Kansas Master Teachers currently on staff, 3 Horizon Award winners, 1 recipient of the Carol Gray Award (honoring teachers in Special Education), 1 recipient of the national Teacher of English award,
Dodge City High School offers the following Advanced Placement classes: Government, English Literature, Composition, French, Chemistry & Calculus.
The district received approximately $3.3 million in grant funding in addition to the Entitlement programs for the 2004-2005 school year.
6
Supplemental Information for the Following Tables 1. Summary of Total Expenditures by Function (All Funds) 2. Summary of General Fund Expenditures by Function 3. Summary of Supplemental General Fund Expenditures by Function 4. Summary of General and Supplemental General Fund Expenditures by Function 5. Summary of Special Education Fund by Function 6. Instruction Expenditures (1000) 7. Student and Instructional Support Expenditures (2100 & 2200) 8. General Administration Expenditures (2300) 9. School Administration Expenditures (2400) 10. Operations and Maintenance Expenditures (2600) 11. Other Costs (2500 & 2900: Other Supplemental Services) (3000: Non-Instruction Services) 12. Capital Improvements (4000) 13. Debt Services (5000) 14. Miscellaneous Information Unencumbered Cash Balance by Fund 15. Reserve Funds Unencumbered Cash Balance 16. Other Information - FTE 17. Miscellaneous Information Mill Rates by Fund 18. Other Information – Assessed Valuation and Bonded Indebtedness Note: The FTE (full time equivalency) used in this report to calculate the “Amount Per Pupil” is defined as following: Enrollment (FTE) includes the enrollment of the district used for state aid and budget authority, and all other preschool enrollment and kindergarten students attending full time.

7
KSDE Website Information Available K-12 Statistics (Building, District or State Totals) http://www.ksde.org/k12/k12.html
• Attendance / Enrollment Reports • Staff Reports • Graduates / Dropouts Reports • Crime / Violence Reports
School Finance Reports and Publications http://www.ksde.org/leaf/reports_and_publications/reports.html
• Certified Personnel • Enrollment • Dropouts • Graduates • Salary Reports
Kansas Building Report Card http://online.ksde.org/rcard
• Attendance Rate • Graduation Rate • Dropout Rate • School Violence • Assessments
o Reading o Mathematics o Writing
• Graduates Passing Adv. Science Courses • Graduates Passing Adv. Math Courses

USD# 443
Summary of Total Expenditures By Function(All Funds)
% % % % %2003-2004 of 2004-2005 of inc/ 2005-2006 of inc/
Actual Tot Actual Tot dec Budget Tot dec
Instruction 29,176,058 56% 31,490,661 56% 8% 34,573,352 55% 10%
Student & Instructional Support 4,018,232 8% 3,749,604 7% -7% 4,312,581 7% 15%
General Administration 2,014,179 4% 1,838,364 3% -9% 1,758,904 3% -4%
School Administration (Building) 2,559,303 5% 2,772,717 5% 8% 2,932,514 5% 6%
Operations & Maintenance 4,788,975 9% 6,744,907 12% 41% 8,288,454 13% 23%
Capital Improvements 132,793 0% 208,165 0% 57% 347,448 1% 67%
Debt Services 4,930,354 10% 4,564,145 8% -7% 4,933,866 8% 8%
Other Costs 4,268,826 8% 4,791,868 9% 12% 5,407,994 9% 13%
Total Expenditures 51,888,720 100% 56,160,431 100% 8% 62,555,113 100% 11%
Amount per Pupil $9,369 $9,933 6% $10,790 9%
Note: Percentages on charts are within +-1% due to rounding used. Pie graph percentages may differ from charts for this reason also.
Further definition of what goes into each category:Instruction - 1000 Operations & Maintenance - 2600Student & Instructional Support - 2100 & 2200 Other Costs - 2500, 2900 and 3000 and all others not included elsewhereGeneral Administration - 2300 Capital Improvements - 4000School Administration (Building) - 2400 Debt Services - 5100 Transfers - 5200
The funds that are included in the categories above are: General, Supplemental General, Bilingual Education, At Risk(4yr Old), At Risk(K-12), Capital Outlay, Driver Education, Declining Enrollment, Extraordinary School Program, Summer School, Special Education, Vocational Education, Professional Development, Bond & Interest #1, Bond & Interest #2, No-Fund Warrant, Special Assessment, Parent Education, School Retirement, Student Materials Revolving & Textbook Rental, Tuition Reimbursement, Gifts/Grants, KPERS Special Retirement Contribution, Contingency, Special Liability Expense, Federal Funds, Adult Education, Adult Supplemental Education, Area Vocational Education, and Special Education Coop.
Summary of Total Expenditures By Function (All Funds)
0
5,000,000
10,000,000
15,000,000
20,000,000
25,000,000
30,000,000
35,000,000
40,000,000
Instruction Student &Instructional
Support
GeneralAdministration
SchoolAdministration
(Building)
Operations &Maintenance
CapitalImprovements
Debt Services Other Costs
2003-20042004-20052005-2006
2005-2006 Summary of Total Expenditures By Function (All Funds)
Instruction54%
General Administration3%
School Administration (Building)5%
Operations & Maintenance13%
Capital Improvements1%
Debt Services8%
Other Costs9%
Student & Instructional Support7%
InstructionStudent & Instructional SupportGeneral AdministrationSchool Administration (Building)Operations & MaintenanceCapital ImprovementsDebt ServicesOther Costs
11/3/2005 3:59 PM Sumexpen.xls Page 1 of 19

USD# 443
Summary of General Expendituresby Function
% % % % %2003-2004 of 2004-2005 of inc/ 2005-2006 of inc/
Actual Tot Actual Tot dec Budget Tot dec
Instruction 15,339,904 63% 15,971,568 64% 4% 16,279,439 63% 2%
Student & Instructional Support 529,789 2% 728,838 3% 38% 765,391 3% 5%
General Administration 1,199,235 5% 1,123,381 5% -6% 1,242,755 5% 11%
School Administration (Building) 2,108,987 9% 2,202,915 9% 4% 2,292,736 9% 4%
Operations & Maintenance 4,026,423 17% 3,872,120 16% -4% 3,908,855 15% 1%
Capital Improvements 0 0% 0 0% 0% 0 0% 0%
Other Costs 1,079,935 4% 1,059,144 4% -2% 1,200,892 5% 13%
Total Expenditures 24,284,273 100% 24,957,966 100% 3% 25,690,068 100% 3%
Amount per Pupil $4,385 $4,414 1% $4,431 0%
The Summary of General Fund Expenditures chart information comes from pages 6-13 and only uses the 'General Fund' line items.
Summary of General Fund Expendituresby Function
0
2,000,000
4,000,000
6,000,000
8,000,000
10,000,000
12,000,000
14,000,000
16,000,000
18,000,000
Instruction Student &Instructional
Support
GeneralAdministration
SchoolAdministration
(Building)
Operations &Maintenance
CapitalImprovements
Other Costs
2003-20042004-20052005-2006
2005-2006 Summary of General Fund Expendituresby Function
Instruction63%
Student & Instructional Support
3%
General Administration5%
School Administration (Building)
9%
Operations & Maintenance15%
Other Costs5%
InstructionStudent & Instructional SupportGeneral AdministrationSchool Administration (Building)Operations & MaintenanceCapital ImprovementsOther Costs
11/3/2005 3:59 PM Sumexpen.xls Page 2 of 19

USD# 443
Summary of Supplemental General Fund Expendituresby Function
% % % % %2003-2004 of 2004-2005 of inc/ 2005-2006 of inc/
Actual Tot Actual Tot dec Budget Tot dec
Instruction 2,121,724 41% 2,747,203 41% 29% 3,224,648 41% 17%
Student & Instructional Support 1,806,118 35% 1,776,255 27% -2% 1,922,100 25% 8%
General Administration 126,691 2% 155,400 2% 23% 151,475 2% -3%
School Administration (Building) 212,204 4% 240,007 4% 13% 267,125 3% 11%
Operations & Maintenance 585,332 11% 1,387,114 21% 137% 1,876,752 24% 35%
Capital Improvements 0 0% 0 0% 0% 0 0% 0%
Other Costs 325,771 6% 314,399 5% -3% 384,124 5% 22%
Total Expenditures 5,177,840 100% 6,620,378 100% 28% 7,826,224 100% 18%
Amount per Pupil $935 $1,171 25% $1,350 15%
The Summary of Supplemental General Fund Expenditures chart information comes from pages 6-13 and only uses the 'Supplemental General Fund' line items.
2005-2006 Summary of Supplemental General Fund Expendituresby Function
Instruction41%
Student & Instructional Support
25%
General Administration2%
School Administration (Building)
3%
Operations & Maintenance24%
Other Costs5%
InstructionStudent & Instructional SupportGeneral AdministrationSchool Administration (Building)Operations & MaintenanceCapital ImprovementsOther Costs
Summary of Supplemental General Fund Expendituresby Function
0
500,000
1,000,000
1,500,000
2,000,000
2,500,000
3,000,000
3,500,000
Instruction Student &Instructional
Support
GeneralAdministration
SchoolAdministration
(Building)
Operations &Maintenance
CapitalImprovements
Other Costs
2003-20042004-20052005-2006
11/3/2005 3:59 PM Sumexpen.xls Page 3 of 19

USD# 443Summary of General and Supplemental General Fund
Expenditures by Function
% % % % %2003-2004 of 2004-2005 of inc/ 2005-2006 of inc/
Actual Tot Actual Tot dec Budget Tot dec
Instruction 17,461,628 59% 18,718,771 59% 7% 19,504,087 58% 4%
Student & Instructional Support 2,335,907 8% 2,505,093 8% 7% 2,687,491 8% 7%
General Administration 1,325,926 5% 1,278,781 4% -4% 1,394,230 4% 9%
School Administration (Building) 2,321,191 8% 2,442,922 8% 5% 2,559,861 8% 5%
Operations & Maintenance 4,611,755 16% 5,259,234 17% 14% 5,785,607 17% 10%
Capital Improvements 0 0% 0 0% 0% 0 0% 0%
Other Costs 1,405,706 5% 1,373,543 4% -2% 1,585,016 5% 15%
Total Expenditures 29,462,113 100% 31,578,344 100% 7% 33,516,292 100% 6%
Amount per Pupil $5,320 $5,585 5% $5,781 4%
The Summary of General and Supplemental General Fund Expenditures chart information comes from pages 6-13 and adds togetherthe 'General Fund' and 'Supplemental General Fund' line items.
Summary of General and Supplemental General Fund Expenditures by Function
0
5,000,000
10,000,000
15,000,000
20,000,000
25,000,000
Instruction Student &Instructional
Support
GeneralAdministration
SchoolAdministration
(Building)
Operations &Maintenance
CapitalImprovements
Other Costs
2003-20042004-20052005-2006
2005-2006 Summary of General and Supplemental General Fund Expenditures by Function
Instruction58%
Student & Instructional Support
8%
General Administration4%
School Administration (Building)
8%
Operations & Maintenance17%
Other Costs5%
InstructionStudent & Instructional SupportGeneral AdministrationSchool Administration (Building)Operations & MaintenanceCapital ImprovementsOther Costs
11/3/2005 3:59 PM Sumexpen.xls Page 4 of 19

USD# 443
Summary of Special Education Fundby Function
% % % % %2003-2004 of 2004-2005 of inc/ 2005-2006 of inc/
Actual Tot Actual Tot dec Budget Tot dec
Instruction 4,250,417 96% 4,400,983 97% 4% 5,210,061 97% 18%
Student & Instructional Support 11,709 0% 4,167 0% -64% 15,446 0% 271%
General Administration 0 0% 0 0% 0% 0 0% 0%
School Administration (Building) 0 0% 0 0% 0% 0 0% 0%
Operations & Maintenance 0 0% 0 0% 0% 0 0% 0%
Capital Improvements 0 0% 0 0% 0% 0 0% 0%
Other Costs 160,140 4% 136,769 3% -15% 149,493 3% 9%
Total Expenditures 4,422,266 100% 4,541,919 100% 3% 5,375,000 100% 18%
Amount per Pupil $798 $803 1% $927 15%
The Summary of Special Education Fund Expenditures chart information comes from pages 6-13 and only uses the 'Special Education Fund'line items. (Total expenditures excludes Special Ed Coop Fund because it would include expenditures for all schools participating in the Coop.)
Summary of Special Education Fund Expendituresby Function
0
1,000,000
2,000,000
3,000,000
4,000,000
5,000,000
6,000,000
Instruction Student &Instructional
Support
GeneralAdministration
SchoolAdministration
(Building)
Operations &Maintenance
CapitalImprovements
Other Costs
2003-20042004-20052005-2006
2005-2006 Summary of Special Education Fundby Function
Instruction97%
Other Costs3%
InstructionStudent & Instructional SupportGeneral AdministrationSchool Administration (Building)Operations & MaintenanceCapital ImprovementsOther Costs
11/3/2005 3:59 PM Sumexpen.xls Page 5 of 19

USD# 443Instruction Expenditures (1000)
% %2003-2004 2004-2005 inc/ 2005-2006 inc/
Actual Actual dec Budget dec
General 15,339,904 15,971,568 4% 16,279,439 2%Federal Funds 4,955,620 4,799,457 -3% 2,001,578 -58%Supplemental General 2,121,724 2,747,203 29% 3,224,648 17%At Risk (4yr Old) 257,028At Risk (K-12) 2,148,710Bilingual Education 1,337,576 1,349,873 1% 2,942,069 118%Capital Outlay 150,721 125,848 -17% 250,000 99%Driver Education 7,763 0 -100% 0 0%Declining Enrollment 0Extraordinary School Program 0 0 0% 0 0%Food Service 0 0 0% 0 0%Professional Development 0 0 0% 0 0%Parent Education Program 0 0 0% 0 0%Summer School 415,744 566,396 36% 626,680 11%Special Education 4,250,417 4,400,983 4% 5,210,061 18%Vocational Education 465,906 471,388 1% 498,961 6%Gifts/Grants 67,620 66,547 -2% 98,138 47%Special Liability 0 0 0% 0 0%School Retirement 0 0 0% 0 0%Extraordinary Growth Facilities 0 0 0% 0 0%Special Reserve 0 0 0%KPERS Spec. Ret. Contribution 954,139 1,036,040 9%Contingency Reserve 0 0 0%Text Book & Student Material 63,063 37,259 -41%Bond & Interest #1 0 0 0% 0 0%Bond & Interest #2 0 0 0% 0 0%No-Fund Warrant 0 0 0% 0 0%Special Assessment 0 0 0% 0 0%Temporary Note 0 0 0% 0 0%
SUBTOTAL 29,176,058 31,490,661 8% 34,573,352 10%Enrollment (FTE)* 5,538.4 5,653.8 2% 5,797.3 3%Amount per Pupil 5,268 5,570 6% 5,964 7%
Adult Education 0 0 0% 0 0%Adult Supplemental Education 0 0 0% 0 0%Area Vocational School 0 0 0% 0 0%Tuition Reimbursement 0 0 0% 0 0%Special Education Coop 0 0 0% 0 0%TOTAL 29,176,058 31,490,661 8% 34,573,352 10%
NOTE: Gifts/Grants includes private grants and grants from nonfederal sources.
Amount per pupil excludes the following funds: Area Vocational School, Adult Education, Adult Supplemental Education,Special Education Coop and Tuition Reimbursement.
*Enrollment (FTE) includes the enrollment of the district used for state aid and budget authority, and all other preschool enrollmentand kindergarten students attending full time.
Instruction Expenditures
0
5,000,000
10,000,000
15,000,000
20,000,000
25,000,000
30,000,000
35,000,000
40,000,000
2003-2004 2004-2005 2005-2006
Instruction Expenditures
02,000,0004,000,0006,000,0008,000,000
10,000,00012,000,00014,000,00016,000,00018,000,000
2003-2004 2004-2005 2005-2006
General Supplemental GeneralSpecial Education
11/3/2005 3:59 PM Sumexpen.xls Page 6 of 19

USD# 443
Student and Instructional Support Expenditures (2100 & 2200)
% %2003-2004 2004-2005 inc/ 2005-2006 inc/
Actual Actual dec Budget dec
General 529,789 728,838 38% 765,391 5%Federal Funds 1,057,077 722,010 -32% 397,410 -45%Supplemental General 1,806,118 1,776,255 -2% 1,922,100 8%At Risk (4yr Old) 6,906At Risk (K-12) 632,512Bilingual Education 48,113 36,180 -25% 79,367 119%Capital Outlay 299,980 0 -100% 0 0%Driver Training 0 0 0% 0 0%Declining Enrollment 0Extraordinary School Program 0 0 0% 0 0%Food Service 0 0 0% 0 0%Professional Development 210,138 213,033 1% 220,000 3%Parent Education Program 42,819 73,767 72% 74,176 1%Summer School 12,489 46,267 270% 36,042 -22%Special Education 11,709 4,167 -64% 15,446 271%Vocational Education 0 0 0% 0 0%Gifts/Grants 0 0 0% 0 0%Special Liability 0 0 0% 0 0%School Retirement 0 0 0% 0 0%Extraordinary Growth Facilities 0 0 0% 0 0%Special Reserve 0 0 0%KPERS Spec. Ret. Contribution 149,087 163,231 9%Contingency Reserve 0 0 0%Text Book & Student Material 0 0 0%Bond & Interest #1 0 0 0% 0 0%Bond & Interest #2 0 0 0% 0 0%No-Fund Warrant 0 0 0% 0 0%Special Assessment 0 0 0% 0 0%Temporary Note 0 0 0% 0 0%
SUBTOTAL 4,018,232 3,749,604 -7% 4,312,581 15%Enrollment (FTE)* 5,538.4 5,653.8 2% 5,797.3 3%Amount per Pupil 726 663 -9% 744 12%
Adult Education 0 0 0% 0 0%Adult Supplemental Education 0 0 0% 0 0%Area Vocational School 0 0 0% 0 0%Tuition Reimbursement 0 0 0% 0 0%Special Education Coop 0 0 0% 0 0%TOTAL 4,018,232 3,749,604 -7% 4,312,581 15%Amount per Pupil $727 $670 -8% $760 14%
NOTE: Gifts/Grants includes private grants and grants from nonfederal sources.
Amount per pupil excludes the following funds: Area Vocational School, Adult Education, Adult Supplemental Education,Special Education Coop and Tuition Reimbursement.
*Enrollment (FTE) includes the enrollment of the district used for state aid and budget authority, and all other preschool enrollmentand kindergarten students attending full time.
Student and Instructional Support Expenditures
0
500,000
1,000,000
1,500,000
2,000,000
2,500,000
3,000,000
3,500,000
4,000,000
4,500,000
5,000,000
2003-2004 2004-2005 2005-2006
11/3/2005 3:59 PM Sumexpen.xls Page 7 of 19
USD# 443
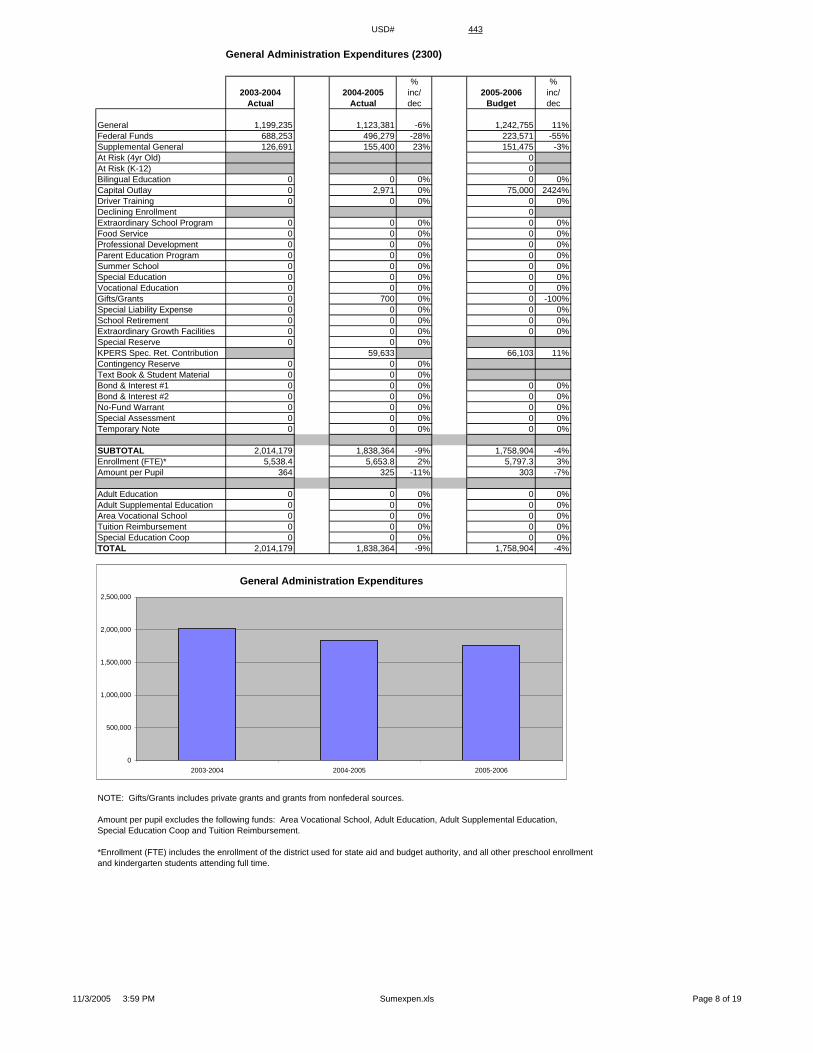
General Administration Expenditures (2300)
% %2003-2004 2004-2005 inc/ 2005-2006 inc/
Actual Actual dec Budget dec
General 1,199,235 1,123,381 -6% 1,242,755 11%Federal Funds 688,253 496,279 -28% 223,571 -55%Supplemental General 126,691 155,400 23% 151,475 -3%At Risk (4yr Old) 0At Risk (K-12) 0Bilingual Education 0 0 0% 0 0%Capital Outlay 0 2,971 0% 75,000 2424%Driver Training 0 0 0% 0 0%Declining Enrollment 0Extraordinary School Program 0 0 0% 0 0%Food Service 0 0 0% 0 0%Professional Development 0 0 0% 0 0%Parent Education Program 0 0 0% 0 0%Summer School 0 0 0% 0 0%Special Education 0 0 0% 0 0%Vocational Education 0 0 0% 0 0%Gifts/Grants 0 700 0% 0 -100%Special Liability Expense 0 0 0% 0 0%School Retirement 0 0 0% 0 0%Extraordinary Growth Facilities 0 0 0% 0 0%Special Reserve 0 0 0%KPERS Spec. Ret. Contribution 59,633 66,103 11%Contingency Reserve 0 0 0%Text Book & Student Material 0 0 0%Bond & Interest #1 0 0 0% 0 0%Bond & Interest #2 0 0 0% 0 0%No-Fund Warrant 0 0 0% 0 0%Special Assessment 0 0 0% 0 0%Temporary Note 0 0 0% 0 0%
SUBTOTAL 2,014,179 1,838,364 -9% 1,758,904 -4%Enrollment (FTE)* 5,538.4 5,653.8 2% 5,797.3 3%Amount per Pupil 364 325 -11% 303 -7%
Adult Education 0 0 0% 0 0%Adult Supplemental Education 0 0 0% 0 0%Area Vocational School 0 0 0% 0 0%Tuition Reimbursement 0 0 0% 0 0%Special Education Coop 0 0 0% 0 0%TOTAL 2,014,179 1,838,364 -9% 1,758,904 -4%
NOTE: Gifts/Grants includes private grants and grants from nonfederal sources.
Amount per pupil excludes the following funds: Area Vocational School, Adult Education, Adult Supplemental Education,Special Education Coop and Tuition Reimbursement.
*Enrollment (FTE) includes the enrollment of the district used for state aid and budget authority, and all other preschool enrollmentand kindergarten students attending full time.
General Administration Expenditures
0
500,000
1,000,000
1,500,000
2,000,000
2,500,000
2003-2004 2004-2005 2005-2006
11/3/2005 3:59 PM Sumexpen.xls Page 8 of 19

USD# 443
School Administration Expenditures (2400)
% %2003-2004 2004-2005 inc/ 2005-2006 inc/
Actual Actual dec Budget dec
General 2,108,987 2,202,915 4% 2,292,736 4%Federal Funds 105,931 95,936 -9% 55,666 -42%Supplemental General 212,204 240,007 13% 267,125 11%At Risk (4yr Old) 0At Risk (K-12) 0Bilingual Education 0 0 0% 0 0%Capital Outlay 0 17,869 0% 75,000 320%Driver Training 0 0 0% 0 0%Declining Enrollment 0Extraordinary School Program 0 0 0% 0 0%Food Service 0 0 0% 0 0%Professional Development 0 0 0% 0 0%Parent Education Program 0 0 0% 0 0%Summer School 10,323 10,713 4% 10,456 -2%Special Education 0 0 0% 0 0%Vocational Education 121,858 100,917 -17% 118,214 17%Gifts/Grants 0 0 0% 0 0%Special Liability Expense 0 0 0% 0 0%School Retirement 0 0 0% 0 0%Extraordinary Growth Facilities 0 0 0% 0 0%Special Reserve 0 0 0%KPERS Spec. Ret. Contribution 104,360 113,317 9%Contingency Reserve 0 0 0%Text Book & Student Material 0 0 0%Bond & Interest #1 0 0 0% 0 0%Bond & Interest #2 0 0 0% 0 0%No-Fund Warrant 0 0 0% 0 0%Special Assessment 0 0 0% 0 0%Temporary Note 0 0 0% 0 0%
SUBTOTAL 2,559,303 2,772,717 8% 2,932,514 6%Enrollment (FTE)* 5,538.4 5,653.8 2% 5,797.3 3%Amount per Pupil 462 490 6% 506 3%
Adult Education 0 0 0% 0 0%Adult Supplemental Education 0 0 0% 0 0%Area Vocational School 0 0 0% 0 0%Tuition Reimbursement 0 0 0% 0 0%Special Education Coop 0 0 0% 0 0%TOTAL 2,559,303 2,772,717 8% 2,932,514 6%
NOTE: Gifts/Grants includes private grants and grants from nonfederal sources.
Amount per pupil excludes the following funds: Area Vocational School, Adult Education, Adult Supplemental Education,Special Education Coop and Tuition Reimbursement.
*Enrollment (FTE) includes the enrollment of the district used for state aid and budget authority, and all other preschool enrollmentand kindergarten students attending full time.
School Administration Expenditures
0
500,000
1,000,000
1,500,000
2,000,000
2,500,000
3,000,000
3,500,000
2003-2004 2004-2005 2005-2006
11/3/2005 3:59 PM Sumexpen.xls Page 9 of 19

USD# 443
Operations and Maintenance Expenditures (2600)
% %2003-2004 2004-2005 inc/ 2005-2006 inc/
Actual Actual dec Budget dec
General 4,026,423 3,872,120 -4% 3,908,855 1%Federal Funds 86,506 19,953 -77% 37,288 87%Supplemental General 585,332 1,387,114 137% 1,876,752 35%At Risk (4yr Old) 0At Risk (K-12) 45,000Bilingual Education 9,240 8,876 -4% 15,508 75%Capital Outlay 0 1,224,414 0% 2,134,857 74%Driver Training 1,731 0 -100% 0 0%Declining Enrollment 0Extraordinary School Program 0 0 0% 0 0%Food Service 0 41,592 0% 45,000 8%Professional Development 0 0 0% 0 0%Parent Education Program 0 0 0% 0 0%Summer School 0 8,784 0% 29,052 231%Special Education 0 0 0% 0 0%Vocational Education 79,743 77,695 -3% 82,825 7%Gifts/Grants 0 0 0% 0 0%Special Liability 0 0 0% 0 0%School Retirement 0 0 0% 0 0%Extraordinary Growth Facilities 0 0 0% 0 0%Special Reserve 0 0 0%KPERS Spec. Ret. Contribution 104,359 113,317 9%Contingency Reserve 0 0 0%Text Book & Student Material 0 0 0%Bond & Interest #1 0 0 0% 0 0%Bond & Interest #2 0 0 0% 0 0%No-Fund Warrant 0 0 0% 0 0%Special Assessment 0 0 0% 0 0%Temporary Note 0 0 0% 0 0%
SUBTOTAL 4,788,975 6,744,907 41% 8,288,454 23%Enrollment (FTE)* 5,538.4 5,653.8 2% 5,797.3 3%Amount per Pupil 865 1,193 38% 1,430 20%
Adult Education 0 0 0% 0 0%Adult Supplemental Education 0 0 0% 0 0%Area Vocational School 0 0 0% 0 0%Tuition Reimbursement 0 0 0% 0 0%Special Education Coop 0 0 0% 0 0%TOTAL 4,788,975 6,744,907 41% 8,288,454 23%
NOTE: Gifts/Grants includes private grants and grants from nonfederal sources.
Amount per pupil excludes the following funds: Area Vocational School, Adult Education, Adult Supplemental Education,Special Education Coop and Tuition Reimbursement.
*Enrollment (FTE) includes the enrollment of the district used for state aid and budget authority, and all other preschool enrollmentand kindergarten students attending full time.
Operations and Maintenance Expenditures
0
1,000,000
2,000,000
3,000,000
4,000,000
5,000,000
6,000,000
7,000,000
8,000,000
9,000,000
2003-2004 2004-2005 2005-2006
11/3/2005 3:59 PM Sumexpen.xls Page 10 of 19

USD# 443
Other Costs(2500 & 2900: Other Supplemental Services)
(2700: Transportation)(3000: Non-Instruction Services)
% %2003-2004 2004-2005 inc/ 2005-2006 inc/
Actual Actual dec Budget dec
General 1,079,935 1,059,144 -2% 1,200,892 13%Federal Funds 5,854 0 -100% 0 0%Supplemental General 325,771 314,399 -3% 384,124 22%At Risk (4yr Old) 0At Risk (K-12) 0Bilingual Education 0 0 0% 0 0%Capital Outlay 0 0 0% 250,000 0%Driver Training 0 0 0% 0 0%Declining Enrollment 0Extraordinary School Program 0 0 0% 0 0%Food Service 2,697,126 3,162,290 17% 3,296,680 4%Professional Development 0 0 0% 0 0%Parent Education Program 0 0 0% 0 0%Summer School 0 0 0% 0 0%Special Education 160,140 136,769 -15% 149,493 9%Vocational Education 0 0 0% 0 0%Gifts/Grants 0 0 0% 0 0%Special Liability 0 0 0% 0 0%School Retirement 0 0 0% 0 0%Extraordinary Growth Facilities 0 0 0% 0 0%Special Reserve 0 0 0%KPERS Spec. Ret. Contribution 119,266 126,805 6%Contingency Reserve 0 0 0%Text Book & Student Material 0 0 0%Bond & Interest #1 0 0 0% 0 0%Bond & Interest #2 0 0 0% 0 0%No-Fund Warrant 0 0 0% 0 0%Special Assessment 0 0 0% 0 0%Temporary Note 0 0 0% 0 0%
SUBTOTAL 4,268,826 4,791,868 12% 5,407,994 13%Enrollment (FTE)* 5,538.4 5,653.8 2% 5,797.3 3%Amount per Pupil 771 848 10% 933 10%
Adult Education 0 0 0% 0 0%Adult Supplemental Education 0 0 0% 0 0%Area Vocational School 0 0 0% 0 0%Tuition Reimbursement 0 0 0% 0 0%Special Education Coop 0 0 0% 0 0%TOTAL 4,268,826 4,791,868 12% 5,407,994 13%
NOTE: Gifts/Grants includes private grants and grants from nonfederal sources.
Amount per pupil excludes the following funds: Area Vocational School, Adult Education, Adult Supplemental Education,Special Education Coop and Tuition Reimbursement.
*Enrollment (FTE) includes the enrollment of the district used for state aid and budget authority, and all other preschool enrollmentand kindergarten students attending full time.
Other Costs
0
1,000,000
2,000,000
3,000,000
4,000,000
5,000,000
6,000,000
2003-2004 2004-2005 2005-2006
11/3/2005 3:59 PM Sumexpen.xls Page 11 of 19
USD# 443
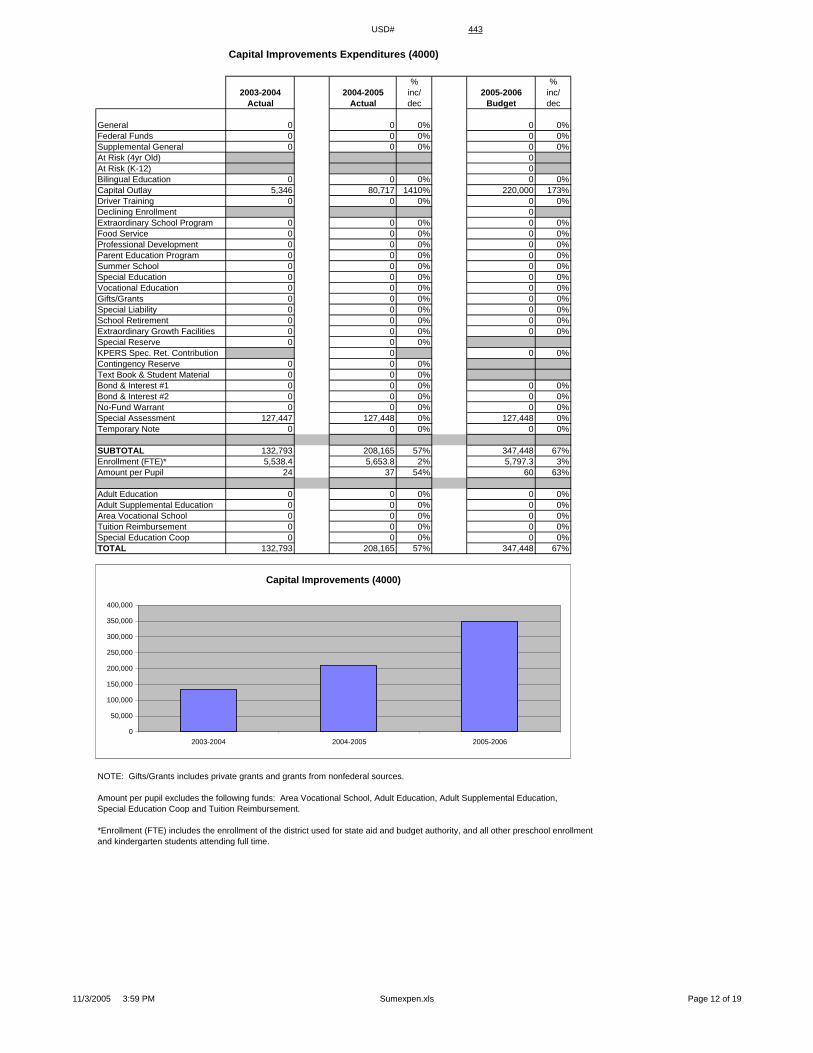
Capital Improvements Expenditures (4000)
% %2003-2004 2004-2005 inc/ 2005-2006 inc/
Actual Actual dec Budget dec
General 0 0 0% 0 0%Federal Funds 0 0 0% 0 0%Supplemental General 0 0 0% 0 0%At Risk (4yr Old) 0At Risk (K-12) 0Bilingual Education 0 0 0% 0 0%Capital Outlay 5,346 80,717 1410% 220,000 173%Driver Training 0 0 0% 0 0%Declining Enrollment 0Extraordinary School Program 0 0 0% 0 0%Food Service 0 0 0% 0 0%Professional Development 0 0 0% 0 0%Parent Education Program 0 0 0% 0 0%Summer School 0 0 0% 0 0%Special Education 0 0 0% 0 0%Vocational Education 0 0 0% 0 0%Gifts/Grants 0 0 0% 0 0%Special Liability 0 0 0% 0 0%School Retirement 0 0 0% 0 0%Extraordinary Growth Facilities 0 0 0% 0 0%Special Reserve 0 0 0%KPERS Spec. Ret. Contribution 0 0 0%Contingency Reserve 0 0 0%Text Book & Student Material 0 0 0%Bond & Interest #1 0 0 0% 0 0%Bond & Interest #2 0 0 0% 0 0%No-Fund Warrant 0 0 0% 0 0%Special Assessment 127,447 127,448 0% 127,448 0%Temporary Note 0 0 0% 0 0%
SUBTOTAL 132,793 208,165 57% 347,448 67%Enrollment (FTE)* 5,538.4 5,653.8 2% 5,797.3 3%Amount per Pupil 24 37 54% 60 63%
Adult Education 0 0 0% 0 0%Adult Supplemental Education 0 0 0% 0 0%Area Vocational School 0 0 0% 0 0%Tuition Reimbursement 0 0 0% 0 0%Special Education Coop 0 0 0% 0 0%TOTAL 132,793 208,165 57% 347,448 67%
NOTE: Gifts/Grants includes private grants and grants from nonfederal sources.
Amount per pupil excludes the following funds: Area Vocational School, Adult Education, Adult Supplemental Education,Special Education Coop and Tuition Reimbursement.
*Enrollment (FTE) includes the enrollment of the district used for state aid and budget authority, and all other preschool enrollmentand kindergarten students attending full time.
Capital Improvements (4000)
0
50,000
100,000
150,000
200,000
250,000
300,000
350,000
400,000
2003-2004 2004-2005 2005-2006
11/3/2005 3:59 PM Sumexpen.xls Page 12 of 19
USD# 443
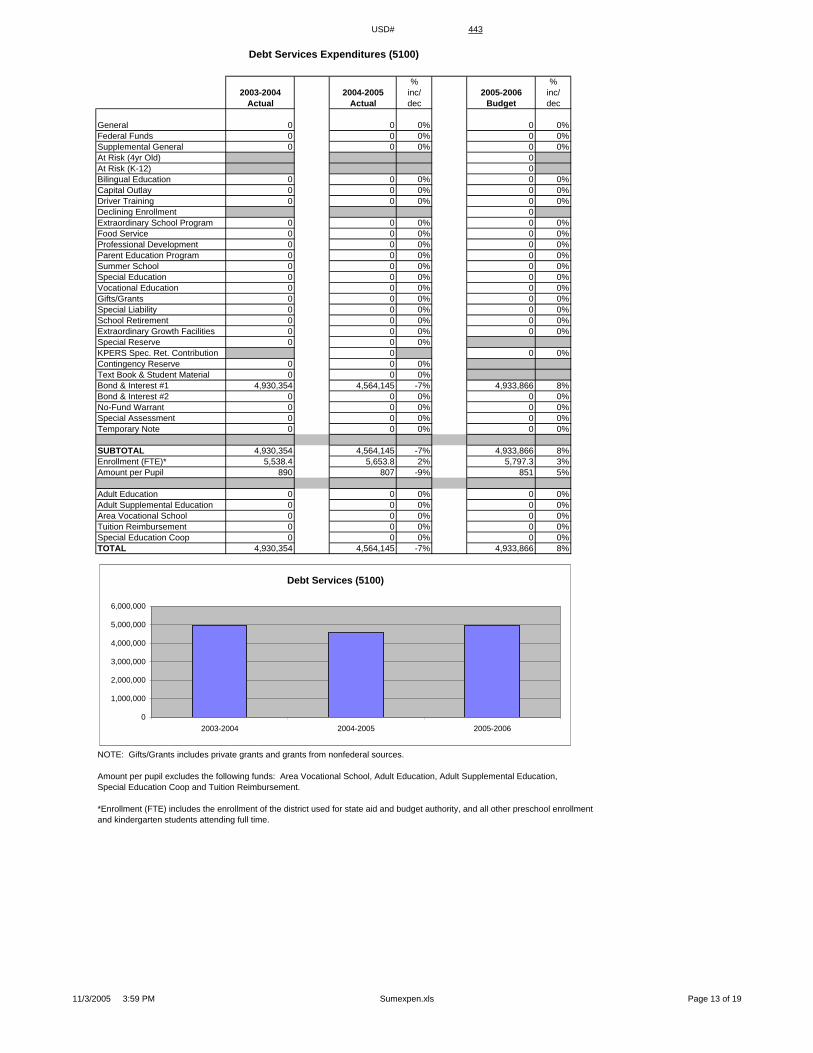
Debt Services Expenditures (5100)
% %2003-2004 2004-2005 inc/ 2005-2006 inc/
Actual Actual dec Budget dec
General 0 0 0% 0 0%Federal Funds 0 0 0% 0 0%Supplemental General 0 0 0% 0 0%At Risk (4yr Old) 0At Risk (K-12) 0Bilingual Education 0 0 0% 0 0%Capital Outlay 0 0 0% 0 0%Driver Training 0 0 0% 0 0%Declining Enrollment 0Extraordinary School Program 0 0 0% 0 0%Food Service 0 0 0% 0 0%Professional Development 0 0 0% 0 0%Parent Education Program 0 0 0% 0 0%Summer School 0 0 0% 0 0%Special Education 0 0 0% 0 0%Vocational Education 0 0 0% 0 0%Gifts/Grants 0 0 0% 0 0%Special Liability 0 0 0% 0 0%School Retirement 0 0 0% 0 0%Extraordinary Growth Facilities 0 0 0% 0 0%Special Reserve 0 0 0%KPERS Spec. Ret. Contribution 0 0 0%Contingency Reserve 0 0 0%Text Book & Student Material 0 0 0%Bond & Interest #1 4,930,354 4,564,145 -7% 4,933,866 8%Bond & Interest #2 0 0 0% 0 0%No-Fund Warrant 0 0 0% 0 0%Special Assessment 0 0 0% 0 0%Temporary Note 0 0 0% 0 0%
SUBTOTAL 4,930,354 4,564,145 -7% 4,933,866 8%Enrollment (FTE)* 5,538.4 5,653.8 2% 5,797.3 3%Amount per Pupil 890 807 -9% 851 5%
Adult Education 0 0 0% 0 0%Adult Supplemental Education 0 0 0% 0 0%Area Vocational School 0 0 0% 0 0%Tuition Reimbursement 0 0 0% 0 0%Special Education Coop 0 0 0% 0 0%TOTAL 4,930,354 4,564,145 -7% 4,933,866 8%
NOTE: Gifts/Grants includes private grants and grants from nonfederal sources.
Amount per pupil excludes the following funds: Area Vocational School, Adult Education, Adult Supplemental Education,Special Education Coop and Tuition Reimbursement.
*Enrollment (FTE) includes the enrollment of the district used for state aid and budget authority, and all other preschool enrollmentand kindergarten students attending full time.
Debt Services (5100)
0
1,000,000
2,000,000
3,000,000
4,000,000
5,000,000
6,000,000
2003-2004 2004-2005 2005-2006
11/3/2005 3:59 PM Sumexpen.xls Page 13 of 19

USD# 443
Transfers (5200)
% %2003-2004 2004-2005 inc/ 2005-2006 inc/
Actual Actual dec Budget dec
General 5,997,011 5,463,545 -9% 7,324,670 34%Federal Funds 0 0 0% 0 0%Supplemental General 2,317,829 985,000 -58% 1,200,000 22%At Risk (4yr Old) 0At Risk (K-12) 0Bilingual Education 0 0 0% 0 0%Capital Outlay 0Driver Training 0 0 0% 0 0%Declining Enrollment 0Extraordinary School Program 0 0 0% 0 0%Food Service 0 0 0% 0 0%Professional Development 0 0 0% 0 0%Parent Education Program 0 0 0% 0 0%Summer School 0 0 0% 0 0%Special Education 0 0 0% 0 0%Vocational Education 0 0 0% 0 0%Gifts/Grants 0 0 0% 0 0%Special Liability 0 0 0% 0 0%School Retirement 0 0 0% 0 0%Extraordinary Growth Facilities 0 0 0% 0 0%Special Reserve 0 0 0%KPERS Spec. Ret. Contribution 0 0 0%Contingency Reserve 0 0 0%Text Book & Student Material 0 0 0%Bond & Interest #1 0 0 0% 0 0%Bond & Interest #2 0 0 0% 0 0%No-Fund Warrant 0 0 0% 0 0%Special Assessment 0 0 0% 0 0%Temporary Note 0 0 0% 0 0%
SUBTOTAL 8,314,840 6,448,545 -22% 8,524,670 32%Enrollment (FTE)* 5,538.4 5,653.8 2% 5,797.3 3%Amount per Pupil 1,501 1,141 -24% 1,470 29%
Adult Education 0 0 0% 0 0%Adult Supplemental Education 0 0 0% 0 0%Area Vocational School 0 0 0% 0 0%Tuition Reimbursement 0 0 0% 0 0%Special Education Coop 0 0 0% 0 0%TOTAL 8,314,840 6,448,545 -22% 8,524,670 32%
NOTE: Gifts/Grants includes private grants and grants from nonfederal sources.
Amount per pupil excludes the following funds: Area Vocational School, Adult Education, Adult Supplemental Education,Special Education Coop and Tuition Reimbursement.
*Enrollment (FTE) includes the enrollment of the district used for state aid and budget authority, and all other preschool enrollmentand kindergarten students attending full time.
Transfers (5200)
0
1,000,000
2,000,000
3,000,000
4,000,000
5,000,000
6,000,000
7,000,000
8,000,000
9,000,000
2003-2004 2004-2005 2005-2006
11/3/2005 3:59 PM Sumexpen.xls Page 14 of 19
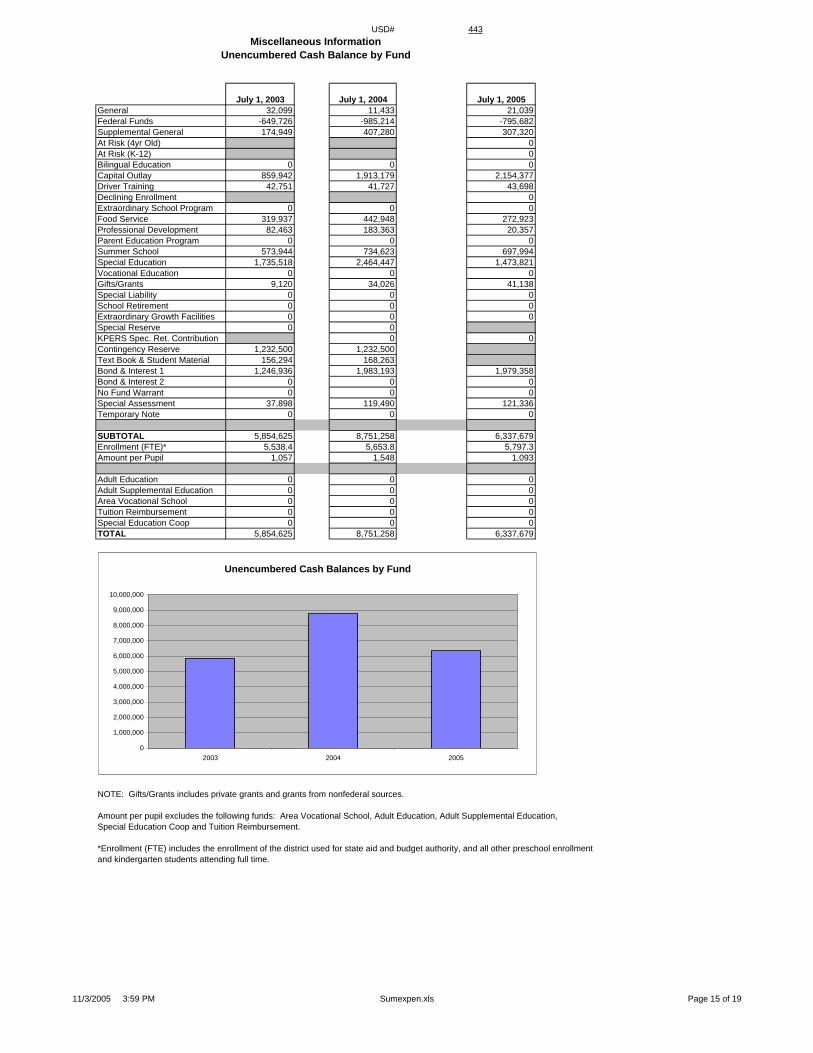
USD# 443Miscellaneous Information
Unencumbered Cash Balance by Fund
July 1, 2003 July 1, 2004 July 1, 2005General 32,099 11,433 21,039Federal Funds -649,726 -985,214 -795,682Supplemental General 174,949 407,280 307,320At Risk (4yr Old) 0At Risk (K-12) 0Bilingual Education 0 0 0Capital Outlay 859,942 1,913,179 2,154,377Driver Training 42,751 41,727 43,698Declining Enrollment 0Extraordinary School Program 0 0 0Food Service 319,937 442,948 272,923Professional Development 82,463 183,363 20,357Parent Education Program 0 0 0Summer School 573,944 734,623 697,994Special Education 1,735,518 2,464,447 1,473,821Vocational Education 0 0 0Gifts/Grants 9,120 34,026 41,138Special Liability 0 0 0School Retirement 0 0 0Extraordinary Growth Facilities 0 0 0Special Reserve 0 0KPERS Spec. Ret. Contribution 0 0Contingency Reserve 1,232,500 1,232,500Text Book & Student Material 156,294 168,263Bond & Interest 1 1,246,936 1,983,193 1,979,358Bond & Interest 2 0 0 0No Fund Warrant 0 0 0Special Assessment 37,898 119,490 121,336Temporary Note 0 0 0
SUBTOTAL 5,854,625 8,751,258 6,337,679Enrollment (FTE)* 5,538.4 5,653.8 5,797.3Amount per Pupil 1,057 1,548 1,093
Adult Education 0 0 0Adult Supplemental Education 0 0 0Area Vocational School 0 0 0Tuition Reimbursement 0 0 0Special Education Coop 0 0 0TOTAL 5,854,625 8,751,258 6,337,679
NOTE: Gifts/Grants includes private grants and grants from nonfederal sources.
Amount per pupil excludes the following funds: Area Vocational School, Adult Education, Adult Supplemental Education,Special Education Coop and Tuition Reimbursement.
*Enrollment (FTE) includes the enrollment of the district used for state aid and budget authority, and all other preschool enrollmentand kindergarten students attending full time.
Unencumbered Cash Balances by Fund
0
1,000,000
2,000,000
3,000,000
4,000,000
5,000,000
6,000,000
7,000,000
8,000,000
9,000,000
10,000,000
2003 2004 2005
11/3/2005 3:59 PM Sumexpen.xls Page 15 of 19

USD# 443
Reserve FundsUnencumbered Cash Balance
July 1, 2003 July 1, 2004Special Reserve 0 0TOTAL OTHER 0 0Amount per Pupil $0 $0
*School districts are authorized by law to self insure rather than purchase insurance for the following categories: Worker's Comp,Health Insurance, Life Insurance, Property and Casualty (Risk Management) and Disability Income Insurance. Monies are placedin the Self Insured Fund to pay for claims which may arise from the categories listed above.
Unencumbered Cash Balances by Fund (Reserve Funds Only)
0
0
0
0
0
1
1
1
1
1
1
2003 2004
11/3/2005 3:59 PM Sumexpen.xls Page 16 of 19
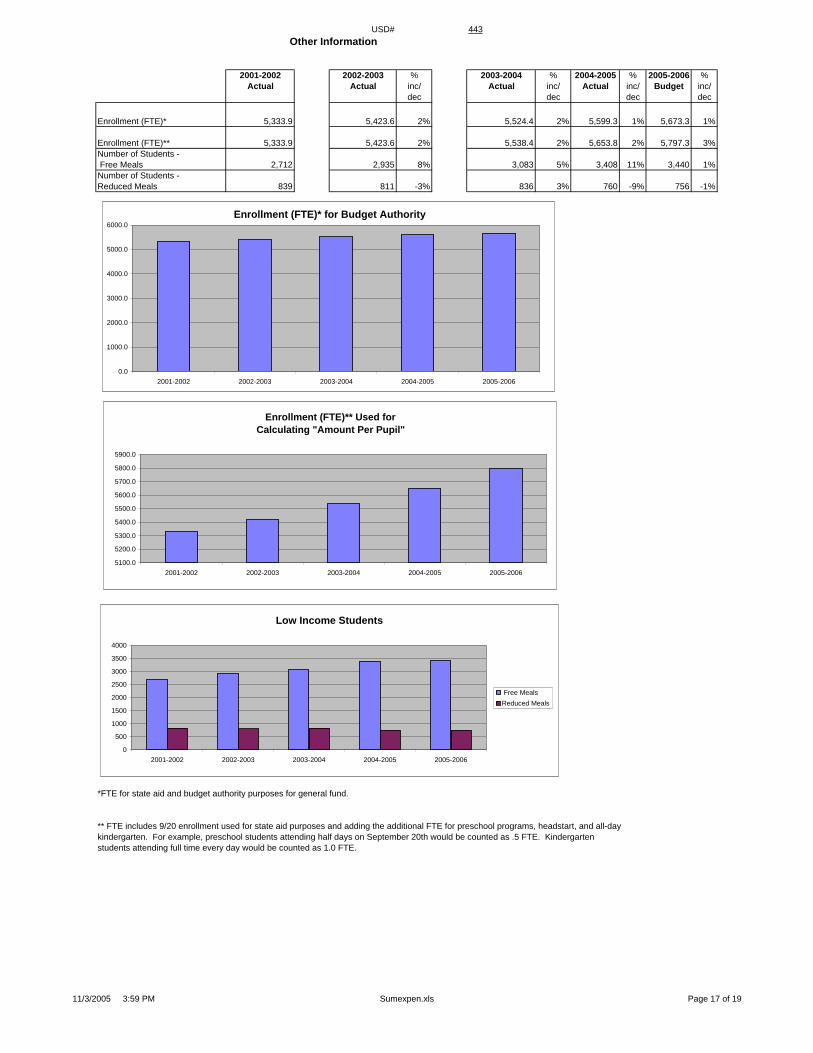
USD# 443Other Information
2001-2002 2002-2003 % 2003-2004 % 2004-2005 % 2005-2006 %Actual Actual inc/ Actual inc/ Actual inc/ Budget inc/
dec dec dec dec
Enrollment (FTE)* 5,333.9 5,423.6 2% 5,524.4 2% 5,599.3 1% 5,673.3 1%
Enrollment (FTE)** 5,333.9 5,423.6 2% 5,538.4 2% 5,653.8 2% 5,797.3 3%Number of Students - Free Meals 2,712 2,935 8% 3,083 5% 3,408 11% 3,440 1%Number of Students - Reduced Meals 839 811 -3% 836 3% 760 -9% 756 -1%
*FTE for state aid and budget authority purposes for general fund.
** FTE includes 9/20 enrollment used for state aid purposes and adding the additional FTE for preschool programs, headstart, and all-daykindergarten. For example, preschool students attending half days on September 20th would be counted as .5 FTE. Kindergartenstudents attending full time every day would be counted as 1.0 FTE.
Enrollment (FTE)* for Budget Authority
0.0
1000.0
2000.0
3000.0
4000.0
5000.0
6000.0
2001-2002 2002-2003 2003-2004 2004-2005 2005-2006
Low Income Students
0
500
1000
1500
2000
2500
3000
3500
4000
2001-2002 2002-2003 2003-2004 2004-2005 2005-2006
Free MealsReduced Meals
Enrollment (FTE)** Used for Calculating "Amount Per Pupil"
5100.0
5200.0
5300.0
5400.0
5500.0
5600.0
5700.0
5800.0
5900.0
2001-2002 2002-2003 2003-2004 2004-2005 2005-2006
11/3/2005 3:59 PM Sumexpen.xls Page 17 of 19

USD# 443
Miscellaneous InformationMill Rates by Fund
2003-2004 2004-2005 2005-2006Actual Actual Budget
General 20.000 20.000 20.000Supplemental General 9.682 16.274 18.712Adult Education 0.000 0.000 0.000Capital Outlay 3.992 3.964 4.000Declining Enrollment 0.000Special Liability 0.000 0.000 0.000School Retirement 0.000 0.000 0.000Extraordinary Growth Facilities 0.000 0.000 0.000Bond & Interest 1 16.318 13.291 13.982Bond & Interest 2 0.000 0.000 0.000No Fund Warrant 0.000 0.000 0.000Special Assessment 1.225 0.629 0.453Temporary Note 0.000 0.000 0.000TOTAL USD 51.217 54.158 57.147Historical Museum 0.000 0.000 0.000Public Library Board 0.000 0.000 0.000Public Library Brd & Emp Benf 0.000 0.000 0.000Recreation Commission 0.000 0.000 0.000Recreation Commission Employee Benefit 0.000 0.000 0.000TOTAL OTHER 0.000 0.000 0.000
2005-2006 Miscellaneous InformationMill Rates by Fund (Total USD)
General35%
Supplemental General33%
Capital Outlay7%
Bond & Interest 124%
Special Assessment1%
GeneralSupplemental GeneralAdult EducationCapital OutlaySpecial LiabilitySchool RetirementDeclining EnrollmentBond & Interest 1Bond & Interest 2Extraordinary Growth FacilitiesNo Fund WarrantSpecial AssessmentTemporary Note
Total USD Mill Rates
0.000
10.000
20.000
30.000
40.000
50.000
60.000
70.000
2003-2004 2004-2005 2005-2006
11/3/2005 3:59 PM Sumexpen.xls Page 18 of 19

USD# 443Other Information
2003-2004 2004-2005 2005-2006Actual Actual Budget
Assessed Valuation $166,414,037 $176,805,910 $173,304,418
Bonded Indebtedness $59,638,600 $56,923,600 $54,448,600
Assessed Valuation
$0$20,000,000$40,000,000$60,000,000$80,000,000
$100,000,000$120,000,000$140,000,000$160,000,000$180,000,000$200,000,000
2003-2004 2004-2005 2005-2006
Bonded Indebtedness
$0
$10,000,000
$20,000,000
$30,000,000
$40,000,000
$50,000,000
$60,000,000
$70,000,000
2003-2004 2004-2005 2005-2006
11/3/2005 3:59 PM Sumexpen.xls Page 19 of 19