does a leapfrogging growth strategy raise growth rate?
TRANSCRIPT
Does a Leapfrogging Growth Strategy Raise Growth Rate?
Shang-Jin WeiColumbia University
The World Bank ABCDE ConferenceStockholm, Sweden, May 31-June 2, 2010
Introduction
The 2008-2009 global economic crisis represented a major scare for many economies
Opportune time to reflect on growth models All countries want to grow fast on a sustained basis
“Growth miracles” earn admiration “Four little dragons” The tiger economies: Malaysia, Thailand and Indonesia Recent “growth miracles”: China, India
Is there a recipe for “growth miracle” that can be replicated in the future and by other economies?
Roles of government in “growth miracles”
Passable institutions (e.g., control of corruption) Political stability Macroeconomic stability Infrastructure Trade openness Leapfrogging?
Use of government policies to promote high-tech and high domestic value added industries, presumably beyond endowment and current stage of development
Example: Trade openness Taking down barriers to both imports and exports De-monopolizing / “democratization” of trading rights Not letting the real exchange rate over-valued ≠ “outward oriented strategy” since it doesn’t have to come
with an open capital account Evidence is overwhelmingly in favor Frankel and Romer (AER 1999)
Skepticism: Rodriguez and Rodrik, 2000 “Life and death implications” Wei & Wu, 2004 New evidence: Feyrer (2009) Evidence in Kose, Prasad, Rogoff and Wei (2003) & (2009)
Leapfrogging Use of government policies to promote high-tech and high
value added industries, presumably beyond current stage of development and factor endowment
Not bound by but to leapfrog or jump ahead of comparative advantage Unlike trade openness and growth, systematic evidence on
leapfrogging and growth is rare Primary reason is data challenge: not easy to define
sophistication of production beyond one’s endowment, and therefore difficult to quantify leapfrogging
The only but influential study: Hausman, Hwang and Rodrik (2007)
Review some new evidence on leapfrogging and growth based on cross country experiences and variations across regions within a large Asian economy
“Does a leapfrogging growth strategy raise growth rate? Some international evidence,” by Zhi Wang, Shang-Jin Wei, and Anna Wong.
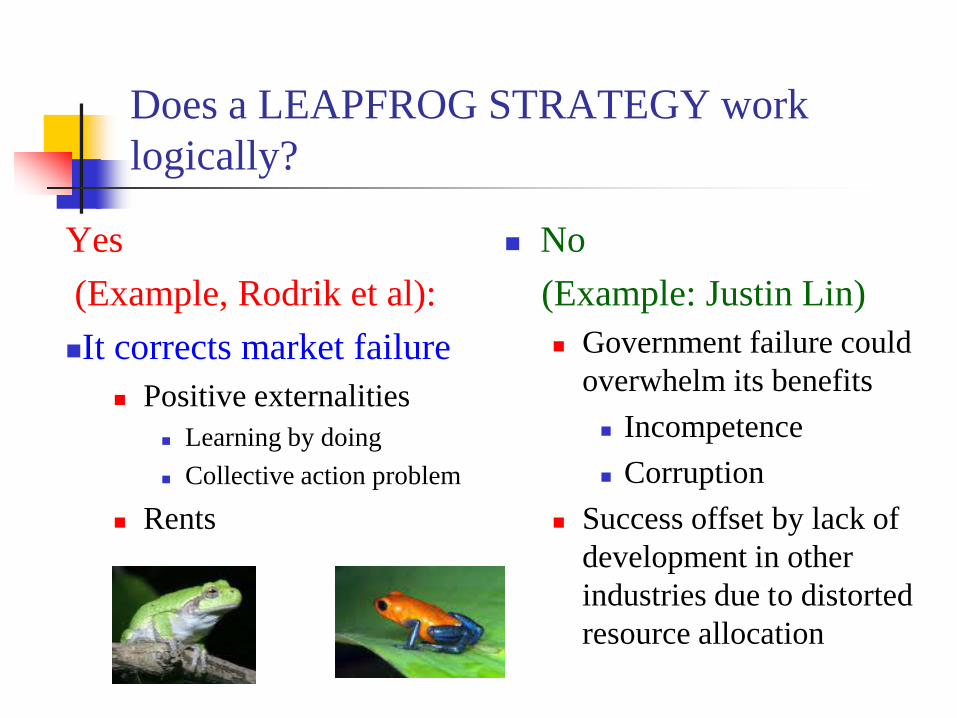
Does a LEAPFROG STRATEGY work logically?
Yes(Example, Rodrik et al):It corrects market failure
Positive externalities Learning by doing Collective action problem
Rents
No (Example: Justin Lin) Government failure could
overwhelm its benefits Incompetence Corruption
Success offset by lack of development in other industries due to distorted resource allocation
Nuiances Harrison, Ann, and Andrés Rodríguez-
Clare, 2010, “Trade, Foreign Investment, and Industrial Policy for Developing Countries,” chapter in Handbook of Development Economics.
Justin Lin (2010): latent comparative advantage
Only one paper so far provides evidence, which seems to affirm a role for leapfrogging
Hausman, Hwang, and Rodrik (2007)“What You Export Matters,” Journal of Economic Growth, 2007
Rodrik (2007), “What is special about China’s exports?”But the measure of leapfrogging is problematicSchott: same product from different exporters can have vast different unit valuescan benefit from cross checking against alternative measures

Export Sophistication (HHR) and Government share of R&D, 2005
New evidence from Wang, Wei and Wong
Overcoming the measuring issue How to measure sophistication of production structure beyond
average K/L ratio may be too coarse
Measuring leapfrogging Production sophistication difficult to measure
Government efforts not always quantifiable Existing data too coarse (100 sectors or less) Not international comparable
One solution: use trade data Export structure reflects production structure Far more detailed product/sector classification (5000
products rather than 100 sectors) Internationally comparable
Another (subtle) reason for using the trade data Leapfrogging policy can work only if it promotes an
industry that a country has “latent comparative advantage”
So it has to show up in exports at some point
“In all cases in which infant-industry protection has supposedly been successful, the infant sector eventually generates significant exports. It is simply hard to imagine otherwise.” Harrison and Rodriguez-Clare (2010)
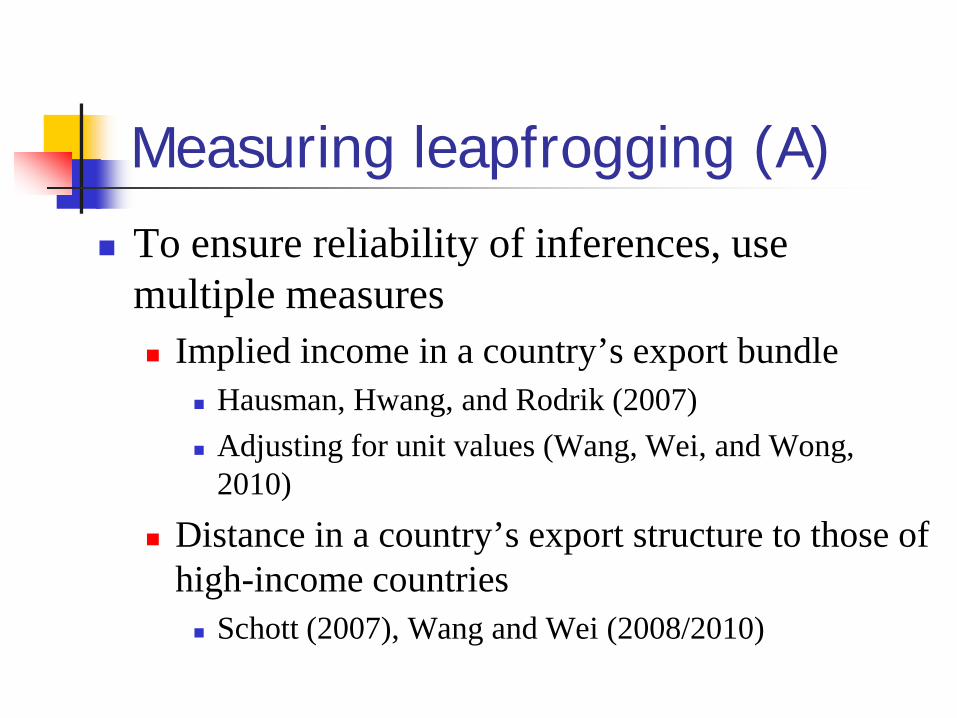
Measuring leapfrogging (A) To ensure reliability of inferences, use
multiple measures Implied income in a country’s export bundle
Hausman, Hwang, and Rodrik (2007) Adjusting for unit values (Wang, Wei, and Wong,
2010) Distance in a country’s export structure to those of
high-income countries Schott (2007), Wang and Wei (2008/2010)
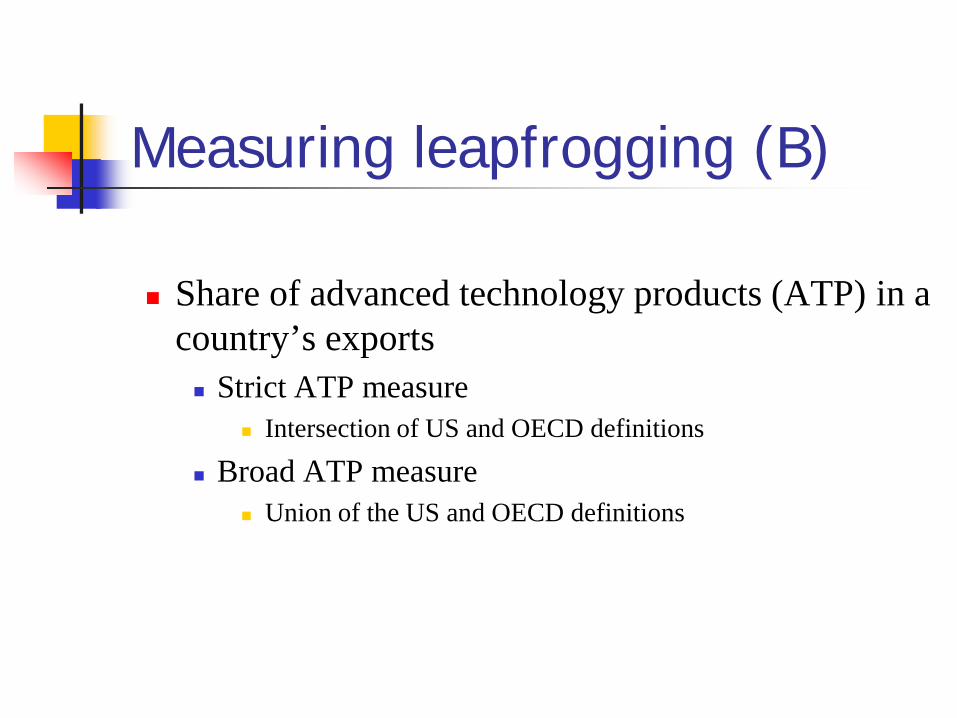
Measuring leapfrogging (B)
Share of advanced technology products (ATP) in a country’s exports Strict ATP measure
Intersection of US and OECD definitions
Broad ATP measure Union of the US and OECD definitions
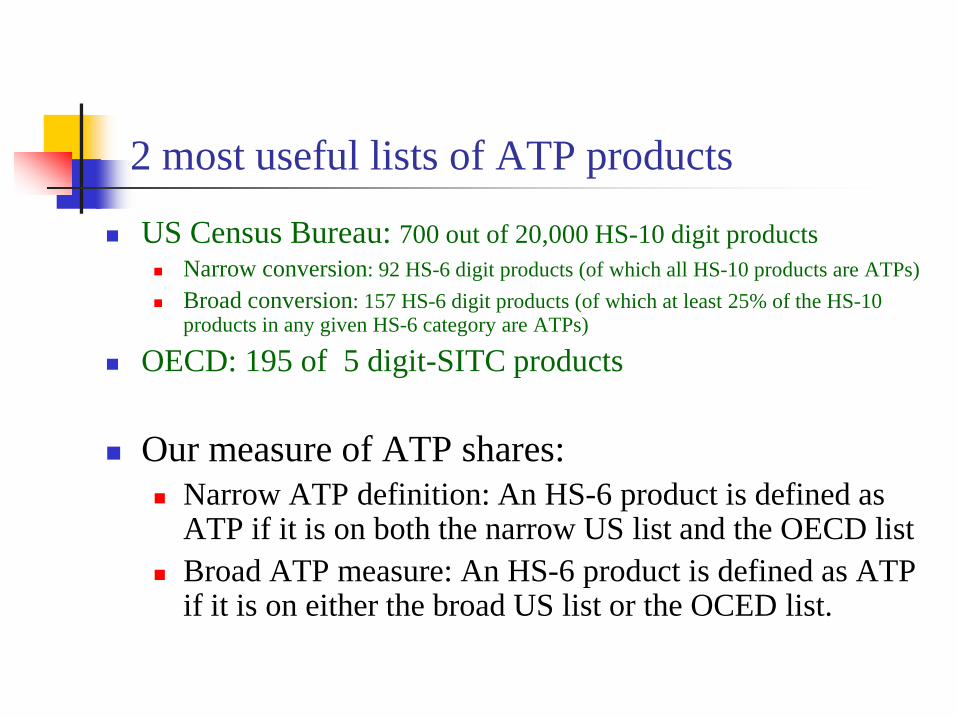
2 most useful lists of ATP products
US Census Bureau: 700 out of 20,000 HS-10 digit products Narrow conversion: 92 HS-6 digit products (of which all HS-10 products are ATPs) Broad conversion: 157 HS-6 digit products (of which at least 25% of the HS-10
products in any given HS-6 category are ATPs)
OECD: 195 of 5 digit-SITC products
Our measure of ATP shares: Narrow ATP definition: An HS-6 product is defined as
ATP if it is on both the narrow US list and the OECD list Broad ATP measure: An HS-6 product is defined as ATP
if it is on either the broad US list or the OCED list.
Example: ATP share in exports
High Tech HS 6 Category Line Examples…
Measuring leapfrogging For any given measure, benchmark it against per
capita income and human capital (proxied by average years of schooling) in a statistical regression framework
In other words, not absolute but relative sophistication is taken as a measure of leapfrogging
Examine leapfrogging and growth across countries
In a standard cross-country growth regression of per capital income, embed a measure of export sophistication, conditional on initial income, human capital, and government effectiveness
42 countries, 1992-2003

Empirical results (1) Across five measures of leapfrogging
Only the original Hausman, Hwang and Rodrik measure is significant
Doesn’t survive adjustment for product quality (unit value)
Doesn’t survive adding regional dummies Distance to export structure of high-income
countries, and ATP shares are not significant
Empirical results (2) Across five measures of leapfrogging
Only the original Hausman, Hwang and Rodrik measure is significant
Doesn’t survive adjustment for product quality (unit value)
Doesn’t survive adding regional dummies Distance to export structure of high-income
countries, and ATP shares are not significant
Empirical results (3) “Leapfrogging” may be endogenous (and/or
measured with errors) Instrumental variables:
National leaders’ professional and educational background (Dreher, Lamla, Lein, and Somogyi, 2008)
Population size and land mass (a large internal market is more likely to generate enough initial scale to justify the initial investment in leapfrogging)
In IV regressions, none of the 5 measures of leapfrogging is significant
Empirical results (4) Allowing effects of leapfrogging to take time
Add lags of leapfrogging up to 6 years The sum of the coefficients on the lags is not
significant for any of the 5 measures Conclusion: No strong and robust evidence across
different measures of leapfrogging that a leapfrogging strategy raises growth rate systematically
Empirical results (5) Consider “leapfrogging” policies on the
import side Average tariff on ATP products
Not a significant predictor of growth
Empirical results (6) An attempt to distinguish two types of leapfrogs
to exploit latent comparative advantage to defy comparative advantage
Idea: small amount of leapfrogging might be growth-enhancing, even though substantial amount of leapfrogging is not
Implementation: Include both level and quadratic terms of leapfrog
Result: Neither is significant
Additional evidence: within a country
Why supplement cross-country evidence? History, legal system, and other institutions
can be more plausibly held constant Evidence from regional variations within
China? Lots of local government activism Many geographic units -> statistical power
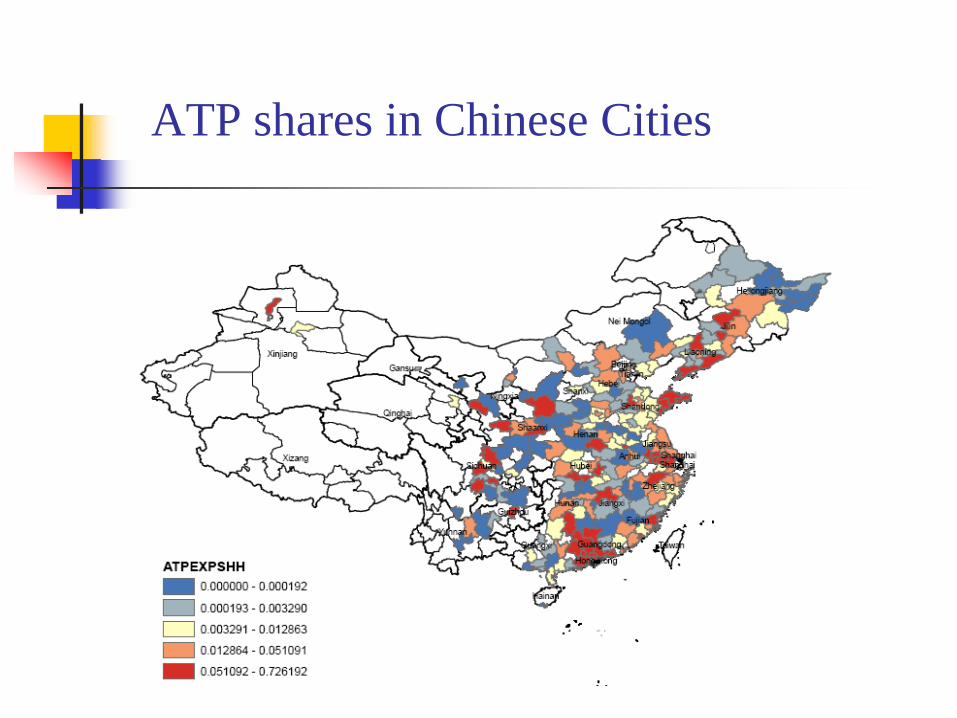
ATP shares in Chinese Cities
Evidence from within China
Same statistical framework: Relate regional per capita GDP growth to one of
several measures of local leapfrogging
Result: No strong and robust support across measures for a positive growth effect of a leapfrogging strategy

Summary (1) While one could make a case in theory for a
leapfrogging strategy, and one can give anecdotes of success, there is no systematic, robust, and strong evidence in the data, either across countries, or across regions within a large country, that such a strategy actually systematically raises growth rate.
Smart interventions – ones that can identify market failure, avoid rent-seeking and special interest capture – are difficult
Summary (2) Doesn’t mean no role for governments More research needed on “soft industrial policies” and
policies to expedite the realization of latent comparative advantage (Lin, Harrison and Rodriguez-Claire)
“.. . . growth was not a passive, trickle-down strategy for helping the poor. It was an active, pull-up strategy instead. It required a government that would energetically take steps to accelerate growth, through a variety of policies including building infrastructure such as roads and ports and attracting foreign funds.“ Jagdish Bhagwati (2004)

Thank you!


Evidence from within China
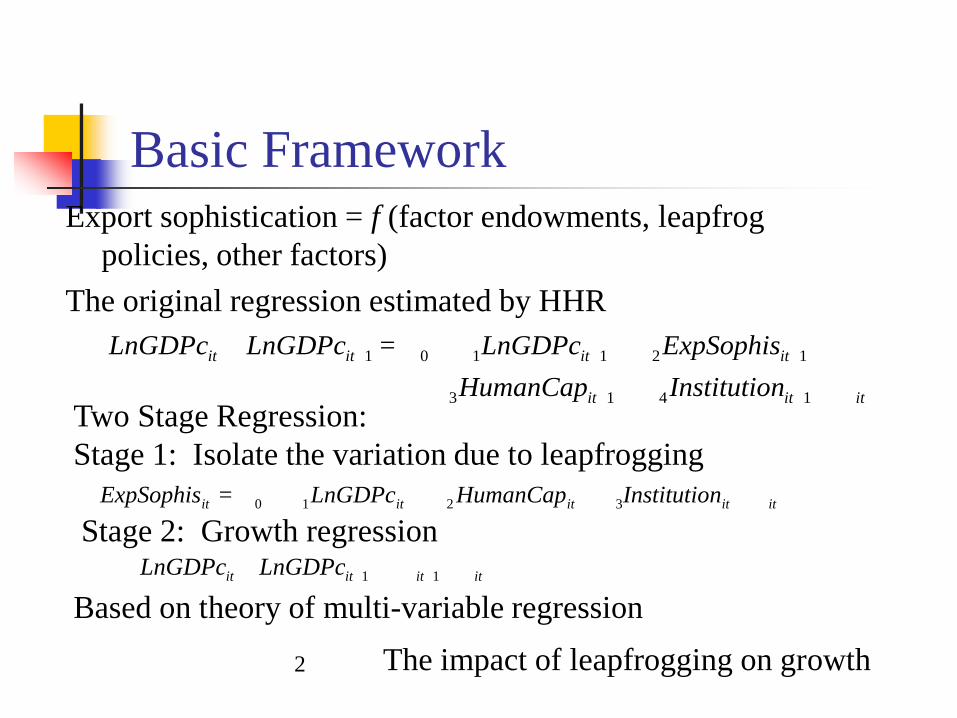
Basic FrameworkExport sophistication = f (factor endowments, leapfrog
policies, other factors)The original regression estimated by HHR
ititititit nInstitutioHumanCapLnGDPc=ExpSophis 3210
ititit
itititit
nInstitutioHumanCapExpSophisLnGDPc=LnGDPcLnGDPc
1413
121101
Two Stage Regression:Stage 1: Isolate the variation due to leapfrogging
Stage 2: Growth regression
Based on theory of multi-variable regressionitititit LnGDPcLnGDPc 11
2 The impact of leapfrogging on growth
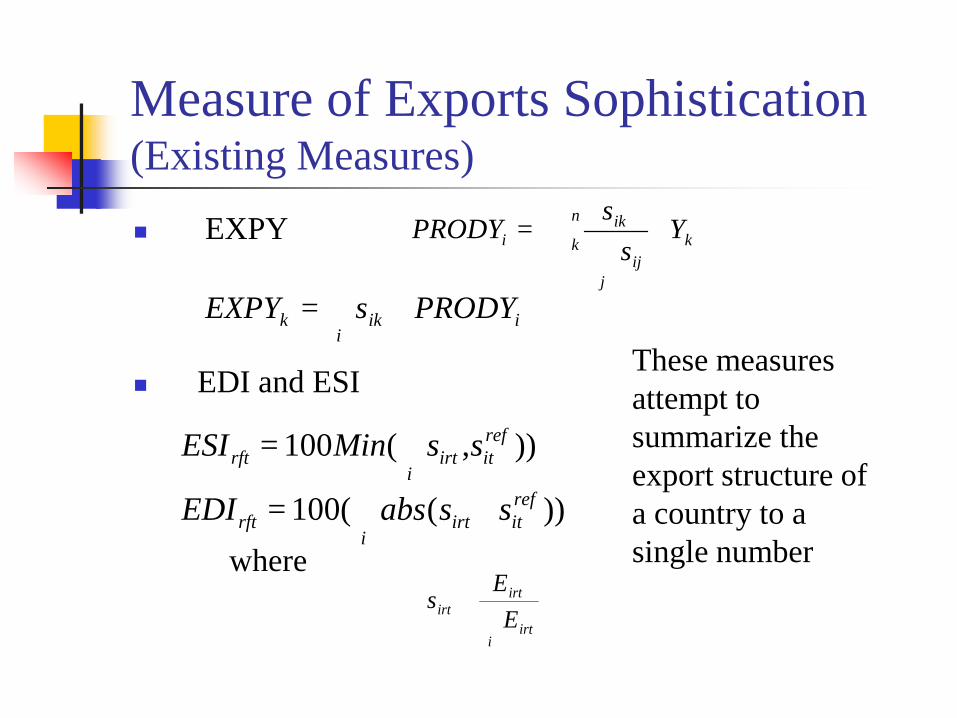
Measure of Exports Sophistication (Existing Measures) EXPY
EDI and ESI
where))((100 ref
iti
irtrft ssabs=EDI
iirt
irtirt E
Es
These measures attempt to summarize the export structure of a country to a single number
n
k k
jij
iki Y
ss
=PRODY
ii
ikk PRODYs=EXPY
)),(100 refit
iirtrft ssMin=ESI
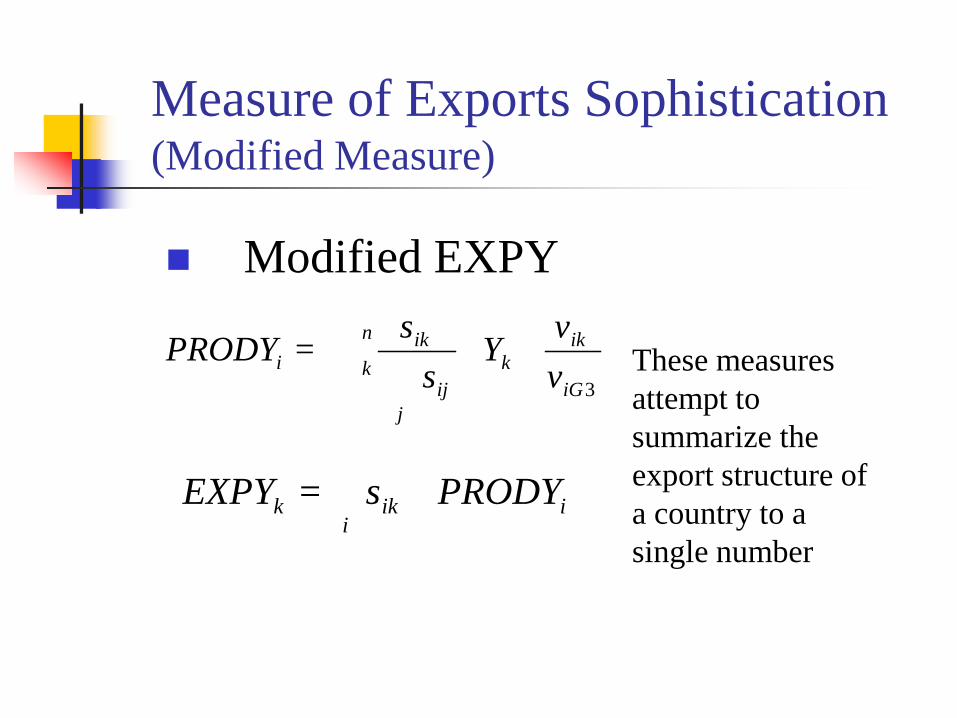
Measure of Exports Sophistication (Modified Measure)
Modified EXPY
These measures attempt to summarize the export structure of a country to a single number
3iG
ikn
k k
jij
iki v
vY
ss
=PRODY
ii
ikk PRODYs=EXPY
Do the Proposed Measures Capture Export Sophistication ?
Problems Assume that goods exported by wealthy
countries are more sophisticated Larger and more advanced countries export
a larger set of commodity space The rankings from table 3 show that the top
ranked countries according to the original EXPY are mostly wealthy countries
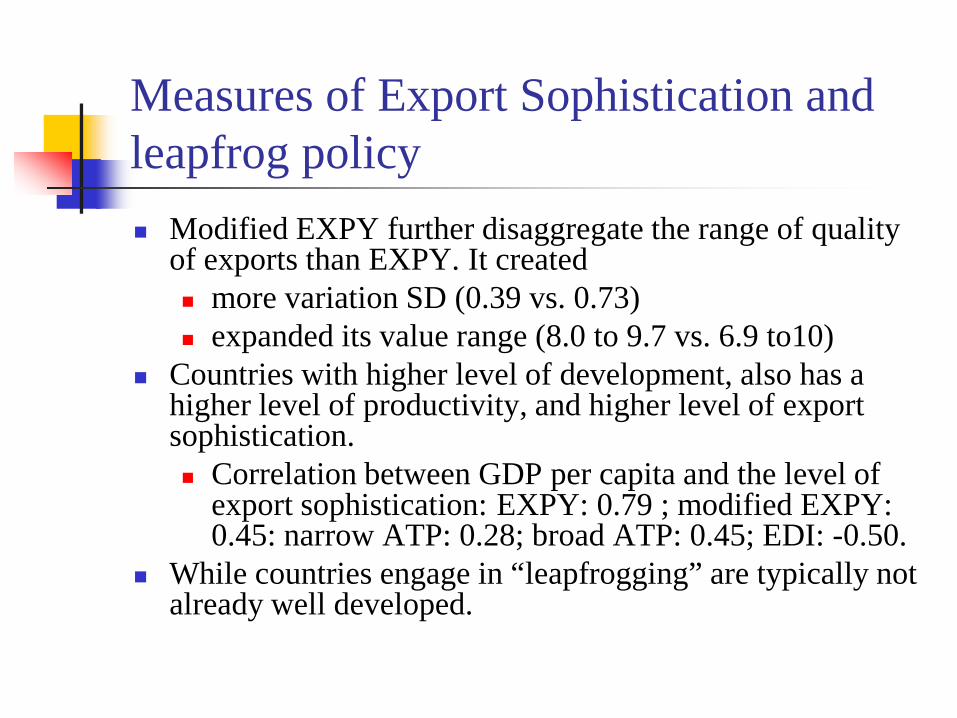
Measures of Export Sophistication and leapfrog policy Modified EXPY further disaggregate the range of quality
of exports than EXPY. It created more variation SD (0.39 vs. 0.73) expanded its value range (8.0 to 9.7 vs. 6.9 to10)
Countries with higher level of development, also has a higher level of productivity, and higher level of export sophistication. Correlation between GDP per capita and the level of
export sophistication: EXPY: 0.79 ; modified EXPY: 0.45: narrow ATP: 0.28; broad ATP: 0.45; EDI: -0.50.
While countries engage in “leapfrogging” are typically not already well developed.
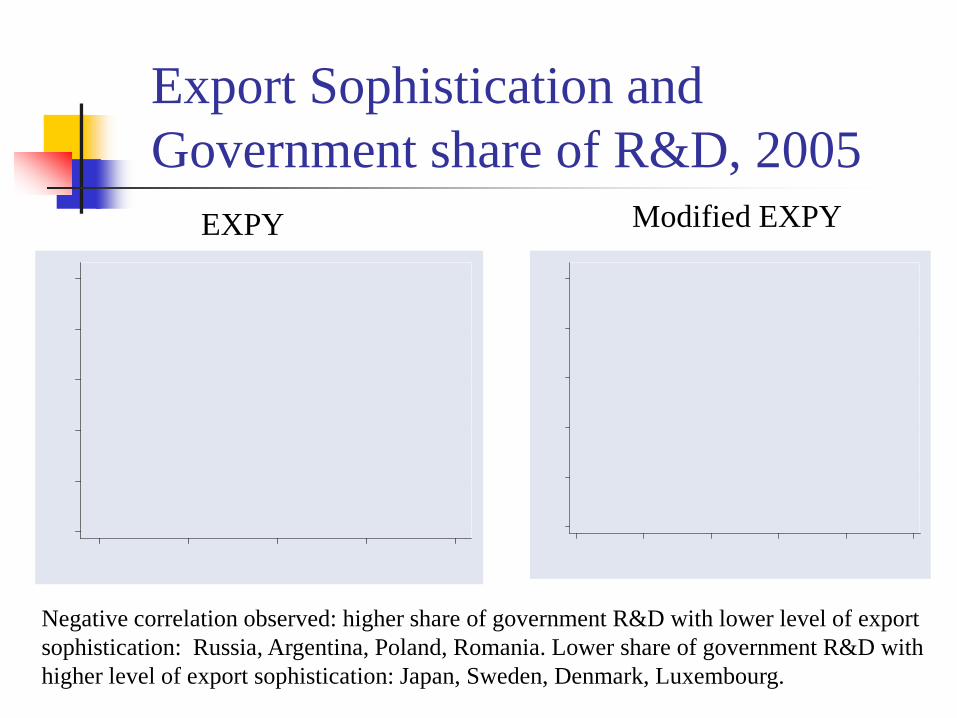
Export Sophistication and Government share of R&D, 2005
EXPY Modified EXPY
Negative correlation observed: higher share of government R&D with lower level of exportsophistication: Russia, Argentina, Poland, Romania. Lower share of government R&D withhigher level of export sophistication: Japan, Sweden, Denmark, Luxembourg.
Export Sophistication and Government share of R&D, 2005
A country produces sophisticated goods according to its comparative advantage is not a leapfrogger;
A country whose government implements industry policies to promote relevant sectors beyond what would naturally emerge from its factor endowment is a leapfrogger.
Changes in export sophistication may contain more information about the country’s leapfrogging efforts.
Does export sophistication imply leapfrogging?
Replicate HHR regression with EXPY, then apply the same regression to other export sophistication measures Our regression results on EXPY are very similar, if not
exactly same, to HHR’s and indicate sophistication in the export structure does seem to be a robust contributing factor to growth. All estimated coefficients are the same (up to two places after the decimal point) and statistically significant as HHR (Table 4).
Same regression on modified EXPY, broad ATP share and EDI, their coefficients are statistically insignificant, while estimated coefficients for other explanatory variables stay very similar (Tables 5,6,7,8).
Only narrow ATP share has significant coefficient estimates as EXPY
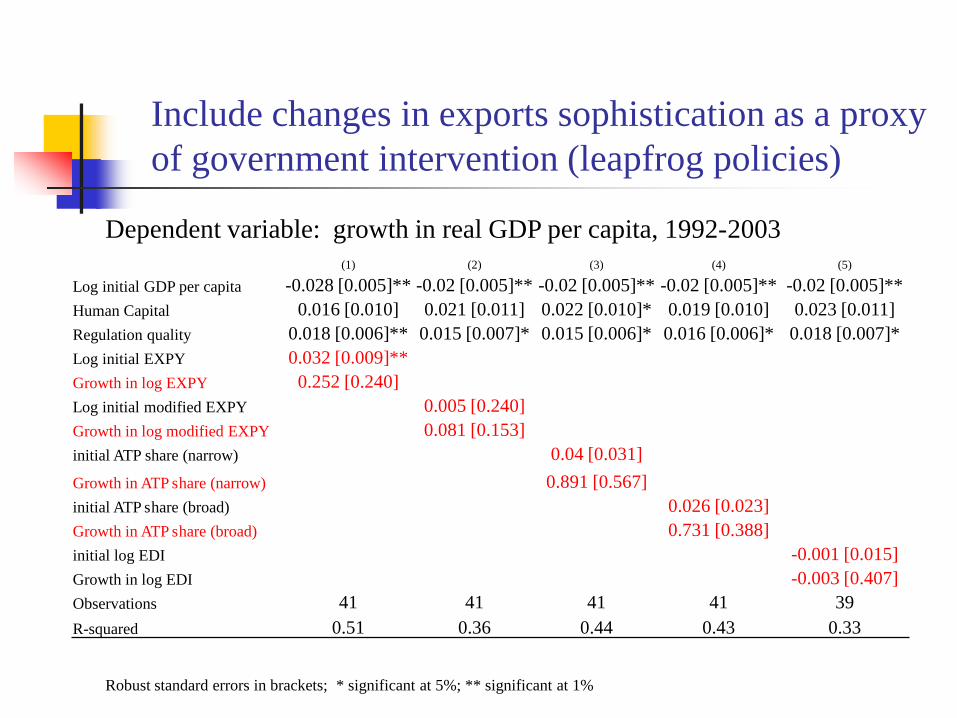
Include changes in exports sophistication as a proxy of government intervention (leapfrog policies)
(1) (2) (3) (4) (5)
Log initial GDP per capita -0.028 [0.005]** -0.02 [0.005]** -0.02 [0.005]** -0.02 [0.005]** -0.02 [0.005]**Human Capital 0.016 [0.010] 0.021 [0.011] 0.022 [0.010]* 0.019 [0.010] 0.023 [0.011]Regulation quality 0.018 [0.006]** 0.015 [0.007]* 0.015 [0.006]* 0.016 [0.006]* 0.018 [0.007]*Log initial EXPY 0.032 [0.009]**Growth in log EXPY 0.252 [0.240]Log initial modified EXPY 0.005 [0.240]Growth in log modified EXPY 0.081 [0.153]initial ATP share (narrow) 0.04 [0.031]Growth in ATP share (narrow) 0.891 [0.567]initial ATP share (broad) 0.026 [0.023]Growth in ATP share (broad) 0.731 [0.388]initial log EDI -0.001 [0.015]Growth in log EDI -0.003 [0.407]Observations 41 41 41 41 39R-squared 0.51 0.36 0.44 0.43 0.33
Robust standard errors in brackets; * significant at 5%; ** significant at 1%
Dependent variable: growth in real GDP per capita, 1992-2003
Summary EXPY variable – in both level and growth – tends to be
significant across specifications in cross country regressions;
When export sophistication is measured on alternative ways (modified EXPY, ATP share low and high, and EDI), its significant impact on growth may disappear.
HHR’s claim about the positive association between export sophistication and growth depends crucially on the construction of the export sophistication measures.
Econometric Issues Possible specification errors in HHR regression
Omission errors: Productivity shifter (policy variables) may not log-linear in growth
Unobserved heterogeneity: The growth rate of productivity (leapfrog policy) are not common across countries
Rodriguez (2007) shows a linear regression of a nonlinear data generation process will only produce the average policy affect if the policy variables are distributed according to a normal distribution.
If leapfrog policies are an effective productivity shifter (and it is the only shifter examined), as HHR theorized, then productivity growth should not be the same across country. Thus, the common productivity growth rate assumption is not realistic.
Econometric IssuesInterpretation on the coefficient of EXPY
Results of Shapiro-Wilk and Skewness/Kurtosis normality test: Normality in the distribution of EXPY and the ATP share are
rejected in both tests. Modified EXPY and EDI passed the normality test.
A linear regression may not give a meaningful interpretation on the coefficient of EXPY, even if it correctly capture the degree of leapfrogging, which itself is questionable .
Modified EXPY also appears to be a better regreessor in linear regression from econometric point of view.
Econometric Issues Endogeneity with the export sophistication measure
Instrument variables used in HHR (land and population) do not have much time variation, are likely to be invalid (their instruments do not pass the Hansen-J test).
We used an alternative set of instruments which yield more time variation: the profession and education background of political leaders.
Data set of the profession and education for more than 500 political leaders from 73 countries during 1970-2002 (Dreher, Lamla, Lein, and Somogyi, 2008)
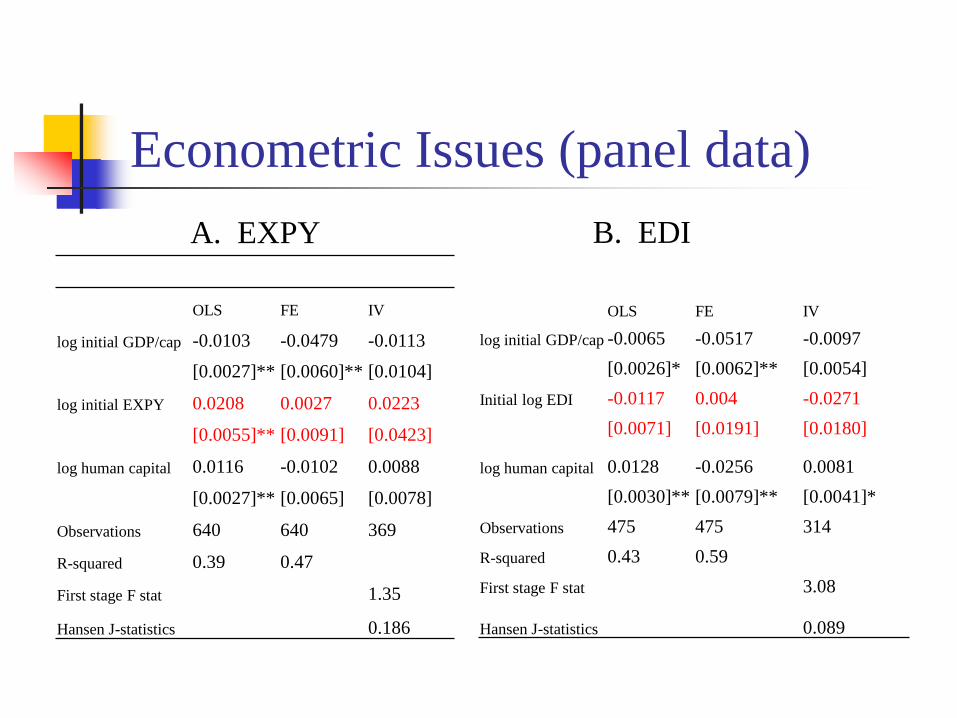
Econometric Issues (panel data)
OLS FE IV
log initial GDP/cap -0.0103 -0.0479 -0.0113
[0.0027]** [0.0060]** [0.0104]
log initial EXPY 0.0208 0.0027 0.0223
[0.0055]** [0.0091] [0.0423]
log human capital 0.0116 -0.0102 0.0088
[0.0027]** [0.0065] [0.0078]
Observations 640 640 369
R-squared 0.39 0.47
First stage F stat 1.35
Hansen J-statistics 0.186
OLS FE IV
log initial GDP/cap -0.0065 -0.0517 -0.0097[0.0026]* [0.0062]** [0.0054]
Initial log EDI -0.0117 0.004 -0.0271[0.0071] [0.0191] [0.0180]
log human capital 0.0128 -0.0256 0.0081[0.0030]** [0.0079]** [0.0041]*
Observations 475 475 314R-squared 0.43 0.59First stage F stat 3.08
Hansen J-statistics 0.089
A. EXPY B. EDI
Summary (2) No robust evidence from cross country data
in supporting leapfrogging strategy.
Both measurement problems and mis-specification in HHR seem important
No robust support for a leapfrogging development strategy.
Additional evidences:within-China investigation
Cross country growth regressions ignore the role of culture, legal systems, and other institutions.
Country comparisons, legal systems, political and other institutions are more similar within a country.
This within-China investigation provide additional complementary evidence on the efficacy of a leapfrogging strategy.
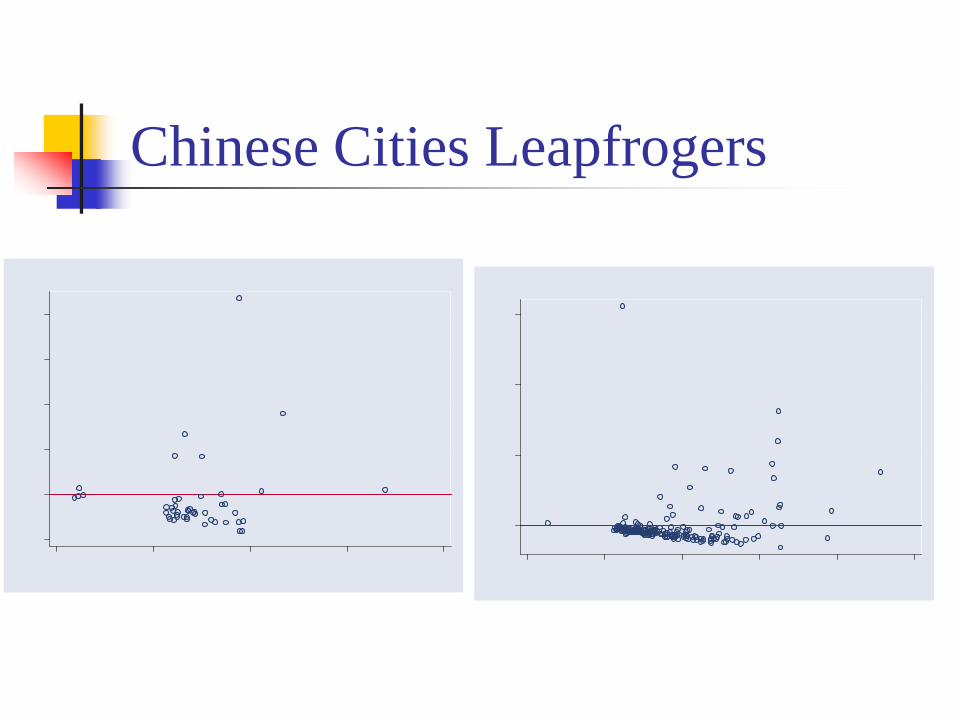
Chinese Cities Leapfrogers
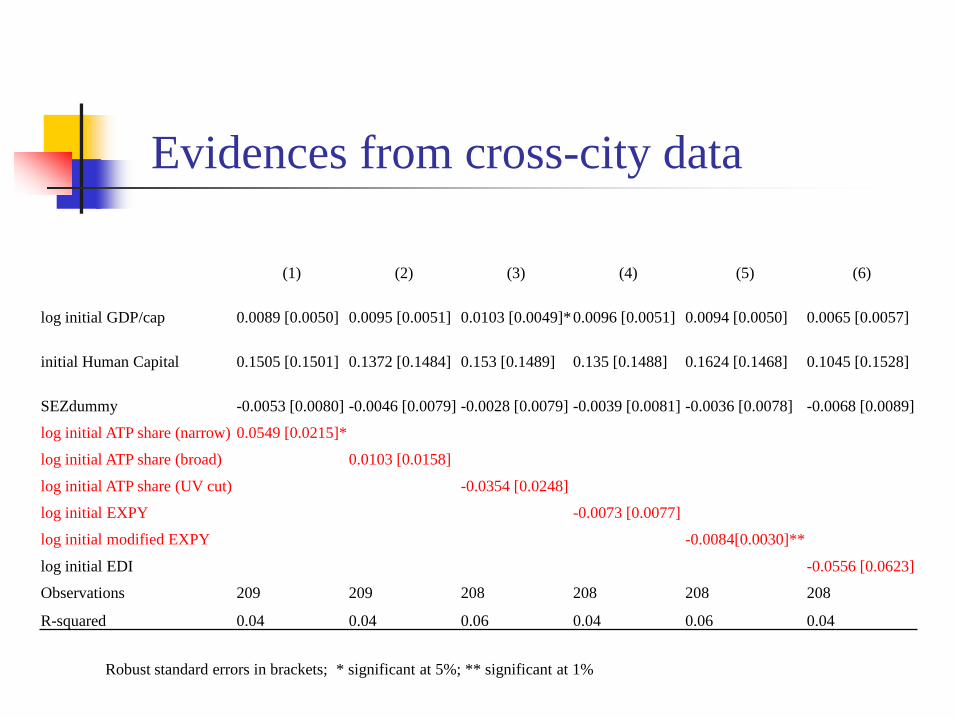
Evidences from cross-city data
Robust standard errors in brackets; * significant at 5%; ** significant at 1%
(1) (2) (3) (4) (5) (6)
log initial GDP/cap 0.0089 [0.0050] 0.0095 [0.0051] 0.0103 [0.0049]*0.0096 [0.0051] 0.0094 [0.0050] 0.0065 [0.0057]
initial Human Capital 0.1505 [0.1501] 0.1372 [0.1484] 0.153 [0.1489] 0.135 [0.1488] 0.1624 [0.1468] 0.1045 [0.1528]
SEZdummy -0.0053 [0.0080] -0.0046 [0.0079] -0.0028 [0.0079] -0.0039 [0.0081] -0.0036 [0.0078] -0.0068 [0.0089]
log initial ATP share (narrow) 0.0549 [0.0215]*
log initial ATP share (broad) 0.0103 [0.0158]
log initial ATP share (UV cut) -0.0354 [0.0248]
log initial EXPY -0.0073 [0.0077]
log initial modified EXPY -0.0084[0.0030]**
log initial EDI -0.0556 [0.0623]
Observations 209 209 208 208 208 208
R-squared 0.04 0.04 0.06 0.04 0.06 0.04
Conclusions Across countries, no strong and robust evidence that a
leapfrogging strategy contributes to a higher growth rate. Across regions within China, no such evidence either.
Empirical investigation does not support the contention that a government intervention that is aimed at raising a country’s technological sophistication beyond what is expected from its level of development could produce a better growth result on a sustained basis.