does corruption hinder investment? evidence from russian ... · does corruption hinder investment?...
TRANSCRIPT

University of Freiburg Department of International Economic Policy
Discussion Paper Series Nr. 33
February 2017
ISSN 1866-4113
Does Corruption Hinder Investment? Evidence from Russian Regions
Nikita Zakharov
©Author(s) and Department of International Economic Policy, University of Freiburg
University of Freiburg Department of International Economic Policy Discussion Paper Series
The Discussion Papers are edited by: Department of International Economic Policy Institute for Economic Research University of Freiburg D-79085 Freiburg, Germany Platz der Alten Synagoge 1
Tel: +49 761 203 2342 Fax: +49 761 203 2414 Email: [email protected]
Editor: Prof. Dr. Günther G. Schulze
ISSN: 1866-4113 Electronically published: 22.02.2017
Does Corruption Hinder Investment? Evidence from Russian Regions
Nikita Zakharov*
University of Freiburg
February 2017
Abstract
This paper investigates the causal relationship between corruption and fixed capital investment in Russian regions. The panel data on corruption allow to control for unobserved heterogeneity with fixed effects estimation. We address the problem of endogeneity by introducing novel instrumental variables for corruption: the presence of free press and violations of journalists' rights. Our main result is the strong negative effect of corruption on aggregate investment in fixed capital. Disaggregating investment by ownership, we find that corruption decreases private investment, but not investment made by state-owned companies. The effect is larger for companies with foreign ownership. We also observe a strong negative relationship between regional import of capital goods and corruption.
Key words: Corruption, Investment, Russia, Freedom of Press, Import of Capital Goods
JEL classification: E22; K42; L26; P26
* University of Freiburg, Department of Economics, Platz der Alten Synagoge 1, 79085 Freiburg, Germany, Email: [email protected]. I would like to thank Günther G. Schulze, Maryana Antipova, Antonio Farfán-
Vallespín, Gerrit Gonschorek, the participants of the 5th ICSID conference (Moscow) Andrei Yakovlev and Anna Kochanova, and the organizers of RSSIA summer school (Moscow) Michael Rochlitz, Koen Schoors, and Maria Yudkevich for helpful comments and suggestions.
1

1. Introduction
Corruption has long been recognized to be detrimental to economic growth.1 It affects growth in
different ways but, as recent studies show, its primary and by far the most important channel is domestic
investment in physical capital (Pellegrini 2011, Hodge et al. 2011). As corruption creates uncertainty of
investment outcomes (Mauro 1995; Wei 2000) and decreases the expected returns, the level of investment
is expected to decline, which translates into forgone economic growth.
While the idea is straightforward and intuitive, empirical literature does not provide sufficient
evidence on the topic. The negative relationship between corruption and investment was first empirically
tested twenty years ago by Mauro (1995); his findings, however, were later contested by Shaw et al. (2011). 2
Using the data-set of Mauro (1995) they showed that the ethnolinguistic fractionalization is a weak
instrument for corruption and is not sufficient to identify causal negative relationship between corruption
and investment. Instead Shaw et al. (2011) employ data on legal origins and projected trade share as
stronger instruments for corruption as had been suggested by Frankel and Romer (1999) and found no
statistically significant effect of corruption on investment.3
The pioneering work by Mauro (1995) was followed by a number of cross-country studies that find a
negative relationship between corruption and investment (Brunetti et al. 1998; Brunetti and Weder 1998;
Campos et al. 1999; Mo 2001; Habib and Zurawicki 2001; Rock and Bonnett 2004; Méon and Sekkat 2005;
Asiedu and Freeman 2009; Das and Parry 2011; Pellegrini 2011; Hodge et al. 2011) but do not manage to
establish a causal relationship for several reasons. One of the main concerns in cross-country analyses,
especially when they use cross-sectional data, is a potential unobserved heterogeneity bias. It is not
possible to control for all conceivable dimensions that may affect investment such as legal system, social
structure, traditions, culture, social norms, and institutions. The second issue is endogeneity in the form of
potential reverse causality or omitted variables that might influence both corruption and investment.
Standard approach to address endogeneity is to use instrumental variables (IV), but good instruments are
hard to find as discussed in Treisman (2007: 225-226). Finally the perception-based measures of corruption
employed by the previous studies might be biased themselves (Treisman 2007: 221). This bias can arise if
corruption perceptions are influenced mainly by the quality of institutions rather than by corruption
(Andvig 2005; Weber Abramo 2008) or by political competition and press freedom (Sharafutdinova 2010).
Unsurprisingly, studies do not find strong correlation between perception-based data and experienced
corruption (e.g. Donchev and Ujhelyi 2014, Gutmann et al. 2015).
Johnson et al. (2011) is the only study that attempts to overcome aforementioned difficulties. It
analyzes the relationship between corruption and growth for the US, and uses data on convictions of public
1 For example, Myrdal 1989; Shleifer and Vishny 1993; Blackburn et al.,2006, Aidt 2009. 2 The influence of the article by Mauro (1995) is shown by the extremely high rate of citation: according to the online
depository of economic papers (ideas.repec.org/top/top.item.nbcites.html), the paper by Mauro (1995) is among the 100 of most cited articles in economics.
3 Alternative instruments are legal origins and projected trade share as suggested by Frankel and Romer (1999).2
officials instead of perception-based indices. Johnson et al. instrument for corruption using political
variables that are expected to be uncorrelated with current economic outcomes: residency requirements
for voting, restrictions on campaign financing, and adoption of state constitution. The authors find
corruption to be negatively associated with growth and investment in the US, but their estimation strategy
raises two main concerns about causality of the effect. First, their regression analysis is based on a small
cross-section with only 50 observations, which leads to a potential unobserved heterogeneity bias. And,
second, the IV approach is impaired by the weakness of the chosen instruments as the F-statistics are
consistently below 10 in all estimations (Johnson et al. 2011: 387). It is also very possible that instruments
such as the timing for adopting state constitution or restrictions on political-campaign financing can affect
general institutional environment and, thus, can influence investment through channels other than
corruption. In that case the assumption on the exclusion restriction would be violated.
Our paper attempts to close the gap in the existing literature in several ways. First, we study
corruption within one specific country – Russia. Russia is a particular interesting case to study the costs of
corruption: it is a former superpower and currently a 13 th biggest economy in the world in terms of nominal
GDP (World Bank estimation for 2015) and suffers severely from corruption, being ranked 131 out of 176
countries by Transparency International in 2016.4 While corruption is wide-spread in Russia, its regions are
neither equally corrupt (Baranov et al. 2015), nor are they equally economically developed. They are,
however, homogeneous in terms of official language, system of law, culture, history and traditions, which
provides an ideal setting for econometric analysis. Moreover, very few empirical papers study the
consequences of corruption in Russia and none of them with a focus on investment.5
Second, we employ a new measure of corruption based on actual incidents of bribe-taking by public
officials as registered by the police authorities. Registered corruption by police is similar to the conviction-
based corruption measure traditionally used in the empirical literature on corruption in USA (e.g. Goel and
Rich 1989; Goel and Nelson 1998; Glaeser and Saks 2006; Johnson et al. 2011; Alt and Lassen 2014), but it is
more appropriate for countries with highly corrupt environments, where conviction data is likely to be
distorted by persistent corruption in the judiciary. This measure has been previously employed to study
determinants of corruption in Russian regions by Schulze et al. (2016). The data are available for the period
2004-2013 allowing the use of a panel estimation with region and time fixed effects, thereby controlling for
time-invariant unobserved heterogeneity.
Third, we propose new instruments to control for the endogeneity of corruption. Previous studies
4 Transparency International grades countires on the scale of 0 (most corrupt) to 100 (not corrupt); Russia’s score is 29 (https://www.transparency.org/news/feature/corruption_perceptions_index_2016, accessed on 01.02.2017). Data on GDP estimation by World Bank is available at World Bank, World Indicators, http://databank.worldbank.org/data/download/GDP.pdf (accessed on 01.02.2017).
5 We find only three cited articles in the field: Safavian et al. (2001) use the data from a survey of micro-enterprises in one of Russian regions to show that corruption is similar to regressive tax and might discourage innovation and growth; Weill (2011) find evidence that higher corruption is associated with less bank-lending to private sector and individuals; finally, a more recent paper by Kuzmina et al. (2014) find that better governance quality attracts foreign direct investment in 40 Russian regions where their data on corruption was available.
3

have shown that a free press effectively reduced corruption, both across countries (Brunetti and Weder
2003) and across Russian regions (Schulze et al. 2016). According to Brunetti and Weder (2003), if a corrupt
public official attempts to extort a bribe from a businessperson, the businessperson has just three options:
to pay the bribe, to complain to a higher official or the law-authorities, or to reveal the bureaucrat's
behavior to the local press. We argue that in an environment with higher officials or law-authorities that are
corrupt themselves or unresponsive to complains, the ability of journalists to report corrupt behavior
becomes the primary safeguard against opportunism of public officials. We identify two dimensions of the
press freedom that determine the accountability effect of the press: the presence of a free press in the
region and whether this free press is obstructed by the existing abuse of journalists' professional rights in a
form of censorship or physical violence. Both instruments are good predictors of corruption levels at the
regional level, but are unrelated to characteristics of local press such as its scope or average salary of
journalists. Interestingly, press freedom has not been used to instrument for corruption previously.
Our results show that corruption decreases overall investment in Russian regions. The effect is
significant for companies with private ownership but statistically insignificant for fully state-owned
companies. Investment by foreign-owned companies is more sensitive to corruption as predicted by the
literature (Habib and Zurawicki 2001). Our results are robust to the inclusion of various social-economic
controls and the use of instrumental variables.
The paper is organized as follows. Section 2 explains our methodology and data. Section 3 presents
the results of the ordinary least squares (OLS) estimation with fixed effects and the IV estimation. Section 4
provides robustness checks and section 5 concludes.
2. Data and estimation strategy
We study investment and corruption in Russian regions for the period 2004 to 2013. The time frame
is determined by the availability of data on regional corruption, since no data records are accessible for the
time before 2004, and by the political events following the annexation of Crimea by Russia in early 2014,
which might have introduced distortions in the investment behavior as a result of Western sanctions,
Russian counter-sanctions, and external political pressure (Doronina 2014).
The beginning of the period coincides with the end of the democratic transition, when Russia
became a normal middle-income country with a market economy and a semi-democratic political regime
(Schleifer and Treisman 2005). The whole period is characterized by a stable political situation as the actual
power in the country was consolidated in hands of the second Russian president, Vladimir Putin, and his
friends.6 Russia has suffered from widespread corruption: Transparency International (TI) has given Russia
6 Even when Putin had to step down from the presidency in 2008 as Russian constitution does not allow three consecutive terms, he became a prime minister and had his former colleague and good friend Dmitry Medvedev occupy the president's position for one term, allowing Putin to come back after elections in 2012.
4

consistently a score below 30 points out of 100 on their corruption perception index. 7 Meanwhile the
government has made no real effort to fight corruption during those years; even the introduction of the
National Anti-Сorruption plan in 2009 by the then president, Dmitry Medvedev, did not make any
difference, as was later acknowledged by Medvedev himself in 2011.8 The growing corruption did not
mobilize the population either.
For our analysis, we collected the data for 79 Russian regions, which account for 99% of total
population.9 All regions have the same official language, taxation and law systems, and are similar in terms
of traditions and culture, but strongly differ in the scope of investment: during the period examined, the
region with highest investment (Tyumen Oblast) had on average almost 18 times as much investment per
capita as the region with lowest investment (Republic of Ingushetia). The growth in investment over time is
also very heterogeneous: while overall national investment per capita has doubled between 2004 and
2013, a region Tuva Republic has demonstrated a growth rate of over 670%, and the biggest decline over
these 10 years was 32% in Vologda Oblast.
To analyze the effect of corruption on investment, we employ following estimation model:
Investment it=α +β Corruptionit+Χ itη+ς i+τ t+ε it , (1)
where i=1,. .. ,79 and t=2005,. .. , 2013 index regions and years respectively, Investment it is a
logarithm of total annual per capita investment in the region in constant rubles, Corruptionit is a logarithm
of registered cases of bribe-taking per 100,000 population plus one, lagged for one year ; Χ it is a vector of
control variables; ς i and τ t are region and year fixed effects; and ε it is an error term. We use fixed effects
regression to control for time-invariant factors specific for each region (e.g. climate, geography, and political
factors) and include time dummies to capture common time trend. Standard errors are clustered at the
regional level to account for serial auto-correlation.
The data on fixed capital investment come from Federal State Statistics Service (FSSS). The annual
data include officially documented capital expenditures aggregated on a regional level and adjusted for the
“unobserved” economy.10 The data allow us to differentiate between investment made by organizations
completely owned by state (INV_pub), investment made by private or partially private companies
7 Higher score for perceived corruption implies less corruption.8 The full interview from 26.01.2011, where Dmitry Medvedev discusses the consequences of the anti-corruption
campaign, is available at Vedomosti website at http://www.vedomosti.ru/newspaper/articles/2011/01/26/politicheskaya_konkurenciya_neobhodima_dmitrij_medvedev (in Russian, accessed on 02.02.2017).
9 In 2004 Russia consisted of 89 regions, but six small autonomous regions were officially merged with the neighboring larger regions in later years. The remaining three small autonomous regions are normally aggregated with their bigger neighbours for statistical purposes by the Russian Federal Statistic Service and we employ only the aggregate data on the extended regions. We exclude the region of Chechen Republic due to ongoing military conflict and a concern of data reliability (see Fuller 2013).
10 “Unobserved” economy includes shadow economy, illegal activities, and individual and household investment that are not reported to statistics authorities. The full official methodology is explained in the Decree by FSSS from 18 September 2014 №569 „On the approval of official statistical methodology to determine fixed capital investment at the regional level”, available online at http://www.consultant.ru/document/cons_doc_LAW_169551/ (accessed on 02.02.2017)
5

(INV_priv), and investment made by companies with full or partial (above 10%) foreign ownership (INV_for).
Investment is divided by population to account for the size of the region. 11 We use imports of capital goods
(IMPORT) as an additional dependent variable since this category can be related to investment activities in
the same year. We assume that if corruption has a real effect on investment, import of capital goods will
also be affected. There are several limitations regarding the data on imports of capital goods: first, it does
not cover illegal imports, and, second, it does not guarantee that capital goods are installed within the
region that officially imported them, - nevertheless we test this variable as a robustness check for our main
hypothesis. The data on import of capital goods also come from FSSS.
Our measure of corruption (CORR) is the logarithm of a number of cases of bribe-taking by public
officials as registered by the police annually plus one. The definition of bribery according to the Russian
Criminal code (Article 290) is “the acceptance of money, securities, or other valuables by a public official
(personally or through an intermediary) for his/her performance (action or inaction) for the benefit of a
giver or an affiliated person, if such action implies that the public official exploits his/her position or
authority or installs patronage”. This definition is in line with the common understanding of corruption as “a
misuse of public office for private gain” (World Bank, 1997). Bribery itself does not exclude political
corruption from our data, however we expect the majority of cases to refer to bureaucratic type of
corruption which is more relevant for the decision to invest. Corruption variable is lagged one year to allow
some time for its effect on investment to materialize.
Registered corruption is very similar to the conviction rate of corrupt officials often used by studies
on corruption in the US (e.g. Johnson et al. 2011), however, it has several advantages as discussed in Schulze
et al. (2016: 141-142). First, registration of crime as a first stage of criminal prosecution is not affected by
any corruption that might occur during the investigation and legal process preceding conviction. Corruption
could still affect the registration itself but to a lesser extent than conviction, and Schultze et al. (2016) argue
that it would be relatively easier for the police to obstruct an on-going investigation than to refuse to
register a crime, especially since this practice can be seriously punished if a person reporting corruption
filed a complaint to a higher official. Second, the time of the registration is closer to the time of the actual
corruption incident as any crime has to be registered within three days after its detection according to the
law. Conviction, on the other hand, takes place after a longer period of investigation and legal proceedings
and therefore enters the statistical records only after some time. Third, registered corruption reflects the
number of actual incidents of bribe taking and not the number of people found guilty (as done in the case
of convictions), and therefore reports the volume of the crime and not the criminals. That makes our
measure a better proxy for the scope of regional corruption.
11 While most of the studies on corruption and investment use a ratio of investment to GDP, Lambsdorff (2005: 44) warns that GDP itself might be negatively influenced by corruption and therefore the Investment/GDP ratio underestimates the effect of corruption on investment.
6

Our econometric model includes control variables commonly used in the literature (Mauro 1995;
Brunetti et al. 1998; Campos et al. 1999; Mo 2001; Meon and Sekkat 2005; Das and Parry 2011; Johnson et
al. 2011): the logarithm of per capita income in the previous year (INC) is used as a measure for economic
development, share of population with professional education in the previous year (EDU) as a proxy for
human capital, and a logarithm of total population (POP) controls for the size of the region. We also include
the regional consumer price index from the previous year (CPI) as a proxy for inflation, which is expected to
be negatively associated with investment (Asiedu and Freeman 2009; Das and Parry 2011). Moreover, we
control for oil and natural gas production (OIL) since several Russian regions benefit directly from extracting
natural resources. The size of bureaucracy (GOV) is included since a bigger number of public officials in the
executive branch of power might create bureaucratic competition and eventually improve conditions (e.g.
reducing red tape) for investors as suggested by Drugov (2010). Finally, in order to show that investment is
affected by corruption itself and that CORR does not just proxy the general level of crime, we introduce a
crime rate of major and gravest crimes per population (CRIME) as an additional control. Crime data are
produced by regional law-authorities and might capture the effort of the police to register more criminal
offenses, which is a potential source of noise in our dependent variable. Table 1 provides a short description
of data and summary statistics.
7
Table 1: Summary of main variablesVariable name Description Mean St. Dev.
CORR 1.58 0.51
INV_total 10.10 0.66
INV_priv 9.79 0.76
INV_pub 8.63 0.64
INV_for 7.54 1.55
IMPORT 7.78 1.42
CRIME 6.25 0.43
INC 8.76 0.41
OIL 12.64 59.90
CPI Consumer price index from the previous year 110.03 2.93GOV 112.55 50.56
EDU 68.89 7.19
POP Average annual population in thousands, logarithm 7.13 0.90
Number of registered incidents of bribe-taking by public officials per 100 000 population, logarithm lagged for one yearAggregate annual capital investment in the region, logarithm of thousand constant roubles per capitaCapital investment made by companies and entities with private ownership in constant roubles per capita, logarithm of thousand constant roubles per capitaCapital investment made by government-owned companies and public sector, logarithm of thousand constant roubles per capitaCapital investment made by companies with foreign ownership (10% or more of capital belongs to foreign residents), logarithm of thousand constant roubles per capitaImport of machinery, equipment and electronic, logarithm of thousand constant roubles per capitaNumber of registered major and most serious criminal offenses (crimes penalized with imprisonment of 5 years or more) 100 000 population, logarithm lagged for one year Regional average monthly income per capita in constant roubles, logarithm lagged for one yearOil and gas production in the region in constant thousand roubles per capita, lagged for one year
Number of governmental officials in executive branch of power per 10 000 of population by the end of the past yearShare of population with professional education in the previous year
3. Results
3.1 Fixed effects estimation
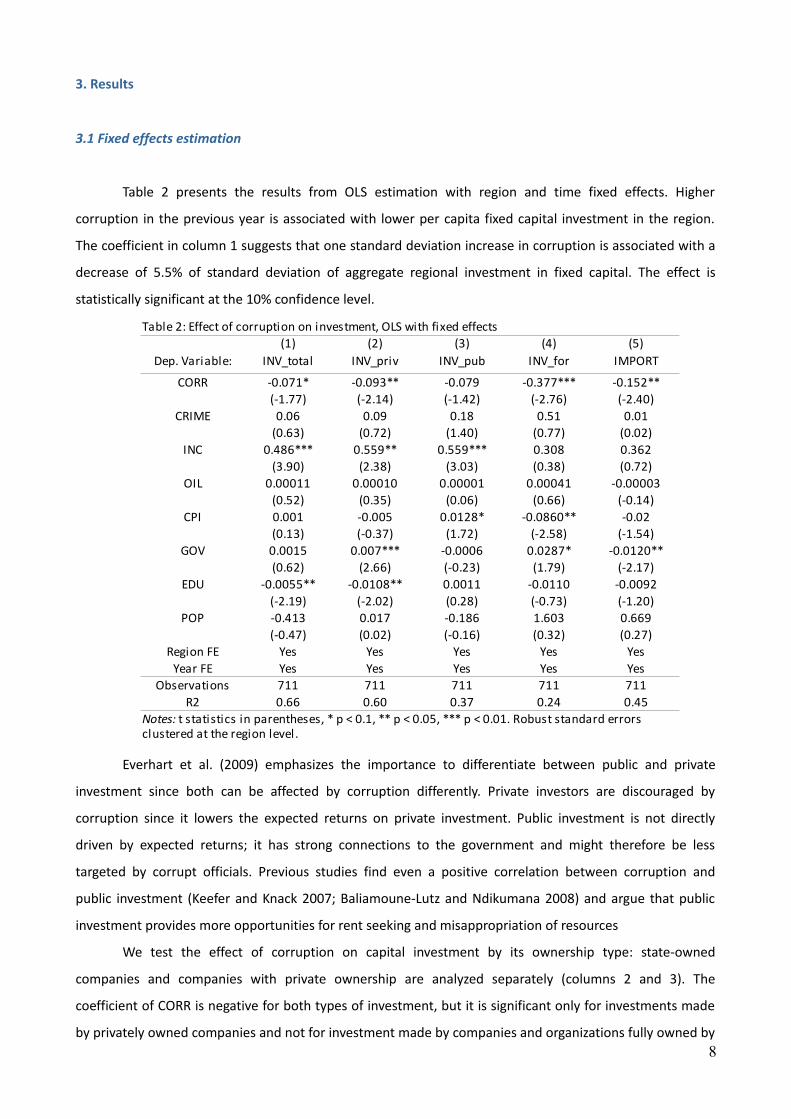
Table 2 presents the results from OLS estimation with region and time fixed effects. Higher
corruption in the previous year is associated with lower per capita fixed capital investment in the region.
The coefficient in column 1 suggests that one standard deviation increase in corruption is associated with a
decrease of 5.5% of standard deviation of aggregate regional investment in fixed capital. The effect is
statistically significant at the 10% confidence level.
Everhart et al. (2009) emphasizes the importance to differentiate between public and private
investment since both can be affected by corruption differently. Private investors are discouraged by
corruption since it lowers the expected returns on private investment. Public investment is not directly
driven by expected returns; it has strong connections to the government and might therefore be less
targeted by corrupt officials. Previous studies find even a positive correlation between corruption and
public investment (Keefer and Knack 2007; Baliamoune-Lutz and Ndikumana 2008) and argue that public
investment provides more opportunities for rent seeking and misappropriation of resources
We test the effect of corruption on capital investment by its ownership type: state-owned
companies and companies with private ownership are analyzed separately (columns 2 and 3). The
coefficient of CORR is negative for both types of investment, but it is significant only for investments made
by privately owned companies and not for investment made by companies and organizations fully owned by 8
Table 2: Effect of corruption on investment, OLS with fixed effects(1) (2) (3) (4) (5)
Dep. Variable: INV_total INV_priv INV_pub INV_for IMPORT
CORR -0.071* -0.093** -0.079 -0.377*** -0.152**(-1.77) (-2.14) (-1.42) (-2.76) (-2.40)
CRIME 0.06 0.09 0.18 0.51 0.01(0.63) (0.72) (1.40) (0.77) (0.02)
INC 0.486*** 0.559** 0.559*** 0.308 0.362(3.90) (2.38) (3.03) (0.38) (0.72)
OIL 0.00011 0.00010 0.00001 0.00041 -0.00003(0.52) (0.35) (0.06) (0.66) (-0.14)
CPI 0.001 -0.005 0.0128* -0.0860** -0.02(0.13) (-0.37) (1.72) (-2.58) (-1.54)
GOV 0.0015 0.007*** -0.0006 0.0287* -0.0120**(0.62) (2.66) (-0.23) (1.79) (-2.17)
EDU -0.0055** -0.0108** 0.0011 -0.0110 -0.0092(-2.19) (-2.02) (0.28) (-0.73) (-1.20)
POP -0.413 0.017 -0.186 1.603 0.669(-0.47) (0.02) (-0.16) (0.32) (0.27)
Region FE Yes Yes Yes Yes YesYear FE Yes Yes Yes Yes Yes
Observations 711 711 711 711 711R2 0.66 0.60 0.37 0.24 0.45
Notes: t statistics in parentheses, * p < 0.1, ** p < 0.05, *** p < 0.01. Robust standard errors clustered at the region level.

the state. The effect on INV_priv is bigger than for the overall investment: an increase in one standard
deviation of corruption measure is associated with 6.2% of standard deviation decrease in private
investment.
Investment in fixed capital made by companies with full or partial foreign ownership is negatively
associated with corruption (column 4): an increase of one standard deviation in corruption is associated
with a 12.4% of standard deviation decrease in this type of investment. The effect is much stronger for this
type of investment as compared to aggregate investment and is statistically significant at the 1% level. This
finding is similar to Habib and Zurawicki (2001), who find foreign direct investment to be more sensitive to
corruption compared to domestic direct investment.
Column (5) finally reports the significant negative effect of corruption on imports of capital goods: a
decrease in corruption of one standard deviation translates into 5.5% of standard deviation decrease in
import of capital goods. The size of the effect is proportional to what we find for the aggregate investment
in fixed capital. Since import of capital goods is closely related to investment activities in the region, the
findings support our main hypothesis. Interestingly, the previous literature has never investigated the
relationship between import of capital goods and corruption, even though the import of capital goods was
as a determinant of a long-run economic growth for a long time (e.g. Lee 1995).
Table 2 shows that the effect of corruption is independent from the average level of crime in the
region as coefficients of CRIME are positive but close to zero and statistically insignificant in all
specifications. Alternative measures for criminal environment such as number of registered murders, thefts,
robberies, or drug-dealing are likewise insignificant and do not affect our main results for corruption.12
Other significant determinants of investment are per capita income, education, size of bureaucracy,
and consumer prices. Previous income per capita is positively associated with all types of investment and
highly significant for INV_total, INV_priv and INV_pub (columns 1-3). The result for our measure of
education being negatively associated with investment is surprising and contradicts the cross-country
evidence (e.g. Campos et al. 1999; Meon and Sekkat 2005), but it is in line with Johnson et al. (2011), who
find the same negative relationship for US American states. Our education measure may simply proxy shifts
in the structure of the regional economy when, for example, the development of the service sector
demands more skilled labor but at the same time requires much less physical investment than extracting or
manufacturing sectors. Growth in consumer prices has a negative and significant relationship to the
investment made by companies with foreign ownership as they are more sensitive to the value and the
stability of the Russian currency. The size of the bureaucracy is positively correlated with private and foreign
investment and we assume that it may be a result of the competition across public servants or reduction of
the red-tape due to the availability of more labor in public service. Production of oil and gas is not
associated with investment activities.
The basic OLS estimation demonstrates a strong negative relationship between corruption and
12 Results are available upon request.9

investment but does not assert its causation because of potential endogeneity of corruption. The
endogeneity can arise from several sources, such as omitted variable bias or reverse causation, which are
both likely for the case of corruption and investment as corruption does not occur exogenously and as both
corruption and investment can be driven by some omitted factor, such as political cycles. Another problem
would be a measurement bias since our corruption measure is not perfect. We address the issue of
endogeneity by using instrumental variables, which are not correlated with investment but can be used to
predict corruption. The following section discusses the instruments and presents estimation results.
3.2 Instrumental variables estimations
It is a challenge to find valid instruments for corruption that would not correlate with error term as
discussed in Shaw et al. (2009) and Treisman (2007). While the literature on determinants of corruption has
grown rapidly in recent years, commonly accepted instruments have not been established so far. Some
previous cross-country studies employ instruments that are time-invariant characteristics and often derived
from a distant past, such as colonial history and ethno-linguistic fractionalization (Mauro 1995) or length of
exposure to democracy (Gupta et al. 2002). This solution is not optimal for our analysis since, on the one
hand, it leaves out the time variation in our panel data set, and, on the other hand, historical data might
also influence the current economic conditions through different channels and not exclusively through
corruption as discussed in Aidt (2009). While many panel studies on the consequences of corruption
employ lagged explanatory variables as instruments (e.g. Gupta 2001; Del Monte and Papagni 2001; Das
and Parry 2011), we are reluctant to use this strategy because it fails to eliminate the endogeneity problem
for reasons summarized in Reed (2015) and Bellemare et al. (2015).13 Instead we turn to a contemporary
determinant of corruption that has been widely supported empirically.
Our suggested instrument for corruption is freedom of the local press. Previous literature has found
persistent evidence that a free and independent press reduces corruption across countries (e.g. Brunetti
and Weder 2003; Chowdhury 2004; Freille et al. 2007), and a recent study by Schulze et al. (2016) has
produced similar findings for Russian regions. Following Schulze et al. (2016), we adopt the same data-set
on freedom of press across Russian regions to construct our instrument. The data were provided by a non-
governmental organization of journalists, Glasnost Defense Foundation (GDF), which conducted three
surveys across 78 Russian regions in 2006, 2008, and 2010.14
The GDF ranking is similar to the Freedom House index of freedom of press used by cross-country
studies as it is based on the opinions of local journalists and experts of mass media, but it is relatively more
simple and straightforward. While the Freedom House index is assembled by weighting various aspects of
13 They find that the lagging deppendent variables shifts the channel of the endogeneity bias and imposes an untestable assumption of „no dynamics among unobservables“
14 Surveys did not cover most autonomous sub-regions. Because our data-set does not include them separately, we use the aggregated regions and their values for freedom of press. The only region excluded from our initial sample is Chukotka Autonomous Okrug.
10
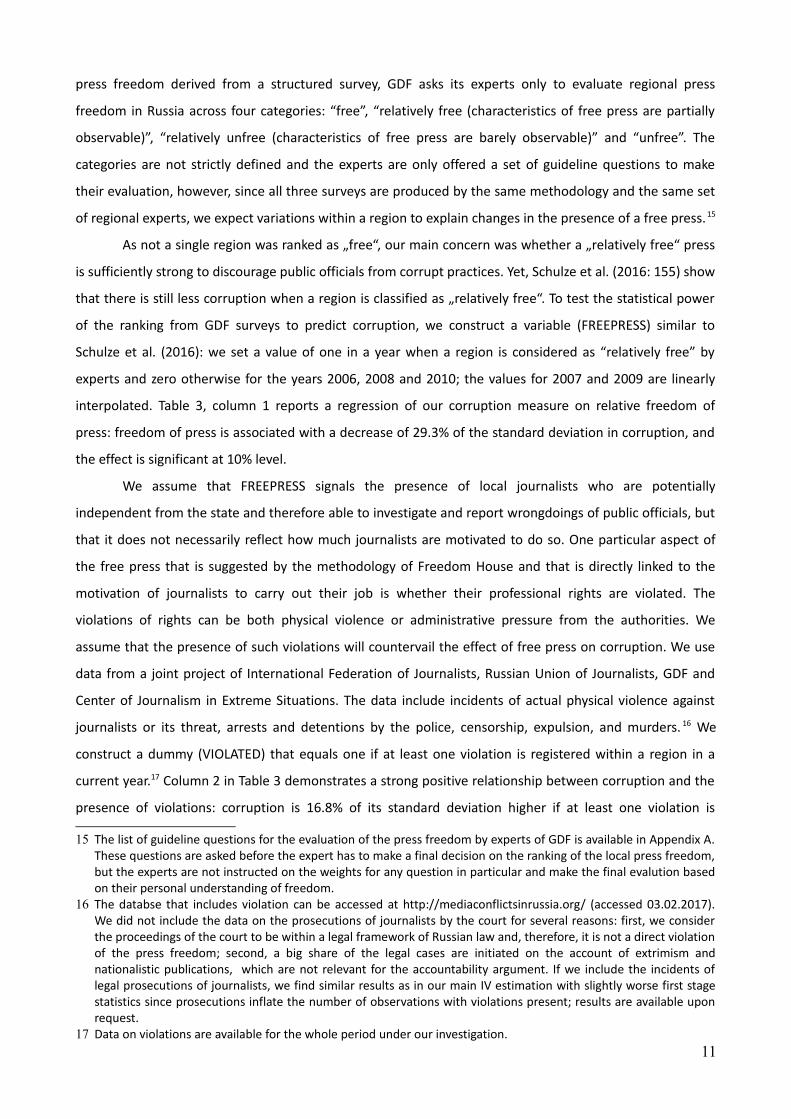
press freedom derived from a structured survey, GDF asks its experts only to evaluate regional press
freedom in Russia across four categories: “free”, “relatively free (characteristics of free press are partially
observable)”, “relatively unfree (characteristics of free press are barely observable)” and “unfree”. The
categories are not strictly defined and the experts are only offered a set of guideline questions to make
their evaluation, however, since all three surveys are produced by the same methodology and the same set
of regional experts, we expect variations within a region to explain changes in the presence of a free press.15
As not a single region was ranked as „free“, our main concern was whether a „relatively free“ press
is sufficiently strong to discourage public officials from corrupt practices. Yet, Schulze et al. (2016: 155) show
that there is still less corruption when a region is classified as „relatively free“. To test the statistical power
of the ranking from GDF surveys to predict corruption, we construct a variable (FREEPRESS) similar to
Schulze et al. (2016): we set a value of one in a year when a region is considered as “relatively free” by
experts and zero otherwise for the years 2006, 2008 and 2010; the values for 2007 and 2009 are linearly
interpolated. Table 3, column 1 reports a regression of our corruption measure on relative freedom of
press: freedom of press is associated with a decrease of 29.3% of the standard deviation in corruption, and
the effect is significant at 10% level.
We assume that FREEPRESS signals the presence of local journalists who are potentially
independent from the state and therefore able to investigate and report wrongdoings of public officials, but
that it does not necessarily reflect how much journalists are motivated to do so. One particular aspect of
the free press that is suggested by the methodology of Freedom House and that is directly linked to the
motivation of journalists to carry out their job is whether their professional rights are violated. The
violations of rights can be both physical violence or administrative pressure from the authorities. We
assume that the presence of such violations will countervail the effect of free press on corruption. We use
data from a joint project of International Federation of Journalists, Russian Union of Journalists, GDF and
Center of Journalism in Extreme Situations. The data include incidents of actual physical violence against
journalists or its threat, arrests and detentions by the police, censorship, expulsion, and murders. 16 We
construct a dummy (VIOLATED) that equals one if at least one violation is registered within a region in a
current year.17 Column 2 in Table 3 demonstrates a strong positive relationship between corruption and the
presence of violations: corruption is 16.8% of its standard deviation higher if at least one violation is
15 The list of guideline questions for the evaluation of the press freedom by experts of GDF is available in Appendix A. These questions are asked before the expert has to make a final decision on the ranking of the local press freedom, but the experts are not instructed on the weights for any question in particular and make the final evalution based on their personal understanding of freedom.
16 The databse that includes violation can be accessed at http://mediaconflictsinrussia.org/ (accessed 03.02.2017). We did not include the data on the prosecutions of journalists by the court for several reasons: first, we consider the proceedings of the court to be within a legal framework of Russian law and, therefore, it is not a direct violation of the press freedom; second, a big share of the legal cases are initiated on the account of extrimism and nationalistic publications, which are not relevant for the accountability argument. If we include the incidents of legal prosecutions of journalists, we find similar results as in our main IV estimation with slightly worse first stage statistics since prosecutions inflate the number of observations with violations present; results are available upon request.
17 Data on violations are available for the whole period under our investigation.11
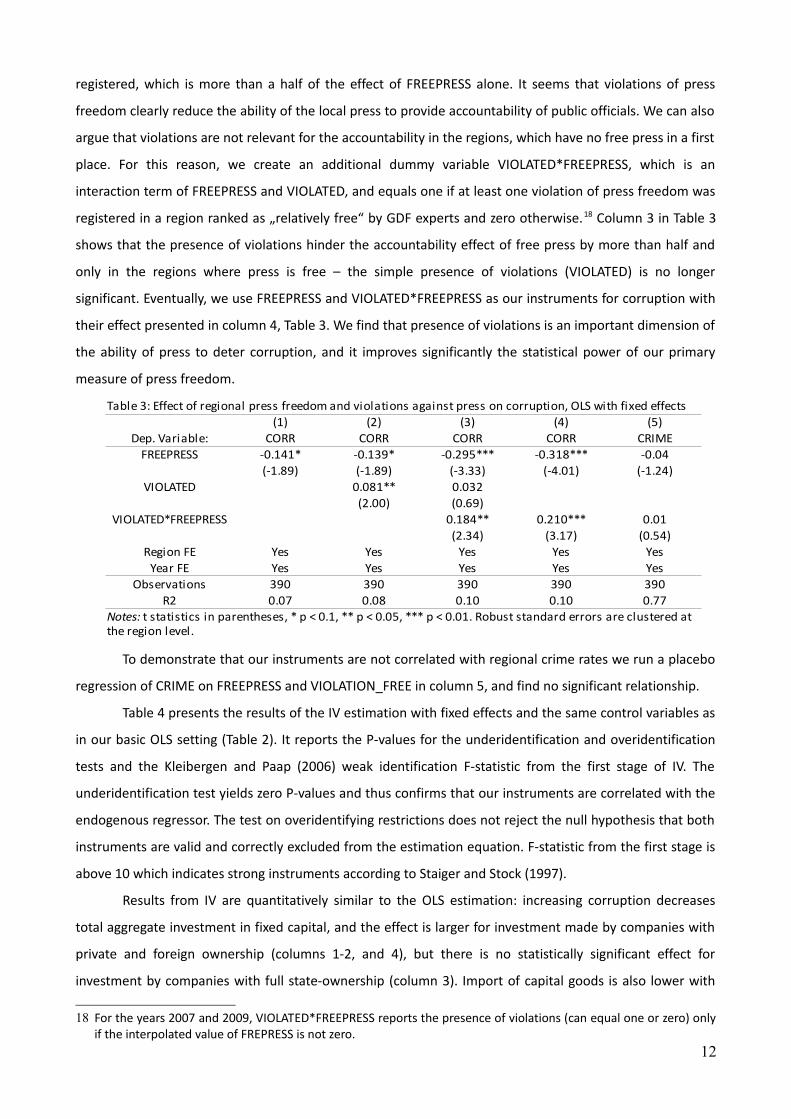
registered, which is more than a half of the effect of FREEPRESS alone. It seems that violations of press
freedom clearly reduce the ability of the local press to provide accountability of public officials. We can also
argue that violations are not relevant for the accountability in the regions, which have no free press in a first
place. For this reason, we create an additional dummy variable VIOLATED*FREEPRESS, which is an
interaction term of FREEPRESS and VIOLATED, and equals one if at least one violation of press freedom was
registered in a region ranked as „relatively free“ by GDF experts and zero otherwise.18 Column 3 in Table 3
shows that the presence of violations hinder the accountability effect of free press by more than half and
only in the regions where press is free – the simple presence of violations (VIOLATED) is no longer
significant. Eventually, we use FREEPRESS and VIOLATED*FREEPRESS as our instruments for corruption with
their effect presented in column 4, Table 3. We find that presence of violations is an important dimension of
the ability of press to deter corruption, and it improves significantly the statistical power of our primary
measure of press freedom.
To demonstrate that our instruments are not correlated with regional crime rates we run a placebo
regression of CRIME on FREEPRESS and VIOLATION_FREE in column 5, and find no significant relationship.
Table 4 presents the results of the IV estimation with fixed effects and the same control variables as
in our basic OLS setting (Table 2). It reports the P-values for the underidentification and overidentification
tests and the Kleibergen and Paap (2006) weak identification F-statistic from the first stage of IV. The
underidentification test yields zero P-values and thus confirms that our instruments are correlated with the
endogenous regressor. The test on overidentifying restrictions does not reject the null hypothesis that both
instruments are valid and correctly excluded from the estimation equation. F-statistic from the first stage is
above 10 which indicates strong instruments according to Staiger and Stock (1997).
Results from IV are quantitatively similar to the OLS estimation: increasing corruption decreases
total aggregate investment in fixed capital, and the effect is larger for investment made by companies with
private and foreign ownership (columns 1-2, and 4), but there is no statistically significant effect for
investment by companies with full state-ownership (column 3). Import of capital goods is also lower with
18 For the years 2007 and 2009, VIOLATED*FREEPRESS reports the presence of violations (can equal one or zero) only if the interpolated value of FREPRESS is not zero.
12
Table 3: Effect of regional press freedom and violations against press on corruption, OLS with fixed effects(1) (2) (3) (4) (5)
Dep. Variable: CORR CORR CORR CORR CRIMEFREEPRESS -0.141* -0.139* -0.295*** -0.318*** -0.04
(-1.89) (-1.89) (-3.33) (-4.01) (-1.24)VIOLATED 0.081** 0.032
(2.00) (0.69)VIOLATED*FREEPRESS 0.184** 0.210*** 0.01
(2.34) (3.17) (0.54)Region FE Yes Yes Yes Yes Yes
Year FE Yes Yes Yes Yes YesObservations 390 390 390 390 390
R2 0.07 0.08 0.10 0.10 0.77Notes: t statistics in parentheses, * p < 0.1, ** p < 0.05, *** p < 0.01. Robust standard errors are clustered at the region level.

respect to corruption levels. However, estimated coefficients are much larger than in basic OLS: now, one
standard deviation increase in corruption reduces total investment by 44.4% of its standard deviation,
private investment by 46.2%, investment of companies with foreign ownership by 69.4% and imports of
capital goods by 41.8%.19 Additionally, we show that CRIME as a proxy for the crime in the region is not
significant determinant of investment.
The findings suggest that corruption has a very strong influence on the level of investment in fixed
capital in Russia. The magnitude is striking: if, in 2012, Russia had had a corruption level as low as in 2004,
the national economy would have received additional 16% more investment in fixed capital in 2013. The
missing investment amounts to 2.1 trillion rubles (66 billion dollars) in nominal values for 2013 or in about
4% of gross domestic product of the same year.20
The IV estimation infers causal relationship between corruption and investment only if the
instruments satisfy the assumption of exogeneity. We assume the heterogeneity of press freedom and
violations against journalists to be mostly accidental and not driven by social or economic conditions for
several reasons. First, several sources suggest that the regional press was overlooked by federal authorities
who were continuously strengthening control over national mass media (Becker 2004). For this reason, the
press developed regionally (Eismont 2007; Gehlbach 2010; Lipman 2010) and was mainly managed by local
activists and enthusiasts (Lipman 2010: 158). Second, since the literature on the determinants of press
freedom is scarce, we provide some empirical evidence to show that our measures of free press are not
determined by any economic factors. We regress FREEPRESS and VIOLATED*FREEPRESS on regional
unemployment (UNEMP), regional income (INC), education (EDU), average salary in regional tele- and radio-
broadcasting (PRESS_salary) and number of employees in the sector of tele- and radio-broadcasting
19 The magnitudes are estimated using the standard deviations calculated for the IV sample: years 2007-2011 and 78 regions.
20 Numbers for overall investment in fixed capital and GDP are taken for calculation for the year 2013.13
Table 4: Effect of corruption on investment, IV estimation with fixed effects(1) (2) (3) (4) (5)
Dep. Variable: INV_total INV_priv INV_pub INV_for IMPORTCORR -0.546** -0.652** -0.306 -1.895** -1.190*
(-2.36) (-2.13) (-0.71) (-2.30) (-1.77)CRIME 0.191 0.079 0.172 0.372 0.891
(0.97) (0.28) (0.50) (0.45) (1.51)Controls Yes Yes Yes Yes YesRegion FE Yes Yes Yes Yes Yes
Year FE Yes Yes Yes Yes YesObservations 390 390 390 390 390
0.00 0.00 0.00 0.00 0.00
0.26 0.27 0.83 0.59 0.20
11.28 11.28 11.28 11.28 11.28
Underidentification test (p-value)
Overidentification test (p-value) Hansen J-stat
Kleibergen-Paap rk Wald F-Stat
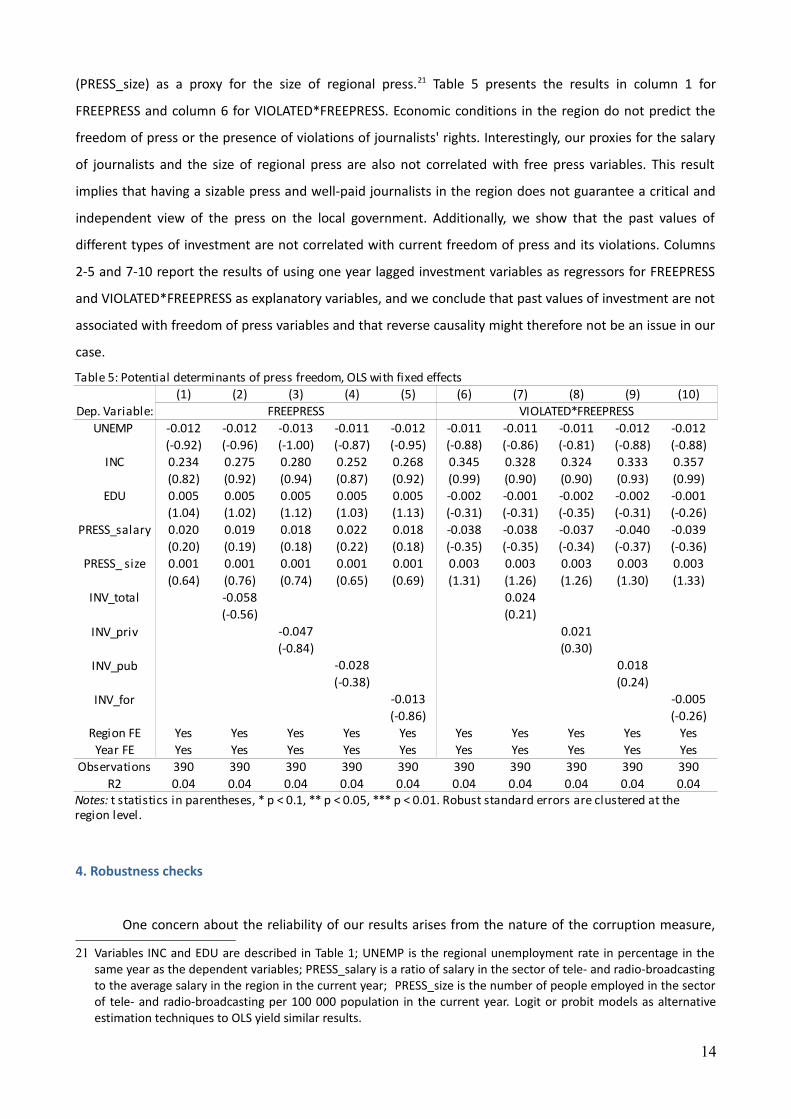
(PRESS_size) as a proxy for the size of regional press.21 Table 5 presents the results in column 1 for
FREEPRESS and column 6 for VIOLATED*FREEPRESS. Economic conditions in the region do not predict the
freedom of press or the presence of violations of journalists' rights. Interestingly, our proxies for the salary
of journalists and the size of regional press are also not correlated with free press variables. This result
implies that having a sizable press and well-paid journalists in the region does not guarantee a critical and
independent view of the press on the local government. Additionally, we show that the past values of
different types of investment are not correlated with current freedom of press and its violations. Columns
2-5 and 7-10 report the results of using one year lagged investment variables as regressors for FREEPRESS
and VIOLATED*FREEPRESS as explanatory variables, and we conclude that past values of investment are not
associated with freedom of press variables and that reverse causality might therefore not be an issue in our
case.
4. Robustness checks
One concern about the reliability of our results arises from the nature of the corruption measure,
21 Variables INC and EDU are described in Table 1; UNEMP is the regional unemployment rate in percentage in the same year as the dependent variables; PRESS_salary is a ratio of salary in the sector of tele- and radio-broadcasting to the average salary in the region in the current year; PRESS_size is the number of people employed in the sector of tele- and radio-broadcasting per 100 000 population in the current year. Logit or probit models as alternative estimation techniques to OLS yield similar results.
14
Table 5: Potential determinants of press freedom, OLS with fixed effects(1) (2) (3) (4) (5) (6) (7) (8) (9) (10)
Dep. Variable: FREEPRESS VIOLATED*FREEPRESSUNEMP -0.012 -0.012 -0.013 -0.011 -0.012 -0.011 -0.011 -0.011 -0.012 -0.012
(-0.92) (-0.96) (-1.00) (-0.87) (-0.95) (-0.88) (-0.86) (-0.81) (-0.88) (-0.88)INC 0.234 0.275 0.280 0.252 0.268 0.345 0.328 0.324 0.333 0.357
(0.82) (0.92) (0.94) (0.87) (0.92) (0.99) (0.90) (0.90) (0.93) (0.99)EDU 0.005 0.005 0.005 0.005 0.005 -0.002 -0.001 -0.002 -0.002 -0.001
(1.04) (1.02) (1.12) (1.03) (1.13) (-0.31) (-0.31) (-0.35) (-0.31) (-0.26)PRESS_salary 0.020 0.019 0.018 0.022 0.018 -0.038 -0.038 -0.037 -0.040 -0.039
(0.20) (0.19) (0.18) (0.22) (0.18) (-0.35) (-0.35) (-0.34) (-0.37) (-0.36)PRESS_ size 0.001 0.001 0.001 0.001 0.001 0.003 0.003 0.003 0.003 0.003
(0.64) (0.76) (0.74) (0.65) (0.69) (1.31) (1.26) (1.26) (1.30) (1.33)INV_total -0.058 0.024
(-0.56) (0.21)INV_priv -0.047 0.021
(-0.84) (0.30)INV_pub -0.028 0.018
(-0.38) (0.24)INV_for -0.013 -0.005
(-0.86) (-0.26)Region FE Yes Yes Yes Yes Yes Yes Yes Yes Yes Yes
Year FE Yes Yes Yes Yes Yes Yes Yes Yes Yes YesObservations 390 390 390 390 390 390 390 390 390 390
R2 0.04 0.04 0.04 0.04 0.04 0.04 0.04 0.04 0.04 0.04Notes: t statistics in parentheses, * p < 0.1, ** p < 0.05, *** p < 0.01. Robust standard errors are clustered at the region level.

which was generated by police authorities and could be associated not only with corruption but also with
regional characteristics of law-enforcement. Schulze et al. (2016) demonstrate a strong correlation between
the number of registered cases of bribe taking and the resolution rate for major and most serious criminal
offenses (crimes penalized with imprisonment of 5 years or more) as reported by the police. We include
resolution rate (RESOLUTION) in the IV estimation in Table 6. Our main results remain unaffected by the
proxy for police efficiency; RESOLUTION is no significant predictor for any investment variables, except for
the import of capital goods, which is positively correlated with the resolution rate of crimes .
5. Conclusion
The main finding of our paper is a strong causal effect of corruption on regional investment in fixed
capital. The effect is robust to controlling for social-economic conditions and endogeneity of corruption by
using freedom of press and violations of journalists' right as instrumental variables.
Our research is novel in several aspects. First, we employ a new data set on registered cases of bribe
taking by public officials in order to create a better proxy for corruption as compared to conventional
perception-based data. The data allow to run a panel regression model controlling for various factors and
region-specific and time fixed effects. Second, we introduce new instruments for corruption that have not
been used in the literature on corruption before. Freedom of press, as we show in our case, has an effect on
investment by reducing corruption through improving the accountability of public officials and does not
correlate with regional economic conditions, salary of journalists, or the extent of the local press. Third, we
are able to differentiate between different ownership-types of investment. While previous studies show the
effect of corruption mostly on the aggregate investment, our findings suggest that corruption mainly affects
investment made by privately owned companies and not investment made by companies with full state-
15
(1) (2) (3) (4) (5)Dep. Variable: INV_total INV_priv INV_pub INV_for IMPORT
CORR -0.538** -0.643** -0.300 -1.920** -1.231*(-2.33) (-2.07) (-0.70) (-2.25) (-1.88)
RESOLUTION -0.002 -0.003 -0.003 0.019 0.0184***(-0.71) (-0.79) (-0.65) (1.47) (3.08)
Controls Yes Yes Yes Yes YesRegion FE Yes Yes Yes Yes Yes
Year FE Yes Yes Yes Yes YesObservations 390 390 390 390 390
10.986 10.986 10.986 10.986 10.986
0.002 0.002 0.002 0.002 0.002
0.262 0.280 0.835 0.542 0.193
Table 6: Robustness check for the resolution rate of major criminal offenses, IV estimation with fixed effects
Kleibergen-Paap rk Wald F-Stat
Underidentification test (p-value)
Overidentification test (p-value) Hansen J-stat
Notes: t statistics in parentheses, * p < 0.1, ** p < 0.05, *** p < 0.01. Robust standard errors are clustered at the region level.
ownership. The effect of corruption is particularly large for companies with foreign-ownership.
Finally, our study contributes to the literature on consequences of corruption in Russia. The country
offers an extremely interesting environment for corruption research due to great heterogeneity in both
regional corruption and social-economic conditions, and it has not been sufficiently studied previously. Our
findings provide actual evidence on the reason behind an increasing under-investment in the country. We
estimate that the increase in corruption during the period under investigation is responsible for the lack of
16% of national investment in fixed capital in 2013 and that the share of missing investment is likely to
remain constant in the upcoming years if corruption maintains at the current level.
While the empirical evidence presented in this paper emphasizes the detrimental role of corruption
for the economy in developing countries, we procure a policy implication for fighting corruption. We
suggest that corruption can be reduced by sustaining freedom of press and allowing journalists to
independently carry out their professional duty without the risk of being censored, oppressed, or physically
harassed, and that, as a consequence, regions will see growth in fixed capital investment.
16
Appendix A.
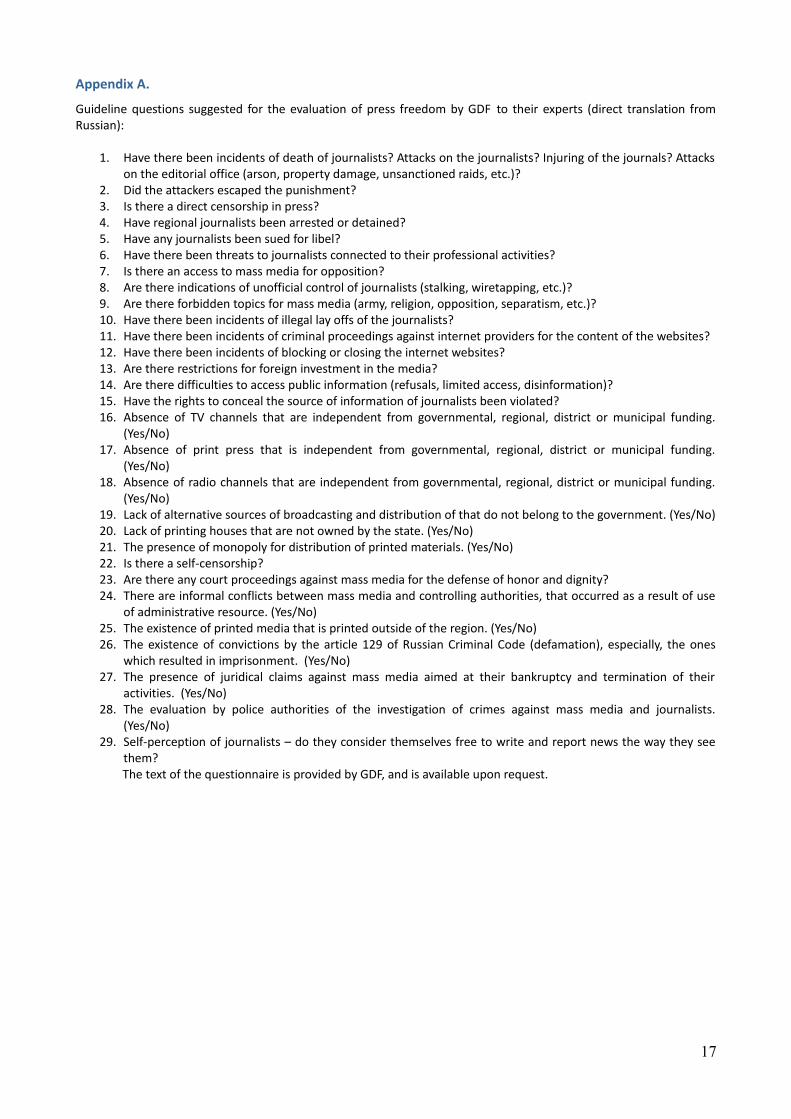
Guideline questions suggested for the evaluation of press freedom by GDF to their experts (direct translation from Russian):
1. Have there been incidents of death of journalists? Attacks on the journalists? Injuring of the journals? Attacks on the editorial office (arson, property damage, unsanctioned raids, etc.)?
2. Did the attackers escaped the punishment?3. Is there a direct censorship in press? 4. Have regional journalists been arrested or detained?5. Have any journalists been sued for libel?6. Have there been threats to journalists connected to their professional activities?7. Is there an access to mass media for opposition?8. Are there indications of unofficial control of journalists (stalking, wiretapping, etc.)?9. Are there forbidden topics for mass media (army, religion, opposition, separatism, etc.)?10. Have there been incidents of illegal lay offs of the journalists? 11. Have there been incidents of criminal proceedings against internet providers for the content of the websites?12. Have there been incidents of blocking or closing the internet websites?13. Are there restrictions for foreign investment in the media?14. Are there difficulties to access public information (refusals, limited access, disinformation)?15. Have the rights to conceal the source of information of journalists been violated?16. Absence of TV channels that are independent from governmental, regional, district or municipal funding.
(Yes/No)17. Absence of print press that is independent from governmental, regional, district or municipal funding.
(Yes/No)18. Absence of radio channels that are independent from governmental, regional, district or municipal funding.
(Yes/No)19. Lack of alternative sources of broadcasting and distribution of that do not belong to the government. (Yes/No)20. Lack of printing houses that are not owned by the state. (Yes/No)21. The presence of monopoly for distribution of printed materials. (Yes/No)22. Is there a self-censorship?23. Are there any court proceedings against mass media for the defense of honor and dignity?24. There are informal conflicts between mass media and controlling authorities, that occurred as a result of use
of administrative resource. (Yes/No)25. The existence of printed media that is printed outside of the region. (Yes/No)26. The existence of convictions by the article 129 of Russian Criminal Code (defamation), especially, the ones
which resulted in imprisonment. (Yes/No)27. The presence of juridical claims against mass media aimed at their bankruptcy and termination of their
activities. (Yes/No)28. The evaluation by police authorities of the investigation of crimes against mass media and journalists.
(Yes/No)29. Self-perception of journalists – do they consider themselves free to write and report news the way they see
them?The text of the questionnaire is provided by GDF, and is available upon request.
17

References
Aidt, T. S. (2009). Corruption, institutions, and economic development. Oxford Review of Economic Policy, 25(2), 271-291.
Andvig, J.C., 2005. A house of straw, sticks or bricks? Some notes on corruption empirics. Paper presented to IV Global Forum on Fighting Corruption and Safeguarding Integrity, Session Measuring Integrity, June 7, 2005.
Asiedu, E., & Freeman, J. (2009). The effect of corruption on investment growth: evidence from firms in Latin America, Sub‐Saharan Africa, and transition countries. Review of Development Economics, 13(2), 200-214
Baliamoune-Lutz, M., & Ndikumana, L. (2008). Corruption and growth: Exploring the investment channel (No. 2008-08). Working Paper, University of Massachusetts, Department of Economics.
Baranov, A., Malkov, E., Polishchuk, L., Rochlitz, M., & Syunyaev, G. (2015). How (not) to measure Russian regional institutions. Russian Journal of Economics, 1(2), 154-181.
Becker, J. (2004). Lessons from Russia: A neo-authoritarian media system. European Journal of Communication, 19(2), 139-163.
Bellemare, M. F., T. Masaki, & T. B. Pepinsky. (2015). ‘Lagged Explanatory Variables and the Estimation of Causal Effects.’ SSRN 2568724. Working Paper. Available at https://mpra.ub.uni-muenchen.de/62350/1/MPRA_paper_ 62350.pdf. (accessed 02.02.2017)
Blackburn, K., Bose, N., & Haque, M. E. (2006). The incidence and persistence of corruption in economic development. Journal of Economic Dynamics and Control, 30(12), 2447-2467.
Brunetti, A., Kisunko, G., & Weder, B. (1998). Credibility of rules and economic growth: Evidence from a worldwide survey of the private sector. The World Bank Economic Review, 12(3), 353-384.
Brunetti, A., & Weder, B. (1998). Investment and institutional uncertainty: A comparative study of different uncertainty measures. Review of World Economics, 134(3), 513-533.
Brunetti, A., and Weder, B. (2003). A free press is bad news for corruption. Journal of Public Economics, 87(7), 1801-1824.
Campos, J.E., D. Lien & S. Pradhan (1999), The impact of corruption on investment: predictability matters. World Development, 27(6), 1059–67.
Chowdhury, S. K. (2004). The effect of democracy and press freedom on corruption: an empirical test. Economics Letters, 85(1), 93-101.
Das, A., & Parry, M. (2011). Greasing or Sanding? GMM Estimation of the Corruption-Investment Relationship. International Journal of Economics and Research, 2(2), 95-108.
Del Monte, A., & Papagni, E. (2001). Public expenditure, corruption, and economic growth: the case of Italy. European Journal of Political Economy, 17(1), 1-16.
Donchev, Dilyan, & Gergely Ujhelyi. 2014. What do corruption indices measure?. Economics & Politics 26(2): 309-331.
Doronina, Olga. 2014 for Russia – the year no experts could have predicted (in Russian). http://www.russia-direct.org/analysis/2014-year-no-experts-could-have-predicted
Drugov, M. (2010). Competition in bureaucracy and corruption. Journal of Development Economics, 92(2), 107-114.
Easterly, W., & Levine, R. (1997). Africa's growth tragedy: policies and ethnic divisions. The Quarterly Journal of Economics, 112(4), 1203-1250.
Eismont, M. (2007). Gazety malykh gorodov. Pro et Contra, 11 (1), 43–55.
Everhart, S. S., Vazquez, J. M., & McNab, R. M. (2009). Corruption, governance, investment and growth in emerging markets. Applied Economics, 41(13), 1579-1594.
Freedom House. (2008). Freedom in the World report. Methodology Section, Washington, DC: Freedom House.
Freille, S., Haque, M. E., & Kneller, R. (2007). A contribution to the empirics of press freedom and corruption. European Journal of Political Economy, 23(4), 838-862.
Fuller, L. (2013). Reported Population Growth In Chechnya Open To Question. Radio Free Europe, Radio Liberty "Caucasus Report". http://www.rferl.org/content/caucasus-demographics-chechnya-russia-census/25169742.html.
Gehlbach, S. (2010). Reflections on Putin and the media. Post-Soviet Affairs, 26(1), 77-87.
Gupta, S., De Mello, L., & Sharan, R. (2001). Corruption and military spending. European Journal of Political Economy, 17(4), 749-777.
Gupta, S., Davoodi, H., & Alonso-Terme, R. (2002). Does corruption affect income inequality and poverty?. Economics of Governance, 3(1), 23-45.
18

Gutmann, Jerg, Fabio Padovano, & Stefan Voigt, (2015). Perception vs. experience: explaining differences in corruption measures using microdata. Working Paper. Available at SSRN:http://ssrn.com/abstract=2659349 (accessed 02.02.2017)
Habib, M., & Zurawicki, L. (2001). Country-level investments and the effect of corruption—some empirical evidence. International Business Review, 10(6), 687-700.
Hodge, A., Shankar, S., Rao, D. S., & Duhs, A. (2011). Exploring the links between corruption and growth. Review of Development Economics, 15(3), 474-490.
Johnson, N. D., LaFountain, C. L., & Yamarik, S. (2011). Corruption is bad for growth (even in the United States). Public Choice, 147(3-4), 377-393.
Keefer, P., & Knack, S. (2007). Boondoggles, rent-seeking, and political checks and balances: public investment under unaccountable governments. The Review of Economics and Statistics, 89(3), 566-572.
Kleibergen, F., & Paap, R. (2006). Generalized reduced rank tests using the singular value decomposition. Journal of Econometrics, 133(1), 97-126.
Knack, S., & Keefer. P. (1995). Institutions and economic performance: cross-country tests using alternative Institutional measures. Economics and Politics 7(3): 207-227.
Kuzmina, O., Volchkova, N., & Zueva, T. (2014). Foreign direct investment and governance quality in Russia. Journal of Comparative Economics, 42(4), 874-891.
Lambsdorff, J. G. (2006). Causes and consequences of corruption: what do we know from a cross-section of countries. International Handbook on the Economics of Corruption, 1, 3-51.
Lee, J. W. (1995). Capital goods imports and long-run growth. Journal of Development Economics, 48(1), 91-110.
Lipman, M. (2010). Freedom of expression without freedom of the press. Journal of International Affairs, 63(2), 153-169.
Mauro, P. (1995). Corruption and growth. The Quarterly Journal of Economics, 110(3), 681-712.
Myrdal, G. (1989). The equality issue in world development. The American Economic Review, 79(6), 8-17.
Pellegrini, L. (2011). The effect of corruption on growth and its transmission channels. In: Pellegrini, L., Ed., Corruption, Development and the Environment (pp. 53-74). Netherlands: Springer.
Reed, W. R. (2015). On the practice of lagging variables to avoid simultaneity. Oxford Bulletin of Economics and Statistics, 77(6), 897-905.
Safavian, M. S., Graham, D. H., & Gonzalez-Vega, C. (2001). Corruption and microenterprises in Russia. World Development, 29(7), 1215-1224.
Schulze G. G., Bambang S. S., & Zakharov, N. (2016). Corruption in Russia. Journal of Law and Economics, 59(1), 135-171.
Shaw, P., Katsaiti, M. S., & Jurgilas, M. (2011). Corruption and growth under weak identification. Economic Inquiry, 49(1), 264-275.
Sharafutdinova, G. (2010). What explains corruption perceptions? The dark side of political competition in Russia's regions. Comparative Politics, 147-166.
Shleifer, A., & Vishny, R. W. (1993). Corruption. The Quarterly Journal of Economics, 108(3), 599-617.
Shleifer, A., & Treisman, D. (2005). A normal country: Russia after communism. Journal of Economic Perspectives, 19(1), 151-174.
Staiger, D., & Stock, J. H. (1997). Instrumental variables regression with weak instruments. Econometrica, 65(3), 557-586.
Treisman, D. (2007). What have we learned about the causes of corruption from ten years of cross-national empirical research?. Annual Review of Political Science, 10, 211-244.
Weill, L. (2011). How corruption affects bank lending in Russia. Economic Systems, 35(2), 230-243.
Weber Abramo, C. (2008). How Much Do Perceptions of Corruption Really Tell Us? Economics: The Open-Access, Open-Assessment E-Journal, 2 (3), 1—56.
19