does health-oriented tourism contribute to sustainable
TRANSCRIPT
sustainability
Article
Does Health-Oriented Tourism Contribute toSustainable Mobility?
Philipp Schlemmer 1,*, Cornelia Blank 2 , Bartosz Bursa 3 , Markus Mailer 3 andMartin Schnitzer 1
1 Department of Sport Science, University of Innsbruck, Innsbruck 6020, Austria; [email protected] Institute for Sports Medicine, Alpine Medicine and Health Tourism, UMIT, Hall 6060, Austria;
[email protected] Department of Infrastructure, Unit of Intelligent Transport Systems, University of Innsbruck,
Innsbruck 6020, Austria; [email protected] (B.B.); [email protected] (M.M.)* Correspondence: [email protected]; Tel.: +43-512-507-45801
Received: 4 April 2019; Accepted: 6 May 2019; Published: 8 May 2019�����������������
Abstract: Previous research has concentrated on traffic and health-related effects in relation to arrivalpatterns (e.g., stress in connection with means of transport, travel distance, and time). However,tourist mobility behavior during a vacation and potential health-related associations as well as itscorrelation with physical activity habits and mobility patterns at home seems to have barely beenexamined. To address this research gap, the study at hand applied a mixed-method approach inthree tourism destinations in Tyrol, Austria. The study examined tourists’ mobility as well as theirphysical activity at home and at the holiday destination. Results show that the preferred transportmode (arrival and on-site) is the private car, due to its flexibility and comfort. Hotel front desks,as the main information source, determine tourists’ behavioral aspects during a vacation. Generalmobility routines show differences between everyday life and holiday situations, and physical activityis important for the overall satisfaction of tourists, which proves to be more intense and frequentduring a vacation than in everyday life. Seven percent of the tourists participating in the researchstated that they had changed their daily mobility behavior after their return, with most of themwalking or cycling more often. This study contributes to research in the field of sustainable touristmobility and physical activity behavior and highlights the necessity for further specific analyses.
Keywords: health-oriented tourism; active mobility; physical activity; sustainability
1. Introduction
Walking and cycling as modes of transport, also referred to as active mobility (AM), are ofconsiderable importance for sustainable mobility. On the one hand, increasing AM reduces theconsumption of space for transport infrastructure, energy consumption, air pollution, and noise [1–4],meeting ecological goals of Sustainable Urban Mobility Plans [5] and strategic EU policy documents [6–8].On the other hand, AM provides mobility at comparably low cost for travelers and the public, thusmeeting economic goals as well. Furthermore, AM can be used by most people without restriction, it isaffordable and accessible, and does not represent an accident risk to others. In addition, AM is healthyin that it provides regular physical activity [1]. Hence, AM also meets social aspects of sustainability,thus playing an essential role in visions and strategies for sustainable mobility (e.g., [9]).
However, mobility surveys show that the share of AM in daily travel has been decreasing inrecent decades (e.g., [10,11]) for various reasons. Although the promotion of cycling in some cities hassucceeded in significantly increasing the share of cycling [12], this has not been achieved in rural areasand the proportion of walking has decreased significantly. Increasing people’s awareness of health and
Sustainability 2019, 11, 2633; doi:10.3390/su11092633 www.mdpi.com/journal/sustainability

Sustainability 2019, 11, 2633 2 of 15
fitness can provide an opportunity to increase AM, yet AM is not only well suited to providing regularphysical activity. In contrast to sports or exercise, AM requires less time and less motivation [1]. It caneasily be integrated into daily routines and it is economically affordable. It, therefore, also has thepotential to reach sections of the population who may be less willing to engage in sports and exercise,or who cannot afford to do so due to monetary restrictions or lack of time [13]. Thus, some authorsassume that, for people with low levels of physical activity, such as sedentary, obese and elderly people,it is easier to use AM as a moderate form of regular physical activity than to take up sports or othertypes of vigorous physical activity [13,14].
Detailed studies on the inter-relationship between AM and physical activity are seen asunsuitable [13], since the majority give an incomplete picture of AM due to methodological limitationsthat either focus on mobility or physical activity. The European research project PASTA (PhysicalActivity through Sustainable Transport Approaches) investigated correlates and inter-relationshipsbetween AM and physical activity and evaluated the effectiveness of selected interventions andmeasures to promote AM so as to increase both AM and physical activity [1]. As a result, a handbook ofgood practice for the promotion of walking and cycling was published based on case studies in severalpartner cities. The description of the case studies and recommendations for local authorities presented inthe handbook include strategic policies, physical environment and infrastructure, social environment,as well as regulation and legislation in the fields of transport and health (www.pastaproject.eu).However, even though PASTA addresses the inter-relation between AM and physical activity andrenders visible the links between transportation and health, its focus is only on daily mobility in bigcities (case study cities are Antwerp, Barcelona, London, Örebro, Rome, Vienna, Zurich). It does notprovide data about the interrelation between AM and physical activity levels on a personal basis witha view to showing the potential of changing mobility patterns.
One of the limitations of modifying daily mobility behavior is that it is very routine. Therefore,situations that break with daily routines or lie outside these routines are seen as an opportunity forthe initiation of behavioral changes. Vacations can be considered as representative of such situations.So, mobility at tourist destinations especially at destinations which promote health-oriented holidayslinked with physical activity could have the potential to promote AM. However, to the best of ourknowledge, there is no detailed research into the question of whether vacations, including an activeprogram, can be an effective means of triggering a change in daily AM at home. Hence, this paperaims at analyzing health-related mobility and transport patterns of tourists on a personal level at homeand at their holiday destination. In this context, tourists were surveyed about modes of transportation,the reasons for selecting the means of transport, as well as possible differences in their daily andvacation-specific mobility patterns. We, therefore, aim to address the above-mentioned gap and toidentify possible policy-related implications.
A comprehensive review of the mobility and tourism literature, determining the physical activityfactors during a vacation that influence sustainable mobility, is provided in the next section. Theresearch questions used in this study are described in the subsequent section, followed by the methodsection. The findings of the study are presented thereafter. Finally, the discussions, limitations,conclusions, managerial implications for destination managers and policy-makers as well as an outlookfor future research are presented.
2. Theoretical Background
Generally, tourism consists of all activities, such as recreation, business, family visits or eventsthat people undertake during their trips away from their habitual environment [15]. Tourism consistsof manifold characteristics, whereby transport and mobility are more often linked to the journey itselfthan the on-site movement of tourists at certain destinations. In the recent past, some research hasconsidered tourist mobility as an essential public issue in dedicated tourism regions as well as thecontribution of tourism to climate change, with transportation to/from the destination being recognizedas a primary contributor [16–21]. Agility, quality, and rapidity of tourist mobility also influence the
Sustainability 2019, 11, 2633 3 of 15
competitiveness of destinations, through enhanced tourist satisfaction [22–25]. Scuttari et al. [26]address the tourism–traffic paradox in ecologically sensitive but tourism-intense areas, where transportpolicy-makers understand the need to minimize transport-related impacts, yet are practically unable tochange the status quo fearing negative effects of traffic management on the tourism industry. However,previous concerns about the dominance of economic or cultural aspects of tourism have recentlyaltered in favor of thoughts about sustainable tourism, balancing economic, social as well as ecologicalintentions [27] including concepts of sustainable and active mobility [28]. Without going to deep intothe topic of sustainable tourism, which goes beyond the scope of this paper, it can be said that localmobility at a destination has a decisive influence on the mode chosen for the journey to the destinationand thus on the sustainability of tourism. Similar to the perspective of Hunter ([29], p. 860ff), tourismcan be seen as a catalyst for sustainable development, and as one of the most accessible drivers ofchange and improvement not only at tourist destinations. Given these considerations, one could thinkof the health-related mobility characteristics of tourists at a destination as the sustainable specificationof mobility and transport.
2.1. Tourist Mobility Behavior
As already mentioned, like daily activities when at home, tourist activities on vacation stronglydepend on mobility and accessibility [30,31]. Tourism development necessitates travel and mobility oftourists, whereby travel and mobility are recognized separately, where travel constitutes the journey toa destination and mobility pertains to transportation at a tourism destination [32]. The trend towardmore holiday trips to increasingly remote destinations affects the demand for travel [33], simultaneouslytriggering a double-edged evolution toward higher economic and social benefits, on the one hand,and an ecological and environmental liability for the destinations, on the other. The transportationof tourists alone accounts for 86% of the entire environmental impact of tourism [34]. Nearly 75% ofholiday trips to Austria are made by private car [35]. They have a substantial influence on the levelsof traffic congestion on alpine roads, generating pollution in these environmentally fragile areas andeven disrupting the daily activities and travel patterns of local inhabitants, who experience severedifficulties in traveling due to a lack of alternative roads in the densely built-up and narrow mountainvalleys [26].
The scientific literature within this area merely concentrates on long-distance travel to and from adestination, and analyzes the decision-making processes [36], trip destination, and transport modechoices [37–39] or environmental impacts [40,41]. Some specific aspects of intra-destination mobilityare also covered, be it the use of public transportation [42,43], mobility in rural areas [26,44], movementpatterns [45,46] or access policy measures [47]. However, we have not identified any analyses oftourists’ mobility behavior on-site that focus on the relationship between physical activity habits andmobility patterns in daily life, which inspired us to conduct this study.
Within the context of sustainability, researchers often differentiate between tourist types clusteredaccording to leisure activity and mobility behavior [48,49]. The typology ranges from “fun andactions seekers” to “sophisticated cultural travelers”, distinguished by the degree and direction ofsustainability in their context or a more pragmatic classification by travel distance and total number ofholiday trips [40]. Böhler et al. conclude that “strategies aiming at the reduction of the individual’snegative environmental impact have to consider different personal preconditions for travelling as wellas the different extent to which people travel” ([40], p.666). A deeper understanding of the leisureaspect of travel can be substantiated by specific leisure mobility styles [50,51].
2.2. Tourist Health-Related Activity
With the exception of typical sports activities (e.g., skiing, hiking) practiced by visitors to Austriafor many decades, more specialized opportunities have emerged in recent years covering trail running,climbing, backcountry skiing, alpinism, MTB, road cycling, etc. [52,53]. Moreover, not only is theamount and variety of sports-focused resorts and accommodation higher, but the number of wellness,

Sustainability 2019, 11, 2633 4 of 15
health, and recovery options aimed at less sporty visitors is on the rise, too [54]. There is a broadselection of literature on the impacts of this trend on destination management [55], hoteliers, and thehospitality industry. Also, the effects of a vacation on health and wellbeing have been investigated inconsiderable depth [56,57]. It has been confirmed that there is a noticeable improvement in health andfitness levels after a vacation, even though these effects do not persist for long after returning homeand tend to decline within days or weeks [58].
Surprisingly, what has not been investigated thus far is whether the physical activity andhealth-awareness of tourists has an effect on their travel behavior, which is inseparably connectedto the performed activities. This is all the more important, as most tourist activities require travelto access the activity start locations, specific infrastructures or facilities. There is also no evidence ofhealth considerations in mobility and transportation policies that would sustainably influence theenvironment and people’s health [59]. This is supported by Higham et al. [60], who encourages theconsideration of health aspects in sustainable tourism, mobility, and transport.
3. Research Questions
Considering the interdependencies between tourist health-related activity and mobility behavior,we have put forward the following four research questions having hypothesized differences in each RQ:
• RQ1: How is travel behavior on vacation different from daily life? What is the role of sports activity?
We were particularly trying to understand whether physical activity may be a motivation for theuse of active transportation modes (cycling, walking) on vacation or in daily life. Furthermore, thestudy should provide answers as to whether or not health/sports-oriented tourists are more likelyto lean toward active transportation. Finally, RQ1 should shed light on whether the use of activetransportation replaces sports and fitness activities.
• RQ2: Do the mobility and activity patterns developed during a vacation persist after returninghome and trigger more sustainable daily mobility?
• RQ3: Why do guests decide to use a particular transportation mode for arrival and atthe destination?
We particularly aimed at understanding whether tourists’ choices in their means of transport aredriven by health or sustainability considerations? Finally, RQ3 aims at understanding what motivatespeople to use more sustainable modes of transport at the destination?
The abovementioned research questions (RQ1–RQ3) were posed using a mixed-method approachand the data obtained were thoroughly examined with mostly descriptive, statistical methods.
4. Data and Methods
4.1. Contextual Background
The study was carried out in the federal state of Tyrol in Austria. Tyrol is an alpine regioncharacterized by its dependency on tourism, focusing particularly on sports tourist activities, bothwinter (alpine skiing, back-country skiing) and summer (hiking, cycling, climbing) disciplines. Tyrol iscurrently positioning itself abroad as a region for sports tourism organizing sports events (e.g., UCIRoad Cycling Championships) and is constantly developing its offer of physically engaging activities(e.g., e-biking) [61]. Additionally, the fact that Innsbruck, the capital city of Tyrol, displays a high shareof cycling in public transport secondarily strengthens the study region of Tyrol. Since our researchfocuses on people choosing health-oriented holidays with higher levels of physical activity and activemobility, Tyrolean destinations are ideal locations when looking for answers to our research questions.To gather a more detailed overview of the mobility-related situation in the federal state of Tyrol, threecharacteristic tourist destinations (Innsbruck and its holiday villages, Pitztal and Hohe Salve) areconsidered in our study, reflecting the current tourism situation across the entire region of Tyrol.

Sustainability 2019, 11, 2633 5 of 15
4.2. Study Design and Procedures
The current study utilized a mixed-method approach including focus groups (step 1) and aquantitative questionnaire (step 2), including tourists in three Tyrolean holiday destinations (HoheSalve, Innsbruck, and Pitztal). To ensure content validity of the questionnaire, results of the focusgroups informed the design of the questionnaire, as no validated instrument was available to analyzethe research questions. The study at hand was carried out during the period from May 2016 to February2017 and was supported by each participating holiday destination. Participants in the focus groupswere based on a convenience sample and selected by the respective participating hotels. The onlyinclusion criterion was a previous sojourn by the participants in the respective region. The hotelsthemselves were recommended by the respective destination management organization.
4.2.1. Qualitative Analysis
Prior to conducting a quantitative analysis, six focus group interviews were carried out withholiday guests from all three study regions. The aim of these workshops was to examine the mobilitybehavior of the guests at the resort and at home, as well as movement and health aspects. Thisqualitative approach served to better understand the needs of guests and their behavior in orderto provide a basis for the subsequent quantitative survey. The workshops took place in five hotels(2× Hohe Salve, 2× Innsbruck, 2× Pitztal), which were recommended by the respective destinationmanagement organization. The workshop participants were approached and selected by the specificmanagement of the hotel, fulfilling the requirement that they had spent at least one previous vacationat one of the specified holiday destinations. The qualitative focus groups discussed (health-related)mobility and transportation patterns in daily life and during a vacation as well as their possible mutualimpacts. The workshop took place in a moderated form and was structured by means of two flipchartson the topic of “mobility”, as well as “sporting activities”. Here, the participants were asked to mark thecategories applicable to them with a glue dot. The resulting mood of the participants was then discussedin the group in order to gain deeper insights into the topics of (health-related) mobility, transport, andsatisfaction. The focus groups were conducted in English, German or Italian language—depending onthe nationality of the participants. All focus groups were carried out according to the ethical guidelinesand criteria stated by Patton [62]. Afterwards, the focus groups were transcribed verbatim in theiroriginal language and the raw material was read and encoded, following the qualitative contentanalysis of Mayring and Fenzl [63].
4.2.2. Quantitative Analysis
The online survey was conducted between 1 December 2016 and 28 February 2017. Thequestionnaire consisted of three general topics, concerning socio-demographic data, activity-relatedinterests, as well as mobility patterns in everyday life and in holiday settings. The tourists wereapproached through the newsletter of each tourism region, which included a link to the specificquestionnaire of each holiday destination. In detail, all tourists were asked to make their specificationsregarding their last holiday (regardless of whether it was a winter or summer vacation) in one ofthese three Tyrolean holiday destinations. The study at hand was conducted according to the “ethicalguidelines for surveys” approved by the Institutional Review Board (IRB) of the Department of SportScience as well as the Board for Ethical Issues of the University of Innsbruck. Socio-demographic dataassessed included information about gender, age, level of education, income, occupation, origin, andlevel of physical activity.
Mobility behavior included questions about everyday life mobility, on-site mobility as well asdecisive motivational patterns. The structure of daily mobility was captured in the questionnaire byasking about frequency of use of a particular transport mode. Seven transport mode categories weredistinguished: walking, cycling, e-biking, public transport (bus, train, etc.), private car/motorbike asdriver, private car/motorbike as passenger and car-sharing. Furthermore, five frequency categories
Sustainability 2019, 11, 2633 6 of 15
were applied: 4–7 days per week, 1–3 days per week, 1–3 days per month, more rarely, never. Basedon these use frequencies, two level categories: actively mobile (more than 1 day/week) and passivelymobile (less than 3 days/month) were created for each transport mode and the respondents weregrouped into one of them. Mobility on vacation was measured by asking the respondents whichtransport mode out of the following 11 they used as the main mode at the destination: private car,rented car, campervan, motorbike, coach, train, bus, taxi, bicycle, e-bicycle, walking.
The level of physical activity was assessed by using the Godin Leisure Time Exercise Questionnaire,categorizing respondents into three groups. The categorization was conducted via the proposedFormula (1), resulting in the Godin Scale Score:
Weekly leisure activity score = (9 × Strenuous) + (5 ×Moderate) + (3 × Light), (1)
The values for strenuous, moderate and light activities were addressed in the question: how manytimes on average do you engage in the following kinds of exercise (strenuous exercise—heart beatsrapidly; moderate exercise—not exhausting; light exercise—minimal effort) for more than 15 min duringyour free time in a typical 7-day period (a week)? The given information about strenuous, moderate,and light activities was multiplied by nine, five, and three respectively and further divided into thegroup of Insufficiently Active/Sedentary people (<14 units), Moderately Active people (14–23 units),and Active people (>24 units).
In total, 588 persons participated throughout the period of the survey, with 127 tourists from theholiday destination Hohe Salve (36.6% female; 63.7% male), 402 tourists from the holiday destinationInnsbruck and its holiday villages (57.4% female; 42.6% male) and 59 tourists from the holidaydestination Pitztal (43.1% female; 56.4% male). The minimum and maximum ages were 18 years and81 years, resulting in an average age of about 46.4 (14.1) years. The average number of overnight stayswas 4.6 (4.2) days.
4.3. Statistical Analysis
All statistical analyses were carried out using SPSS v. 24.0 (IBM Statistics, IL, United States).Relative to the research questions, Chi2-Tests, linear mixed-model analyses in the case of homogeneityof variances with Bonferroni-corrected post-hoc tests, as well as Welsch tests in the case of varianceinhomogeneity with Tamhane-corrected post-hoc tests, were performed. Core outcomes were themain sociodemographic data, the main effect of physical activity over time, the interaction effectsbetween activity level and holiday destination as well as effects according to the specific mobilitypatterns. In the case of non-significant interaction effects but significant main effects on well-being,Sidak-corrected or Tamhane-corrected post-hoc tests were used to provide more details on the effects.In the case of a significant interaction effect (activity level), post-hoc ANOVA was performed separatelyfor the respective groups. The level of significance was set at p < 0.05 with the additional informationabout the effect sizes (Eta-squared). Unless otherwise stated, data are presented as mean values (MV)with standard deviation (SD) or relative frequencies (%).
5. Results
5.1. General Findings Relating to the Sociodemographic Profile and Activity Levels
At the beginning, it was striking that the study showed very large intra-regional differences inthe number of questionnaires answered. As already mentioned, the questionnaire was completed by127 persons in the holiday region Hohe Salve, 402 persons in Innsbruck and its holiday villages, and59 persons in the holiday region Pitztal. The number of completed questionnaires differed significantlybetween the holiday regions. The distribution of gender in the questionnaire also showed a verysignificant difference (Chi (2) = 18.67, p < 0.001).
The average age of the guests in the holiday regions also differed significantly (F (2141.18) = 21.98,p < 0.001, Hohe Salve 54.17 ± 11.71 years, Innsbruck 46.26 ± 14.08 years, Pitztal 53 ± 13.82 years),

Sustainability 2019, 11, 2633 7 of 15
with the Tamhane post-hoc test showing highly significant differences between the holiday regionHohe Salve and Innsbruck (p < 0.01), as well as Innsbruck and the holiday region Pitztal (p < 0.01).The holiday frequency in the respective holiday region also differed significantly (F (2240.23) = 11.99,p < 0.01). In the Hohe Salve holiday region, the guests surveyed had already been 6.75 ± 11.45 times,compared to 5.02 ± 12.08 times in the Innsbruck holiday region and its holiday villages, and 2.16 ±3.61 times in the Pitztal holiday region, differing significantly according to post-hoc analysis (HoheSalve/Pitztal, p <0.01; Innsbruck/Pitztal; p < 0.01).
With regard to length of stay, significant differences can also be observed (F (2565) = 3.95, p = 0.02),with guests spending an average of 6.64 ± 7.91 days in the Hohe Salve holiday region, 4.94 ± 5.37 daysin Innsbruck, and 5.05 ± 3.81 days in the Pitztal, with the Bonferroni post-hoc test only showing thedifference (p = 0.017) between the Hohe Salve and Innsbruck regions. The tourists’ satisfaction levelswith the specific hotel offering did not differ significantly between the regions. By contrast, the regionsdiffered in the usage behavior of guest cards, with 60% in the Hohe Salve holiday region and 71% inInnsbruck and its holiday villages using a guest card (Chi2 = 4.94, p = 0.026). The summer map wasalso used significantly differently within the regions (Hohe Salve 83%, Innsbruck 65%, Pitztal 66%,Chi2 = 13.3, p < 0.01).
According to Godin [64], the physical activity of the tourists was significantly higher on vacation(61.62 ± 113.71) than at home (48.7 ± 132.16; T (350) = −3.63, p < 0001); however, there was no significantinteraction effect (p > 0.05), confirming the similarity of destinations (Table 1). This significant increasein physical activity can be observed in all holiday regions (η2 = 0.036, p < 0.01). The vacation durationshows no relation to the extent of physical activity at home or on vacation (p > 0.05) and also theinner-regional view did not lead to a significant result (p > 0.05). In general, the extent of physicalactivity while on holiday did not show any gender, age, education or income-related differences,and vacation planning had no effect (p > 0.05). Satisfaction with the activities on offer at the touristaccommodation of the three holiday regions does not affect the extent of physical activity.
Table 1. Overview of mean values and standard deviations of Godin scores according to holiday region.
Score Holiday Region Mean Value Standard Deviation
Godin score in everyday-life
Hohe Salve (n = 67) 39.7 28.7
Innsbruck (n = 244) 51.3 156.9
Pitztal (n = 40) 47.9 41.7
Total (n = 351) 48.7 132.2
Godin score in holiday setting
Hohe Salve (n = 67) 65.8 73.9
Innsbruck (n = 244) 60.2 129.7
Pitztal (n = 40) 63.4 44.5
Total (n = 351) 61.6 113.7
5.2. Specific Findings Relating to the Research Questions
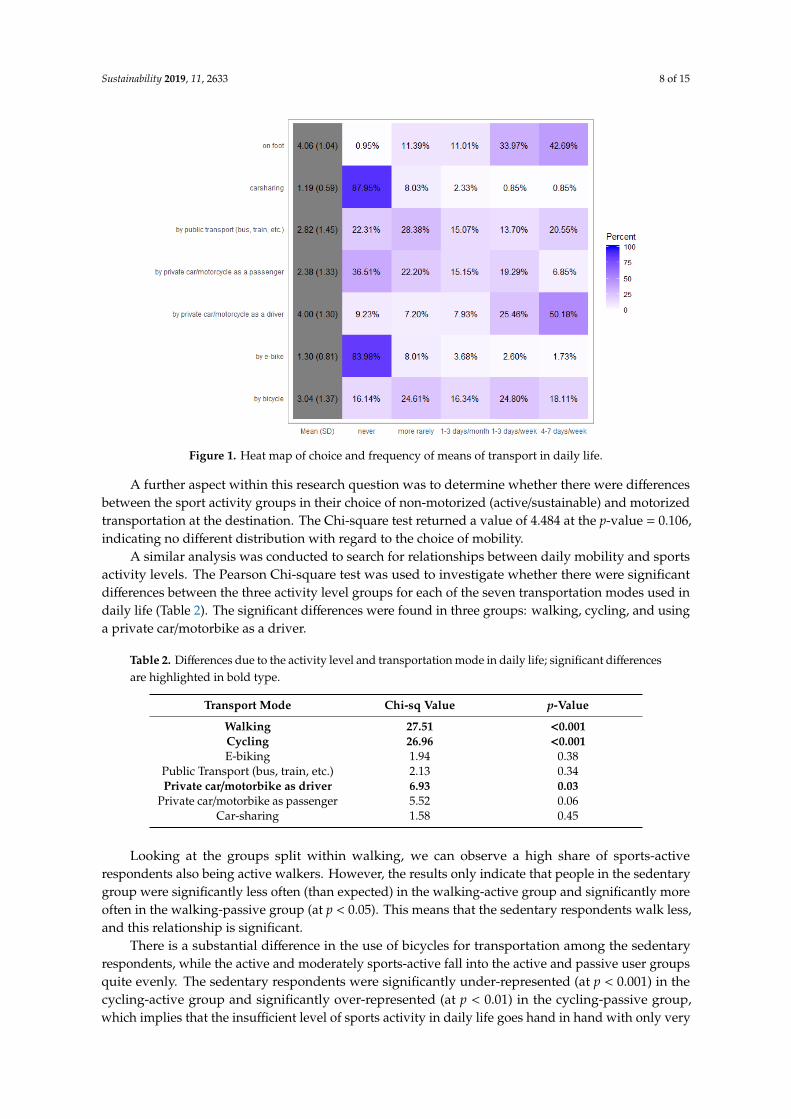
Regarding RQ1, the results reveal that the predominant mode of transport used for on-site mobilitywhile on vacation is the private car (46.2%), followed by bus (20.0%), walking (18.6%), and e-bike(6.6%). A similar picture can be painted in the use of various transport modes in daily life (Figure 1).Driving a private car and walking are most common, followed by public transport and cycling.
Our initial hypothesis that there might be a correlation between daily and vacation mobilitypatterns was not reflected in the data. Using Chi-square and Fisher tests between vacation/everyday-lifeand active/passive utilization, we found that there was no association between how often peopleused particular transport modes in daily life and whether they then decided to use motorized ornon-motorized modes of transport while on vacation. No differences between groups were found tobe significant.
Sustainability 2019, 11, 2633 8 of 15Sustainability 2019, 11, x FOR PEER REVIEW 8 of 15
Figure 1. Heat map of choice and frequency of means of transport in daily life.
Our initial hypothesis that there might be a correlation between daily and vacation mobility
patterns was not reflected in the data. Using Chi‐square and Fisher tests between vacation/everyday‐
life and active/passive utilization, we found that there was no association between how often people
used particular transport modes in daily life and whether they then decided to use motorized or non‐
motorized modes of transport while on vacation. No differences between groups were found to be
significant.
A further aspect within this research question was to determine whether there were differences
between the sport activity groups in their choice of non‐motorized (active/sustainable) and motorized
transportation at the destination. The Chi‐square test returned a value of 4.484 at the p‐value = 0.106,
indicating no different distribution with regard to the choice of mobility.
A similar analysis was conducted to search for relationships between daily mobility and sports
activity levels. The Pearson Chi‐square test was used to investigate whether there were significant
differences between the three activity level groups for each of the seven transportation modes used
in daily life (Table 2). The significant differences were found in three groups: walking, cycling, and
using a private car/motorbike as a driver.
Table 2. Differences due to the activity level and transportation mode in daily life; significant
differences are highlighted in bold type.
Transport Mode Chi‐sq Value p‐Value
Walking 27.51 <0.001
Cycling 26.96 <0.001
E‐biking 1.94 0.38
Public Transport (bus, train, etc.) 2.13 0.34
Private car/motorbike as driver 6.93 0.03
Private car/motorbike as passenger 5.52 0.06
Car‐sharing 1.58 0.45
Looking at the groups split within walking, we can observe a high share of sports‐active
respondents also being active walkers. However, the results only indicate that people in the sedentary
group were significantly less often (than expected) in the walking‐active group and significantly
more often in the walking‐passive group (at p < 0.05). This means that the sedentary respondents
walk less, and this relationship is significant.
Figure 1. Heat map of choice and frequency of means of transport in daily life.
A further aspect within this research question was to determine whether there were differencesbetween the sport activity groups in their choice of non-motorized (active/sustainable) and motorizedtransportation at the destination. The Chi-square test returned a value of 4.484 at the p-value = 0.106,indicating no different distribution with regard to the choice of mobility.
A similar analysis was conducted to search for relationships between daily mobility and sportsactivity levels. The Pearson Chi-square test was used to investigate whether there were significantdifferences between the three activity level groups for each of the seven transportation modes used indaily life (Table 2). The significant differences were found in three groups: walking, cycling, and usinga private car/motorbike as a driver.
Table 2. Differences due to the activity level and transportation mode in daily life; significant differencesare highlighted in bold type.
Transport Mode Chi-sq Value p-Value
Walking 27.51 <0.001Cycling 26.96 <0.001E-biking 1.94 0.38
Public Transport (bus, train, etc.) 2.13 0.34Private car/motorbike as driver 6.93 0.03
Private car/motorbike as passenger 5.52 0.06Car-sharing 1.58 0.45
Looking at the groups split within walking, we can observe a high share of sports-activerespondents also being active walkers. However, the results only indicate that people in the sedentarygroup were significantly less often (than expected) in the walking-active group and significantly moreoften in the walking-passive group (at p < 0.05). This means that the sedentary respondents walk less,and this relationship is significant.
There is a substantial difference in the use of bicycles for transportation among the sedentaryrespondents, while the active and moderately sports-active fall into the active and passive user groupsquite evenly. The sedentary respondents were significantly under-represented (at p < 0.001) in thecycling-active group and significantly over-represented (at p < 0.01) in the cycling-passive group,which implies that the insufficient level of sports activity in daily life goes hand in hand with only very

Sustainability 2019, 11, 2633 9 of 15
rarely using a bicycle for transportation (less than 3 days in a month). No other differences betweengroups were found to be significant.
As far as driving a private car is concerned, one can still observe that the majority of driversare physically active in daily life. However, it can be reported that the sedentary respondentsfell significantly more often (at p < 0.05) into the passive-drivers group, which means that beinginsufficiently sports-active in daily life can result not only in walking and cycling rarely but also indriving rarely. No other differences between groups were found to be significant.
Regarding RQ2, we analyzed whether mobility and activity patterns developed during a vacationpersisted after returning home and triggered more sustainable daily mobility. We found that 93% ofrespondents in all three physical activity groups did not change their daily mobility habits after comingback home from a vacation. However, among the 7% who changed their habits, 73% declared that theyhad started using more AM, predominantly walking more, and nearly one-third started traveling moreby public transport/car-sharing.
As far as RQ3 is concerned, we found that the majority (74%) of respondents specified that theirprivate car had been their main transport mode for the trip to the vacation resort. The main reasons forarriving by car are, above all, on-site mobility, flexibility, luggage transportation, comfort, and traveltime. Besides the exact reasons for choosing a particular mode of transport for arrival or for travelingat the destinations, we also examined their attitudes towards sustainability in transport. Figure 2depicts the demand for necessary conditions that would have to be fulfilled to encourage visitors touse environmentally friendly modes of transport on vacation. There is a broad acceptance for makinga positive contribution to climate and nature preservation. However, over 80% of respondents arenot willing to compromise on flexibility and comfort while traveling. They also want to be rewarded(with discounts, vouchers, etc.) for their environmentally friendly behavior. One can observe a visibleresistance to undertaking a leading role in the process. On the other hand, almost a third of respondentsdo not mind being the only ones using the environment-friendly transportation modes.
Sustainability 2019, 11, x FOR PEER REVIEW 9 of 15
There is a substantial difference in the use of bicycles for transportation among the sedentary
respondents, while the active and moderately sports‐active fall into the active and passive user
groups quite evenly. The sedentary respondents were significantly under‐represented (at p < 0.001)
in the cycling‐active group and significantly over‐represented (at p < 0.01) in the cycling‐passive
group, which implies that the insufficient level of sports activity in daily life goes hand in hand with
only very rarely using a bicycle for transportation (less than 3 days in a month). No other differences
between groups were found to be significant.
As far as driving a private car is concerned, one can still observe that the majority of drivers are
physically active in daily life. However, it can be reported that the sedentary respondents fell
significantly more often (at p < 0.05) into the passive‐drivers group, which means that being
insufficiently sports‐active in daily life can result not only in walking and cycling rarely but also in
driving rarely. No other differences between groups were found to be significant.
Regarding RQ2, we analyzed whether mobility and activity patterns developed during a
vacation persisted after returning home and triggered more sustainable daily mobility. We found
that 93% of respondents in all three physical activity groups did not change their daily mobility habits
after coming back home from a vacation. However, among the 7% who changed their habits, 73%
declared that they had started using more AM, predominantly walking more, and nearly one‐third
started traveling more by public transport/car‐sharing.
As far as RQ3 is concerned, we found that the majority (74%) of respondents specified that their
private car had been their main transport mode for the trip to the vacation resort. The main reasons
for arriving by car are, above all, on‐site mobility, flexibility, luggage transportation, comfort, and
travel time. Besides the exact reasons for choosing a particular mode of transport for arrival or for
traveling at the destinations, we also examined their attitudes towards sustainability in transport.
Figure 2 depicts the demand for necessary conditions that would have to be fulfilled to encourage
visitors to use environmentally friendly modes of transport on vacation. There is a broad acceptance
for making a positive contribution to climate and nature preservation. However, over 80% of
respondents are not willing to compromise on flexibility and comfort while traveling. They also want
to be rewarded (with discounts, vouchers, etc.) for their environmentally friendly behavior. One can
observe a visible resistance to undertaking a leading role in the process. On the other hand, almost a
third of respondents do not mind being the only ones using the environment‐friendly transportation
modes.
Figure 2. Preferences of sustainable mobility behavior.
6. Discussion
Figure 2. Preferences of sustainable mobility behavior.
6. Discussion
6.1. Tourist Transportation and Mobility
On-site mobility on vacation proves no direct relationship with the level of physical activity. As faras daily mobility is concerned; however, relationships do emerge. The respondents engaging in morephysical activity in daily life also tend to walk and cycle more for everyday transportation. Similarly,
Sustainability 2019, 11, 2633 10 of 15
the sedentary respondents walk and cycle less, and even drive significantly less. This allows us toconclude that while the level of physical activity at home might influence daily mobility patterns, themobility behavior on vacation is driven by other factors than the level of physical activity on-site.Consequently, while, for example, promoting physical activity or building sports infrastructure in theregions from which the visitors to the Alps usually originate (non-tourist urban/metropolitan areas)might result in higher shares of sustainable, non-motorized transportation modes in the modal split,this would not be the case at tourist destinations. Surprisingly for us, the mobility patterns at homeseem to be unrelated to the ones adopted during a vacation. Furthermore, the active cyclists/walkers athome do not cycle/walk significantly more on vacation, nor are the daily drivers driving more at theirvacation resorts.
These travel decisions are made independently in different conditions and considering differentfactors. A limitation of the questionnaire was that the questions about daily mobility pertain to anaverage week in the respondent’s life, which means that we cannot distinguish whether the respondentwas reporting about the week before or after their vacation. We could not, therefore, investigate thedirect relationship between physical activity on vacation and daily mobility after returning home. It isonly possible to assess this indirectly by asking if their travel behavior changed after the vacation. Thefew respondents in the sample that did change their daily mobility behavior claimed to be walking orcycling more. This, however, was found to be unrelated to physical activity levels, which could forinstance mean that the physically active vacationers did not start using non-motorized transportationafter their vacation significantly more than before.
Apparently, there are other, more influential factors shaping mobility decisions during a vacation,such as flexibility, luggage transportation and on-site mobility. This is supported by the answersto the question regarding attitudes towards sustainability. The respondents do not want to give upcomfort and flexibility when traveling on vacation, even though their overall awareness level aboutsustainability, environment and climate is high. In the context of health-oriented behavior, particularattention should be paid to the promotion of the use of physically active modes of transport (walking,cycling or e-biking). The urge for active travel such as cycling, walking or taking non-motorizedmeans of transport is rising, which is also mentioned in literature as significant cardiovascular effort orbeneficial metabolic costs [65]. The analysis of active travel also implies economic value for recreationaland non-recreational interests, which have already drawn political interest, leading to integrationin the operations of public transport organizations, the promotion of tourism, leisure, and sport aswell as the integration of active travel by the public [65] and in integrated planning strategies forsustainable tourism [48]. A recent study from Norway shows that e-bikes are of little interest to peoplewho already utilize bicycles for personal transport or even for exercise. However, e-bikes can serveother purposes [66]. Active modes of transport are often underestimated in terms of their publicvalue, whereby promoting these active modes of travel can reduce expenditure on transportation forindividuals and communities [67]. This means that, the way one travels on vacation and the way onetravels at home seem to be independent decisions.
Additionally, the acknowledgement of active travel is rising in society due to its impact on humanhealth [68], substantiating the importance of active travel. Furthermore, active travel contributesto a sense of vitality, social cohesion, and sustainable tourism, with an associated aim of reducingdependence on car travel [69,70]. This is partly motivated by a desire among people who want totravel in a sustainable manner and want to be less dependent on motorized means of transport. Thesepeople are also aware of the cost-efficient and sustainable characteristics of active travel. Importantfactors in promoting public cycling are not only infrastructural improvements but also information andmarketing. However, since the general traffic situation in the municipalities also plays a significant role,the supply and motivation of the local population and those employed in tourism are also essential [67].In particular, there is room for improvement in the availability of information on accessibility to publictransport and the sometimes very diverse modes of transport in the respective regions.
Sustainability 2019, 11, 2633 11 of 15
6.2. Physical Activity
The regions were specifically selected for physical activity on vacation, because tourists are awarein advance of the sporting activities on offer, represented by the frequency of physical activities while onvacation (61.62 ± 113.71). This would also explain the generally high level of satisfaction in all regions.
These results are backed by findings from previous research done by De Bloom et al. [71], whotried to answer the question of possible activity effects during a vacation on satisfaction and wellbeing.Time for physical, social, and passive activities was considered in their analysis and they revealedthat engagement in physical, social, and passive activities contributes to enhancements in satisfaction,wellbeing and health during and after a vacation. Furthermore, they show that time spent on physicalactivities has a strong effect on these parameters, which means the more time spent on physical activity,the better the effects on satisfaction, health and wellbeing during a vacation. However, this cannotbe taken for granted as the results of De Bloom et al. [72] show. This study states that activities andexperiences in vacation situations are only weakly associated with improvements in health, satisfaction,and wellbeing. Only, passive activities, savoring, relaxation and sleep are determining factors forhealth and wellbeing improvements. There is general consensus that (physical) activities are seenas important influencing and predicting variables for satisfaction. Contemporary research, though,highlights impacts of physical activities during a vacation on satisfaction, wellbeing and other healthparameters [57]. Interestingly, there are no regional differences between destinations. One may,therefore, assume that city tourists are less sports-affine than the guests in the other regions. Here,perhaps, the image of Innsbruck as a sports city could also have attracted more sporty tourists.
6.3. Limitations
Finally, several limitations of this study should be mentioned. First of all, so far only the federalstate of Tyrol has been a focus of research and was only represented by three different tourismdestinations. Secondly, we found only a few voluntary participants for the focus groups, which resultsin very limited outcomes for the qualitative part of the study, and furthermore, the convenience samplemay constitute a limiting factor. Moreover, the survey was conducted via the newsletter servicesof each holiday destination, which also only reaches a certain community and may lead to a bias.A further limiting factor is limited regional examination of respondents and a possible restriction ofthe informative value of the current study, which stands alongside the conscious decision to use threedifferent holiday destinations in Tyrol for transparency and comparability. This limitation clearlyprovides the basis for further discussion.
7. Conclusions, Implications and Outlook
The outcomes of this research revealed several implications that are worthy of consideration bytourism destinations as well as policy-makers. As sustainable transportation and mobility are thecrux of prospective tourism planning, more effective knowledge about behavioral tourist patterns,arrival patterns etc. of tourists is essential. Active mobility patterns are seen as a simple way toinclude beneficial physical activity into people’s daily lives, whereby active mobility or transportationis understood as any kind of transport movement requiring human physical power [72]. As a functionof accessibility, active transportation modalities are crucial for the selection of the means of transportas well as the layout of the community [64]. In this context, Handy and Clifton [73] reflect uponaccessibility as the simplicity to reach desired activities without the utilization of motorized means oftransport. Furthermore, the infrastructural circumstances can facilitate or constrain physical activity.Saelens, Sallis, and Frank [74] claim that the relationship between the built environment and physicallyactive means of transport or driving have to be differentiated. Previous research further agreesthat the design of community also supports the role and choice of the means of transport used [75].Density and intensity of development, the functionality of destinations, the aesthetic qualities ofcertain destinations and the connectivity of the street network are characteristics of activity-friendly
Sustainability 2019, 11, 2633 12 of 15
destinations or communities [74], otherwise known as walkable communities [76]. Additionally,research shows that residents of pedestrian- or cycling-oriented destinations engage in more physicallyactive transportation than other communities [77]. This suggests that the residents’ exemplification ofan active lifestyle as well as the clear preference for active means of transport for tourists are takeninto consideration.
Building upon the background of current touristic developments, which indicate a rise in therecreational interests of tourists, offers including physical activities and sustainable active mobilitycould potentially add a unique facet to a holiday destination, both for tourists and residents.
Unfortunately, the findings suggest no direct relationship between the level of physical activityduring a vacation and mobility behavior. There is, however, potential for future change as 7% ofrespondents declared they altered their behavior toward AM after the vacation, with the majoritystarting to walk and cycle more, and many using public transport more frequently. Taking intoaccount how difficult it is to initiate behavioral changes in transportation by traffic measures due to theroutine nature of transport, this group of 7%, though apparently small at first glance, is in fact quiteremarkable and could potentially become a starting point for more far-reaching changes. This showsthat the promotion of AM can build on the potential of health-oriented motivations. Campaigns shouldtherefore intensify their focus on health and life-style messages alongside environmental reasons.Moreover, the promotion of more active means of transport during leisure and recreation time mayalso provide a more active and sustainable mobility pattern in daily life. We suggest further analysis infuture research (e.g., to what extent can the frequency with which AM is used increase after a vacation).
Nevertheless, there is still no definitive understanding of active mobility patterns among touristsin alpine destinations, which therefore requires further investigation. It is hoped that the presentfindings can be taken into account for further and future research in the field of sustainable tourismand transportation.
Author Contributions: The following authors contributed to conceptualization, P.S., B.B., C.B., M.M. and M.S.;methodology, P.S., B.B., C.B., M.M. and M.S.; formal analysis, P.S., B.B., C.B., M.M. and M.S.; investigation, P.S.,B.B., C.B., M.M. and M.S.; writing—original draft preparation, P.S., B.B., C.B., M.M. and M.S.; writing—reviewand editing, P.S., B.B., C.B., M.M. and M.S.; visualization, B.B.; supervision, P.S., B.B., C.B., M.M. and M.S.; projectadministration, P.S. and M.S.
Funding: This research was financially supported by the Tyrolean Tourism Research Fund.
Acknowledgments: We would also like to express our gratitude to the three Tyrolean destination managementorganizations Hohe Salve, Innsbruck as well as Pitztal.
Conflicts of Interest: The authors declare no conflict of interest.
References
1. Gerike, R.; de Nazelle, A.; Nieuwenhuijsen, M.; Panis, L.I.; Anaya, E.; Avila-Palencia, I.; Boschetti, F.;Brand, C.; Cole-Hunter, T.; Dons, E.; et al. Physical Activity through Sustainable Transport Approaches(PASTA): A study protocol for a multicentre project. BMJ Open 2016, 6, e009924. [CrossRef]
2. Jones, P. The role of an evolving paradigm in shaping international transport research and policy agendas overthe last 50 years. In Travel Behavior Research in an Evolving World; Pendyala, R., Bhatt, C., Eds.; Lulu Publishers:Raleigh, NC, USA, 2012; pp. 3–34.
3. Van Wee, B.; Annema, J.A.; Banister, D. The Transport System and Transport Policy: An Introduction; EdwardElgar: Cheltenham, UK, 2013.
4. Woodcock, J.; Edwards, P.; Tonne, C.; Armstrong, B.G.; Ashiru, O.; Banister, D.; Beevers, S.; Chalabi, Z.;Chowdhury, Z.; Cohen, A.; et al. Public health benefits of strategies to reduce greenhouse-gas emissions:Urban land transport. Lancet 2009, 374, 1930–1943. [CrossRef]
5. Brand, C.; Goodman, A.; Rutter, H.; Song, Y.; Ogilvie, D. Associations of individual, household andenvironmental characteristics with carbon dioxide emissions from motorised passenger travel. Appl. Energy2013, 104, 158–169. [CrossRef] [PubMed]
6. European Commission. Green Paper: Towards a New Culture for Urban Mobility. Available online:http://eur-lex.europa.eu/legal-content/EN/ALL/?uri=CELEX:52007DC0551 (accessed on 26 August 2015).
Sustainability 2019, 11, 2633 13 of 15
7. European Commission. White Paper ‘Roadmap to a Single European Transport Area—Towards a Competitiveand Resource Efficient Transport System’. Available online: http://ec.europa.eu/transport/themes/strategies/2011_white_paper_en.htm (accessed on 26 August 2015).
8. European Commission. Together towards Competitive and Resource-Efficient Urban Mobility. Availableonline: http://ec.europa.eu/transport/themes/urban/doc/ump/com%282013%29913_en.pdf (accessed on 26August 2015).
9. Mailer, M.; Wulfhorst, G.; Bogenberger, K.; Kesselring, S.; Keil, M.; Reiter, M. Mobility 2050. Region ofMunich—Creating a Common Vision for Sustainable Development in a Unique Public Private Cooperation.Transp. Res. Proc. 2014, 4, 557–565. [CrossRef]
10. Bundesministerium für Verkehr, Innovation und Technologie. Österreich Unterwegs 2013/14. Availableonline: https://www.bmvit.gv.at/verkehr/gesamtverkehr/statistik/oesterreich_unterwegs/downloads/oeu_2013-2014_Ergebnisbericht.pdf (accessed on 2 April 2019).
11. Bracher, T.; Dziekan, K.; Gies, J.; Huber, F.; Kiepe, F.; Reutter, U.; Saary, K.; Schwedes, O. Handbuch derkommunalen Verkehrsplanung; VDE Verlag: Berlin, Germany, 2011.
12. Pospischil, F.; Mailer, M. The Potential of Cycling for Sustainable Mobility in Metropolitan Regions—TheFacts behind the Success Story of Innsbruck. Transp. Res. Proc. 2014, 4, 80–89. [CrossRef]
13. Sahlqvist, S.; Song, Y.; Ogilvie, D. Is active travel associated with greater physical activity? The contributionof commuting and non-commuting active travel to total physical activity in adults. Prev. Med. 2012, 55,206–211. [CrossRef]
14. Warburton, D.E.; Nicol, C.W.; Bredin, S.S. Health benefits of physical activity: The evidence. CMAJ 2006, 174,801–809. [CrossRef] [PubMed]
15. Martín Martín, J.M.; Guaita Martínez, J.M.; Molina Moreno, V.; Sartal Rodríguez, A. An Analysis of theTourist Mobility in the Island of Lanzarote: Car Rental Versus More Sustainable Transportation Alternatives.Sustainability 2019, 11, 739. [CrossRef]
16. Lumsdon, L.; Page, S.J. Tourism and Transport: Issues and Agenda for the New Millennium; Elsevier Science Ltd.:Amsterdam, The Netherlands, 2004.
17. Page, S. Transport. and Tourism: Global Perspectives; Harlow: Pearson, UK, 2005.18. Duval, D.T. Tourism and Transport: Modes, Networks and Flows; Channel View Publications: Clevedon, UK,
2007.19. Scott, D.; Gössling, S.; Hall, C.M. Tourism and Climate Change: Impacts, Adaptation and Mitigation; Routledge:
Abingdon, UK, 2012.20. Gutiérrez, A.; Miravet, D. The determinants of tourist use of public transport at the destination. Sustainability
2016, 8, 908. [CrossRef]21. Unger, R.; Abegg, B.; Mailer, M.; Stampfl, P. Energy Consumption and Greenhouse Gas. Emissions Resulting
from Tourism Travel in an Alpine Setting. Mt. Res. Dev. 2016, 36, 475–483. [CrossRef]22. Prideaux, B. The role of the transport system in destination development. Tour. Manag. 2000, 21, 53–63.
[CrossRef]23. Gronau, W.; Kagermeier, A. Key factors for successful leisure and tourism public transport provision. J. Transp.
Geogr. 2007, 1, 127–135. [CrossRef]24. Thompson, K.; Schofield, P. An investigation of the relationship between public transport performance and
destination satisfaction. J. Transp. Geogr. 2007, 15, 136–144. [CrossRef]25. Le-Klähn, D.T.; Gerike, R.; Hall, C.M. Visitor users vs. non-users of public transport: The case of Munich,
Germany. J. Destin. Mark. Manag. 2014, 3, 152–161. [CrossRef]26. Scuttari, A.; Orsi, F.; Bassani, R. Assessing the tourism traffic paradox in mountain destinations. A stated
preference survey on the Dolomites’ passes (Italy). J. Sustain. Tour. 2019, 27, 241–257. [CrossRef]27. Ivars, J.A. Regional tourism planning in Spain: Evolution and Perspective. Ann. Tour. Res. 2004, 31, 313–333.
[CrossRef]28. Scuttari, A.; Volgger, M.; Pechlaner, H. Transition management towards sustainable mobility in Alpine
destinations: Realities and realpolitik in Italy’s South Tyrol region. J. Sustain. Tour. 2016, 24, 463–483.[CrossRef]
29. Hunter, C. Sustainable tourism as an adaptive paradigm. Ann. Tour. Res. 1997, 24, 850–867. [CrossRef]30. Geurs, K.T.; van Wee, B. Accessibility evaluation of land-use and transport strategies: Review and research
directions. J. Transp. Geogr. 2004, 12, 127–140. [CrossRef]
Sustainability 2019, 11, 2633 14 of 15
31. Scuttari, A.; Della Lucia, M.; Martini, U. Integrated planning for sustainable tourism and mobility. A tourismtraffic analysis in Italy’s South Tyrol region. J. Sustain. Tour. 2013, 21, 614–637. [CrossRef]
32. Verbeek, D.; Mommaas, H. Transitions to Sustainable Tourism Mobility: The Social Practices Approach.J. Sustain. Tour. 2008, 16, 629–644. [CrossRef]
33. Peeters, P.M.; van Egmond, T.; Visser, N. European Tourism, Transport. and Environment: Final Version;NHTV CSTT: Breda, The Netherlands, 2004.
34. Patterson, T.M.; Niccolucci, V.; Bastianoni, S. Beyond ‘more is better’: Ecological footprint accounting fortourism and consumption in Val die Merse, Italy. Ecol. Econ. 2007, 62, 747–756. [CrossRef]
35. Österreich Werbung. T-MONA Urlauberbefragung; Österreich Werbung: Vienna, Austria, 2014.36. Sirakaya, E.; Woodside, A.G. Building and testing theories of decision making by travellers. Tour. Manag.
2005, 26, 815–832. [CrossRef]37. LaMondia, J.; Snell, T.; Bhat, C. Traveler Behavior and Values Analysis in the Context of Vacation Destination
and Travel Mode Choices. Transp. Res. Rec. 2010, 2156, 140–149. [CrossRef]38. Nicolau, J.L.; Más, F.J. The influence of distance and prices on the choice of tourist destinations: The
moderating role of motivations. Tour. Manag. 2006, 27, 982–996. [CrossRef]39. Seddighi, H.R.; Theocharous, A.L. A model of tourism destination choice: A theoretical and empirical
analysis. Tour. Manag. 2002, 23, 475–487. [CrossRef]40. Böhler, S.; Grischkat, S.; Haustein, S.; Hunecke, M. Encouraging environmentally sustainable holiday travel.
Transp. Res. 2006, 40, 652–670. [CrossRef]41. Dubois, G.; Peeters, P.; Ceron, J.-P.; Gössling, S. The future tourism mobility of the world population:
Emission growth versus climate policy. Transp. Res. 2011, 45, 1031–1042. [CrossRef]42. Le-Klähn, D.T.; Roosen, J.; Gerike, R.; Hall, C.M. Factors affecting tourists’ public transport use and areas
visited at destinations. Tour. Geogr. 2015, 17, 738–757. [CrossRef]43. Le-Klähn, D.T.; Hall, C.M. Tourist use of public transport at destinations—A review. Curr. Issues Tour. 2013,
18, 785–803. [CrossRef]44. Dickinson, J.E.; Robbins, D. Representations of tourism transport problems in a rural destination. Tour.
Manag. 2008, 29, 1110–1121. [CrossRef]45. McKercher, B.; Lau, G. Movement Patterns of Tourists within a Destination. Tour. Geogr. 2008, 10, 355–374.
[CrossRef]46. Zoltan, J.; McKercher, B. Analysing intra-destination movements and activity participation of tourists through
destination card consumption. Tour. Geogr. 2014, 17, 19–35. [CrossRef]47. Orsi, F.; Geneletti, D. Assessing the effects of access policies on travel mode choices in an Alpine tourist
destination. J. Transp. Geogr. 2015, 39, 21–35. [CrossRef]48. Prillwitz, J.; Barr, S. Moving towards sustainability? Mobility styles, attitudes and individual travel behaviour.
J. Transp. Geogr. 2011, 19, 1590–1600. [CrossRef]49. Friedl, C.; Schmied, M.; Götz, K. Traumziel Nachhaltigkeit. Innovative Vermarktungs-konzepte Nachhaltiger
Tourismusangebote für den Massenmarkt. INVENT Tourismus. (Innovative Sustainable Mass Tourism Marketing);ISOE Institut für sozial-ökologische Forschung Gmb: Berlin, Germany, 2005.
50. Götz, K.; Loose, W.; Schmied, M.; Schubert, S. Mobility styles in leisure time. In Proceedings of the 10thInternational Conference on Travel Behaviour Research, Moving through Nets: The Physical and SocialDimensions of Travel, Lucerne, Switzerland, 10–15 August 2003.
51. Schubert, S. Mobility-styles in leisure-time. A lifestyle approach for a better under-standing and shaping ofleisure mobility. In Proceedings of the Est!-Workshop: Leisure Travel, Tourism Travel and the Environment,Berlin, Germany, 4–5 November 2004.
52. Fehringer, A.; Bayer, J. A Characterization of Alpine Summer Sport Tourists: The Case of Tyrol, Austria. InProceedings of the La montagne, territoire d’innovation, Grenoble, France, 12 January 2017.
53. Pröbstl-Haider, U.; Lund-Durlacher, D.; Antonschmidt, H.; Hödl, C. Mountain bike tourism in Austria andthe Alpine region – towards a sustainable model for multi-stakeholder product development. J. Sustain. Tour.2017, 26, 567–582. [CrossRef]
54. Smith, M.; Puczkó, L. More than a special interest: Defining and determining the demand for health tourism.Tour. Recreat. Res. 2015, 40, 205–219. [CrossRef]
55. Schalber, C.; Peters, M. Determinants of health tourism competitiveness: An Alpine case study. TurizamMeđunarodni znanstveno-strucni casopis 2012, 60, 307–323.
Sustainability 2019, 11, 2633 15 of 15
56. Chen, C.C.; Petrick, J.F. Health and Wellness Benefits of Travel Experiences. J. Travel Res. 2013, 52, 709–719.[CrossRef]
57. Blank, C.; Gatterer, K.; Leichtfried, V.; Pollhammer, D.; Mair-Raggautz, M.; Duschek, S.; Humpeler, E.;Schobersberger, W. AMAS III – Auswirkungen von alpinen, gesundheitsorientierten Kurzurlauben aufdie psychophysiologische Regeneration. In Proceedings of the Name of the Seventh Sportmanagement &-economics Symposium, Innsbruck, Austria, 16 March 2017; pp. 17–19.
58. De Bloom, J.; Geurts, S.A.E.; Taris, T.W.; Sonnentag, S.; de Weerth, C.; Kompier, M.A.J. Effects of vacationfrom work on health and well-being: Lots of fun, quickly gone. Work Stress 2010, 24, 196–216. [CrossRef]
59. Cohen, S.A.; Gössling, S. A darker side of hypermobility. Environ. Plan. A 2015, 47, 1661–1679. [CrossRef]60. Higham, J.; Cohen, S.A.; Cavaliere, C.T.; Reis, A.; Finkler, W. Climate change, tourist air travel and radical
emissions reduction. J. Clean. Prod. 2016, 111, 336–347. [CrossRef]61. Schlemmer, P.; Barth, M.; Schnitzer, M. Comparing motivational patterns of e-mountain bike and common
bike tourists. Curr. Issues Tour. 2019. [CrossRef]62. Patton, M.Q. Qualitative Research and Evaluation Methods; SAGE Publications, Inc.: Thousand Oaks, CA, USA,
2012.63. Mayring, P.; Fenzl, T. Qualitative Inhaltsanalyse. In Handbook of Methods of Empirical Social Research; Baur, N.,
Blasius, J., Eds.; Springer: Wiesbaden, Germany, 2014; pp. 543–556.64. Godin, G.; Shephard, R.J. Godin leisure-time exercise questionnaire. Med. Sci. Sports Exerc. 1997, 26, 36–38.65. Broadstock, D.; Collins, A. The demand for ‘active travel’: An unobserved components approach. J. Transp.
Health 2016, 3, 326–335. [CrossRef]66. Fyhri, A.; Heinen, E.; Fearnley, N.; Sundfør, H. A push to cycling—Exploring the e-bike’s role in overcoming
barriers to bicycle use with a survey and an intervention study. Int. J. Sustain. Transp. 2017, 11, 681–695.[CrossRef]
67. Burbidge, S.; Goulias, K. Active travel behavior. Transp. Lett. 2009, 1, 147–167. [CrossRef]68. Götschi, T.; Tainio, M.; Maizlish, N.; Schwanen, T.; Goodman, A.; Woodcock, J. Contrasts in Active Transport
Behaviour across Four Countries: How Do They Translate into Public Health Benefits? Prev. Med. 2015, 74,42–48. [CrossRef] [PubMed]
69. Chapman, R.; Keall, M.; Howden-Chapman, P.; Grams, M.; Witten, K.; Randal, E.; Woodward, A. A CostBenefit Analysis of an Active Travel Intervention with Health and Carbon Emission Reduction Benefits. Int.J. Environ. Res. Public Health 2018, 15, 962. [CrossRef]
70. Gatersleben, B.; Murtagh, N.; White, E. Hoody, Goody or Buddy? How Travel Mode Affects Social Perceptionsin Urban Neighbourhoods. Transp. Res. Part. F Traffic Psychol. Behav. 2013, 21, 219–230. [CrossRef]
71. De Bloom, J.; Geurts, S.; Sonnentag, S.; Taris, T.; De Weerth, C.; Kompier, M. How does a vacation from workaffect employee health and well-being? Psychol. Health 2011, 26, 1606–1622. [CrossRef]
72. De Bloom, J.; Guerts, S.; Kompier, M. Vacation (after-) effects on employee health and well-being, and therole of vacation activities, experiences and sleep. J. Happiness Stud. 2013, 14, 613–633. [CrossRef]
73. Handy, S.L.; Clifton, K.J. Evaluating Neighborhood Accessibility: Possibilities and Practicalities. J. Trans.Stat. 2001, 4, 67–78.
74. Saelens, B.E.; Sallis, J.F.; Frank, L.D. Environmental correlates of walking and cycling: Findings from thetransportation, urban design, and planning literatures. Ann. Behav. Med. 2003, 25, 80–91. [CrossRef]
75. Handy, S. Critical Assessment of the Literature on the Relationships Among Transportation, Land- Use, and PhysicalActivity; Transportation Research Board and the Institute of Medicine Committee on Physical Activity, Health,Transportation, and Land Use: Washington, DC, USA, 2005.
76. Lo, A.W.T.; Houston, D. How do compact, accessible, and walkable communities promote gender equality inspatial behaviour? J. Transp. Geogr. 2018, 68, 42–54. [CrossRef]
77. Ruseski, J.; Humphreys, B.; Hallman, K.; Wicker, P.; Breuer, C. Sport Participation and Subjective Well-Being:Instrumental Variable Results from German Survey Data. J. Phys. Act. Health 2014, 11, 396–403. [CrossRef]
© 2019 by the authors. Licensee MDPI, Basel, Switzerland. This article is an open accessarticle distributed under the terms and conditions of the Creative Commons Attribution(CC BY) license (http://creativecommons.org/licenses/by/4.0/).