does tax competition for capital define entrepreneurship …
TRANSCRIPT

On-line Journal Modelling the New Europe
Issue no. 27/2018
34
DOES TAX COMPETITION FOR CAPITAL DEFINE
ENTREPRENEURSHIP TRENDS IN EASTERN EUROPE?
Assoc. Prof. Dr. Yuriy Bilan
Faculty of Management and Economics, Tomas Bata University in Zlin, Czech Republic
Prof. Dr. Serhiy Lyeonov
Economic Cybernetic Department, Sumy State University, Ukraine
Dr. Tetiana Vasylieva
Director of Oleg Balatskyi Academic and Research Institute of Finance, Economics and
Management, Sumy State University, Ukraine
Senior Lecturer Dr. Yaryna Samusevych
Accounting and Taxation Department, Sumy State University, Ukraine
DOI:10.24193/OJMNE.2018.27.02
Abstract
The article deals with the analysis of relationships between tax competition and entrepreneurship development
in Eastern European and Baltic countries during 2006-2017. Incomplete nature of tax systems reforming in
these countries forms preconditions for their participation in cross-country tax competition in investment flows
reallocation. The main instrument of the tax competition includes tax rates, which are defined by convergence
tendencies in the studied countries. Other factors of the research are tax burden levels on the enterprise, tax
administration indices and macroeconomic indicators. The entrepreneurship development at the country’s level
is characterized by a number of new businesses, the duration of their life cycle and their liquidation indices. The

On-line Journal Modelling the New Europe
Issue no. 27/2018
35
calculations results show that higher levels of absolute tax rates for enterprises lead to the reduction of their
creation volumes in the country’s economy. High level of the tax burden partially restrains entrepreneurial
activity. Tax administration plays a significant role in the provision of the country’s tax competition. Time to
pay taxes and the number of tax payments have a great impact on entrepreneurship development at different
stages. The hypothesis is proved that tax factors impact on the entrepreneurial activity is reasonable to be
observed within the context of the country’s macroeconomic conditions.
Keywords: tax competition, entrepreneurship tendencies, tax rates, new businesses, tax administration.
1. Introduction
The economic globalization, innovative technologies development and lack of
availability of resources cause the evolution of the economic competition theory from the
level of the competition for production prime factors (land, labour, capital) to the stage where
secondary sources of national economy income (tax revenues bases) are redistributed. It is
shown in the development of tax competition phenomenon, mainly oriented to simplification
of legislative terms to run business, and to a lesser extent, to the reduction of population
taxation, in order to attract foreign sources of tax revenues. The world countries’
governments continue to create various incentives to increase entrepreneurial activity to
provide long-term economic growth (Khan, 2018). Either they focus on the human side of
entrepreneurship, and create a suitable educational background (Lazányi, 2014; Bilan, 2014),
or they concentrate on the hard facts, and utilize macroeconomic measures. One of the most
flexible instruments of the state influence on the entrepreneurship consists in taxation terms
(Lazányi, 2015). It is defined that tax factors do not only find investing processes
development tendencies (Leonov, Vasylieva аnd Tsyganyuk, 2012) but also form general
impact on the institutional regulation quality of the social sector (Vasilyeva et al. 2018).
The tax competition appears while reforming the tax system in order to attract
taxpayers and investments to create additional working places and to stimulate economic
growth (Field, 2003). On the other hand, Teather (2005) defines tax competition as the use of
low effective tax rates by the country’s government in order to involve investments and
business activity to it. It is specific that tax competition appears when the tax system of one
state formation influences the tax system of another one, usually through the impact on
taxation (Goodspeed, 1998).

On-line Journal Modelling the New Europe
Issue no. 27/2018
36
The tax competition theory begins to actively develop in the second half of the
twentieth century. Its beginning was an investigation of the regional tax competition, carried
out by Tiebout (1956), who found its positive role since the offer of different services to
regional governments leads to redistribution of households within the country due to their
individual preferences.
Further development of this concept was made by Oates and Schwab (1998), who
observed the problem regarding the reduction of the public services supply efficiency by the
government through the attraction of investors via setting costs below the marginal level. The
next stage was the development of the international tax competition theory. Studies of the
foreign capital taxation carried out in the 60s of the twentieth century by Kemp (1961),
MacDougall (1960), enabled to find out about state’s tax system efficiency increase in case of
non-resident capital taxation by the location of the investor as opposed to tax collection on
the principle of the income source. In that period there were first attempts to define an
optimal level of foreign capital income taxation. The regional tax competition theory,
formalized by Zodrow and Mieszkowski (1986), based on Tiebout’s basic model of the tax
competition, enabled to demonstrate the capital mobility impact on tax rates level, which are
set on the capital income, expressed by the inverse dependence.
In 1990s previous studies regarding international tax competition were systematized
into one theory, which continued to develop in several directions: investigation of the public
welfare level change, influenced by competitive factors, relationships between international
tax competition and economic development rates, and national tax systems efficiency.
At the present time tax competition is an important factor to make investment
decisions at the international level, which, taking into account production integration and
mobility factors level increase, determines entrepreneurship activity at the countries’ level
given the difference of national and abroad taxation terms. Scientific researches confirm the
significance of the tax aspects in the process of key performance indicators identification in
the financial projection Balanced Scorecard (Hrytsenko and Vysochyna, 2012) and in the
formation of the enterprise’s value (Boyarko and Samusevych, 2011) which make necessary
conditions for entrepreneurial activity efficiency.
On-line Journal Modelling the New Europe
Issue no. 27/2018
37
Nowadays tax factors are not only components which provide the financial efficiency
of companies, but also define social entrepreneurial development tendencies (CriȘan, Dabija
and Dinu, 2015) and innovative activity of business (Vasylieva and Kasyanenko, 2013).
Given the development of the behavioural economy and business literacy growth at the
modern stage, all entrepreneurial decisions are made with due account for a general list of
benefits and risks in business starting (Prince, 2017) that cause necessity to study economic
and tax factors impact on the entrepreneurial activity.
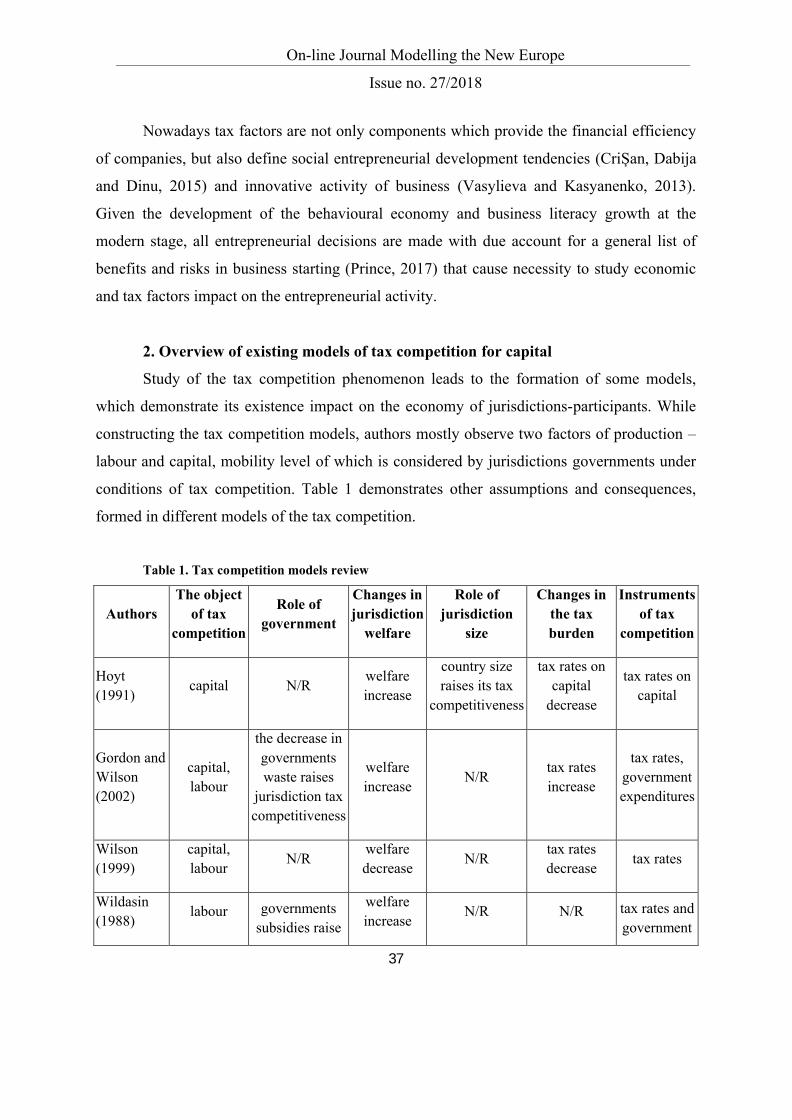
2. Overview of existing models of tax competition for capital
Study of the tax competition phenomenon leads to the formation of some models,
which demonstrate its existence impact on the economy of jurisdictions-participants. While
constructing the tax competition models, authors mostly observe two factors of production –
labour and capital, mobility level of which is considered by jurisdictions governments under
conditions of tax competition. Table 1 demonstrates other assumptions and consequences,
formed in different models of the tax competition.
Table 1. Tax competition models review
AuthorsThe object
of tax competition
Role of government
Changes in jurisdiction
welfare
Role of jurisdiction
size
Changes in the taxburden
Instruments of tax
competition
Hoyt (1991)
capital N/Rwelfare increase
country size raises its tax
competitiveness
tax rates on capital
decrease
tax rates on capital
Gordon and Wilson (2002)
capital, labour
the decrease in governments waste raises
jurisdiction tax competitiveness
welfare increase
N/Rtax rates increase
tax rates, government expenditures
Wilson(1999)
capital, labour
N/Rwelfare decrease
N/Rtax rates decrease
tax rates
Wildasin (1988)
labour governments subsidies raise
welfare increase
N/R N/R tax rates and government

On-line Journal Modelling the New Europe
Issue no. 27/2018
38
jurisdiction tax competitiveness
subsidies
Enss (2008)capital, labour
establishment ofoptimal regional
tax rates
welfare decrease
N/R
Shifting
of the taxburden from
capital tolabour
tax rates
Kind, Midelfart-Knarvikand Schjelderup (2000)
capital, labour
governments subsidies for
new tax objects placing
N/R N/R
tax rates increase/
decrease for different countries
tax rates and government
subsidies
Haufler and Wooton (2007)
capital, labour
governments subsidies for companies
welfareincrease/
decrease for different countries
integration effects for small
countries
tax rates decrease
tax rates and government
subsidies
Bucovetsky (1991)
capital N/R N/Rtax rates are
proportional to the country size
tax ratesdifferentiation
tax rates
Razin and Sadka (1989)
capital, labour
N/R N/R N/R
shifting of the tax burden
from capitalto labour
tax rates and taxation
principles
Janeba (2001)
capital N/R N/R
country size and development raise its tax
competitiveness
tax rates decrease in
less developed countries
tax regimes and
subsidies
Fernandez(2016)
labour N/R
imbalances in public
goods provision
N/Rtax rates decrease
tax rates,public goods
Bettendorf and
capital, N/R N/R small countriesare more
tax rates corporate tax

On-line Journal Modelling the New Europe
Issue no. 27/2018
39
Vrijburg(2010)
labour sensitive to tax policy of
competitors
decrease rates
Huizinda and Nielsen (1997)
capital, labour
N/R N/R N/R
Shifting
of the taxburden from
capital tolabour
tax rates
Note: N/R – not researched by authors
Source: own compilation
Hoyt’s (1991) model focuses on the absolutely mobile capital. Assumptions of the
model provide functioning of the limited number of countries in the global economy, the size
of which enables to influence the international level of net profit on the capital. Every country
sets tax rates, based on the assumption regarding tax rates stability in other countries.
Bucovetsky model (1991) takes into account the country’s size and provides the fact
that global economy is created by two types of the countries – small with an insufficient
number of population and large, where population-level lets to influence the international
norm of net profit on the capital. Other terms of countries’ economies functioning are
identical.
The tax competition model, proposed by Razin and Sadka (1989), provides
functioning of two small countries, which influence the international return on capital. As a
result of the tax competition, there is a symmetric balance, in which zero tax rate on
reputation is acting. The capital taxation is performed according to resident principle,
moreover, if there is no cooperation between countries, the tax burden will be laid from
mobile factors of the capital on the immobile ones.
One should pay attention also to the Janeba’s model (2001), which deals with states’
competition for direct foreign investments location taking into account political stability
factor, which has a great impact on investor’s decision.
Results of the modified model's analysis enable to define positive and negative
consequences of the tax competition impact on the economies functioning of countries-

On-line Journal Modelling the New Europe
Issue no. 27/2018
40
participants. On the other hand, the competitive nature of relationships leads to the
improvement of welfare in small countries with a negative effect on big states. At the same
time, the effect of tax competition investing has a critical point, in which its impact direction
is changed. Positive impact on citizens’ welfare after tax burden reduction happens when tax
revenues enable the government to finance the production of public goods to satisfy
inhabitants’ needs since the further decrease of tax rates («race to the bottom» effect) causes
lack of governments’ financial resources to provide realization of its social and economic
functions. However, the competitive character of relationships improves the welfare of small
countries but has a negative effect on big states.
One can also point out that result depends on the level of tax competition terms
stiffness. If there are not many participants and great volumes of the object, for which
competition is held, tax competition will usually lead to the increase of fiscal policy
efficiency, the establishment of optimal tax rates and an increase of public goods production
quality, which together provide the welfare improvement. However, when tax competition
terms are exaggerated, governments of jurisdiction decrease tax burden greatly. It leads to the
lack of financing of the state’s activity or tax burden is laid from some economic actors on
others. Modern models of the tax competition confirm effects of profit shifting for
multinational corporations when countries compete not for an actual location of the firm, but
for the income declaration (Mukherjee, 2018).
Besides, one should mention that the result, which country’s government desires to
achieve, does not always depend only on the taxation terms, because other factors (economy
development level, political stability etc.) influence the jurisdiction attraction for taxation
base location on its territory. That is why, investigation of tendencies and consequences of
tax competition have to consider not only the tax but also general economic aspects, and
differences in sizes and level of countries’ development.
3. National tax systems development in the conditions of tax competition
In the context of the study, it is reasonable to describe some types of taxes and
charges from the viewpoint of their impact on tax competition objects moving between
jurisdictions. The results of the research regarding taxes impact on taxpayers’ mobility,

On-line Journal Modelling the New Europe
Issue no. 27/2018
41
carried out by Blöchliger and Pinero-Campos (2011), enable to define that taxes on capital
and on corporations incomes – level of this taxes group influences the company’s and returns
to capital, stimulate shifting in jurisdiction, where profit is taxed to a lesser extent. Under
conditions of the tax competition, this factor is observed as one of the reasons regarding the
great decrease of the corporate tax standard rates on profit nation-wide, and to a lesser extent,
the effective average tax rate over the last 20 years. At the same time, an extension of the tax
base greatly compensates the tax rate reduction. In this context, one should mention, that
corporate tax base mobility is different for various firms. Most business-activity depends on
other factors at the local markets that is why such firms are not interested to be shifted
between jurisdiction borders only from the viewpoint of tax considerations. Besides, many
firms possess physical assets, which are hardly moved. It causes the fact that tax policy is
developed setting higher tax rates in countries/regions, which characterized by a larger share
of real estate companies, than in jurisdictions with high mobility of corporate tax bases.
Goods and service taxes group (consumption tax) is less significant, since there are
local consumption taxes only in some countries, and harmonization of this taxes group in the
international tax environment is very high. On the other hand, indirect taxes, set due to the
origin principle (paid in jurisdiction, where goods are produced), define the result of tax
competition to a greater extent, than consumption taxes, set due to the establishing principle
(taxes are paid in jurisdiction, where goods are consumed), since firms are more mobile than
consumers.
Taking into account the above, corporate income taxes, indirect taxes and social fees,
paid directly by the employer, are chosen for the research. These types of taxes enable to
evaluate the general level of direct and indirect tax burden on the company, which defines its
investment decisions. In particular, on the example of Visegrad countries, scientists confirm
the inverse relationship of corporate income tax rate та FDI inflows (Bobenič Hintošová et
al., 2018), which play a significant role for entrepreneurship increase in the country.
Analyzing features of the tax competition impact on the tax systems development, one
can confirm the fact that its existence result is not only differentiation of taxation terms, but
also tax systems convergence level increase caused by objective limitations regarding tax
competitive benefits (necessity to provide sufficient tax revenues to realize social and

On-line Journal Modelling the New Europe
Issue no. 27/2018
42
economic functions of the state) and general vector of tax systems development in conditions
of tax competitive relationships regarding tax burden decrease and taxation process
simplification.
Nowadays there is a number of scientific studies, oriented to evaluate convergence
processes in the international tax environment. In particular, one should point out
investigations of the tax convergence in the European Union countries, carried out by
Delgado (2013) during 1965-2010, which considers the calculation of the fiscal distance
between indices of the country and average level for EU-15 by indicators of general tax
burden and burden by the certain taxes groups. The results of calculations confirm the general
convergence of tax burden in the European Union.
The σ-convergence use as an indicator of tax systems convergence is based on the
variables dispersion indices, which describe the taxation system – a decrease of evaluated
indicators dispersion level proves the existence of the convergent processes. The variation
indices, Gini coefficient, Theil indices, regional asymmetry index, the Atkinson index are
used while evaluating this parameter in the scientific literature. Therefore the optimal and
most convenient index in use is coefficient of variation, because, firstly, it does not depend on
the scale and dimension of variables, secondly, it is possible to interpret the obtained results
either by absolute index or by its dynamics.
Base to carry out research of entrepreneurship tendencies under conditions of the tax
competition are chosen Eastern European countries (Bulgaria, Czech Republic, Hungary,
Moldova, Poland, Romania, Slovak Republic, Ukraine), and the Baltic countries (Estonia,
Latvia, Lithuania). Tax systems of the mentioned countries are being constantly improved
and are characterized by more dynamic rates of changes than tax systems of the developed
EU Member States, which prove their efficiency in accordance with a general vector of these
countries’ economic policy. At the same time, the above countries are donors of the labour
power for Western European countries owing to the high level of the domestic
unemployment (Kleinschmidt, 2017), that also confirms the urgency to orient state regulation
instruments to entrepreneurship development. That is why, one can provide great effects of
the tax competition for the formed list of countries, taking into consideration the
incompleteness of the capital redistribution processes at Europe’s level, and insufficient

On-line Journal Modelling the New Europe
Issue no. 27/2018
43
coordination of the economic policy at the modern stage (Lyeonov, Vasylieva and Lyulyov,
2018). It confirms thesis regarding the establishment of the economies’ regulation conception
in the mentioned countries. Besides, previous calculations show that these countries are the
main tax competitors among European countries (Boiko and Samusevych, 2017).
Thus, in order to characterize development tendencies of tax systems in the chosen
countries in the context of their impact on entrepreneurship development, we will analyze
statistic information regarding three types of taxes. Table 2 demonstrates the results of
convergent processes evaluation and pairwise annual comparison of corporate tax rates
variation.
Table 2. Descriptive statistics of corporate tax rates changes in Eastern European and Baltic
countries
Convergence Pairwise comparisons of means with equal variances
Year mean coefficient of variation contrast year
2003 21.773 0.383 - -
2004 18.864 0.393 -2.909 2004 vs 2003
2005 17.273 0.392 2.687 2005 vs 2003
2006 17.000 0.380 -4.500 2006 vs 2003
2007 16.455 0.406 -4.772 2007 vs 2003
2008 16.091 0.394 -5.318 2008 vs 2003
2009 16.455 0.387 -5.681 2009 vs 2003
2010 16.182 0.389 -5.318 2010 vs 2003
2011 16.182 0.389 -5.590 2011 vs 2003
2012 15.818 0.371 -5.590 2012 vs 2003
2013 16.000 0.379 -5.954 2013 vs 2003
2014 15.818 0.374 -5.772 2014 vs 2003
2015 16.818 0.204 -5.954 2015 vs 2003

On-line Journal Modelling the New Europe
Issue no. 27/2018
44
2016 16.818 0.204 -4.954 2016 vs 2003
2017 15.818 0.245 -4.954 2017 vs 2003
2018 16.273 0.249 -5.954 2018 vs 2003
Source: own calculations based on https://home.kpmg.com/xx/en/home/services/tax/tax-tools-and-
resources/tax-rates-online/corporate-tax-rates-table.html [Accessed 04/07/2018]
Let us point out that at the beginning of the analyzed period the coefficient of
variation was higher than 0.33, that shows the non-homogeneity of selection. However, in
general, the corporate income tax rates are characterized by great convergence during the
studied period and as of 2018 variation reach the level 0.249 that proves an essential
convergence of tax systems. At the same time, maximum close rates of the corporate tax in
the studied countries acted during 2015-2016. On the other hand, calculated average values
on selection and their comparison result over years prove the fact that the gradual decrease of
the corporate income tax rates is peculiar for the chosen countries. Such tendency may create
essential motivation to increase the entrepreneurial activity in countries thanks to national and
foreign investors.
Calculations regarding tendencies of indirect taxes change and their level in relation to
different countries confirm the thesis about the maximum degree of the proper taxes
harmonization (see Table 3). At the beginning of the research period, tax systems of the
evaluated countries were characterized by a high degree of the convergence – the coefficient
of variation is less than 0.33. At the end of the research, the variation level was reduced
greatly, and indirect income tax rates were more uniform as of 2009.
Table 3. Descriptive statistics of indirect tax rates changes in Eastern European and Baltic
countries
Convergence Pairwise comparisons of means with equal variances
Year mean coefficient of variation contrast year
2005 19.800 0.105 - -
2006 19.300 0.062 -0.500 2006 vs 2005

On-line Journal Modelling the New Europe
Issue no. 27/2018
45
2007 19.300 0.062 -0.500 2007 vs 2005
2008 19.300 0.062 -0.500 2008 vs 2005
2009 19.700 0.056 -0.100 2009 vs 2005
2010 21.200 0.086 1.400 2010 vs 2005
2011 21.500 0.084 1.700 2011 vs 2005
2012 21.600 0.104 1.800 2012 vs 2005
2013 21.700 0.101 1.900 2013 vs 2005
2014 21.700 0.101 1.900 2014 vs 2005
2015 21.700 0.101 1.900 2015 vs 2005
2016 21.300 0.099 1.500 2016 vs 2005
2017 21.200 0.103 1.400 2017 vs 2005
2018 21.200 0.103 1.400 2018 vs 2005
Source: own calculations based on https://home.kpmg.com/xx/en/home/services/tax/tax-tools-and-
resources/tax-rates-online/indirect-tax-rates-table.html [Accessed 04/07/2018]
The average level of this tax in terms of the period is between 19.3% and 21.7%.
Therefore, from 2005 till 2009 tax rate decrease is peculiar in general in the countries.
Beginning from 2010 they are constantly growing. However, let us point out that the role of
this tax to provide achievements of tax competition has secondary nature. Therefore, changes
in the level of indirect taxation define reasonability to consider this type of the tax while
modelling the entrepreneurship development.
Another type of taxes, which greatly influence the corporate tax burden level, includes
social security taxes, paid by employers. Table 4 shows that, unlike other taxes, during the
studied period, employer social security tax rates were characterized by divergent processes.
In 2009 the coefficient of variation was 0.117. In 2018 it grew three times.

On-line Journal Modelling the New Europe
Issue no. 27/2018
46
Table 4. Descriptive statistics of employer social security tax rates changes in Eastern European
and Baltic countries
Convergence Pairwise comparisons of means with equal variances
Year mean coefficient of variation contrast year
2009 32.491 0.117 - -
2010 28.498 0.221 -3.993 2010 vs 2009
2011 27.820 0.229 -4.671 2011 vs 2009
2012 30.010 0.294 -2.481 2012 vs 2009
2013 30.390 0.280 -2.101 2013 vs 2009
2014 30.045 0.271 -2.445 2014 vs 2009
2015 29.551 0.283 -2.940 2015 vs 2009
2016 27.021 0.209 -5.470 2016 vs 2009
2017 26.699 0.209 -5.792 2017 vs 2009
2018 24.640 0.367 -7.851 2018 vs 2009
Source: own calculations based on https://home.kpmg.com/xx/en/home/services/tax/tax-tools-and-
resources/tax-rates-online/social-security-employer-tax-rates-table.html [Accessed 04/07/2018]
However, it is interesting to observe tendencies to changes of the general level of the
given tax rates. During the investigated period its average level decreased from 32.491% to
24.640%, therefore, reduction tendency was peculiar for the whole period of analysis. Thus,
this tax at the formed selection of countries has great potential as an instrument of the tax
competition.
Besides, variables of the research, which show the tax competition, include effective
rates by separate taxes groups (see Table 5). Taxes for enterprise’s profit, general sum of
taxes on labour, and all other taxes, paid from business, have been separately selected for the
research. Thus, these three indices demonstrate total tax burden on business considering all
existed discounts in the country. On the other hand, one of the aspects regarding the country’s
tax system functioning, which defines its tax competitiveness, is also tax administration

On-line Journal Modelling the New Europe
Issue no. 27/2018
47
quality (Samusevych, 2014). So, a group of independent variables include also some
indicators, which show the complexity of the tax administration in the country (Tax time, Tax
payments).
Vasylieva at al. (2018b) confirm that the result of tax competition impact on the
economic processes development in the country depends not only on taxation terms but also
on peculiarities of social and economic development. That is why, control variables, which
show the level of economic development (GDP growth, GDP per capita growth, GDP per
capita), economic stability (Inflation) and formed a level of foreign investors’ trust to the
country (FDI) are selected for the research.
Table 5. Independent variables of research
Variable name
Variable description Source
Corporate tax basic corporate tax rate (reduced rates are not included)
KPMG (2018)
Indirect tax the standard rate of value added tax KPMG (2018)
Employer tax highest employer social security rates KPMG (2018)
Profit tax amount of taxes on profits paid by the business – the percentage of commercial profit
World Bank (2018)
Labour tax amount of labour tax and contributions paid by the business – the percentage of commercial profit
World Bank (2018)
Other taxes other taxes payable by businesses (include the amounts paid for property taxes, turnover taxes, and other small taxes such as municipal fees and vehicle and fuel taxes) – the percentage of commercial profit
World Bank (2018)
Tax time time to prepare and pay taxes is the time, in hours per year, it takes to prepare, file, and pay (or withhold) three major types of taxes: the corporate income tax, the value added or sales tax, and labour taxes, including payroll taxes and social security contributions.
World Bank (2018)

On-line Journal Modelling the New Europe
Issue no. 27/2018
48
Tax payments tax payments by businesses are the total number of taxes paid by businesses, including electronic filing. The tax is counted as paid once a year even if payments are more frequent
World Bank (2018)
Business cost the cost to start a business – the percentage of income per capita
World Bank (2018)
Property registration
procedures required to register property – number World Bank (2018)
Inflation inflation, as measured by the annual growth rate of the GDP implicit deflator, shows the rate of price change in the economy as a whole
World Bank (2018)
GDP growth annual percentage growth rate of GDP at market prices based on constant local currency. Aggregates are based on constant 2010 U.S. dollars
World Bank (2018)
GDP per capita growth
annual percentage growth rate of GDP per capita based on constant local currency. Aggregates are based on constant 2010 U.S. dollars
World Bank (2018)
GDP per capita
gross domestic product divided by midyear population in constant 2010 U.S. dollars.
World Bank (2018)
FDI net inflows (new investment inflows less disinvestment) in the reporting economy from foreign investors, and is divided by GDP
World Bank (2018)
Kozubíková et al. (2015) confirm that SMEs enterprises define Market risk as the
most important group of business risk in running the business. On the other hand, sufficient
financial resources to run a business lead to its further activity efficiency (Belás et al., 2018).
That is why, while evaluating tax factors to start a business by control variables, the model
will also include indicators of complexity and of business creation value at the level of a
certain country (Business cost, Property registration).

On-line Journal Modelling the New Europe
Issue no. 27/2018
49
4. The relationship between tax competition and entrepreneurship trends
The main indicators of entrepreneurship in the country include absolute indices of
business creation, the average duration of its life cycle and business liquidation indices.
Pomianek (2018) defines that at the modern stage of developing, small and medium-sized
enterprises make the main business form, which is being started in the world. Table 6
demonstrates the main indicators of entrepreneurship, implemented in the research as
dependent variables.
Table 6. Dependent variables of entrepreneurship
Variable name Variable description Source
New business number of new limited liability corporations registered in the calendar year
World Bank (2018)
New business density
number of new limited liability corporations registered in the calendar year per 1,000 people ages 15-64
World Bank (2018)
Enterprise birth rate
the number of enterprise births in the reference period (t) divided by the number of enterprises active in t – percentage
Eurostat (2018)
Business growth
net business population growth – percentage Eurostat (2018)
Enterprise survival 3 rate
number of enterprises in the reference period (t) newly born in t-3 having survived to t divided by the number of enterprise births in t-3 – percentage
Eurostat (2018)
Enterprise survival 5 rate
number of enterprises in the reference period (t) newly born in t-5 having survived to t divided by the number of enterprise births in t-5 – percentage
Eurostat (2018)
Enterprise death rate
number of enterprise deaths in the reference period (t) divided by the number of enterprises active in t – percentage
Eurostat (2018)
Analyzing the generalized tendencies of entrepreneurship development in the Eastern
European and Baltic countries (Table 7), one can point out the essential level of their
variation between countries and in terms of periods, evidenced by standard deviation and
min-max comparison.
On-line Journal Modelling the New Europe
Issue no. 27/2018
50
Table 7. Summarize statistics of entrepreneurship variables
Variable name Obs Mean Std. Dev. Min Max
New business 119 25242.5 19950.59 4129 102745
New business density 119 5.12646 4.382683 0.466435 20.76074
Enterprise birth rate 80 13.19925 4.109485 3.81 24.88
Business growth 71 2.932817 6.43885 -13.64 35.47
Enterprise survival 3 rate 80 54.47538 10.05047 23.23 90.55
Enterprise survival 5 rate 71 40.80437 8.335042 17.91 70.13
Enterprise death rate 79 11.47177 3.818447 5.77 29.05
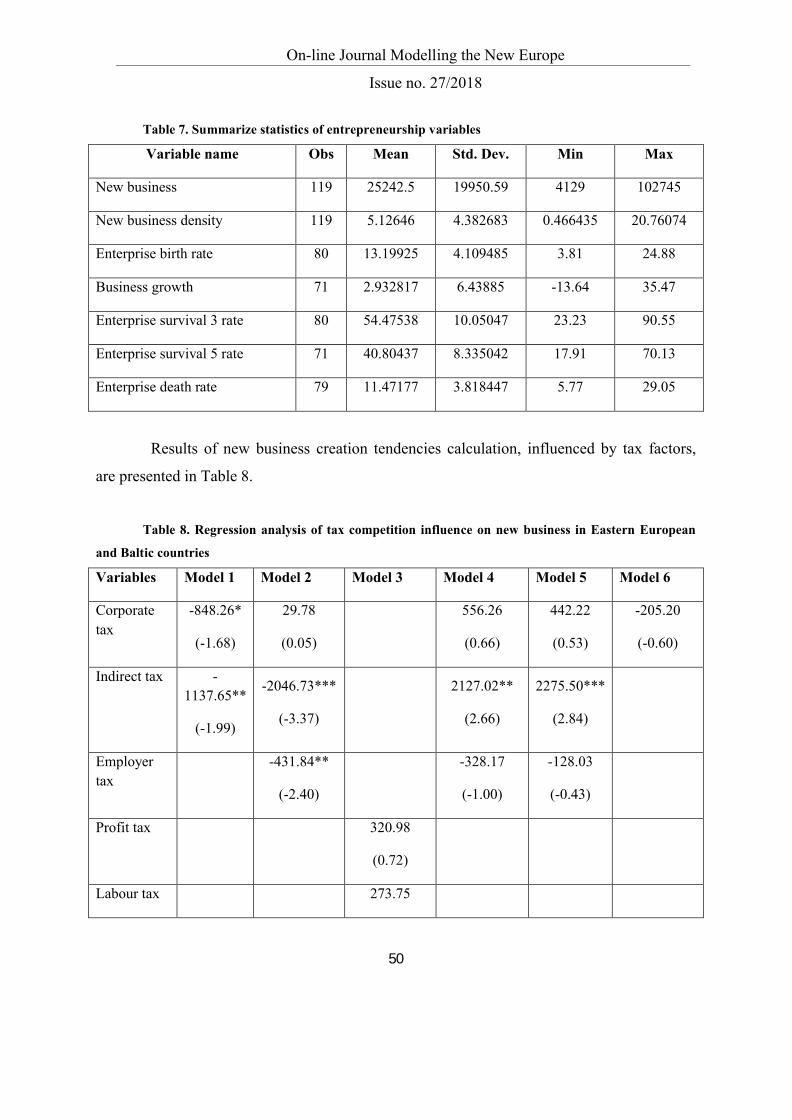
Results of new business creation tendencies calculation, influenced by tax factors,
are presented in Table 8.
Table 8. Regression analysis of tax competition influence on new business in Eastern European
and Baltic countries
Variables Model 1 Model 2 Model 3 Model 4 Model 5 Model 6
Corporate tax
-848.26*
(-1.68)
29.78
(0.05)
556.26
(0.66)
442.22
(0.53)
-205.20
(-0.60)
Indirect tax -1137.65**
(-1.99)
-2046.73***
(-3.37)
2127.02**
(2.66)
2275.50***
(2.84)
Employer tax
-431.84**
(-2.40)
-328.17
(-1.00)
-128.03
(-0.43)
Profit tax 320.98
(0.72)
Labour tax 273.75

On-line Journal Modelling the New Europe
Issue no. 27/2018
51
(0.62)
Other taxes -2.39
(-0.48)
-15.87
(-0.70)
-18.82
(-0.83)
Tax time 69.98*
(1.75)
238.27***
(3.38)
221.88***
(3.16)
Tax payments
-2652.99***
(-4.02)
-1160.31***
(-2.83)
-576.09
(-1.00)
-559.26
(-0.97)
-1040.39***
(-3.05)
Business cost
5870.96***
(4.22)
6565.99***
(5.00)
-429.16
(-0.37)
Inflation 226.52
(1.21)
213.22
(1.35)
381.69**
(1.99)
446.09
(1.43)
426.23**
(2.63)
GDP growth
294.35*
(1.77)
GDP percapita growth
320.22**
(2.08)
277.41
(1.49)
86.59
(0.26)
116.52
(0.34)
312.43**
(2.08)
FDI -190.11**
(1.21)
-194.20**
(-2.31)
-25.43
(-0.22)
-201.64
(-1.00)
-199.55
(-0.98)
-20.37
(-0.54)
_cons65569.69*
(4.10)
94636.66***
(5.26)
24583.27***
(4.89)
-44894.12**
(-1.97)
-53278.08**
(-2.40)
34058.51***
(3.70)
Number of observations
108 75 119 75 75 119
F 16.93 42.74 17.57 88.97 85.56 23.07
Prob > F 0.0046 0.0000 0.0247 0.0000 0.0000 0.0008
Note: ***p<0.01; **p<0.05; *p<0.1, z-statistics are in the brackets. Method: GLS random-effects
regression

On-line Journal Modelling the New Europe
Issue no. 27/2018
52
Let us point out that the combination of various factorial features in models leads to
differentiation of the obtained results of qualitative impact. Based on the statistically valuable
dependences, one can mention that corporate tax rate increase on the average by 1%
decreases the number of new businesses by 848.26 units, respectively the growth of employer
tax reduces the number of companies by 431.84. At the same time, the indirect tax impact is
ambiguous, comparing different models. Therefore effective tax rates are not characterized
by statistically relevant results, which is quite predictable, considering the fact that owners
focus on formal taxation terms while creating the enterprise.
The effect of certain tax administration indicators is rather interesting. Despite the
assumptions that tax administration complexity destimulates business development, tax time
indicator has a stable positive relation with the resulting variable, confirmed by different
models. On the other hand, the increase of tax payments number, paid by business, leads to
the essential reduction of entrepreneurial initiatives.
Among control variables, one can point out the expected positive impact of such
parameters as GDP growth and GDP per capita growth on business creation, which proves
the important role of economic development level to provide the entrepreneurial activity. One
should take into account the positive relation of inflation and new businesses creation, which
demonstrates the positive impact of creeping inflation on economic development.
The business cost has a positive impact on business creation, that however, can be the
result of different countries’ economies comparative characterization – the analogical
procedures cost in more developed countries exceeds indices of the less developed countries.
FDI growth also limits the creation of new businesses, caused by growing competition
of the companies thanks to the foreign capital inflow, which leads to the increase of the
income market barriers.
One should take into account the results, obtained for a relative index of new business
creation – new business density (Table 9).
According to the table data we can point out that among indicators of the tax burden,
there is a statistically relevant impact for indirect tax and other taxes. Therefore, the indirect
tax rates increase reduces new businesses indices, whereas other taxes are their stimulators
according to the results of calculations.

On-line Journal Modelling the New Europe
Issue no. 27/2018
53
There is a small positive impact for tax payments among tax administration
parameters, and there is also the limiting effect of the tax time. One should mention the great
limiting role of complexity indices and business creation cost regarding new business density,
confirmed by calculations.
Table 9. Regression analysis of tax competition influence on new business density in Eastern
European and Baltic countries
Variables Model 1 Model 2 Model 3 Model 4 Model 5 Model 6 Model 7
Corporate tax -0.07
(-0.41)
-0.23
(-1.28)
-0.10
(-0.59)
Indirect tax -0.36**
(-2.16)
-0.53**
(-2.56)
-0.42**
(-2.60)
Employer tax 0.01
(0.22)
-0.01
(-0.22)
0.03
(0.58)
Profit tax -0.03
(-0.34)
-0.02
(-0.27)
-0.03
(-0.30)
Labor tax 0.05
(0.56)
-0.10
(-1.45)
Other taxes 0.15**
(2.17)
0.14**
(2.03)
0.42***
(3.68)
Tax time -0.01***
(-3.16)
-0.01
(-0.87)
-0.00
(-0.14)
0.00
(0.33)
Tax payments
-0.00
(-0.11)
0.00
(0.29)
0.01*
(1.92)
0.00
(0.34)
Business cost -0.28*
(-1.76)
-0.16
(-0.79)
-0.19**
(-2.60)
-0.16**
(-2.54)
-0.17**
(-2.48)
-0.37***
(-4.50)

On-line Journal Modelling the New Europe
Issue no. 27/2018
54
Property registration
-0.37
(-1.14)
-0.04
(-0.09)
-0.61**
(-2.63)
-0.39*
(-1.80)
-0.37*
(-1.68)
-0.47*
(-1.81)
Inflation 0.01
(0.20)
0.00
(0.07)
GDP growth 0.19***
(4.42)
0.19***
(3.08)
0.20***
(4.88)
0.10***
(3.48)
0.10***
(3.38)
GDP per capita growth
0.09***
(3.38)
0.09*
(1.76)
FDI -0.04
(-1.55)
-0.02
(-0.57)
_cons 17.33***
(3.74)
25.08***
(4.57)
17.49***
(3.62)
8.79***
(5.94)
7.79***
(5.40
6.03*
(1.87)
11.92***
(4.06)
Number of observations
75 75 75 119 119 119 119
F 32.06 26.77 31.81 24.21 25.76 25.22 53.95
Prob > F 0.0000 0.0008 0.0001 0.0002 0.0001 0.0003 0.0000
Note: ***p<0.01; **p<0.05; *p<0.1, z-statistics are in the brackets. Method: GLS random-effects
regression
Let us point out that the relative level of new businesses creation greatly depends on
the level of corporate tax and employer tax rates, for which statistically relevant inverse
effect is confirmed (see Table 10). On the other hand, different groups of effective tax rates
are also characterized by the statistically relevant impact on the enterprise birth rate, and their
growth essentially reduces the resulting variable index. Restraining impact on the company’s
creation in certain constructed models is obtained for the tax administration indices.

On-line Journal Modelling the New Europe
Issue no. 27/2018
55
Table 10. Regression analysis of tax competition influence on enterprise birth rate in Eastern
European and Baltic countries
Variables Model 1 Model 2 Model 3 Model 4 Model 5 Model 6 Model 7
Corporate tax -0.48*
(-1.92)
-0.56**
(-2.24)
-0.96***
(-3.14)
-0.91**
(-3.06)
-1.02***
(-4.28)
-0.86***
(-3.96)
Indirect tax 0.18
(0.75)
-0.00
(-0.00)
-0.06
(-0.24)
-0.26
(-1.37)
-0.22
(-1.05)
Employer tax 0.12
(0.74)
0.02
(0.11)
0.10
(0.77)
-0.44***
(-3.09)
-0.34***
(-2.61)
Profit tax -0.53**
(-2.56)
Labour tax -0.58***
(-5.20)
Other taxes -0.26*
(-1.67)
Tax time -0.01
(-0.52)
-0.02***
(-3.18)
-0.00
(-0.85)
Tax payments -0.02***
(-3.19)
-0.03
(-1.24)
0.04*
(1.83)
Business cost -0.07
(-0.33)
0.23
(0.91)
0.05
(0.23)
0.12
(0.61)
0.09
(0.60)
-0.02
(-0.11)
0.07
(0.45)
Property registration
-3.17***
(-5.73)
-2.50***
(-5.82)
-3.09***
(6.05)
Inflation 0.16*
(1.83)
-0.07
(0.28)
-0.21
(-0.96)
-0.22
(-1.06)
-0.24
(-1.43)
0.32**
(2.49)
-0.19
(-1.12)

On-line Journal Modelling the New Europe
Issue no. 27/2018
56
GDP growth 0.14*
(1.78)
0.01
(0.16)
GDP per capita
-0.00
(-0.30)
0.00
(0.74)
-0.00
(-1.06)
FDI 0.00
(0.28)
-0.04
(-0.57)
-0.03
(-0.50)
-0.04
(-0.81)
-0.04
(-1.12)
_cons 22.45***
(4.68)
14.37*
(1.75)
31.88***
(4.32)
32.59***
(4.47)
64.26***
(8.10)
48.84***
(9.05)
59.52***
(7.41)
Number of observations
80 69 69 69 69 80 69
F 9.96 14.18 26.65 26.30 73.02 64.36 66.73
Prob > F 0.0412 0.0480 0.0016 0.0009 0.0000 0.0000 0.0000
Note: ***p<0.01; **p<0.05; *p<0.1, z-statistics are in the brackets. Method: GLS random-effects
regression
The business cost has no statistically relevant impact on the enterprise birth rate, but a
number of property registration procedures decreases the resulting index of the enterprise's
creation.
Despite the relevant results, obtained in general for indices of enterprises creation, let
us point out that for the index business growth there is no stable effect of its dependence on
the relative taxation levels (Table 11).
Table 11. Regression analysis of tax competition influence on business growth in Eastern
European and Baltic countries
Variables Model 1 Model 2 Model 3 Model 4 Model 5 Model 6 Model 7
Corporate tax -0.95
(-1.12)
-1.35
(-1.64)

On-line Journal Modelling the New Europe
Issue no. 27/2018
57
Indirect tax 0.36
(0.46)
0.97
(1.35)
Employer tax 0.31
(0.58)
-0.26
(-0.40)
-0.33
(-0.52)
Profit tax 0.97
(1.06)
0.98
(1.06)
Other taxes 0.07
(0.19)
0.04
(0.11)
Tax time 0.04*
(1.98)
0.03
(1.62)
0.06**
(1.24)
0.06**
(2.73)
0.06**
(2.63)
0.06**
(2.66)
0.03
(1.15)
Tax payments -0.10*
(1.73)
0.06
(1.24)
0.06
(1.24)
0.06
(1.12)
0.06
(1.12)
0.09
(1.46)
Business cost -0.54
(-0.54)
-0.68
(-0.67)
-0.69
(-0.62)
-0.68
(-0.60)
-0.45
(-0.41)
-0.46
(-0.42)
Property registration
1.58
(0.42)
Inflation -0.07
(-0.16)
-0.21
(-0.45)
0.70*
(1.85)
0.69*
(1.77)
0.63
(1.64)
0.64*
(1.71)
0.42
(1.03)
GDP growth 0.61**
(2.71)
0.57**
(2.27)
GDP per capita 0.00**
(2.14)
0.00**
(2.13)
0.00**
(2.00)
0.00**
(2.02)
0.00*
(1.96)
_cons -15.06
(-0.94)
10.87
(0.35)
-47.99**
(-2.45)
-48.55**
(-2.43)
-37.71**
(-2.20)
-37.49**
(-2.22)
-25.17
(-0.72)
Number of 69 69 71 71 71 71 69

On-line Journal Modelling the New Europe
Issue no. 27/2018
58
observations
F 2.82 2.49 2.88 2.43 2.64 3.22 2.15
Prob > F 0.0246 0.0228 0.0163 0.0306 0.0252 0.0125 0.0474
Note: ***p<0.01; **p<0.05; *p<0.1, z-statistics are in the brackets. Method: GLS random-effects
regression
On the other hand, tax administration indices are characterized by the statistically
relevant effect of impact on business growth. The stimulating impact is obtained for tax time,
whereas the restraining effect is demonstrated by tax payments.
Analyzing the calculations data, represented in Table 12, let us point out that tax terms
do not have a great impact on the enterprise survival rates during the first 3 or 5 years from
their formation moment. Therefore statistically relevant effect is not obtained while
evaluating nether tax rates nor tax administration indicators.
Let us note that economic development level is not also characterized by essential
value to provide the enterprise survival rates, at the same time, high level of inflation reduces
enterprise survival rates in 5-years period. On the other hand, tax administration indices are
characterized by the statistically relevant effect of impact on the business growth. A
stimulating effect is obtained for tax time, whereas the restraining effect is demonstrated by
tax payments.
Table 12. Regression analysis of tax competition influence on enterprise survival rates in Eastern
European and Baltic countries
Variables Survival 3 rate Survival 5 rate
Model 1 Model 2 Model 3 Model 4 Model 5 Model 6
Corporate tax 0.04
(0.06)
0.03
(0.05)
Indirect tax 0.20
(0.24)
-0.33
(-0.51)

On-line Journal Modelling the New Europe
Issue no. 27/2018
59
Employer tax 0.11
(0.25)
-0.32
(-0.91)
Profit tax 0.33
(0.52)
0.40
(0.65)
0.46
(0.78)
0.54
(1.01)
Labor tax -0.19
(-0.48)
0.27
(0.88)
Other taxes 0.00
(0.01)
0.29
(0.81)
Tax time 0.00
(0.12)
Tax payments -0.03
(-0.59)-0.04
(-0.88)
Inflation 0.03
(0.05)
0.33
(1.16)
0.35
(1.19))
-0.72*
(0.42)
-0.77**
(-2.04)
-0.61
(-1.46)
GDP growth 0.04
(0.22)
0.03
(0.15)
-0.13
(-0.73)
-0.20
(-0.99)
GDP per capita growth
0.13
(0.49)
-0.13
(-0.57)
_cons 45.67**
(1.99)
56.78***
(3.81)
50.17***
(7.41
57.79***
(3.21)
37.36***
(5.96)
37.11***
(5.84)
Number of observations
69 80 80 69 71 71
F 0.73 2.33 2.55 8.89 9.41 9.41
Prob > F 0.9811 0.6750 0.8623 0.1136 0.0516 0.1517

On-line Journal Modelling the New Europe
Issue no. 27/2018
60
Note: ***p<0.01; **p<0.05; *p<0.1, z-statistics are in the brackets. Method: GLS random-effects
regression
The last indicator, which describes the entrepreneurship development in the studied
countries, is enterprise death rate. The obtained results of the tax and macroeconomic
indicators impact on this index dynamics are demonstrated by the Table 13.
Statistically relevant results among the absolute and relative level of tax burden are
obtained only for corporate tax. The increase of this index by on average 1% reduces the
level of enterprise death rate by 0.35%.
On the other side, indices of the tax administration have more stable effects. As a
result, an increase of tax payments leads to the growth of enterprise death rate level by 0.05-
0.08%. The increase of tax time by 1 hour causes reduction of the enterprise death rate on
average by 0.01%.
Table 13. Regression analysis of tax competition influence on enterprise death rate in Eastern
European and Baltic countries
Variables Model 1 Model 2 Model 3 Model 4 Model 5 Model 6
Corporate tax -0.03
(-0.11)
-0.35**
(-2.25)
0.02
(0.10)
Indirect tax 0.25
(0.90)
0.06
(0.33)
Employer tax 0.11
(0.72)
-0.02
(-0.21)
-0.12
(-0.99)
Profit tax 0.03
(0.13)
0.05
(0.22)
-0.09
(-0.51)
Labor tax -0.06
(-0.57)
Other taxes -0.07 -0.09

On-line Journal Modelling the New Europe
Issue no. 27/2018
61
(-0.45) (-0.63)
Tax time -0.01**
(-2.17)
-0.01
(-1.24)
-0.00
(-1.31)
Tax payments 0.06***
(3.66)
0.08***
(4.10)
0.05**
(2.45)
Inflation 0.40**
(2.20)
0.06
(0.31)
0.19
(1.13)
0.36***
(2.95)
0.35***
(2.91)
0.26**
(2.02)
GDP growth -0.42***
(-4.48)
-0.29***
(-3.05)
GDP per capita growth
-0.29***
(-3.42)
-0.35***
(-4.17)
-0.34***
(-4.13)
-0.29***
(-3.52)
_cons 3.34
(0.44)
17.84***
(3.67)
15.04***
(3.00)
12.98***
(3.31)
11.01***
(4.97)
12.82***
(6.24)
Number of observations
68 68 68 79 79 79
F 24.07 42.73 41.97 19.24 19.91 26.87
Prob > F 0.0002 0.0000 0.0000 0.0007 0.0005 0.0002
Note: ***p<0.01; **p<0.05; *p<0.1, z-statistics are in the brackets. Method: GLS random-effects
regression
In this context, one can note the great role of the economic development indices. The
GDP growth by 1% provides a reduction of enterprise death rate by 0.29-0.42%, and GDP
per capita growth by 1% – reduction by 0.29-0.35% respectively. However, inflation is a
destabilizing factor – the GDP deflator growth by 1% determines the increase of the
enterprise death rate by 0.26-0.40%.
On-line Journal Modelling the New Europe
Issue no. 27/2018
62
5. Conclusions
The analysis of the tax competition neoclassical models shows that nowadays the
countries’ tax policy, oriented to increase their tax competitiveness, is reasonable to be
observed according to the following criteria:
∑ production factors, which make the object of the tax competition;
∑ the role of government in regulation and formation of the tax competition;
∑ the impact of tax competition on the territory welfare;
∑ the impact of territory size on the level of its tax competitiveness;
∑ change of the level and structure the tax burden under conditions of the tax
competition;
∑ instruments of jurisdiction participation in the tax competition.
As it is defined above, the tax competition instruments are tax rates. It is empirically
confirmed, that there are convergent tendencies of the main tax rates, which are paid by
enterprises, for the Eastern European and Baltic countries. At the same time, the important
factor to make decisions by taxpayers to choose countries for resources location, which form
the taxation object, is quality of the tax administration in the country.
According to the results of the evaluation of tax competition instruments impact on
the entrepreneurship development at different stages of the company’s life cycle, the
following results are obtained:
∑ the increase of absolute tax rates in general limits the entrepreneurial activity
at the stage of enterprise creation and does not have a statistically relevant effect regarding
the enterprise survival and their liquidation tendencies;
∑ the relative level of the tax burden is characterized by statistically relevant
impact only on certain indicators of new businesses creation;
∑ indices of the tax administration have a statistically relevant effect on the
entrepreneurial development at its different stages;
∑ macroeconomic conditions play a more significant role at the stages of
company's creation and liquidation without any relevant effect regarding enterprise survival
provision.

On-line Journal Modelling the New Europe
Issue no. 27/2018
63
Acknowledgements
The survey was supported by the Ministry of Education and Science of Ukraine and
performed the results of the project “Modeling and forecasting of the socio-economic-
political road map of reforms in Ukraine for the transition to a sustainable growth model”
(registration number 0118U003569)
References
∑ BELÁS, J., DVORSKÝ, J., KUBÁLEK, J. and SMRČKA, L. (2018). Important factors
of financial risk in the SME segment. Journal of International Studies, 11(1), 80-92.
∑ BETTENDORF, L. and VRIJBURG, H. (2010) Asymmetric Corporate Tax Competition
with Two Tax Instruments. [Online] Available from:
https://www.researchgate.net/publication/228704411_Asymmetric_Corporate_Tax_Com
petition_with_Two_Tax_Instruments [Accessed 10/05/2017].
∑ BLÖCHLIGER, H. and PINERO-CAMPOS, J. (2011) Tax Competition Between Sub-
Central Governments. OECD Network on Fiscal Relations across Levels of Government
Working Paper, 13, 45 р.
∑ BOBENIČ HINTOŠOVÁ, A., BRUOTHOVÁ, M., KUBÍKOVÁ, Z., and RUČINSKÝ R.
(2018) Determinants of foreign direct investment inflows: A case of the Visegrad
countries. Journal of International Studies, 11(2), pp. 222-235.
∑ BOIKO, A. and SAMUSEVYCH, I. (2017) The role of tax competition between the
countries of the world and the features of determining the main tax competitors of
Ukraine among the European countries. Financial Markets, Institutions and Risks, 1 (1),
pp. 72-79.
∑ BOYARKO, I. M and SAMUSEVYCH, Y. V. (2011) Role of intangible assets in
company's value creation. Actual Problems of Economics, 3(117), pp. 86-94.
∑ BUCOVETSKY, S. (1991) Asymmetric Tax Competition. Journal of Urban Economics,
30 (2), pp.167-181.
∑ CRIȘAN, C. M., DABIJA, D.-C. and DINU, V. (2015) Social Entrepreneurship in
Romania: Significance and Models. Montenegrin Journal of Economics, 11 (2), pp. 65-
77.

On-line Journal Modelling the New Europe
Issue no. 27/2018
64
∑ DELGADO, F. J. (2013) Are Taxes Converging in Europe? Trends and Some Insights
into the Effects of Economic Crisis. Journal of Global Economics, 1 (1), pp. 24-26.
∑ DUMA, F. (2014). Promoting the entreprenurship education in Europe. Online Journal
Modelling the New Europe, (10), 67-79.
∑ ENSS, P. (2008) Tax Competition and Equalization with Assymetric Regions [Online]
Available from: http://libra.msra.cn/Publication/5646995/tax-competition-and-
equalization-with-asymmetric-regions [Accessed 15/05/2017].
∑ FERNANDEZ, G. (2016) Strategic Tax Competition with a Mobile Population.
Económica, 62, pp. 95-120.
∑ FIELD, T. (2003) Tax Competition in Europe and America. State Tax Notes, 98 (14), pp.
1211-1216.
∑ GOODSPEED, T. (1998) Tax Competition, Benefit Taxes and Fiscal Federalism.
National Tax Journal, 51 (3), pp. 579-586.
∑ GORDON R. and WILSON G. (2002) Expenditure Competition. [Online] Michigan State
University and University of Michigan. Available from:
http://www.econ.ucsd.edu/~rogordon/zoning6.pdf [Accessed 15/08/2017].
∑ HAUFLER, A. and WOOTON, I. (2007) Competition for Firms in an Oligopolistic
Industry: Do firms or Countries Have to Pay? CESifo Working Paper, 1976, 31 p.
∑ HOYT, W. (1991) Property Taxation, Nash Equilibrium, and Market Power. Journal of
Urban Economics, 34, pp. 123-131.
∑ HRYTSENKO L., and VYSOCHYNA A. (2012) Balanced Scorecard as an assessment
tool for enterprise strategy. Actual Problems of Economy, 3 (129), pp. 161-167.
∑ HUIZINDA, H. and NIELSEN, S. (1997) Capital income and profit taxation with foreign
ownership of firms. Journal of International Economics, 42, pp. 149-165.
∑ JANEBA, E. (2001) Attracting FDI in a Politically Risky World. National Bureau of
Economic Research Inc. Working Paper, 8400, 36 p.
∑ KEMP, M. (1961) Foreign Investment and National Advantage. The Economic Record,
28, pp. 56-62.

On-line Journal Modelling the New Europe
Issue no. 27/2018
65
∑ KHAN, M. Y. H. (2018) The Effectiveness of Entrepreneurial Activities for Economic
Development: A Route to Innovation and Job Generation. Socio Economic Challenges, 2
(2), pp. 32-40.
∑ KIND, H. MIDELFART-KNARVIK, K. and SCHJELDERUP, G. (2000) Competing for
Capital in a Lumpy World. Journal of Public Economics, 78(3), pp. 253-274.
∑ KLEINSCHMIDT, H. (2017) Labor Movements, Mainly in Eastern Europe.
SocioEconomic Challenges, 1 (3), pp. 45-50.
∑ KOZUBÍKOVÁ, L., BELÁS, J., BILAN, Y. and BARTOŠ, P. (2015) Personal
characteristics of entrepreneurs in the context of perception and management of business
risk in the SME segment. Economics and Sociology, Vol. 8, No 1, pp. 41-54.
∑ LAZÁNYI, K. (2015). What makes a start-up successful?-Small business ventures in
focus. On-line Journal Modelling the New Europe, (16), 68-79
∑ LAZÁNYI, K. (2014). Entrepreneurial skills and competencies of students at Óbuda
University. On-line Journal Modelling the New Europe, (10), 17-28.
∑ LEONOV, S. V., VASYLIEVA, T. A. and TSYGANYUK, D. L. (2012) Formalization of
functional limitations in functioning of co-investment funds basing on comparative
analysis of financial markets within FM CEEC. Actual Problems of Economics, 134(8),
pp. 75-85.
∑ LYEONOV, S. V., VASYLIEVA, T. A. and LYULYOV, O. V. (2018) Macroeconomic
stability evaluation in countries of lower-middle income economies. Naukovyi Visnyk
Natsionalnoho Hirnychoho Universytetu, (1), pp. 138-146.
∑ MACDOUGALL, G. (1960) The benefits and Costs of Private Investments from Abroad:
A Theoretical Approach. Economic Record, 36, pp. 13-35.
∑ MUKHERJEE, S. (2018) Cross Country Tax Competition and its Impact on
Multinational Corporations – a Theoretical Re-examination. Financial Markets,
Institutions and Risks, 2 (1), pp. 97-104.
∑ OATES, W. and SCHWAB, R. (1998) Economic Competition Among Jurisdictions:
Efficiency Enhancing or Distortion Inducing? Journal of Public Economics, 35, pp. 333-
354.

On-line Journal Modelling the New Europe
Issue no. 27/2018
66
∑ POMIANEK, I. (2018) Historical and Contemporary Approaches to Entrepreneurship.
Review of Polish Literature. Business Ethics and Leadership, 2 (2), pp. 74-83.
∑ PRINCE, T. (2017) Behavioral Finance and the Business Cycle. Business Ethics and
Leadership, 1 (4), pp. 28-48.
∑ RAZIN, A. and SADKA, E. (1989) International Tax Competition and Gains from Tax
Harmonization. National Bureau of Economic Research Working Paper, 3152, 25 p.
∑ SAMUSEVYCH, Y. (2014) Defining the role of the tax administration in shaping the
country’s tax competition. Mechanism of regulation of the economy, 4, pp. 174-180.
∑ TEATHER, R. (2005) The Benefits of Tax Competition. The Institute of Economic
Affairs, 167 p.
∑ TIEBOUT, C. A (1956) Pure Theory of Local Expenditures. Journal of political
Economy, 64 (5), pp. 416-424.
∑ VASILYEVA, T., LYEONOV, S., ADAMIČKOVÁ, I. and BAGMET, K. (2018a)
Institutional quality of social sector: The essence and measurements. Economics and
Sociology, 11(2), pp. 248-262.
∑ VASYLIEVA, T. A. and KASYANENKO, V. O. (2013) Integral assessment of
innovation potential of Ukraine's national economy: A scientific methodical approach and
practical calculations. Actual Problems of Economics, 144(6), pp. 50-59.
∑ VASYLIEVA, T., LYEONOV, S., LYULYOV, O. and KYRYCHENKO, K. (2018b)
Macroeconomic stability and its impact on the economic growth of the country.
Montenegrin Journal of Economics, 14(1), pp. 159-170.
∑ WILDASIN, D. (1988) Nash Equilibria in Models of Fiscal Competition. Journal of
Public Economics, 35 (2), pp. 229-240.
∑ WILSON, J. (1999) Theories of Tax Competition. National Tax Journal, 52, pp. 269-304.
∑ ZODROW, G. and MIESZKOWSKI, P. (1986) Pigou, Tiebout, property taxation and the
underprovision of local public goods. Journal of Urban Economic, 19, pp. 356-370.