doing well by making well: the impact of corporate wellness programs on employee...
TRANSCRIPT

Electronic copy available at: http://ssrn.com/abstract=2811785
1
Doing Well by Making Well: The Impact of Corporate Wellness Programs on Employee Productivity
Timothy Gubler School of Business Administration, University of California, Riverside
Ian Larkin Anderson School of Management, UCLA
Lamar Pierce Olin School of Business, Washington University in St. Louis
July 18th, 2016
Abstract: This paper provides the first evidence linking a panel of individual medical data from a corporate wellness program with objective productivity improvements in industrial workers. Almost 90% of companies use corporate wellness programs designed to improve employee health. Existing research has focused on measuring cost savings from reduced insurance rates and absenteeism. In contrast, our paper explains and empirically tests how wellness programs can improve employee productivity, and thereby firm performance. We argue that productivity improvement can arise from two sources. First, wellness programs can increase job motivation through improved satisfaction for all workers and gratitude or reciprocity from those who discover a previously-undiagnosed illness. Second, wellness programs increase employee capability by spurring them to take actions that improve health, well-being and ultimately productivity. We test these predictions using a wellness program implemented at multiple plants of an industrial laundry company. Using a three-year panel of individual productivity and medical data, we find program participation increased productivity by 5%, compared to non-participants, regardless of pre-existing health levels or post-program health changes, suggesting increased job satisfaction for participants. Moreover, many sick and healthy individuals improved their health, increasing productivity by 11%. Surveys indicate that many employees, regardless of pre-existing health levels, improved their diet and exercise from the program. Overall this study suggests that firms can increase operational productivity through socially responsible firm health policies that improve both workers’ wellness and economic value.
Keywords: Worker Productivity, Health, Wellness Program, Presenteeism, Corporate Social Responsibility

Electronic copy available at: http://ssrn.com/abstract=2811785
2
1. Introduction Companies increasingly invest in employee health and well-being (Ton 2014). A recent survey by Medical
Billing and Coding (2012) found that around 90% of companies now use corporate wellness programs that
can include simple biometric screenings such as basic blood tests, advanced screening for diseases such as
cancer, exercise programs, nutritional and diet programs, health history and habits surveys, and training on
protecting and improving health. The prevalence of such programs is unsurprising given growing rates of
obesity, diabetes and other health problems, and the implications of these health issues for employer-
sponsored health insurance and absenteeism (Baicker, Cutler, and Song 2010; Boles, Pelletier, and Lynch
2004). Obesity has steadily increased to almost 35% of the United States population in 2012 (NCHS 2012),
diabetes cases have more than quadrupled since 1980 (CDC 2014), and exercise rates and eating habits have
not improved (Gallup-Healthways 2012). This decrease in employees’ physical health is reflected in the 131%
increase in health insurance premiums from 1999-2009, the cost of which is largely borne by employers
(Kaiser/HRET 2012).
Extensive research in the fields of medicine, public health, and health economics shows that the
costs of corporate wellness programs are dwarfed by reductions in insurance costs and absenteeism. A recent
meta-analysis found that each dollar spent on wellness programs saves $3.27 in health care costs and $2.73 in
absenteeism costs (Baicker et al. 2010). Although these gains are substantial, they ignore an important class of
operational benefits from investing in employee health and well-being—worker productivity. As management
and operations scholars argue (Danna and Griffin 1999; Goldstein 2003; Grant et al. 2007; Neumann and Dul
2010; Ødegaard and Roos 2014), healthier employees are not simply less expensive and less absent, but are
also more productive. A large occupational health literature on “presenteeism” – working while ill – suggests
lost worker productivity costs companies over $150 billion, almost three times absenteeism costs (Stewart et
al. 2003). Despite this importance, the existing literature has failed to causally link objective health data from
wellness programs with real individual productivity changes in workers. This may explain the confusion
among firms regarding how much wellness programs actually help their bottom line. A recent article in the
Wall Street Journal notes that “employers are stymied by the difficulties of measuring the financial and health
impact of wellness programs” (Weber 2014).
In this paper, we provide the first causal evidence based on objective data that wellness programs and
their related health improvements can improve individual productivity. Detailed daily production data,
combined with annual medical data including bloodwork, lifestyle choices, and vital statistics, allow us to
exploit a quasi-experiment in five production plants that generates a causal estimate of the impact of the
wellness program on productivity as well as evidence on how and why these productivity changes occurred. .
We argue that employee wellness programs can improve existing worker productivity through two sources.
First, we argue that wellness programs can improve motivation by credibly demonstrating organizational
concern for workers, thereby increasing employees’ organizational commitment, loyalty, job satisfaction, and

3
gratitude to the company. Second, we argue that wellness programs can increase employee capability by
improving physical and mental health and overall psychological well-being (Thayer et al. 1994; Christian et al.
2015).
We argue that these two sources of productivity gains—motivation and capability—will depend on
two employee-specific dimensions: 1) pre-existing health and 2) the motivation and ability to improve health.
Our study estimates the overall impact of a wellness program on individual productivity for these four types
of employees, as well as on the operational efficiency and production cost for the firm. We predict the
greatest productivity improvements in employees with pre-existing health conditions who remediate these
problems.
We test our theory using novel longitudinal data on individual health and productivity from an
industrial laundry company (which we call LaundryCo). In Spring 2010, LaundryCo management decided to
provide free yearly biometric screenings to all full-time employees in four of their five laundry plants. The
fifth plant did not participate because it used a different health insurance plan than the other four plants.
LaundryCo engaged an outside company to visit the four participating plants and administer a simple health
exam that included drawing blood, taking blood pressure, and administering a health survey. The voluntary
exam culminated about three weeks later with an educational seminar where a registered nurse presented each
employee with a personalized health packet that detailed their current health status and provided
recommendations for improving health.
Our approach empirically estimates the impact of the wellness program, including objectively-
measured improvements in worker health, on productivity. We compare productivity changes for participants
to the quasi-control group of the non-participating plant, as well as the 15% of employees at the participating
plants who were absent the day of the screening or who otherwise chose not to participate. Nearly all
employees had at least one abnormal blood test out of the 42 given, many due to small deviances from the
normal range. We therefore hired three physicians to evaluate the sickness level of each participating
employee based on the entire battery of test results. Our physicians indicated that a third of employees had a
health problem at the time of screening.
The wellness program improved average worker productivity by nearly 5% -- roughly equal to adding
an additional day of productive work per month for the average employee. However, our results reveal that
the impact of employee wellness programs on productivity may not primarily stem from improving the health
of sick workers. In our setting, all participating workers were affected by the program. First, employees who
had no health problems and whose health did not improve after the program exhibited a 7.5% productivity
increase due to the program’s introduction. This is consistent with our theory that a wellness program will
increase job satisfaction in all employees, since it is an indication that the employer values employees.
Our results also show that many employees improved their health after receiving health information.
Our physician evaluators indicated that 25% of sick employees improved between the first and second years

4
participating. Moreover, sick employees whose health improved increased productivity by over 10%
compared to non-participants. Strikingly, some already healthy employees also improved their health; survey
results indicate that these health improvements stemmed from increases in physical activity, attention to diet,
and other lifestyle changes. The increased productivity of the sick and non-sick groups were statistically
indistinguishable, suggesting that lifestyle changes are initially more important to employee productivity than
actual improvements to health problems. This is unsurprising given that the most common health problems
in our setting were chronic conditions such as high cholesterol, improvement in which can take many years.
Our paper contributes to several key literatures in operations, management, and strategy. First, we
add to growing research in management on the relationship between employee well-being and organizational
performance, providing the first causal evidence linking a multi-year panel of medical data to actual individual
productivity improvements in a firm. This supports existing cross-sectional and self-reported data in prior
work (e.g., Burton et al. 1999; Goetzel et al. 2003; Ødengaard and Roos 2014).
Second, our paper joins the growing literature in operations that uses detailed micro-level production
and service data to study how environmental, social, and psychological factors can impact individual worker
productivity. Recent studies have demonstrated operational policies such as scheduling and staffing (Chan et
al. 2014; Dai et al. 2015; Huckman and Staats 2011), monitoring and transparency (Bernstein 2012; Buell et al.
2016; Pierce et al. 2014; Staats et al. 2016; Tan and Netessine 2015), performance recognition (Gubler et al.
2016; Song et al. 2016), and workflow (Kuntz et al. 2014; Staats and Gino 2012; Tan and Netessine 2014) can
all profoundly impact worker performance. Even environmental factors outside managerial control, such as
weather (Lee et al. 2014), are being revealed as determinants of individual and group productivity. Our study
uniquely contributes to this literature not only by showing the link between health and productivity, but also
by supporting the growing argument that firm policy can broadly improve operations through worker health
and well-being (Ton 2014).
Third, our paper contributes to the large and often conflicting literature on corporate social
responsibility (CSR) and firm performance (Margolis and Walsh 2003; Orlitzky et al. 2003; Kitzmueller and
Shimshack 2012) by detailing mechanisms through which firms can “do well by doing good.” The empirical
challenges in this research are widely recognized (Barnett and Salomon 2006; Chatterji et al. 2009), prompting
calls to investigate the microfoundations of CSR (Aguilera et al. 2007). Our study responds to this call,
showing how one frequently-used CSR policy can improve worker productivity and firm outcomes.
Finally, our paper contributes to a vast, but largely correlational, medical and public health literature
by linking objective health improvement data with objective worker productivity gains in a quasi-experimental
setting. This distinction is important for two reasons. First, people are often dishonest or biased about their
own productivity (or that of others) (Podsakoff et al. 2003). Second, self-reported productivity is difficult to
quantify or value, particularly when measured with scales.

5
2. Existing Research and Hypotheses 2.1 Socially Responsible Employee Policies
A significant literature studies socially-responsible firm policies at organizational and institutional levels of
analysis, focusing on predictors of CSR, the outcomes of CSR, and mediators and moderators of the CSR-
outcomes relationship (Wang and Qian 2011; Aquinis and Glavis 2012). These studies find that CSR is
correlated with many positive outcomes, including improved reputation, consumer loyalty, stronger
stakeholder relations, and attractiveness to investors. Despite this vast literature, however, scholars continue
to disagree about the existence and magnitude of such effects because few papers provide causal tests of CSR
and firm performance (Flammer 2015).
One growing body of research has focused on how socially-responsible firm policies increase firm
performance by helping employees. This work shows that such policies correlate with many employee
behaviors and attitudes (Aquinis and Glavas 2012), including organizational identification (Carmeli et al.
2007), employee engagement and citizenship (Glavas and Piderit 2009; Jones 2010), employee relations (Agle
et al. 1999; Glavas and Piderit 2009), and attractiveness to potential employees (Turban and Greening 1997).
With few recent exceptions (Burbano 2016; Carnahan et al. 2016; Flammer and Luo 2016; Cuypers et al.
2016), however, field studies rely on correlations without providing strong causal evidence.
This paper focuses on employee wellness programs—one of the most common socially-responsible
policies targeted toward employees. One reason these programs are so broadly used is the immediate, salient,
and measurable benefit from reduced insurance premiums. Reduced premiums provide managers with
immediate financial justification for introducing wellness programs (Berry et al. 2010), thereby removing
many of the internal political barriers to such expenses. Additionally, firms may see immediate tangible gains
from healthier employees through reduced absenteeism, injury, and worker compensation claims (Chapman
2012). Widespread evidence shows that decreasing a health risk such as smoking can significantly reduce
insurance and absenteeism costs (Burton et al. 1999; Goetzel et al. 2003).
The existing literature therefore has primarily focused on how firms benefit from wellness programs
via reduced costs from insurance, absenteeism, and risk, rather than from worker productivity. From an
empirical perspective, this focus is understandable. The link between wellness programs and productivity is
difficult to causally measure. Matched objective productivity and health data are difficult to obtain from firms,
and isolating the treatment effect of such programs amidst other policy changes can be daunting.
Furthermore, most companies offer wellness programs to all employees, which means that researchers cannot
untangle temporal productivity changes caused by, for example, time trends in productivity or random shocks
affecting all employees. These factors may explain why repeated meta-analyses of financial returns from
employee wellness programs include almost no productivity-based returns (Chapman 2012).
We present a framework that details possible mechanisms through which such productivity increases
might occur. This framework predicts individual productivity gains based on two sources: motivation and

6
capability. The importance of these sources in improving productivity is determined by two employee health
dimensions—pre-existing health problems and health improvement during the program. Although we are
unable to empirically measure these mechanisms, they provide likely reasons for the productivity changes that
we are able to objectively measure.
Figure 1 summarizes these predictions. Our two dimensions classify employees into four categories,
all of which are predicted to increase productivity after program implementation. We hypothesize that all
participating workers will increase productivity because of job satisfaction, while those who learn of health
problems will improve further due to feelings of gratitude. Next, we argue that both previously healthy and
previously unhealthy workers can increase productivity through lifestyle changes that increase productivity.
Finally, previously unhealthy employees who improve health will also improve productivity due to increased
physical capability. We therefore predict that this group will see the largest productivity jump.
<<< INSERT FIGURE 1 HERE >>>
2.2 Productivity Through Job Satisfaction
Offering a wellness program demonstrates a firm’s concern for the well-being of its employees. Well-being
spans numerous psychological, physical, and social dimensions (Grant et al. 2007). The costly implementation
of a program designed to improve well-being on one of these dimensions can credibly signal to employees the
firm’s broader concern for the quality of their work life, and even the quality of their life outside the
workplace. Wellness programs can thereby improve the attitudes of workers toward their employer.
Employers frequently offer corporate wellness programs to all employees without knowing who will
benefit, even after implementation. Therefore, all participants, not just those who receive new information
from the program, will perceive increased organizational support, and therefore will experience increased job
satisfaction. Indeed, the existence of a wellness program, independent of its efficacy, has been shown to
increase job satisfaction (Zoller 2004) and raise perceptions of organizational commitment towards
employees (Parks and Steelman 2008). Both job satisfaction and perceived organizational support are known
to be positively associated with job performance (Armeli et al. 1998; Yee et al. 2008), which includes
productivity on the job. We therefore hypothesize that:
Hypothesis 1: A company-sponsored wellness program will increase average employee productivity regardless of whether
the program identified a health concern for the employee or led to improved health.
2.3 Productivity Through Reciprocity
One of the major aims of a wellness program is to help employees who do not know of an existing illness
identify that they are ill. All such employees, regardless of whether the program also helps them remediate
their illness, could see their productivity affected by the wellness program. This is because sick employees are
likely to feel gratitude to the employer for providing information about existing but unknown health
conditions. This information is inherently valuable, and employees who receive this gift are likely to

7
reciprocate (Bartlett and DeSteno 2006; Tsang 2006). Reciprocity theory (Kahneman et al. 1986) holds that
actors, such as employees, react to unexpected giving by responding in turn, even if a receiver does not want
or will not use a valuable gift (Tesser et al. 1968; Grant and Gino 2010; Adams et al. 2012). When an
employee receives a benefit from the employer, they may strive to relieve this imbalance though contributions
to the organization (Blau 1964; Eisenberger et al. 2001). One natural way employees could reciprocate is via
increased productivity. Since the value of the information provided by the wellness program is highest for
workers with preexisting health problems, these workers are most likely to feel gratitude and thus reciprocate
by working harder (Dabos and Rousseau 2004; Hekman et al. 2009). This leads to our next hypothesis:
Hypothesis 2: A company-sponsored wellness program will increase average employee productivity more for employees
with existing health problems than for healthy employees, even when the sick employees fail to improve their health.
2.4 Productivity Through Improved Well-being
As with employees whose health does not improve, we predict that the effects of improved health will differ
based on preexisting health. Even healthy employees without diagnosed problems can improve health, since
participants may better understand the benefits of healthy lifestyle choices after observing data on their own
health. Moreover, free counseling on nutrition, substance abuse, weight, exercise, and other health habits
provided through the wellness program may lead all participants, including healthy individuals, to make
positive lifestyle changes (Parks and Steelman 2008).
Even if participants learn nothing negative from health counseling, employees may respond with
increased commitment to overall health and well-being. Recent research has shown that subtle nudges about
lifestyle choices and health and longevity can increase commitment to healthy choices in diet, exercise, and
sleep (Vallgårda 2012). The specific actions that employees take in a wellness program – seeing a registered
nurse, getting blood drawn, and receiving information on typical health problems – may provide one such
nudge.
Thus, even for already healthy workers, a wellness program will help some employees to make
positive lifestyle changes in areas such as diet, exercise, and sleep. Each of these has been linked to employee
on-the-job productivity via mechanisms such as stamina, energy and mood (Thayer et al. 1994). We therefore
hypothesize:
Hypothesis 3: A company-sponsored wellness program will increase average employee productivity more for employees
whose health improves after the program than for those employees whose health is not affected by the program, even for
those employees without identifiable health problems.
2.5 Productivity Through Improved Physical Capability
Finally, we predict the largest productivity gains for those employees who remediate a health problem
identified by the wellness program. The productivity of these employees improves not only via all three of the

8
previously discussed mechanisms – job satisfaction, reciprocity and increased well-being – but also via
physical improvements brought about by addressing the identified health issue.
There is consensus in the occupational health literature that poor health reduces capacity to work and
has substantive effects on wages, hours worked, labor force participation, job choice, turnover, retirement,
structure of employment, and occupational choice (Currie and Madrian 1999). The direct link between health
improvement and on-the-job productivity at the individual level, however, bears scant evidence in the social
and behavioral sciences. Instead, health has been indirectly linked to productivity through human capital
development (Becker 2007), identified through educational attainment (Conti et al. 2010), or through national
and other macro-level measures (Currie and Madrian 1999).
Perhaps the most closely related literature on individual health and productivity is research on
presenteeism—workers who are present but impeded due to illness, depression, injury, or pain. Presenteeism
is estimated to be three times as costly as absenteeism. The occupational health and medical literatures use
self-reported survey data to link productivity loss to a variety of mental and physical health conditions,
including diabetes, depression, anxiety, cancer, migraines, and arthritis (Stewart et al. 2003). For example, one
study used surveys from Lockheed Martin to link productivity losses with health problems that include
migraines (4.9% loss), allergies (4.1% loss), asthma (5.2% loss), influenza (4.7% loss), and depression (7.6%
loss) (Hemp 2004). Even when health improvements are not specifically tied to an individual’s capability to
carry out a critical job task, improvements may increase worker productivity on tasks due to improved mental
health and reduced distraction from pain and discomfort. Recent evidence from Christian et al. (2015)
suggests that pain reduction, and subsequent improvements in energy, can dramatically affect discretionary
tasks such as productivity or prosocial behavior. This existing literature suggests a final hypothesis:
Hypothesis 4: A company-sponsored wellness program will increase average productivity more for employees who
remediate existing health problems than for any other employee type.
We summarize our predictions in Figure 2. Those that do not participate in the wellness program,
shown on the far left, serve as the baseline for productivity. Employees who participate in the program, but
who are neither informed they are sick nor improve well-being, have productivity improvements only through
increased job satisfaction. Three other groups of employees improve productivity incrementally over this
group. Employees who are told they are sick but who do not improve their health incrementally increase their
productivity via gratitude. Employees who are not sick but who make lifestyle changes incrementally increase
their productivity via increased well-being. Our argument does not predict the relative productivity
improvements of these two groups; it simply predicts productivity gains for both groups that are greater than
those of healthy employees whose health does not improve. Finally, we predict that sick employees whose
health improves will see the highest productivity gain as they benefit from not only job satisfaction, gratitude,
and wellbeing, but also from greater physical capability.

9
<<< INSERT FIGURE 2 HERE >>>
3. Data and Methodology
A major innovation in this study is the link between objective employee health data and daily individual
productivity measures over time. Previous wellness program studies have either lacked a control group or
used purely cross-sectional or survey data. Our paper features both a quasi-control group and longitudinal
objective data for both productivity and health paired with self-reported survey and demographic data for 111
workers in four treatment plants and one quasi-control plant.
3.1 Setting
Our data originate from a private industrial laundry service company, which we call LaundryCo. LaundryCo is
one of the largest independent industrial launderers in the United States, and provides uniforms, mats, and
other garments to clients that include auto shops, construction companies, restaurants, and hospitals.
Uniforms, mats, and other garments are regularly laundered and repaired by LaundryCo, with an innovative IT
and production system ensuring that garments are delivered on time. The cleaning and repairing of products
is carried out primarily by workers in five plants across four states. These plants are nearly identical in layout,
equipment, staffing positions, and products.
The soiled clothes, mats, and linens are dropped off at the plants and proceed through a complex
sequence of sorting, cleaning, drying, pressing, and repair before being loaded and returned to the customer.
Non-uniform items such as floor mats or linens go through their own unique process. Workers are cross-
trained on multiple tasks, but typically specialize in only a few. Similar to other service operations, worker
efficiency is critical to the profitability of LaundryCo. Mistakes and bottlenecks can create costly disruption in
the production line and leave downstream workers with insufficient workload. Mistakes may include incorrect
initial sorting, insufficient cleaning, or failure to repair garments before the final quality check. Bottlenecks
can result both from mistakes as well as inefficiency in upstream workers. For instance, if the worker
operating the dryer falls behind, the pressing machine operator might remain idle until garments arrive for
pressing. The dependence of downstream workers on the productivity of their upstream colleagues means
that low productivity due to presenteeism is particularly costly for LaundryCo.
In the spring of 2010, LaundryCo contracted with an outside company (“the vendor”) to provide a
free wellness program to employees. Management’s goal was to reduce insurance premiums and improve
employee health. However, the program was presented to employees as a free benefit and management
actively encouraged employees to participate. The wellness program was offered to all employees on a
voluntary basis, and about 15% of employees did not participate, some simply because they were absent on
the day of the program. LaundryCo’s human resource director gave several other potential reasons for non-
participation, including insurance coverage via a spouse, fear of doctors, or worry that the program would
uncover drug use (although the program did not test employees for drug use). Participating employees
received a 15% decrease in monthly insurance premiums (about $1.75 to $11 per month) as a small incentive

10
to participate.
We note that the carefully designed program of LaundryCo adheres to the two design principles
discussed in the boundary conditions section above. First, participation was purely voluntary. While
participants received a small reduction in insurance premiums, non-participants’ rates did not change. In fact,
LaundryCo management did not keep record of non-participants, and plant managers report not knowing the
identity of these workers. Second, LaundryCo had no access to the health data generated by the program. We
received these data from the vendor, and LaundryCo is not party to any findings from the program. All
employees were informed of these two facts – that participation was completely voluntary, and that their
privacy was assured as LaundryCo would have nothing to do with administering the program.
The program began with a blood draw at the plants. The blood samples were then shipped to
LabCorp and tested for 42 common health markers. Employees were then given a health survey from
Wellsource, a provider of evidence-based health assessments to organizations. The survey asked about health
background, nutrition, fitness, stress level and mood, drug use, and other behavior-related questions.
Approximately three weeks after the screenings, nurses from the vendor returned to each plant, held an
educational seminar, and presented each employee with a personalized health packet detailing their results.
About 97% of participating employees in our sample had at least one abnormal test result each year, although
some of these reflected small, likely random variations on a few blood test measures. LaundryCo’s human
resource director indicated that because many employees rarely visit the doctor, numerous biometric
screenings uncovered serious or unknown health problems. For the approximately 20% of employees who
had severely abnormal test results in some area, the nurse would call them within a week of the first visit,
explain the results, then ask for permission to forward them directly to the employee’s physician. Employees
who lacked a primary care physician were offered a referral to one. The returned health packet detailed the
individual’s health status, including blood results and abnormalities, health behavior scores, anticipated future
health risks, and personalized suggestions for health improvement.
LaundryCo offered the full program, including biometric screenings, surveys and counseling, to all
employees in 2010, 2011 and 2012. Although the program continues to operate for new hires, LaundryCo
discontinued the full biometric screenings for previous participants starting in 2013.
3.2 Data
The data span 2009-2012 and cover all production workers employed at five LaundryCo plants for which
productivity data are available. Figure 3 illustrates the structure of the data. Vendor visits 1 and 3 correspond
to the initial visit where the first blood draws were taken. Vendor visits 2 and 4 correspond to when the
results were returned a few weeks later. As shown in Figure 3, there are three possible employee wellness
observations (one per year) for workers that remained employed and participated through 2012. However,
because our theory primarily relates to the first time participating, when employees first have information
revealed about their health, we limit our analyses to the first period of participation for each employee (i.e.,
11
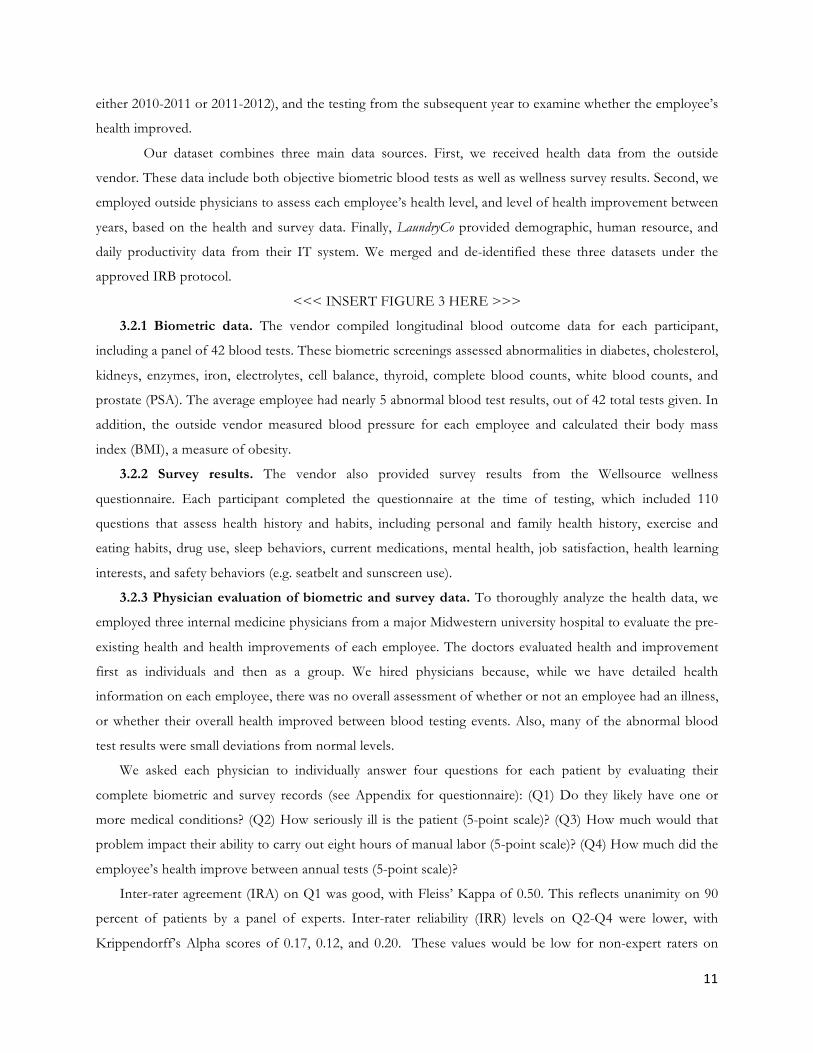
either 2010-2011 or 2011-2012), and the testing from the subsequent year to examine whether the employee’s
health improved.
Our dataset combines three main data sources. First, we received health data from the outside
vendor. These data include both objective biometric blood tests as well as wellness survey results. Second, we
employed outside physicians to assess each employee’s health level, and level of health improvement between
years, based on the health and survey data. Finally, LaundryCo provided demographic, human resource, and
daily productivity data from their IT system. We merged and de-identified these three datasets under the
approved IRB protocol.
<<< INSERT FIGURE 3 HERE >>>
3.2.1 Biometric data. The vendor compiled longitudinal blood outcome data for each participant,
including a panel of 42 blood tests. These biometric screenings assessed abnormalities in diabetes, cholesterol,
kidneys, enzymes, iron, electrolytes, cell balance, thyroid, complete blood counts, white blood counts, and
prostate (PSA). The average employee had nearly 5 abnormal blood test results, out of 42 total tests given. In
addition, the outside vendor measured blood pressure for each employee and calculated their body mass
index (BMI), a measure of obesity.
3.2.2 Survey results. The vendor also provided survey results from the Wellsource wellness
questionnaire. Each participant completed the questionnaire at the time of testing, which included 110
questions that assess health history and habits, including personal and family health history, exercise and
eating habits, drug use, sleep behaviors, current medications, mental health, job satisfaction, health learning
interests, and safety behaviors (e.g. seatbelt and sunscreen use).
3.2.3 Physician evaluation of biometric and survey data. To thoroughly analyze the health data, we
employed three internal medicine physicians from a major Midwestern university hospital to evaluate the pre-
existing health and health improvements of each employee. The doctors evaluated health and improvement
first as individuals and then as a group. We hired physicians because, while we have detailed health
information on each employee, there was no overall assessment of whether or not an employee had an illness,
or whether their overall health improved between blood testing events. Also, many of the abnormal blood
test results were small deviations from normal levels.
We asked each physician to individually answer four questions for each patient by evaluating their
complete biometric and survey records (see Appendix for questionnaire): (Q1) Do they likely have one or
more medical conditions? (Q2) How seriously ill is the patient (5-point scale)? (Q3) How much would that
problem impact their ability to carry out eight hours of manual labor (5-point scale)? (Q4) How much did the
employee’s health improve between annual tests (5-point scale)?
Inter-rater agreement (IRA) on Q1 was good, with Fleiss’ Kappa of 0.50. This reflects unanimity on 90
percent of patients by a panel of experts. Inter-rater reliability (IRR) levels on Q2-Q4 were lower, with
Krippendorff’s Alpha scores of 0.17, 0.12, and 0.20. These values would be low for non-expert raters on

12
simple tasks, but are consistent with studies of IRR in the medical literature. For example, a study including
32 medical interns and 12 full-time medical faculty on 128 different clinical evaluation exercise methods
found IRRs ranging from 0.00 to 0.63, with a mean of only 0.23 (Kroboth et al. 1992). With results from so
many blood tests as well as survey results, nearly every patient-year observation contains some contradictory
data, and physicians tend to focus on different measures based on their own beliefs and experiences (Eddy
and Clanton 1982). Furthermore, most studies of IRR in medicine involve a physical examination of the
patient, which our physicians lacked. Therefore, our low IRR ratings are fully consistent with the literature on
medical evaluations.
In fact, the physicians themselves expressed to us that Q2, Q3 and Q4 were difficult given the large
amount of data and many borderline results, and after completing their individual ratings, they proposed
collective evaluations involving a scoring system established by the doctors, with higher values reflecting
worse health (see Appendix for scoring system). We use both the individual and collective measures for Q4,
and the results are highly similar. We chose not to use Q2 and Q3 in the study due to the low IRR and our
relatively small sample size.
3.2.4 LaundryCo IT data. LaundryCo provided data at the employee level on individual productivity and
demographics for 2009-2012. Productivity data are at the worker/day level, and the other data are measured
as of January, 2013. Demographic data include employee age, salary, tenure and plant assignment—all of
which are absorbed in our fixed effect regressions. Worker productivity is based on how long an employee
works each day and how efficient they are on each given task.
3.3 Treatment and Control Groups
Our treatment group is comprised of employees who work at one of the four plants that instituted a wellness
program, and who chose to participate. We drop employees from the treatment group who cease
employment with LaundryCo after participating in only one annual evaluation because our theory relies on
identifying whether an employee’s health improves after their initial participation, which is only observable if
the employee participates in at least one subsequent program.
The control group of non-participants is made up of two sets of employees. First, one plant did not
participate in the program since it had a different health insurance program than the others. All employees in
this plant are in the control group. The control group also includes workers from one of the four treatment
plants who chose not to participate in the program. Results only using the employees in the non-participating
plant are highly similar. To ensure the two groups were defined by the same criteria, we limit our control
group to employees who were employed at the plant long enough to overlap with two annual screenings.
3.4 Dependent Variables
Our dependent variable is daily worker efficiency. LaundryCo uses a sophisticated IT system that carefully
tracks each worker’s productivity (called “efficiency”) on each task every day. To do so, they measure the
garment processing rate for each worker compared to the time-studied expected rate, as determined by

13
corporate headquarters. Scores are normalized such that 100 reflects performance that meets expectations.
For example, the time-studied rate for pressing dress shirts is 50.4 seconds, meaning an employee must press
over 71 shirts each hour to earn a score of 100. The system computes an overall daily efficiency rate for each
worker, equal to the weighted average (by time spent) of the worker’s efficiency scores on each task that day.
For example, a worker who spent two hours sorting soiled clothes with an efficiency score of 80, two hours
loading soiled clothes and the appropriate soap into washing machines with a score of 140, and four hours
unloading clean but wet clothes into bins to be taken to the dryer area with a score of 160 would have a final
daily efficiency of 135. A typical employee will have an efficiency number around 110-120, with high
performers consistently performing above 130 and low-performers at less than 100.
3.5 Independent Variables
Our independent variables represent three broad constructs: program participation, sick, and better. Program
participation takes a value of 1 for dates after an individual first participated in and received information from
the wellness program. Thus, empirically it is the interaction between a dummy for the post treatment period
and a dummy indicating the first time participating. This variable takes the value of 0 for employees who
either worked at the non-participating plant or else chose not to participate at any of the other plants in that
year.
In our primary health specifications, Sick is a dummy variable created from question 1 in the
physician health evaluation. Because IRA on this question is high, we require all three physicians to designate
a worker as having a health condition based on the results of the wellness intervention that year. Results were
highly similar using a cutoff of two of three physicians designating a worker as sick. In more detailed tests, we
also examine illness in specific health dimension such as diabetes and kidney function. For these tests, we
constructed dummy variables indicating sickness in each health dimension using blood test result cutoffs
communicated by the outside health company to employees in their personalized health packet. For instance,
an individual would be coded as “sick” on the LDL cholesterol dimension if they had a reading in excess of
99 mg/dL.
Similarly, in our primary specifications, Better is a dummy variable using question 4 from the physician
evaluation that indicates significant health improvement between the first and second participation. We
designate an individual as Better if the average doctor score indicates health improvement between periods.
We alternatively measure Better using the group physician measure, as this assigns points to individuals each
year based on health factors. Using this measure, we define Better as improvement in the score between the
first and second participation. For the specifications that estimate improvement on specific health conditions,
Better was defined by the specific biometric score changing from the abnormal to normal range. Finally, for
the lifestyle change specifications (e.g., nutrition, exercise, and stress) Better was defined as improving between
periods in the wellness survey (e.g. indicating on the survey that an employee’s attention to nutrition had gone
up from the prior year). Tables 1 and 2 provide descriptive statistics and correlations for the final sample.
14
<<< INSERT TABLES 1 and 2 HERE >>>
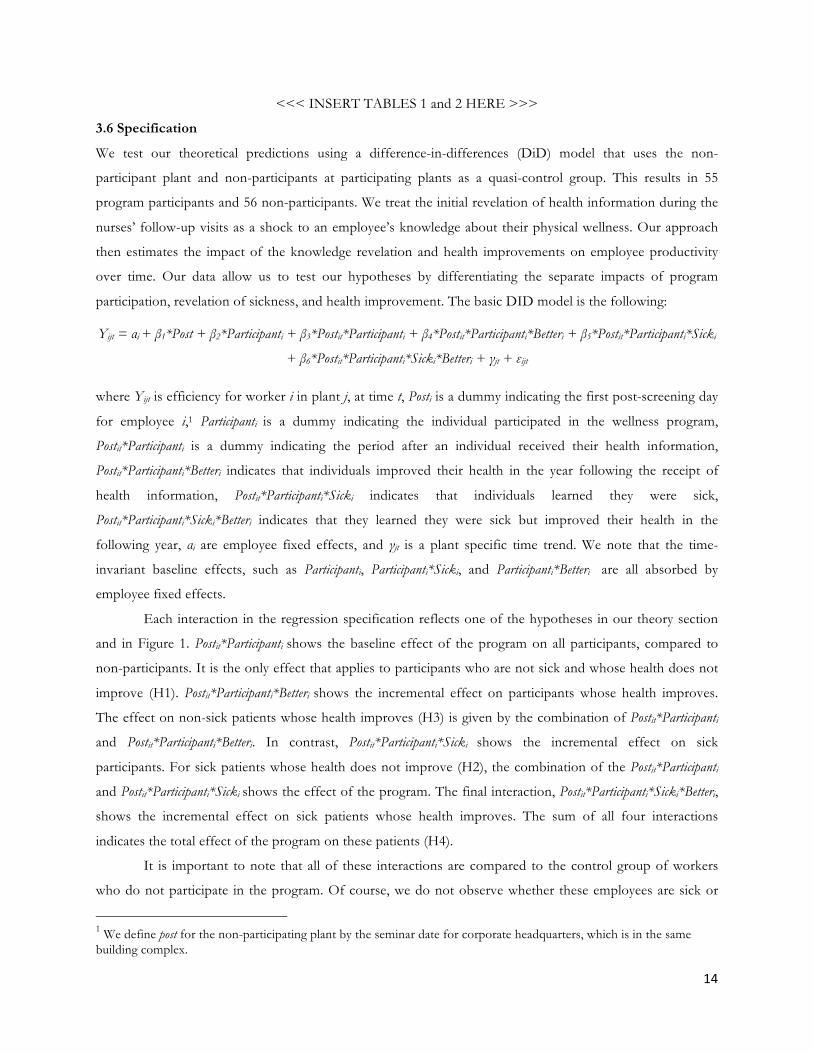
3.6 Specification
We test our theoretical predictions using a difference-in-differences (DiD) model that uses the non-
participant plant and non-participants at participating plants as a quasi-control group. This results in 55
program participants and 56 non-participants. We treat the initial revelation of health information during the
nurses’ follow-up visits as a shock to an employee’s knowledge about their physical wellness. Our approach
then estimates the impact of the knowledge revelation and health improvements on employee productivity
over time. Our data allow us to test our hypotheses by differentiating the separate impacts of program
participation, revelation of sickness, and health improvement. The basic DID model is the following:
Yijt = αi + β1*Post + β2*Participanti + β3*Postit*Participanti + β4*Postit*Participanti*Betteri + β5*Postit*Participanti*Sicki
+ β6*Postit*Participanti*Sicki*Betteri + γjt + εijt
where Yijt is efficiency for worker i in plant j, at time t, Posti is a dummy indicating the first post-screening day
for employee i,1 Participanti is a dummy indicating the individual participated in the wellness program,
Postit*Participanti is a dummy indicating the period after an individual received their health information,
Postit*Participanti*Betteri indicates that individuals improved their health in the year following the receipt of
health information, Postit*Participanti*Sicki indicates that individuals learned they were sick,
Postit*Participanti*Sicki*Betteri indicates that they learned they were sick but improved their health in the
following year, αi are employee fixed effects, and γjt is a plant specific time trend. We note that the time-
invariant baseline effects, such as Participanti, Participanti*Sicki, and Participanti*Betteri are all absorbed by
employee fixed effects.
Each interaction in the regression specification reflects one of the hypotheses in our theory section
and in Figure 1. Postit*Participanti shows the baseline effect of the program on all participants, compared to
non-participants. It is the only effect that applies to participants who are not sick and whose health does not
improve (H1). Postit*Participanti*Betteri shows the incremental effect on participants whose health improves.
The effect on non-sick patients whose health improves (H3) is given by the combination of Postit*Participanti and Postit*Participanti*Betteri. In contrast, Postit*Participanti*Sicki shows the incremental effect on sick
participants. For sick patients whose health does not improve (H2), the combination of the Postit*Participanti and Postit*Participanti*Sicki shows the effect of the program. The final interaction, Postit*Participanti*Sicki*Betteri,
shows the incremental effect on sick patients whose health improves. The sum of all four interactions
indicates the total effect of the program on these patients (H4).
It is important to note that all of these interactions are compared to the control group of workers
who do not participate in the program. Of course, we do not observe whether these employees are sick or
1 We define post for the non-participating plant by the seminar date for corporate headquarters, which is in the same building complex.

15
improve their health; however, employees in the control group who learn they are sick and/or improve their
health do so for reasons other than the corporate wellness program. Although we code each member of the
control group as “not sick, not better,” these variables actually refer to realized sickness and health changes
that occur due to the wellness program, and not for other reasons. Therefore, the control group’s unobserved
changes in these categories, and their effects on productivity, serve as the counterfactual for what would have
happened in the treatment group absent the wellness program.
Regression coefficients on the interaction variables only indicate the marginal effect of each category,
and are difficult to interpret, so we report the linear combinations (total effects) of the coefficients which, as
indicated above, correspond precisely to our hypotheses.
3.7 Estimation
The DiD design treats those in LaundryCo’s four plants that participated in the wellness program as
the treatment group and the single non-participating plant and those who chose not to participate as a quasi-
control group (hereafter called the control group). The DiD strategy “differences out” fixed differences
between treatment and control groups, and uses post-treatment changes for the control group as a
counterfactual for what would have happened had treatment group individuals not participated in the
wellness plan. The DiD approach is the most widely used methodology to examine the impact of exogenous
shocks or policy changes (Gertler et al. 2011).
Although DiD strategies do not require that treatment and control groups be the same, in our case
individuals from the treatment and control groups are very similar on most dimensions. All five plants work
on the same tasks, use the same production technology, and share common floor layouts. Also, two of the
treatment group plants are geographically proximate (32 and 34 miles, respectively) to the control plant,
which addresses local shocks such as weather that might affect productivity in the control plant. All five
plants had similar managerial policies; most critically, there is no evidence that any policies changed at the
same time the wellness program was introduced. Any fixed differences in management policies (or any other
variable) do not affect DiD estimates.
DiD studies do not require random assignment of treatment and control, but a potential weakness of
our study is the lack of a true control group, as individuals either select into the control group or belong to
the single unionized control plant. However, it is extremely unlikely that participants chose at which plant
they would seek employment based on whether they believed the plant was likely to offer a wellness program.
Interviews suggest employees desire to work at the closest plant, and very few employees would find it
desirable to transfer to a different plant from the one where they currently work. Therefore, with respect to
participating in the wellness program, our intervention approaches random assignment. While some control
group employees choose not to participate in the program, our results are highly similar without the inclusion
of these employees.
We estimate our DiD model using ordinary least squares (OLS), clustering standard errors at the

16
individual level. To correct for potential time-variant differences in plants we also include monthly dummies
for each plant, which function as plant-specific time trends.
4. Results
Table 1 presents descriptive statistics for our main variables of interest. It indicates that 33% of
employees were classified as sick by all three physicians, and 14% improved their health after the intervention
based on the collaborative physician scale. Examples of common health abnormalities were high cholesterol,
obesity, hypertension, chronic pain, and self-admitted drug abuse.
We next test our hypotheses using overall health evaluations from our physician panel in Table 3. As
noted, we present total effect coefficients that represent the four employee types presented in Figure 1, which
we calculated using the marginal effects as explained above. The omitted comparison group is non-
participants (for whom we have no health information).
Column 1 uses the dichotomous sick and better variables from questions 1 and 4 of the individual
physician evaluation. Consistent with Hypothesis 1, healthy participants with no health improvements
increase productivity relative to non-participants (B=9.060, p<.01). This effect represents approximately a
7.5% productivity growth compared to baseline levels of 120. Participants who discover health problems but
do not improve (B=-1.707, p>.1), however, show no difference from the control group—inconsistent with
Hypothesis 2. Their productivity change is in fact significantly less than their healthy counterparts (Wald test,
p<.01). In contrast, participants with health problems who improve see productivity growth of 13.271
(p<.05), or approximately 11%. Non-sick employees who improve their health also see a large productivity
increase (B=12.305, p<.05). H3 is therefore supported, since, regardless of pre-existing sickness level,
productivity improves when health improves. However, the effect for improving employees is statistically
identical for the healthy and sick groups (Wald test, p>.1), so Hypothesis 4 is not supported. We observe no
incremental increase in productivity when sick employees improve their health.
Column 2 repeats this model, defining Better as a decrease in the collaborative physician health
scoring measure. Employees whose scores decreased have a value of one, while those who stayed the same or
increased have value of zero. These models produce similar results to column 1.
We thus find support for two hypotheses. Interestingly, our supported hypotheses involve effects on
both healthy workers through increased job satisfaction (H1) as well as sick workers through increased overall
wellbeing (H3). We find no support for hypotheses involving incremental effects on sick employees
stemming from gratitude (H2) or improved physical capability (H4). The lack of support for H4 may simply
reflect insufficient statistical power, because only 27% of participants improved their health, making it
difficult to differentiate between sick and healthy employees whose health improved.
The lack of support for H2 is more surprising. We believe there are several potential factors that may
limit the gratitude of sick employees whose health does not improve. First, the discovery of illness may

17
increase stress and depression, which have been widely linked to decreased productivity and safety (Kuntz et
al. 2014). Second, as we noted in our theoretical framework, severe health problems may not be easily
addressable in the short-term. Although no employees were diagnosed with a terminal illness, several had
severe, uncontrolled diabetes, extremely high cholesterol, and morbid obesity, problems which likely would
take more than a single year to rectify.
<<< INSERT TABLE 3 HERE >>>
4.1 Specific Health Improvement Mechanisms
We further investigate health improvements for sick workers by looking at how improvements in specific
disease areas impact productivity. Figure 4 plots coefficient estimates for each category of blood test. We limit
reporting to only those employees who were classified as sick in that area, but improved. We emphasize that
“Better” for these employees is defined by a move from abnormal to normal blood test ranges, and not by the
physician scores. These results show that improvements in some disease areas, such as diabetes, electrolytes
or cholesterol, led to large productivity impacts for sick individuals. Looking at the underlying data, it appears
that there were many sick employees who had abnormal blood readings, such as LDL cholesterol in the low
100s or HbA1c readings in the 7s. Many such employees were able to move their blood test results to normal
ranges within a year, and our results indicate that these employees improved their productivity significantly.
Finally, we look at potential mechanisms driving the improvements. For these tests, we primarily use
survey data to identify workers who improve their self-reported behaviors on nutrition, exercise, and stress.
We classify individuals as “Better” in each area if they improve their self-reported survey scores. We
additionally use blood data on HDL cholesterol to measure exercise, as it is directly linked to exercise and
cannot be gamed or misreported. We classify individuals as “Sick” if their score is below the minimum
vendor-communicated threshold for that dimension. The results suggest that productivity gains are driven by
lifestyle improvements in exercise, nutrition, and stress. Figure 5 shows that those with initial low scores on
these dimensions, but who improve, see significant productivity gains. The results also demonstrate that
wellness programs can spur already-healthy employees to make improvements in lifestyle, which directly lead
to productivity increases.
Strikingly, the majority of productivity gains from lifestyle improvements actually accrue to
employees who do not have identified illnesses from the wellness program. Table A3 of the Appendix repeats
the analysis from Figure 5, with employees grouped by the “Sick” and “Better” variables defined by the three
physicians. Although the number of employees in each category is small, the point estimates indicate that
lifestyle improvements by employees who were not sick drive significant productivity gains. These gains are
correlated with lifestyle improvements in stress, exercise and HDL. It is apparent from these results that
many employees without health problems made positive lifestyle changes due to the program, and these
changes drove significant productivity growth for LaundryCo.
<<< INSERT FIGURES 4 AND 5 HERE >>>

18
5. Discussion and Conclusion In this paper we presented predictions for how firms can increase productivity by introducing formal
programs that help employees track health and wellness. We predicted heterogeneous effects on employee
productivity depending on an employee’s pre-existing level of sickness and their post-program improvements
in health. Notably, we explained that firms should not simply focus on enabling sick employees to identify
and mitigate health concerns. Instead we argue that all types of employees can improve their productivity
after the introduction of a wellness program.
While our study did not examine long-term persistence of these effects, we did examine persistence
over the course of a full calendar year, so our effects are unlikely to be generated through a temporary
Hawthorne effect. Still, we caution that some of the productivity gains we observe are the result of a
continued commitment by the firm to support employee wellness. We doubt that long-term gains would be
achieved through a single or short-term intervention.
Our empirical setting has several unique characteristics that make it a natural laboratory for studying
employee health and productivity. First, our quasi-experimental setting and methods provide causal evidence
that builds on previous work that was almost all correlational. Second, our health improvement data includes
both detailed objective medical tests as well as self-reported data. In addition, we used physician health
evaluations to determine true health improvements beyond the objective normal ranges for blood tests.
Third, our paper is the first to use objective productivity data, and important advance over biased self-
reported productivity measures.
5.1 Managerial Implications
Our empirical results demonstrate that the introduction of a corporate wellness program can have a
large impact on employee productivity, and therefore firm profitability. In fact, our estimates suggest that the
return on investment (ROI) in terms of productivity improvements may be even bigger than the ROI of these
programs in terms of reduced absenteeism (273%) and insurance costs (327%). Our results suggest average
productivity increased by 4.80% on average due to the introduction of the program – which is approximately
equal to an extra employee workday per month (assuming 20 working days per month). Conservatively
assuming an hour of productivity is worth $15 to LaundryCo, and that an employee works 220 days a year, a
4.8% productivity increase is worth $1,267. LaundryCo paid $120 per employee to the vendor for the program,
and estimates that it spent another $120 per employee in terms of lost work time (to take the tests, have the
follow-up visits, etc.). The program therefore cost $240 per worker, and the ROI of the program was 528%—
70-100% greater than the ROI of these programs from reduced absenteeism or insurance costs.
This result, while only a rough estimate, suggests that the increases in productivity from corporate
wellness programs are both potentially large and significantly undervalued by the existing literature and firms.
The primary reason this ROI is so high is that already-healthy employees generate productivity gains from the
program, in line with our theory. Our results demonstrate that already-healthy employees whose health does

19
not improve do work harder, consistent with having increased job satisfaction. That the wellness program
positively impacts the productivity of the average employee, regardless of her health level or ability to
improve her health, suggests that the scope for productivity improvement is large.
Our results suggested even larger productivity gains for those whose health improved due to the
program. Notably, there is no difference in the productivity growth for employees who were and were not
identified as “sick” by the program. Again, this suggests that the impact of the program is more widespread
than one might initially think. Indeed, survey results indicate that the wellness program led to lifestyle changes
for employees regardless of sickness levels.
The results also suggest some caution, as one group of employees – those whom the program
identified as sick but whose health did not subsequently improve – did not exhibit the productivity gains seen
by the other three groups. The job satisfaction about which we hypothesized either did not occur, or was
cancelled out by the negative informational shock about and/or subsequent treatment for the indicated
disease. Some employees may receive truly devastating news through a corporate wellness program, such as
the existence of a terminal condition. In our empirical setting, the most serious sicknesses uncovered by the
program involved long-term manageable health conditions such as severe diabetes, obesity and pain, and not
terminal diseases. By focusing on employees who receive news about less serious diseases, we do not mean to
imply that every worker identified as sick via the program will only feel positive emotions.
5.2 Empirical Limitations
Despite its strengths, our empirical setting has two important weaknesses that should be addressed in
future work. First, the number of workers for which we have two years of health and productivity data is
limited (in some regressions only 100), which makes precise estimation of productivity changes for different
subsamples difficult. This problem is particularly acute when attempting to identify the specific health
improvements (e.g., diabetes) that drive productivity gains. Consequently, the imprecision of our coefficients
should not be interpreted as strong evidence of a null effect—we may simply not have enough statistical
power to identify smaller effect sizes. Future work should seek larger organizations where larger samples will
provide improved power and allow possible identification of smaller effects that support (or refute) our
hypotheses.
The second weakness is the endogeneity of wellness program participation as well as the choice to
engage in lifestyle improvements and outcomes such as increased job satisfaction. It could be that employees
who agreed to participate were more likely to view the program in a positive light, and more likely to commit
to lifestyle changes. Indeed, recent work has shown that individual worker differences such as time
discounting or self-control can predict both health and other behavioral dimensions (Gubler and Pierce 2014,
Israel et al. 2014). A true randomized field experiment is a promising approach for future work to address this

20
problem. We do note, however, that 85% of employees in the four participating plants chose to participate, as
we include a fifth control plant, so we expect selection effects to be minor.
5.3 Theoretical Boundary Conditions
Although our empirical setting demonstrates how wellness programs can improve productivity, two
important program design elements define boundary conditions for such improvements. First, program
participation by employees cannot be compulsory or heavily coerced through social pressure or financial
penalties, since such pressure might induce psychological reactance. Psychological reactance theory (Brehm
1966) argues that individuals strongly react to external influence that they perceive to restrict their autonomy.
Programs such as wellness initiatives that threaten worker autonomy through social pressure, strong
incentives, or prohibitions might motivate employees to assert their autonomy either through resisting the
program or even through reduced productivity. Indeed, public health scholars argue that strong incentives
and requirements in wellness programs can produce negative effects through psychological reactance (Dowd
2002), since employees view health and lifestyle choices as outside their work domain. The program in our
empirical setting was both voluntary and only weakly incentivized.
Second, employees must trust that the firm will respect the privacy of employee health data and not
use it for employment-related purposes. HIPAA regulations in the United States forbid firms from accessing
employee health and wellness data that is collected through group health plans. However, data from
employer-run wellness programs may be legally accessible. While firms cannot legally use these data for
employment decisions, and must formally separate program administration from other human resource
functions, employees may not trust the firm to observe this prohibition. Firms must not only observe these
regulations, but also communicate and demonstrate this compliance for credibility with employees.
Employees who mistrust the firm’s use of private health data might view the wellness program as violating a
broader psychological contract that governs their overall relationship and influences their individual day-to-
day actions (Rousseau 1990). This perceived abrogation by the employer of a part of this implicit contract
could reduce overall job motivation, satisfaction, and retention among those who strongly value health
privacy.

21
References
Adams G, Flynn F, Norton M (2012) The gifts we keep on giving: Documenting and destigmatizing the regifting taboo. Psychological Science, 23(10): 1145-1150.
Agle BR, Mitchell RK, Sonnenfeld JA (1999) Who matters to CEOs? An investigation of stakeholder attributes and salience, corporate performance, and CEO values. Academy of Management Journal, 42(5): 507–525.
Aguilera RV, Rupp DE, Williams CA, Ganapathi J (2007) Putting the S back in corporate social responsibility: A multilevel theory of social change in organizations. Academy of Management Review, 32(3): 836–863.
Armeli S, Eisenberger R, Fasolo P, Lynch P (1998) Perceived organizational support and police performance: The moderating influence of socioemotional needs. Journal of Applied Psychology, 83(2): 288.
Baicker K, Cutler D, Song Z (2010) Workplace wellness programs can generate savings. Health Affairs, 29(2): 304-311.
Barnett ML, Salomon RM (2006) Beyond dichotomy: The curvilinear relationship between social responsibility and financial performance. Strategic Management Journal, 27(11): 1101–1122.
Bartlett MY, DeSteno D (2006) Gratitude and prosocial behavior helping when it costs you. Psychological Science, 17(4): 319-325.
Becker GS (2007) Health as human capital: synthesis and extensions. Oxford Economic Papers, 59(3): 379–410. Bernstein ES (2012) The transparency paradox a role for privacy in organizational learning and operational
control. Administrative Science Quarterly 57(2): 181-216. Berry L, Mirabito AM, Baun WB (2010) What's the hard return on employee wellness programs? Harvard
Business Review, December: 2012-68. Blau PM (1964) Exchange and power in social life (Transaction Publishers). Boles M, Pelletier B, Lynch W (2004) The relationship between health risks and work productivity. Journal of
Occupational and Environmental Medicine, 46(7): 737-745. Brehm JW (1966) A Theory of Psychological Reactance (Academic Press, New York). Buell RW, Kim T, Tsay CJ (2016) Creating reciprocal value through operational transparency. Management
Science. Forthcoming. Burbano V (2016) Social responsibility messages and worker wage requirements: Field experimental evidence
from online labor marketplaces. Organization Science. Forthcoming. Burton WN, Chen CY, Conti DJ, Schultz AB, Pransky G, Edington DE (2005) The association of health
risks with on-the-job productivity. Journal of Occupational and Environmental Medicine, 14(8): 767–777. Carmeli A, Gilat G, Waldman DA (2007) The role of perceived organizational performance in organizational
identification, adjustment and job performance. Journal of Management Studies, 44(6): 972–992. Carnahan S, Kryscynski D, Olson D (2016) How corporate social responsibility reduces employee turnover:
Evidence from attorneys before and after 9/11. Working paper. Chan TY, Li J, Pierce L (2014) Compensation and peer effects in competing sales teams. Management
Science 60(8): 1965-1984. Chapman LS (2012) Meta-evaluation of worksite health promotion economic return studies: 2012 update.
American Journal of Health Promotion, 26(4): TAHP-1. Chatterji AK, Levine DI, Toffel MW (2009) How well do social ratings actually measure corporate social
responsibility? Journal of Economics & Management Strategy, 18: 125-169. Christian MS, Eisenkraft N, Kapadia C (2015) Dynamic associations among somatic complaints, human
energy, and discretionary behaviors experiences with pain fluctuations at work. Administrative Science Quarterly, 60(1): 66-102.

22
Center for Disease Control (2014) Diabetes Public Health Resource. Available at: http://www.cdc.gov/diabetes/statistics/incidence/fig1.htm
Conti G, Heckman J, Urzua S (2010) The education-health gradient. American Economic Review, 100(2): 234–238.
Currie J, Madrian BC (1999) Health, health insurance and the labor market: Chapter 50. In Orley C. Ashenfelter and David Card, ed. Handbook of labor economics. Elsevier, 3309–3416.
Cuypers I, Koh S, Wang H (2016) Sincerity in Corporate Philanthropy, Stakeholder Perceptions and Firm Value. Organization Science, 27(1): 173-188.
Dabos GE, Rousseau DM (2004) Mutuality and reciprocity in the psychological contracts of employees and employers. Journal of Applied Psychology, 89(1): 52.
Dai H, Milkman KL, Hofmann DA, Staats BR (2015) The impact of time at work and time off from work on rule compliance: The case of hand hygiene in health care. Journal of Applied Psychology 100(3): 846.
Danna K, Griffin RW (1999) Health and well-being in the workplace: A review and synthesis of the literature. Journal of Management, 25(3): 357-384.
Dowd ET (2002) Psychological reactance in health education and promotion. Health Education Journal, 61(2): 113-124.
Eddy D, Clanton C (1992) The art of diagnosis: solving the clinicopathological exercise. New England Journal of Medicine, 306(21): 1263-1268.
Eisenberger R, Armeli S, Rexwinkel B, Lynch PD, Rhoades L (2001) Reciprocation of perceived organizational support. Journal of Applied Psychology, 86(1): 42.
Flammer C (2015) Does corporate social responsibility lead to superior financial performance? A regression discontinuity approach. Management Science, 61(11): 2549-2568.
Flammer C, Luo J (2016) Corporate social responsibility as an employee governance tool: Evidence from a quasi-experiment. Strategic Management Journal. Forthcoming
Gallup-Healthways (2012) Well-being Index. Available at: http://www.healthways.com/solution/default.aspx?id=1125 [accessed December 9, 2012]
Gertler PJ, Martinez S, Premand P, Rawlings LB, Varmeersch CMJ (2011) Impact evaluation in practice (World Bank Publications).
Glavas A, Piderit SK (2009) How does doing good matter? Effects of corporate citizenship on employees. Journal of Corporate Citizenship, 36: 51–70.
Goetzel RZ, Hawkins K, Ozminkowski RJ, Wang S (2003) The health and productivity cost burden of the “Top 10” physical and mental health conditions affecting six large U.S. employers in 1999. Journal of Occupational and Environmental Medicine, 45(1): 5–14.
Goldstein SM (2003) Employee development: an examination of service strategy in a high-contact service environment. Production and Operations Management 12(2): 186-203.
Grant AM, Gino F (2010) A little thanks goes a long way: Explaining why gratitude expressions motivate prosocial behavior. Journal of Personality and Social Psychology, 98(6): 946.
Grant AM, Christianson M, Price R (2007) Happiness, health, or relationships? Managerial practices and employee well-being tradeoffs. Academy of Management Perspectives, 21(3): 51-63.
Gubler T, Larkin I, Pierce L (2016) Motivational spillovers from awards: Crowding out in a multitasking environment. Organization Science 27(2): 286-303.
Gubler T, Pierce L (2014) Healthy, wealthy, and wise: Retirement planning predicts employee health improvements. Psychological Science, 25(9): 1822-1830.
Hekman DR, Bigley GA, Steensma HK, Hereford JF (2009) Combined effects of organizational and professional identification on the reciprocity dynamic for professional employees. Academy of Management Journal, 52(3): 506-526.

23
Huckman RS, Staats BR (2011). Fluid tasks and fluid teams: The impact of diversity in experience and team familiarity on team performance. Manufacturing & Service Operations Management 13(3): 310-328.
Israel S, Caspi A, Belsky D, Harrington H, Hogan S, Houts R, Ramrakha S, Sanders S, Poulton R, Moffitt T (2014) Credit scores, cardiovascular disease risk, and human capital. Proceedings of the National Academy of Sciences, 111(48): 17087-17092.
Jones DA (2010) Does serving the community also serve the company? Using organizational identification and social exchange theories to understand employee responses to a volunteerism programme. Journal of Occupational and Organizational Psychology, 83(4): 857–878.
Kahneman D, Knetsch JL, Thaler RH (1986) Fairness and the assumptions of economics. Journal of Business, S285-S300.
Kaiser/HRET (2012) Survey of Employer-Sponsored Health Benefits, 1999-2009. Available at: http://www.hret.org/reform/projects/employer-health-benefits-annual-survey.shtml
KC DS (2013) Does multitasking improve performance? Evidence from the emergency department. Manufacturing & Service Operations Management 16(2): 168-183.
Kitzmueller M, Shimshack J (2012) Economic perspectives on corporate social responsibility. Journal of Economic Literature, 50(1): 51–84.
Kroboth F, Hanusa B, Parker S, Coulehan J, Kapoor W, Brown F, Karpf M, Levey S (1992) The inter-rater reliability and internal consistency of a clinical evaluation exercise. Journal of General Internal Medicine, 7(2): 174-179.
Kuntz L, Mennicken R, Scholtes S (2014) Stress on the ward: Evidence of safety tipping points in hospitals. Management Science 61(4): 754-771.
Lee JJ, Gino F, Staats BR (2014) Rainmakers: Why bad weather means good productivity. Journal of Applied Psychology, 99(3): 504.
Margolis JD, Walsh JP (2003) Misery loves companies: rethinking social initiatives by business. Administrative Science Quarterly, 48: 268-305.
Medical Billing and Coding (2012) Available at: http://www.medicalbillingandcoding.org/blog/12-companies-with-seriously-impressive-corporate-wellness-programs/
NCHS (2012) NCHS Data Brief No. 82. Available at: http://www.cdc.gov/nchs/data/databriefs/db82.pdf Neumann W, Dul J (2010) Human factors: spanning the gap between OM and HRM. International Journal of
Operations & Production Management 30(9): 923-950. Ødegaard F, Roos P (2014) Measuring the Contribution of Workers' Health and Psychosocial Work-
Environment on Production Efficiency. Production and Operations Management 23(12): 2191-2208. Orlitzky M, Schmidt FL, Rynes SL (2003) Corporate social and financial performance: A meta-analysis.
Organization Studies, 24: 403-441. Parks KM, Steelman LA (2008) Organizational wellness programs: A meta-analysis. Journal of Occupational
Health Psychology, 13(1): 58. Podsakoff PM, MacKenzie SB, Lee JY, Podsakoff NP (2003) Common method biases in behavioral research:
a critical review of the literature and recommended remedies. Journal of Applied Psychology, 88(5): 879. Rousseau DM (1990) New hire perceptions of their own and their employer’s obligations: A study of
psychological contracts. Journal of Organizational Behavior, 11: 389-400. Song H, Tucker A, Murrell K, Vinson D (2016) Public relative performance feedback in complex service
systems: Improving productivity through the adoption of best practices. HBS Working Paper No. 16-043. Staats BR, Dai H, Hofmann D, Milkman KL (2016) Motivating process compliance through individual
electronic monitoring: An empirical examination of hand hygiene in healthcare. Management Science. Forthcoming
Staats BR, Gino F (2012) Specialization and variety in repetitive tasks: Evidence from a Japanese bank. Management Science 58(6): 1141-1159.

24
Stewart WF, Ricci JA, Chee E, Morganstein D (2003) Lost productive work time costs from health conditions in the United States: Results from the American productivity audit. Journal of Occupational and Environmental Medicine, 45(12): 1234-1246.
Tan TF, Netessine S (2014) When does the devil make work? An empirical study of the impact of workload on worker productivity. Management Science 60(6): 1574-1593.
Tan TF, Netessine S (2015) When You Work with a Super Man, Will You Also Fly? An Empirical Study of the Impact of Coworkers on Performance. Working Paper.
Tesser A, Gatewood R, Driver M (1968) Some determinants of gratitude. Journal of Personality and Social Psychology, 9(3): 233.
Thayer RE, Newman JR, McClain TM (1994) Self-regulation of mood: strategies for changing a bad mood, raising energy, and reducing tension. Journal of Personality and Social Psychology, 67(5): 910.
Ton Z. (2014). The good jobs strategy: How the smartest companies invest in employees to lower costs and boost profits. Houghton Mifflin Harcourt.
Tsang JA (2006) Gratitude and prosocial behaviour: An experimental test of gratitude. Cognition & Emotion, 20(1): 138-148.
Turban DB, Greening DW (1997) Corporate social performance and organizational attractiveness to prospective employees. Academy of Management Journal, 40(3): 658–672.
Vallgårda S (2012) Nudge: A new and better way to improve health? Health Policy, 104(2):200-203. Wang H, Qian C (2011) Corporate philanthropy and corporate financial performance: The roles of
stakeholder response and political access. Academy of Management Journal. 54(6):1159–1181. Weber L (2014) Wellness programs get a health check, The Wall Street Journal, Available at:
http://www.wsj.com/articles/wellness-programs-get-a-health-check-1412725776 Yee RW, Yeung AC, Cheng TE (2008) The impact of employee satisfaction on quality and profitability in
high-contact service industries. Journal of Operations Management 26(5): 651-668. Zoller HM (2004) Manufacturing health: Employee perspectives on problematic outcomes in a workplace
health promotion initiative. Western Journal of Communication 68(3): 278-301.
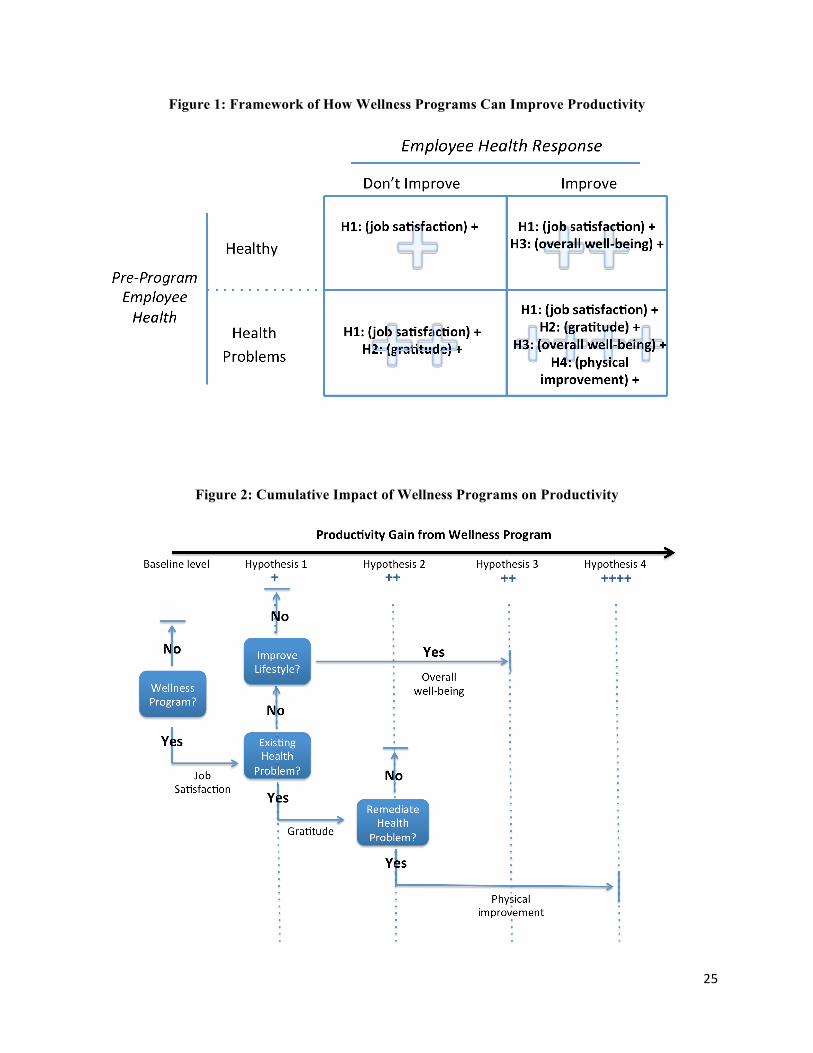
25
Figure 1: Framework of How Wellness Programs Can Improve Productivity
Figure 2: Cumulative Impact of Wellness Programs on Productivity

26
Figure 3: Visits by Wellness Program Administrator to LaundryCo
Figure 4: Abnormal Blood Results for Sick Who Improved
Note: Diamonds represent coefficient estimates for each specific blood abnormality category following the main specification outlined in the estimation section. Models are estimated using OLS with clustered standard errors at the individual level. “Sick” is defined as having an abnormal blood test in specific blood category. “Better” is defined as resolving all abnormal blood tests in a specific blood category. Coefficient estimates are plotted for sick individuals that get better (“Better” equal to 1).

27
Figure 5: Abnormal Blood Results for Sick Who Improved
Note: Diamonds represent coefficient estimates for each specific category following the main specification outlined in the estimation section. Models are estimated using OLS with clustered standard errors at the individual level. “Sick” is defined as having a nutrition score <50, hdl cholesterol <=39, not exercising, and reporting a stress signal. “Better” is defined as positive improvements on a given category. Coefficient estimates are plotted for sick individuals that improve (“Better” equal to 1).
Table 1: Descriptive Statistics at Worker/day Level
Variable Count Mean Sd Min Max efficiency 52299 125.83 31.60 24.67 264.10 post period 52299 0.47 0.50 0 1 month(continuous) 52299 17.64 10.05 0 42 year 52299 2009 0.87 2009 2012 participant 52299 0.52 0.50 0 1 sick (doctor measure) 52299 0.33 0.47 0 1 better (doctor measure) 52299 0.14 0.35 0 1 better (doctor group measure) 52299 0.17 0.37 0 1 better exercise days 52299 0.21 0.41 0 1 better hdl 52299 0.35 0.48 0 1 better nutrition score 52299 0.12 0.33 0 1 better stress signals 52299 0.13 0.33 0 1 N 52299

28
Table 2: Correlations for Primary Variables
efficiency
post period participant sick better
better (group)
better exercise
better hdl
better nutrition
better stress
efficiency 1.00 post period 0.04 1.00
participant 0.03 0.03 1.00 sick -0.13 0.04 0.67 1.00
better 0.00 0.02 0.39 0.20 1.00 better (group) -0.03 0.03 0.43 0.29 0.91 1.00
better exercise 0.08 -0.03 0.50 0.28 0.34 0.29 1.00 better hdl 0.03 0.03 0.71 0.52 0.19 0.23 0.40 1.00
better nutrition -0.02 0.00 0.36 0.00 0.30 0.32 0.11 0.38 1.00 better stress -0.02 0.00 0.37 0.16 0.33 0.28 0.16 0.12 0.24 1.00
Table 3: Health Change Regression Results, Total Effects
(1) (2) Dependent Variable Efficiency Efficiency Model OLS OLS Health Assessment Independent Doctors Collective Doctor Scale Post -4.304 -4.381
(3.675) (3.689)
Participant x Post (H1) 9.060*** 8.601**
(3.429) (3.464) Participant x Post x Sick (H2) -1.707 -1.849
(3.361) (3.774) Participant x Post x Better (H3) 13.271** 13.269**
(6.335) (6.599) Participant x Post x Sick x Better (H4) 12.305** 9.021*
(5.875) (4.679)
Plant time trends Y Y Fixed effects Y Y R2 0.464 0.463 # of employees 111 111 Observations 52299 52299 Sick cutoff 3 doctors 3 doctors Robust standard errors in parentheses, clustered by individual. The dependent variable is daily worker efficiency. Column 1 defines “sick” individuals using each physician’s evaluation. All three physicians must specify an individual as “sick” for sick to take the value of 1. Results are robust to a cutoff of 2 physicians specifying sickness. “Better” uses the average of the physician’s evaluations on improvement (Q4 in the Physician Evaluation Questionnaire), and takes the value of 1 if the average indicates improvement (>3 on the Q4 5-point scale). For Column 2, “sick” is defined the same as column 1, but better uses the collective physician scoring system. Under this system, “Better” is defined as an improved score between the first and second time participating. * p<0.10 ** p<0.05 *** p<0.01

29
Appendix
A1. Physician Evaluation Questionnaire
Please answer the following questions for each line in the data. Please note that question 4 will only apply to instances where the employee (identified by the “employee id” variable) is a repeat participant (also specified by participation_id). The columns “Survey_q1, Survey_q1_response, Survey_q2, Survey_q3, and Survey_q4” have been created for answers to each of the questions.
1. Do you believe this employee likely has one or more medical conditions? If yes, list any such conditions. Note: Just a best guess for the basic medical condition; doesn’t have to be definitive. Please put a “yes” or a “1” in Survey_q1 for each observation if they have one or more medical conditions.
2. Considering each employee's medical condition(s) and state of general health as determined by laboratory and survey data, how seriously ill is the employee? (1=not very sick for the condition(s); 5=very sick for the condition(s)) Note: Given the data, this is your professional opinion to how sick the patient is. This may differ slightly from the total score resulting from the scoring system depending on how you weight the profile as a whole.
3. How much do you think each employee's general state of health would impact his/her ability to carry out an 8-hour job involving manual labor? (1=very little; 5=considerably) Note: This question is focused on how employee health will impact short-term productivity. This is more specific than question 2, as question 2 more broadly focuses on general wellness (some of which may not immediately impact productivity).
4. How much did the employee's health improve from the last set of tests? (1=worsened considerably, 2=worsened a little, 3=the same, 4=improved a little, 5=improved considerably) Note: Again, given the data, this is your professional opinion. This may coincide or differ from the change in the total score from the scoring system, depending on how you weight the improvements in the profile as a whole.

30
A2. Physician Parameters and Scoring System Survey Questions: -Question 4: +1 pts for each medical problem and taking medication. +0 pts if not taking medication. If a person is not taking a medication for his/her medical problems, we think its safe to assume the medical problem is not affecting their productivity or ability to complete routine daily tasks -Question 5: +1 pts for each symptom -Question 6: +1 pts for moderate pain, +2 pts for severe pain, +3 pts for very severe pain. +0 pts for none, very mild or mild pain. -Question 7: +1 pts for a little bit of limitation, +2 pts for some limitation, +3 pts for quite a bit of limitation, +4 pts for could not do daily work, +0 pts for none at all -Question 8: +1pts for quite a bit of limitation, +2 pts for extremely limited, +0 pts for none at all, slightly or moderately limited -Question 9: +1 pts for quite a bit of limitation, +2 pts for extremely limited, +0 pts for none at all, slightly or moderately limited -Question 10: +2 pts for each activity limited a lot, +1 pts for each activity limited a little -Question 11: +1 pts for patients who exercise <5 days per week -Question 20: +1 for 15-20 drinks/wk, +2 for 21 or more drinks/wk -Question 22: +1 pts for quit smoking <2 yrs, +1 cigar/pipe, +1 smoke <10 cigs/day, +2 smoke >10 cigs/day -Question 23: +1 pts for chewing tobacco
Labs: A1c: +1 pts for A1c of 6.5-7.0. +2 pts for A1c>7.0 Albumin: +1 pts for albumin <3.6 TSH: +1 pts for TSH>4.5 or <.45 Hgb: +1 pt for hgb <12.5, +2 pts for hgb <10, +3 pts for Hgb<8 CRP: +1 pts for CRP>3 Total Cholesterol: +1 pts for t.chol>250, +2 for t.chol >500 HDL: +1 pts for HDL<35 LDL: +1 pts for LDL>190 BMI>40: +2 pts, BMI>30: +1 pts, BMI<30: 0 pts BP>140/90: +1 pts
Lowest Possible Score: 0 pts Highest Possible Score: 50 pts

31
Figure A3: Lifestyle Changes and Efficiency by “Sick” and “Better”
-20
020
4060
Perfo
rman
ce Im
prov
emen
t
Stress Coefficient Estimate Exercise Coefficient EstimateHDL Coefficient Estimate 95% Confidence Intervals
DoctorSickDiagnosis SICK SICK NOTSICKNOTSICK SICK SICK NOTSICKNOTSICKDoctorBetterDiagnosisNOTBETTERBETTER NOTBETTERBETTERNOTBETTERBETTERNOTBETTERBETTER
LifestyleImprovement? YES YES YES YES NO NO NO NO
Perfo
rmanceIm
provem
ent
Note: Effect of lifestyle improvements shown for each possible combination of “sick” and “better” groupings. Lifestyle improvement indicates health improvement on either stress, HDL cholesterol, or exercise. Coefficient estimates represent efficiency regressed on the interaction between each lifestyle improvement, sick, and better.