why do we work? empirical evidence on work...
TRANSCRIPT

Electronic copy available at: http://ssrn.com/abstract=2481153
1
Why Do We Work? Empirical Evidence on Work Motivation and the Effects of
Management Control System Design on Work Motivation
Clara Xiaoling Chen
Associate Professor of Accountancy
University of Illinois at Urbana-Champaign
Jeremy B. Lill
Ph.D. Student in Accountancy
University of Illinois at Urbana-Champaign
Thomas W. Vance
Assistant Professor of Accountancy
University of Illinois at Urbana-Champaign
August 2014
Acknowledgements: We thank Romana Autrey, Tim Brown, Deni Cikurel, Elena Klevsky, Jon
Lill, Sarah Lill, Linden Lu, Tracie Majors, and Jennifer Nichol for helpful comments on earlier
versions of the survey instrument. We also thank Lan Guo and participants at the 2014 Midwest
Doctoral Research Conference for helpful comments on the paper.

Electronic copy available at: http://ssrn.com/abstract=2481153
2
Why Do We Work? Empirical Evidence on Work Motivation and the Effects of
Management Control System Design on Work Motivation
Abstract
Building on the concept of perceived locus of causality (PLOC), this study examines: 1)
whether individual work motivation can be classified with the four orientations in the PLOC
framework: intrinsic, identified, introjected, and external; 2) the effects of management
control system design choices on each motivational orientation; 3) and the consequences of
each motivational orientation on employee behavior. Results from on an online survey of
592 U.S. employees from diverse industries and professions include the following: First, we
develop and validate a scale of PLOC work motivation (PLOC-WM) and find that the four
motivational orientations are distinct from each other and respondents are differentiated by
the form of motivation they expressed. Second, we find that management control systems
influence individual motivational orientations, incremental to individual personality effects.
Finally, we find that motivational orientations have significant impact on individual self-
reported effort, creativity, organizational identification, organizational citizenship behavior,
and turnover intentions. We make a methodological contribution by developing and
validating a scale of PLOC work motivation, which goes beyond the traditional
intrinsic/extrinsic dichotomy and recognizes a richer range of motivation orientations. The
scale we develop and the empirical evidence we provide on the links between control system
design, motivation orientation and employee behavior will advance future accounting
research on work motivation.
Keywords: Motivation; Perceived Locus of Causality; Management Control; Control
Systems; Motivation Orientations
Data Availability: Data available for replication purposes upon request
Electronic copy available at: http://ssrn.com/abstract=2481153
1
Why Do We Work? Empirical Evidence on Work Motivation and the Effects of
Management Control System Design on Work Motivation
An old story tells of three stonecutters who were asked what they were doing. The first replied,
“I am making a living.” The second kept on hammering while he said, “I am doing the best job
of stonecutting in the entire country.” The third one looked up with a visionary gleam in his eyes
and said, “I am building a cathedral.”
----Parable of the Three Stonecutters from The Practice of Management by Peter Drucker (1954)
I. INTRODUCTION
Understanding what motivates employees is fundamental to the design of management
control systems. Prior research on work motivation has largely focused on the dichotomy
between intrinsic motivation and extrinsic motivation. More recent work, however, recognizes a
richer range of motivational orientations. In particular, building on the concept of perceived
locus of causality (PLOC), more recent work highlights a continuum of motivation comprised of
intrinsic, identified, introjected motivation, and external motivation (e.g. Adler and Chen 2011;
Guo, Wong-On-Wing, and Lui 2013; Wong-On-Win, Guo and Lui 2010). Intrinsic motivation
refers to doing something purely for its inherent enjoyment; identified motivation refers to doing
something due to its alignment with one’s own values or goals; introjected motivation refers to
doing something to avoid guilt or shame or concerns about social approval; and external
motivation refers to doing something to obtain reward or avoid punishment.
Adler and Chen (2011) consider the PLOC framework in an accounting setting, focusing
on the important role identified motivation can play in settings that require both creativity and
coordination. In practice, because many employees perform unchallenging and boring work,
which is unlikely to induce intrinsic motivation, identified motivation is a promising
motivational orientation that could potentially lead to high level of organizational commitment.
Recent proposal of the so-called “Purpose Economy” (which includes finding purpose and
2
meaning in one’s work) in the popular press (Hurst 2014) echoes this sentiment. However, two
factors make it unclear whether identified motivation is sustainable in the business world (Adler
and Chen 2011). First, divergence of interests between employees and the firm means that
managers often have to make trade-offs between firm profit and employee welfare; second,
frequent changing of jobs in today’s workplace makes it difficult for employees to identify with
a given organization or any broader social goals in one’s work. Empirical research is required to
explore whether identified motivation plays an important role in the workplace and, if it does,
how it may be cultivated via management control features.
At this point, there is neither a scale available to assess the range of work motivational
orientations in the PLOC nor empirical evidence of the effects of management control system
design on these work motivational orientations, particularly identified motivation. In this study,
we fill the gap in the literature by examining the following three research questions:
(1) Can individual work motivation be classified into the four categories in the PLOC
framework: intrinsic motivation, identified motivation, introjected motivation, and external
motivation?
(2) How are the four different types of individual work motivation influenced by
management control system design?
(3) What are the consequences of the four different types of individual work motivation,
including employee creativity, organizational citizenship behavior and turnover intentions?
To answer our research questions, we conduct a survey of 592 workforce participants.1
The choice of a survey study is based on several considerations. First, there were no publicly
available data sets containing the constructs we are interested in studying. Second, we ask
1 By workforce participant, we mean individuals who either currently have a job or those who are currently
unemployed but have been employed in the past.

3
participants for private information including personality questions, firm performance questions,
and managerial control system design questions. This data tends to be shared more freely when it
is provided with anonymity, which is easily achieved using the survey method. Finally, we are
interested in making inferences about the general workforce population. Using the survey
method allowed us to draw a sample that was well-representative of the population we wish to
study.
Our survey was web-based and distributed to participants through Amazon Mechanical
Turk (hereafter AMT). As described in Rennekamp (2012), AMT is an Internet labor market that
allows “Requesters” to create “Human Intelligence Tasks” and pay participants for completing
those tasks. AMT has become popular with social scientists due to the ready access to a large
participant pool that is at least as representative of the U.S. population as other subject pools
(Berinsky, Huber, and Lenz 2012; Horton, Rand, and Zeckhauser 2011; Paolacci, Chandler, and
Ipeirotis 2010). AMT is particularly suitable for our study because we seek a representative
sample of the U.S. population.
With respect or our first research question, we find all four PLOC orientations are well
differentiated in our survey responses, suggesting that we can reliably classify individual work
motivation with the four categories in the PLOC framework: intrinsic motivation, identified
motivation, introjected motivation, and external motivation. Our analysis of the correlational
structure among the different categories is largely consistent with the proposed PLOC
continuum; however our results suggest that the order of introjected and external orientations
could be reversed. In addition, we find that all four orientations are positively correlated,
suggesting that there is not a linear trade-off between motivation orientations. That is, higher
overall motivation could be achieved via orientations not adjacent on the continuum.

4
Regarding our second research question, we find that management control system
elements have significant effects on the four motivational orientations. We focus on the two
motivational orientations on the internal end of the continuum, which potentially afford the
biggest benefits to organizational performance: intrinsic motivation and identified motivation.
We find that non-financial rewards and subjective performance evaluation are both associated
with higher levels of intrinsic and identified motivation. We also find a focus on the belief
component of the levers of control (i.e., the focus of a firm on its mission statement and core
values) is associated with higher levels of identified motivation. Somewhat surprisingly, we find
that higher levels of penalties are associated with a higher level of identified motivation. We
conjecture this could be due to the penalties being a mechanism that forces those who do not
identify with the company to self-select out of the company. In addition, we find that pay-for-
performance sensitivity is positively associated with intrinsic motivation. This result suggests
that high-powered incentives in work settings do not necessarily undermine motivation. We also
find that corporate social responsibility (CSR) activities are associated with higher levels of all
motivation orientations and these activities have the strongest association with identified
motivation.
Finally, with respect to our third research question, we find that motivational orientations
have significant impact on employee creativity, employees’ organizational citizenship behavior,
and employee turnover. Specifically, we find that intrinsic motivation is associated with higher
employee creativity while both intrinsic and identified motivational orientations are associated
with higher organizational citizenship behavior and lower employee turnover. We also find that
introjected motivation has the opposite effects. That is, introjected motivation is associated with
higher employee turnover and lower employee organizational citizenship behavior and creativity.

5
We make several contributions to the literature on motivation and management control
systems. First, we make a methodological contribution by developing and validating a scale of
PLOC work motivation, the PLOC-WM. This framework recognizes a richer range of work
motivation and our empirical scale may be used to advance future research on motivation in
managerial accounting settings. Second, we provide the first empirical evidence of the effects of
management control system design on motivational orientation. By doing so, we provide
empirical evidence consistent with some of the propositions in Adler and Chen (2011). Third,
we contribute to the growing accounting literature on creativity by providing empirical evidence
that intrinsic motivation facilitates employee creativity, while introjected motivation (motivation
driven by guilt and obligation) is detrimental to creativity. Finally, we also add to the literature
on CSR (e.g. Balakrishnan, Sprinkle, and Williamson 2011; Martin and Moser 2012) by showing
that corporate social responsibility (CSR) activities can induce intrinsic and identified motivation
Our study also has important practical implications. A better understanding of work
motivation can help organizations design better management control systems to influence the
antecedents of employee motivational orientations. For instance, the PLOC-WC scale we
develop could be used by organizations to assess the motivational orientations of employees
periodically and design management control systems to foster intrinsic and identified motivation.
Our results that show differences in work motivational orientations across generation, gender,
profession, and industry yield insights into ways organizations can customize control systems
based on the demographics and industry of an organization.
The remainder of the paper is organized as follows. Section II discusses our research
questions and theory. Section III discusses our research method, variable definitions, and model
specifications. Section IV presents the results and Section V concludes.
6
II. THEORY AND RESEARCH QUESTIONS
The earlier work on motivation often assumed a polarization of intrinsic and extrinsic
forms of motivation (e.g., Heider 1958; deCharms 1968). However, in practice, because many
employees perform unchallenging and boring work, which is unlikely to induce intrinsic
motivation, the traditional intrinsic/extrinsic dichotomy has limited applicability to work
motivation. Ryan and Connell (1989) challenged this polarization of intrinsic and extrinsic forms
of motivation by defining two intermediate forms of motivation and reconceptualizing perceived
locus of causality (PLOC) as a continuum of autonomy that corresponds to four types of
motivation ranged from intrinsic, to identified, to introjected, and finally to external. Intrinsic
motivation refers to doing something purely for its inherent enjoyment; identified motivation
refers to doing something due to its alignment with one’s own values or goals; introjected
motivation refers to doing something to avoid guilt or shame or concerns about social approval;
external motivation refers to doing something to avoid punishment or to comply with rules. Ryan
and Connell (1989)’s survey of 355 children from grades 3-6 in an elementary school supported
the proposed PLOC continuum.
More recent theoretical work on motivation also highlights the limitations of the
dichotomy between intrinsic and extrinsic motivation and acknowledges the greater applicability
of the PLOC continuum to work motivation (Gagne and Deci 2005). In particular, Adler and
Chen (2011) apply the PLOC framework to the accounting context and acknowledge the
important role identified motivation can play in settings that require both creativity and
coordination. However, as pointed out in Adler and Chen (2011), due to the inherent divergence
of interests between employees and the firm and increasing fluidity in the workplace, it is unclear
whether identified motivation is sustainable in the business world of businesses. Therefore, it is

7
not clear whether identified motivation plays an important role in the workplace and empirical
research is called for.
Adler and Chen (2011) present hypothesized descriptions for the PLOC work motivation
continuum. For example, extrinsic motivation is illustrated by “I need the pay, so I’ll try to meet
any target they set, but don’t expect me to go beyond that”; introjected motivation is described as
“I don’t want to disappoint my boss”; identified motivation is illustrated by “I value my work
and I think it is important to do it well”; and intrinsic motivation is described as “I love the
creative problem solving I get to do here” (see Table 1 in Adler and Chen 2011). Adler and Chen
(2011) also use quotations from Terkel’s (1972) interviews with working people about their jobs
to illustrate the four motivational orientations based on the PLOC continuum (see Table 1 in
Adler and Chen 2011). Although these illustrative quotations from Terkel’s (1972) interviews
suggest the existence of the four types of motivational orientations based on the PLOC
continuum, this evidence is anecdotal at best, and there is neither a scale available to assess the
richer range of individuals’ work motivation nor empirical evidence of the applicability of this
framework to work motivation. This discussion leads to our first research question:
Research Question 1: Can individual work motivation be classified into the four categories in
the PLOC framework?
Although motivational orientations are to some extent stable individual dispositions or
personality traits (Deci & Ryan 1985; Gottfried, 1990; Koestner, Losier, Vallerand, & Carducci,
1996), situational factors such as management control system design also play an important role
in shaping employees’ motivational orientations (Alder & Chen, 2011; Van Maanen & Schein,
1979). For example, socialization experiences in an organization can change the habitual

8
motivational orientations of new employees in the organization (Van Maanen & Schein, 1979).
Therefore, we expect management control system design to influence motivational orientations.
Early work by motivation theorists often argues that performance-based incentives are
likely to reduce intrinsic motivation (“crowding out”) (e.g. Deci, 1975; Deci & Ryan, 1985).
However, this assumption has been challenged by more recent work. For example, Kunz and
Pfaff (2002)’s comprehensive review of the theoretical and empirical evidence on the crowding-
out effects of performance-based pay suggests that the empirical evidence was rather mixed.
Kunz and Pfaff (2002) also suggest that the crowding-out effect will only occur when four
conditions are met: (1) high level of initial task interest, (2) lack of control during the
undermining phase, (3) exclusion of performance improvement, and (4) rewards were
situationally inappropriate. Kunz and Pfaff (2002) convincingly show that these conditions are
seldom present or easily avoidable in work settings. A growing body of research argues that the
effect of external controls on motivational orientations depends on the nature of those external
controls, and especially whether they are perceived as informative or as coercive (Adler, 1993;
Amabile, 1996; Bonner, Hastie, Sprinkle, & Young, 2000; Gagne & Deci, 2005). Thus, we do
not expect management control systems to automatically lead to motivational orientations on the
external end of the PLOC continuum.
Recent accounting studies provide empirical evidence suggesting that well-designed
management controls that are perceived as informative can increase motivation of employees and
boost performance of an organization. For example, Ahrens and Chapman (2004) show that their
research site (a restaurant) achieved an enabling bureaucracy by highlighting the formalized
procedures as guidelines and stressing the need to support the creativity and commitment of
employees. Jorgensen and Messner (2009)’s in-depth field study carried out in a manufacturing
9
organization demonstrates how several formal rules and procedures are used to control the
development process and enable engineers to work more effectively in new product
development. Using a laboratory experiment, Chen, Williamson, and Zhou (2012) find that,
while individual-based (intragroup) tournament pay had no effect on group creativity, group-
based (intergroup) tournament pay had a positive effect on group creativity by inducing greater
identification with group objectives.
Besides traditional features of management control systems, we also examine the effect
of corporate social responsibility (CSR) activities on employees’ motivational orientations. In an
organizational context, leaders who convey the importance of tasks and highlight the meaning of
work in a broader context are more likely to promote both intrinsic and identified motivation of
employees. Consistent with this, Balakrishnan, Sprinkle, and Williamson (2012) use a laboratory
experiment to show that corporate giving to charity increases employee effort (and presumably
motivation) and contributions to organizational endeavors..
Although Gagne and Deci (2005) develop some proposals on the organizational
determinants of different work motivations and Adler and Chen (2011) develop a series of
proposals on the antecedents of individuals’ motivation orientations in settings that require large-
scale coordinated creativity, there is no empirical evidence of the effects of management control
system design on the PLOC motivational orientations. The available empirical studies on the
antecedents of motivational orientations tend to focus on broad concepts in organizational
theories (e.g. managers taking the perspective of employees, providing greater choice to
employees, and encouraging employees to take initiatives) rather than specific elements of
management control systems. This brings us to our second research question:
10
Research Question 2: How do management control system design choices affect individual work
motivation orientation?
Although the PLOC framework has received empirical support in the education, health
care, and sport domains (Gagne and Deci 2005), there is relatively little direct evidence relating
the PLOC motivational orientations to outcomes in work settings. The few studies that exist
suggest direct or indirect positive consequences of more internal work motivation (i.e. intrinsic
and identified) on job satisfaction, organizational citizenship behavior, organizational
commitment, creativity, and performance. For example, using data from a psychiatric hospital
for children, Lynch et al. (2005) find that autonomy support from managers increases job
satisfaction of employees and is positively associated with the employees’ internalization of the
rationale for implementing a new program for treating the patients. Deci et al. (1989)’s field
experiment using a U.S. corporation also finds that managers’ autonomy support increases
workers’ trust in the organization and job satisfaction.
Organizational citizenship behavior is defined as behavior that is not directly recognized
by formal incentives but increases organizational effectiveness, e.g. helping and mentoring
coworkers, developing creative solutions to problems, helping to organize events in
organizations (Podsakoff et al. 1996). Despite the lack of evidence for motivational orientations
on organizational citizenship behavior, research in domains such as education and conservation
generally support a positive association between more internal motivation and volunteering and
other prosocial behaviors (Gagne 2003; Green-Demers et al. 1997; Pelletier et al. 1998).
Organizational commitment is defined as identification with the organization,
internalization of the organization’s values, and compliance (O’Reilly and Chatman 1986). Deci
et al. (1989) find that more autonomy supporting managers induce employees’ greater trust of

11
the organization and positive work-related attitudes. Bono and Judge (2003) find that individuals
with self-concordant goals (i.e., intrinsic or identified motivation) have greater affective
commitment to their organizations. Gagne et al. (2008) find a positive association between
intrinsic and identified motivation with organizational commitment.2
Moulang (2013) finds that greater empowerment of employees lead to greater employee
creativity. To the extent that employee empowerment is associated with greater intrinsic and
identified motivation, these results are consistent with the propositions in Adler and Chen (2011)
that intrinsic and identified motivations are most conducive to creativity.
The empirical evidence on the link between motivational orientations and performance is
mixed. Laboratory experiments and field studies suggest that more internal motivation facilitates
performance in more complex tasks that requires learning and creativity, but this effect is
reduced for more mundane tasks (Benware and Deci 1984; Grolnich and Ryan 1987).
Nonetheless, more internal motivation is still related to high job satisfaction and lower turnover
even for more mundane tasks (Iilardi et al. 1993; Shirom et al. 1999). This leads to our third
research question:
Research Question 3: What are the behavioral consequences of the four different work
motivation orientations?
III. METHOD
Survey Design and Procedure
To investigate our research questions, we collected data on workforce participants
through a survey hosted on Amazon Mechanical Turk (AMT). AMT is an Internet labor market
2 Gagne et al. (2008) verify using cross-lag correlations that motivational orientation predicts organizational
commitment, but organizational commitment does not predict motivational orientation. This finding is more
consistent with causality going from motivational orientation to organizational commitment rather than the other
way round.

12
that allows individuals to post “human intelligence tasks” (HITs) and facilitates payment to those
participants who complete the tasks. We used AMT to host our survey because it provided access
to a diverse set of workforce participants across multiple industries, firms, and job descriptions.
Additionally, research suggests that samples taken from AMT are more representative of the
U.S. population than those taken from traditional university subject pools (Paolacci, Chandler,
and Ipeirotis 2010) or traditional convenience samples (Berinsky, Huber, and Lenz 2012). Thus,
using AMT allowed us to collect a diverse sample that is representative of the target population
we wish to study.
We designed the survey questionnaire following the guidelines provided in Van der
Stede, Young, and Chen (2005). Specifically, we took the following steps to ensure the quality of
the questionnaire design. First, we performed an extensive literature review to find survey
studies that had examined our constructs of interest. Using these pre-established survey questions
supplemented with our own unique questions, we created a preliminary version of our
questionnaire. Next, we had nine colleagues provide question-by-question feedback on our
preliminary questionnaire. We then revised the content, wording, and length of the questionnaire
based on the feedback received. Finally, we pilot-tested the revised questionnaire with a sample
of 306 individuals through AMT. The results of this pilot-test led us to further revise existing
questions, add additional questions to capture control variables, and further refine the length of
the questionnaire. The final list of questions used within this study is included in the Appendix. .
We posted our final survey on AMT in December of 2013. We limited participation in
our survey to only those individuals who both lived in the United States and had a 90% or greater
approval rating.3 Our final questionnaire was completed by 613 participants. We used the IP
3 These controls are embedded within AMT. Individual performing the “human intelligence tasks” must indicate the
country in which they live. Additionally, after performing tasks, the creator of the task can provide an approval

13
addresses of the participants’ computers to determine if the survey was completed multiple times
from the same computer, potentially indicating an individual did the survey more than one time.
We find that 19 of the 613 (3.1 percent) observations have duplicate IP addresses. After
eliminating the second occurrence of those responses with duplicate IP addresses, we are left
with a sample size of 594 observations. Of these 594 observations, 592 provided usable
responses for all survey questions used in our analysis.
The average age of our participants is thirty-four years. 45.3 percent are female and 90.7
percent have some college education. 83.0 percent of our participants were, at the time of the
survey, employed and the remaining 17.0 percent were unemployed, but had worked in the past.
Workers from a variety of industries are represented within our sample. Education, library, and
training (12.8 percent), sales and related (12.5 percent), and computers and technology (9.3
percent) are the three most highly represented industries within our sample.
Our participants were paid a fixed rate of $1.00 to complete the survey. In addition,
participants could earn up to another $2.00 for correctly answering “bonus” questions.4 On
average, our participants earned $2.97 and took an average of twenty-three minutes and forty-
four seconds to complete the task. This equates into an hourly wage of approximately $7.50,
which is well above the reported reservation wage of AMT in Horton and Chilton (2010) of
approximately $1.38.
rating for participants. This allows AMT users to create a reputation. Thus, using 90% approval rating helped give
us some comfort that our survey participants thoughtfully responded to the survey questions. 4 An example of a bonus question would be “what is 1+1”? These questions were designed to ensure participants
were attending to the survey questions. 95% (99%) correctly answered 5 (4) of the 5 bonus questions correctly.

14
Research Design and Variable Measurement
Perceived Locus of Causality – Workplace Motivation (PLOC-WM)
To examine our first research question, we identify four perceived loci of causality
(PLOC) described Adler and Chen (2011): Intrinsic, Identified, Introjected, and External. The
questions in existing research are from non-work place settings (e.g. Ryan and Connell (1989),
Pelletier et al. (1995) (The Sport Motivation Scale (SMS-28)) and so are not readily applicable to
a work setting. Consistent with Adler and Chen (2011), we adapt the existing instruments to
make them specific to workplace motivation, asking participants sixteen questions about what
motivates them to work. The questions range from highly intrinsic reasons (e.g., I work for the
pleasure the job gives me) to highly external reasons (e.g., I work because I am keenly aware of
the income goals I have for myself). Please see the Panel A of the Appendix for the full list of
workplace motivation questions.
Determinants of PLOC-WM
We use the following OLS regression model to examine our second research question
regarding the determinants of the four different types of workplace motivation.
We discuss each of the variables below. Additionally, Panel B of the Appendix contains
the full list of questions used to measure determinants of PLOC-WM.
Levers of Control
Consistent with Simons (1995) and Widener (2007), we measure various components of
the levers of control (LOC) framework. The LOC framework asserts that four different control

15
systems work together to benefit the firm (Simon 2000). We measure these four control systems
using the questions used in Widener (2007). Specifically, we ask four questions about the core
values of the firm (LocBelief), four questions about the behavioral boundaries (LocBound),
eleven questions about the monitoring process (LocDiag) and five questions about the forward
looking managerial involvement (LocInter).
Performance Measurement and Incentives
Consistent with prior literature exploring different types of subjectivity (e.g., Bol 2008),
we adapted measures used in Huberts (2012) to develop a measure of subjectivity (Subjective) in
the performance measurement process that uses three items. The first item asks participants
about ex-ante performance measure weighting. The second item asks about the use of objective
performance measures and the third item asks about predetermined criteria being established
before performance evaluation. All questions are reverse coded.
We also build on prior survey papers exploring the use of financial, non-financial,
individual-based, and group-based rewards (e.g. McClurg 2001). We ask six questions about the
incentives used within participants’ firms. NonFinReward and FinReward both ask the extent to
which an organization uses non-financial and financial rewards, respectively. PayPerfSens
measures the extent to which pay-for-performance compensation is used relative to fixed
compensation and GroupBased measures the extent to which group-based incentives are used
relative to individual-based incentives. Building on literature that explores the differences
between incentives framed as rewards and penalties (Luft 1994), Penalty and Rewards ask the
extent to which the organization uses penalties and rewards to motivate employees, respectively.
Corporate Social Responsibility (CSR) Activities
We ask two questions related to CSR activities. The first question is based on the

16
emerging literature exploring the causes and consequences of corporate citizenship (e.g., Matten
and Crane 2005; Kim, Park and Wier 2012). Specifically, CorpCit measures the extent to which
participants think their organization is a good corporate citizen. We also explore the extent to
which firms take actions to benefit society (e.g., Martin and Moser 2011; Moser and Martin
2012) by asking participants the extent to which they think their organization benefits society
(BenefitSoc).
Individual Traits
Motivational orientations are in part driven by individual dispositions or traits (Amabile,
Hill, Hennessey, & Tighe, 1994; Gottfried, 1990). We consider the role of general causality
orientation (Deci and Ryan 1985), which captures the extent to which individuals experience
identical situations as affording more versus less autonomy (Autonomy). We also include two
elements of the dark triad as well as the big five personality traits. Specifically, we measure
narcissism (Narc) using nine questions and Machiavellianism (Mach) using ten questions from
Majors (2014). We also measure extraversion (Extra), agreeableness (Agree), conscientiousness
(Consc), neuroticism (Neuro), and openness (Open) using the Big Five Short Inventory
(Rammstedt and John 2007).
Control Variables
We control for the length of time a participant has worked for their organization
(Tenure). We also control for gender, employment status, education, and industry. Please see
panel C of the Appendix for a full list of control questions.
Consequences of PLOC-WM
We use the following OLS regression model to examine our third research question
regarding the consequences of the four different types of workplace motivation.

17
We discuss each of the consequences of PLOC-WM below. Additionally, Panel D of the
Appendix contains the full list of questions used to measure the consequences of PLOC-WM.
Consequences
We examine six different consequences associated with the different types of workplace
motivation. Therefore, the dependent variable (Conseq) in our model changes based on what
specific consequence we are examining. The six consequences we examine are creativity,
organizational identification, organizational citizenship behavior, effort, performance, and
turnover. We measure creativity (Creative) using eight questions used in Moulang (2013). These
eight questions measure the level of creativity participants’ display within their workplace.
Organizational identification (OrgID) is measured using a five-question scale validated in prior
literature (Mael and Ashforth 1992; Marin, Ruiz, and Rubio 2008). We use Lee and Allen’s
(2002) eight question scale to measure organizational citizenship behavior (OCB) and work
effort (Effort) was measured using a four question scale taken from Bielby and Bielby (1988).
Finally, we measured both performance (Performance) and turnover (Turnover) using an
established three question scale from Griffin, Neal and Parker (2007) and a four question scale
from Shore and Martin (2008), respectively. We also use control variables described in the
aforementioned subsection.
Construct Validation
To assess the reliability of our measures, we ran factor analysis for each variable with
multiple items. These factor analyses confirm that our questionnaire items load on the right

18
constructs and the Cronbach’s alphas are reasonably high, suggesting high reliability of our
measures. See the Appendix for the Cronbach’s alphas for each variable.5
Addressing Common Method Bias
Most of our main constructs are perceptual and obtained with the same survey
questionnaire. Thus, common method bias is a potential concern because we could obtain
spurious associations that are due to the use of a common measurement method rather than to the
underlying constructs captured by the measures (Podsakoff et al. 2003). To mitigate potential
common method bias, we followed Podsakoff et al. (2003)’s recommendations on ex ante and ex
post remedies. First, we provide anonymity to the respondents to reduce common method bias.
Second, we used some questions with different response formats to validate our constructs. For
example, some items are reverse worded. Third, we conducted multiple pretests of our survey
instrument to make sure that the wording of the questions was not ambiguous. Finally, after we
collected our data, we used a single exploratory factor analysis on all questionnaire items for all
multi-question constructs in both of the aforementioned models (Campbell and Fiske 1959;
Podsakoff and Organ 1986). This factor analysis confirms that our questionnaire items load on
the expected constructs. These steps give us confidence that we have a relatively low likelihood
of common method bias in our study.6
5 Two of the personality variables, Agreeableness and Openness, both have low Cronbach’s Alpha. We believe this
to be a result of only using two questions to measure each component of personality. Indeed, Rammstedt and John
(2007) also have low reliability for agreeableness and openness and point out that “using these abbreviated scales
come at a cost” in terms of reliability (p. 206). We use the abbreviated survey despite this cost because our study’s
primary focus is on the management control system choices (as opposed to personality) and, given the overall length
of our questionnaire, we did not want to overwhelm participants with additional personality questions. 6 Some questions used to measure the Big 5 Personality Traits loaded in the Mach and Narc constructs. This
suggests that common method bias could exist within our personality measures. However, given that these
constructs are naturally correlated (i.e., they are all personality measures) and they are not the central focus of this
study, we believe our inferences are valid, given this potential common method bias.

19
IV. RESULTS
Validation of the PLOC Work Motivation Scale
Factor Analysis
To validate the PLOC-WM scale we have adapted from Adler and Chen (2011), Ryan
and Connell (1989) and Pelletier et al. (1995), we first run an exploratory factor analysis with
Promax oblique rotation using all sixteen questions in the work motivation scale.7 As shown in
Table 1 an exploratory factor analysis of the 16 items yields four factors with an eigenvalue
greater than 0.90, which explains 60.2% of the total variance.8 Cronbach’s α for the four factors
range between 0.70 and 0.93, suggesting high reliability of the subscales. These results suggest
that all four PLOC motivational orientations are well differentiated in the survey responses of the
respondents, indicating that the four motivational orientations are distinct from each other.
Correlation Structure Analysis
Table 1, Panel B shows the correlations among all the 16 questions used to measure
PLOC work motivation. These results indicate that the correlations between items in the same
subscale (i.e., intrinsic, identified, introjected, or external) are higher than those between items in
one subscale and those in the other subscales. These results corroborate the results of the factor
analysis summarized in Panel A, suggesting that the four motivational orientation subscales
represent four distinct constructs of work motivation.
7 A promax oblique rotation should be used when correlation is expected to exist among factors. As reported in
Brown (2009), Tabachnick and Fiddell (2007, p. 646) argue that “Perhaps the best way to decide between
orthogonal and oblique rotation is to request oblique rotation and look at the correlations among factors…if factor
correlations are not driven by the data, the solution remains nearly orthogonal. Look at the factor correlation matrix
for correlations around .32 and above. If correlations exceed .32, then there is 10% (or more) overlap in variance
among factors, enough variance to warrant oblique rotation.” Our factor correlation matrix has correlations greater
than 0.32 and hence we use promax oblique rotation. 8 While the convention may be to include only factors with eigenvalues greater than 1.0 (Kaiser 1960), we include
the fourth factor for two reasons. First, it is consistent with theory and prior evidence (e.g. Pelletier 1995), capturing
the final dimension of the PLOC framework. Second, the variables loading on the factor generally show very strong
correlations with the factor (Stevens 1992). Finally, a scree plot of the incremental variance explained does show a
flattening of the incremental variance explained by the subsequent factors (Cattell 1966).

20
To examine the relation among the four distinct constructs of work motivation, we
analyze the correlation structure between the different PLOC subscales based on our survey.
According to Guttman’s (1954) radix theory, variables that are more similar conceptually should
correlate more highly than those that are conceptually less similar. The PLOC scale in Adler and
Chen (2011) is a continuum in the order of intrinsic-identified-introjected-external motivation,
with intrinsic representing the highest degree of autonomy and motivation and external
representing the lowest degree of autonomy and motivation. As such, correlations between
intrinsic and the other orientation should decrease from identified to introjected to external. The
correlational structure in Panel C is largely consistent with this ordering but suggests a modified
PLOC continuum in the order of intrinsic-identified-external-introjected motivation because the
correlation between external motivation and identified motivation is higher (0.53) than the
correlation between introjected motivation and identified motivation (0.50).
This result differs slightly from prior research in the education domain using elementary
school students as participants (Ryan and Connell 1989) and suggests that in the work setting,
motivation driven by guilt or obligation may represent a lower degree of autonomy than
motivation driven by external incentives. In other words, in work settings, compared to
introjected motivation, external motivation is conceptually more similar to intrinsic motivation
and identified motivation. We conjecture that this result is probably due to the fact that external
incentives are expected in a work setting, which reduces the undermining effect of such
incentives on perceived autonomy. This is consistent with the argument in Kunz and Pfaff
(2002).
Taken together, the above results show that we can reliably use the PLOC-WM to
classify individual work motivation with the four categories in the PLOC framework: intrinsic,

21
identified, introjected, and external. Our results also suggest that, in work settings, the PLOC
continuum of autonomy and motivation should be in the order of intrinsic-identified-external-
introjected motivation. Compared to the education, sports, and healthcare domains, external
motivation appears to undermine autonomy to a less extent than introjected motivation in work
settings.
Descriptive Statistics
Table 2 provides descriptive statistics for all variables. Panel A shows the descriptive
statistics for the four types of motivational orientations while Panels B through D provide
descriptive statistics for the determinants of PLOC-WM, personality and control variables, and
consequences of PLOC-WM, respectively. All questions, unless otherwise noted, were measured
using a 7-point Likert Scale with higher (lower) numbers representing higher (lower) levels of
the variable.9
Distribution of Motivational Orientations across Industry, Gender, Employment Status, and
Tenure
To explore the distribution of motivational orientations across industry, gender,
employment status, and tenure, we first identify the dominant motivational orientation of each
survey respondent based on the respondent’s composite scores for each of the four motivational
orientations. For example, out of the four composite scores, if the respondent’s composite score
for identified motivation is the highest, we classify this respondent as having predominantly
identified motivation.10
Table 3, Panel A shows the distribution of motivational orientations
9 In Table 2, all variables measured using multiple questions are created by averaging the responses to the multiple
questions together. Thus all variables in Table 2 (except for Tenure, Gender, JobStatus, and Education) have the
same range and can be easily compared. All regression analyses (i.e., results reported in Table 5 and Table 6) use the
factor loading results for all variables measured using multiple questions. 10
Note that we only perform this procedure for this analysis. For all the other analyses, we assume that multiple
motivational orientations can co-exist (Ryan and Connell 1989; Adler and Chen 2011), and thus, one individual can
simultaneously display a combination of various motivational orientations.

22
across industry. Chi-square analysis shows significant difference in motivational orientations
across industries (χ2
= 166.2; p < 0.01). These results can be driven by: (1) individuals with
different motivational orientations (driven by personality traits) selecting into different industries
or, (2) different industries and the control systems used in these industries inducing different
motivational orientations, or both.
Panels B through D of Table 3 show the distribution of motivational orientations across
gender, employment status (full-time vs. part-time), and tenure (years spent working for an
organization). Chi-square analyses indicate no significant differences across gender, employment
status, and tenure.
Co-Existence of Multiple Motivational Orientations
Although we perform the above analysis using the dominant motivational orientation of
an individual for the ease of analysis, our maintained assumption is that multiple motivational
orientations can co-exist (Ryan and Connell 1989; Adler and Chen 2011). In other words, one
individual can simultaneously display a combination of multiple motivational orientations to
varying extent. Descriptive statistics in Columns 3 through 6 in Table 3, Panel E provide
evidence consistent with this assumption. For individuals with any dominant motivational
orientation, they are also driven by the other three types of motivation to different degrees. For
example, an employee may be primarily driven by identified motivation because he/she
identifies with the values of the organization, but at the same time, this employee may also be
motivated to some degree by the intrinsic interest a job affords, by a sense of obligation to
his/her supervisor, and by extrinsic monetary incentives. These results support the propositions
in Adler and Chen (2011) that intrinsic and identified motivation can co-exist. Thus, we rely on
this assumption that different motivational orientations can co-exist in all subsequent analyses.

23
Antecedents of Work Motivation Orientations
Table 5, panel A summarizes the results for the analysis of our second research question:
How are the four different types of individual work motivation influenced by management
control system design? Below, we discuss the effects of levers of control, performance
measurement and incentives, and corporate social responsibility activities on motivational
orientations.
Levers of Control
We find that belief controls are positively associated with identified motivation (Coeff =
0.04, t= 2.07). This is consistent with Proposition 12 in Adler and Chen (2011: 75). We also find
that diagnostic controls are positively associated with external motivation (Coeff = 0.05, t =
2.91) and moderately positively associated with intrinsic motivation (Coeff = 0.03, t = 1.68). We
do not find significant associations between the other controls in the levers of control framework
and motivational orientations.
Performance Measurement and Incentives
We find that the use of subjectivity in performance measurement and incentive systems is
positively associated with intrinsic motivation (Coeff = 0.07, t = 2.37), identified motivation
(Coeff = 0.05, t = 2.05), and external motivation (Coeff = 0.06, t = 1.93). We also find that the
use of non-financial reward is positively associated with intrinsic motivation (Coeff = 0.09, t =
4.39), identified motivation (Coeff = 0.07, t = 3.74), external motivation (Coeff = 0.05, t = 2.64),
and moderately positively associated with introjected motivation (Coeff = 0.04, t = 1.63). We do
not find a significant effect of group-based incentives or the use of financial rewards on work
motivation.
24
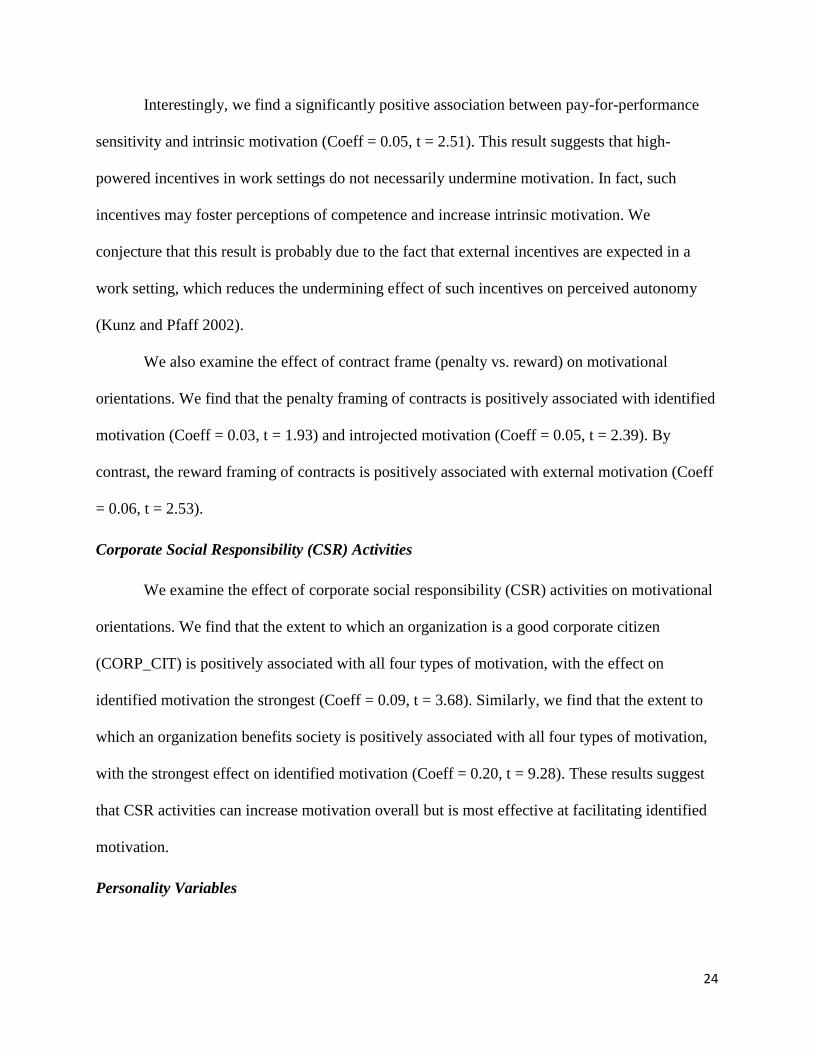
Interestingly, we find a significantly positive association between pay-for-performance
sensitivity and intrinsic motivation (Coeff = 0.05, t = 2.51). This result suggests that high-
powered incentives in work settings do not necessarily undermine motivation. In fact, such
incentives may foster perceptions of competence and increase intrinsic motivation. We
conjecture that this result is probably due to the fact that external incentives are expected in a
work setting, which reduces the undermining effect of such incentives on perceived autonomy
(Kunz and Pfaff 2002).
We also examine the effect of contract frame (penalty vs. reward) on motivational
orientations. We find that the penalty framing of contracts is positively associated with identified
motivation (Coeff = 0.03, t = 1.93) and introjected motivation (Coeff = 0.05, t = 2.39). By
contrast, the reward framing of contracts is positively associated with external motivation (Coeff
= 0.06, t = 2.53).
Corporate Social Responsibility (CSR) Activities
We examine the effect of corporate social responsibility (CSR) activities on motivational
orientations. We find that the extent to which an organization is a good corporate citizen
(CORP_CIT) is positively associated with all four types of motivation, with the effect on
identified motivation the strongest (Coeff = 0.09, t = 3.68). Similarly, we find that the extent to
which an organization benefits society is positively associated with all four types of motivation,
with the strongest effect on identified motivation (Coeff = 0.20, t = 9.28). These results suggest
that CSR activities can increase motivation overall but is most effective at facilitating identified
motivation.
Personality Variables

25
Because motivational orientations are driven in part by stable personality traits, we
include personality variables in the model of the antecedents of work motivation. As shown in
Table 5, Panel A we have the following findings.
First, we find that a general autonomy orientation (the extent to which an individual is
oriented toward aspects of the environment that stimulate intrinsic motivation, displays self-
initiation, seeks activities that are interesting and challenging, and takes responsibility for his or
her own behavior) is positively associated with intrinsic motivation (Coeff = 0.05, t = 2.43) and
identified motivation (Coeff = 0.06, t = 3.36). This is consistent with prior research in the
psychology literature (Gagne and Deci 2005).
Second, we examine the effects of narcissism and Machiavellianism on work motivation.
We find that narcissism is positively associated with intrinsic motivation (Coeff = 0.05, t = 2.21)
and identified motivation (Coeff = 0.06, t = 3.05), but is most strongly associated with external
motivation (Coeff = 0.11, t = 4.59). We find a marginally positive association between
Machiavellianism and both introjected motivation (Coeff = 0.04, t = 1.68) and external
motivation (Coeff = 0.04, t = 1.70). These results suggest that Machiavellianism shifts the
motivational orientation toward the more external end of the PLOC continuum.
Finally, we examine the effects of the “Big Five” personality traits on motivational
orientations. We find that introjected motivation is positively associated with agreeableness
(Coeff = 0.08, t = 2.05), conscientiousness (Coeff = 0.12, t = 3.59), and neuroticism (Coeff =
0.12, t = 3.45), suggesting that individuals who score high on these traits are more likely to be
motivated by a sense of obligation or guilt in work settings than those who score low on these
dimensions. We also find positive associations between conscientiousness and intrinsic
motivation (Coeff = 0.08, t = 2.57) and identified motivation (Coeff = 0.12, t = 3.59), indicating

26
that conscientious employees are also likely to be driven by intrinsic and identified motivation
simultaneously. Furthermore, we find a positive association between neuroticism and external
motivation (Coeff = 0.06, t = 2.17). We do not have significant effects of extroversion or
openness on work motivation. Overall, the results on “Big Five” personality variables suggest
that conscientiousness shifts the motivational orientation toward the more internal end of the
PLOC continuum, neuroticism shifts the motivational orientation toward the more external end
of the PLOC continuum, and the other three traits have relatively little impact on work
motivation.
The above results are consistent with motivational orientations being driven in part by
stable personality traits. Organizations can take measures to identify job candidates with certain
personality traits in their recruiting process. However, a comparison of the base model and the
full model in Panel A of Table 5 suggests that organizational control choices simultaneously
have a significant impact on motivation orientation. Specifically, a comparison of adjusted R2
across the two panels suggests including organizational control choices significantly increases
the adjusted R2 of all four motivation orientations types, with the largest increase taking place
within the identified motivation orientation.
Control Variables
We find that tenure is positively associated with intrinsic motivation (Coeff = 0.02, t =
3.09), identified motivation (Coeff = 0.02, t = 3.18), and introjected motivation (Coeff = 0.02, t =
2.54). These results suggest that after an employee spends more time working for the same -
organization, the employee is more likely to be driven by intrinsic, identified, and introjected
motivation rather than by purely external motivation.

27
We also control for gender, education, employment status, and industry. We find a weak
association between males and both introjected and external motivation (p < 0.07 and p < 0.09,
respectively. Also our untabulated results suggest, that part-time employment status has a
negative association with identified and external motivation (p < 0.06 for both) while being
unemployed has a negative association with external motivation (p < 0.05). Finally, we find that
the community and social service industry is positively associated with identified motivation (p <
0.04) while both the food preparation/service and transportation/material moving industries are
both negatively associated with external motivation (p < 0.03 and p < 0.01, respectively).
To summarize, we find that management control system elements have significant effects
on the four individual motivational orientations. These results suggest that management control
systems can influence individual motivational orientations in predictable ways consistent with
theory even after controlling for the effects of stable personality traits.
Consequences of Work Motivation Orientations
Table 6 summarizes the results for our third research question: What are the
consequences of the four different types of individual work motivation? Below, we discuss the
effects of motivational orientations on employee creativity, organizational identification,
organizational citizenship behavior, effort, performance, and turnover intention. We control for
direct effects of personality traits on these variables to isolate the direct effects of motivation
orientation.
We find that intrinsic motivation is significantly positively associated with employee
creativity (Coeff = 1.24, t = 9.14), organizational identification (Coeff = 0.36, t = 3.37),
organizational citizenship behavior (Coeff = 0.52, t = 4.13), effort (Coeff = 0.53, t = 5.61), and

28
performance (Coeff = 0.20, t = 2.03). We do not find intrinsic motivation to be a significant
predictor of turnover intention.
We find that identified motivation is significantly positively associated with
organizational identification (Coeff = 1.05, t = 9.44), organizational citizenship behavior (Coeff
= 1.09, t = 8.40), and effort (Coeff = 0.26, t = 2.71). We also find a significantly negative
association between identified motivation and turnover intention (Coeff = -0.91, t = -8.04),
suggesting that employees driven by identified motivation are less likely to leave an
organization. We do not find a significant effect of identified motivation on employee creativity
or performance.
We find that introjected motivation is negatively associated with employee creativity
(Coeff = -0.20, t = -1.96) and organizational citizenship behavior (Coeff = -0.16, t = -1.63).
Furthermore, we find a significantly positive association between introjected motivation and
turnover intention (Coeff = 0.28, t = 3.41), suggesting that employees driven by introjected
motivation are more likely to leave an organization. We do not find a significant effect of
identified motivation on organizational identification, effort, or performance.
Finally, we find that external motivation is positively associated with organizational
identification (Coeff = 0.17, t = 1.84). We also find a significantly negative association between
external motivation and turnover intention (Coeff = -0.35, t = -3.65), suggesting that employees
driven by external motivation are less likely to leave an organization. We do not find a
significant effect of external motivation on employee creativity, organizational citizenship
behavior, effort, or performance.
Taken together, the above results suggest that the four different types of motivational
orientations in work settings have distinct effects on various outcomes. While intrinsic

29
motivation is the best predictor for employee creativity, effort, and performance, identified
motivation is the best predictor of organizational identification, organizational citizenship
behavior, and loyalty to an organization (as reflected by a lower turnover intention). Introjected
motivation is detrimental to employee creativity and organizational citizenship behavior and
increases turnover intention.
An interesting result that differs from those documented in non-work settings in prior
psychology literature is that external motivation can actually predict organizational identification
and reduce turnover intention. Combined with the results on external motivation reported in
earlier sections, we conclude that, because external incentives are expected in a work setting, the
undermining effect of such incentives on perceived autonomy, motivation, and performance is
mitigated in a work setting compared to those settings in which extrinsic incentives for
performance are not expected (e.g. education, healthcare, and sports).
Regarding personality variables, we find a positive association between narcissism and
employee creativity (Coeff = 0.20, t = 3.67) narcissism and performance (Coeff = 0.13, t = 2.99),
and narcissism and turnover intention (Coeff = 0.13, t = 2.99).
We find conscientiousness to be a significant predictor of employee creativity (Coeff =
0.29, t = 4.33), organizational citizenship behavior (Coeff = 0.15, t = 2.37), effort (Coeff = 0.33, t
= 7.04), performance (Coeff = 0.53, t = 10.66). We find agreeableness to be negatively
associated with performance (Coeff = -0.12, t = -2.03) and turnover intention (Coeff = -0.15, t =
-2.36).
We find openness to be a significant predictor of employee creativity (Coeff = 0.40, t =
5.10) and organizational citizenship behavior (Coeff = 0.19, t = 2.53). We find neuroticism to be
positively associated with effort (Coeff = 0.11, t = 2.28).

30
We do not find Machiavellianism or extroversion to be a significant predictor of any of
the six outcomes.
Regarding the control variables, we find a positive association between tenure and both
employee creativity (Coeff = 0.03, t = 2.41) and organizational citizenship behavior (Coeff =
0.03, t = 2.26) and a negative association between tenure and turnover intention (Coeff = -0.03, t
= -3.28), suggesting that more senior employees in an organization are more likely to generate
creative solutions, display behaviors consistent with organizational citizenship, and less likely to
leave an organization.
Robustness Tests
Table 4 shows evidence of high levels of correlations among our explanatory variables.
To examine the effect that multicollinearity could have within our models, we examine the
variance inflation factor (VIF) in both our determinants and consequences models. Within all our
determinants and consequences models, we find high VIF scores indicating potential issues with
multicollinearity (for our determinant [consequence] models, mean VIF is 4.49 [5.06]).
However, we find in both sets of models that the VIF score is primarily driven by the education
and industry indicator variables. As a robustness test, we run these models excluding our
education and industry control variables. Panel B in both Table 5 and 6 indicates that our results
are generally consistent using this adjusted model.11
Excluding education and industry control
variables drops the VIF score for our determinants [consequences] model to 1.57 [1.71],
reducing the concerns of multicollinearity within our models.
11
In the determinants model, the positive association between Penalty and Identified is no longer statistically
significant. In the consequences model, the negative association between OCB and Introjected is no longer
statistically significant.

31
V. CONCLUSION
Our study advances our understanding of a vital managerial question: how are individuals
motivated in the work place? We explore the structure, determinants and effects of the concept
of perceived locus of causality (PLOC). To investigate our research questions, we gather survey
data from individuals across a broad range of industries and professions at Amazon’s Mechanical
Turk labor market.
We first develop and validate a scale of PLOC work motivation. Our results document
that the four motivational orientations posited by PLOC theory: intrinsic, identified, introjected
and external, are well-differentiated constructs. However, we offer evidence that the
hypothesized ordered relation among the constructs does not hold in a work setting. In our data,
external motivation correlates more highly with identified motivation than does introjected,
suggesting that introjected motivation is at the end of the spectrum. Finally, we document that
multiple sources of motivation may co-exist in a given employee.
We next explore the organizational determinants of the source of motivation (i.e. location
on the PLOC scale). To the extent an organization would prefer employees that will naturally
pursue organizational goals, intrinsic and identified motivations are the most beneficial to
cultivate. We document that identified motivation is positively associated with the reliance on
belief control systems, use of subjectivity in performance evaluation, use of non-financial
rewards, penalty-based contracts, and CSR activities. We find that intrinsic motivation is
positively associated with the use of subjectivity in performance evaluation, pay-for-performance
sensitivity, and CSR activities. Taken together, our results offer designers of control systems
important insights into the motivational effects of key control and incentive decisions.

32
Finally, we investigate the behavioral consequences of different motivation orientations,
focusing on the internal end of the spectrum. We find that identified orientation is positively
associated with organizational identification, citizenship behavior, and self-reported effort and
negatively associated with turnover intention. We also find that intrinsic orientation is positively
associated with creativity, organizational identification, organizational citizenship behavior, and
self-reported performance.
Taken together, we provide an important methodological advance in this setting by
developing and validating the PLOC-WM scale. In addition, we document several controllable
antecedents of motivation orientation, which can be of use to designers of management control
systems interested in cultivating particular types of motivation. Also of use to designers, we
document behavioral consequences of motivation orientation, including impacts on creativity
and corporate social responsibility.
Our results also provide opportunities for future investigation in this setting. Of
particular importance is the placement of introjected orientation in the model. We find that the
existing PLOC structure may be incorrect in a work setting and external and introjected
orientations should be reversed. It is possible that this is because working due to a sense of guilt
or shame is less motivating than working for extrinsic rewards. Given the negative
consequences of an introjected orientation for the organization we document, future research
should seek a fuller understanding of the relation between introjected motivation and the other
orientations.
Future research should investigate our documented association of external motivation
with greater identification and less turnover intention. Our surmise is that this is due to
employee expectations, but our data do not allow us to directly test this inference. Similarly, our

33
conjecture that reliance on penalty-based reward systems causes those who do not identify with
the organization to self-select out of the organization warrants further investigation.
Finally, our use of survey methodology also offers opportunities for additional investigation. In
particular, we are unable to fully document causation in our data. While the theory on which we
rely is sound and gives us confidence in our conclusions, additional work should fully investigate
our documented relations.
34
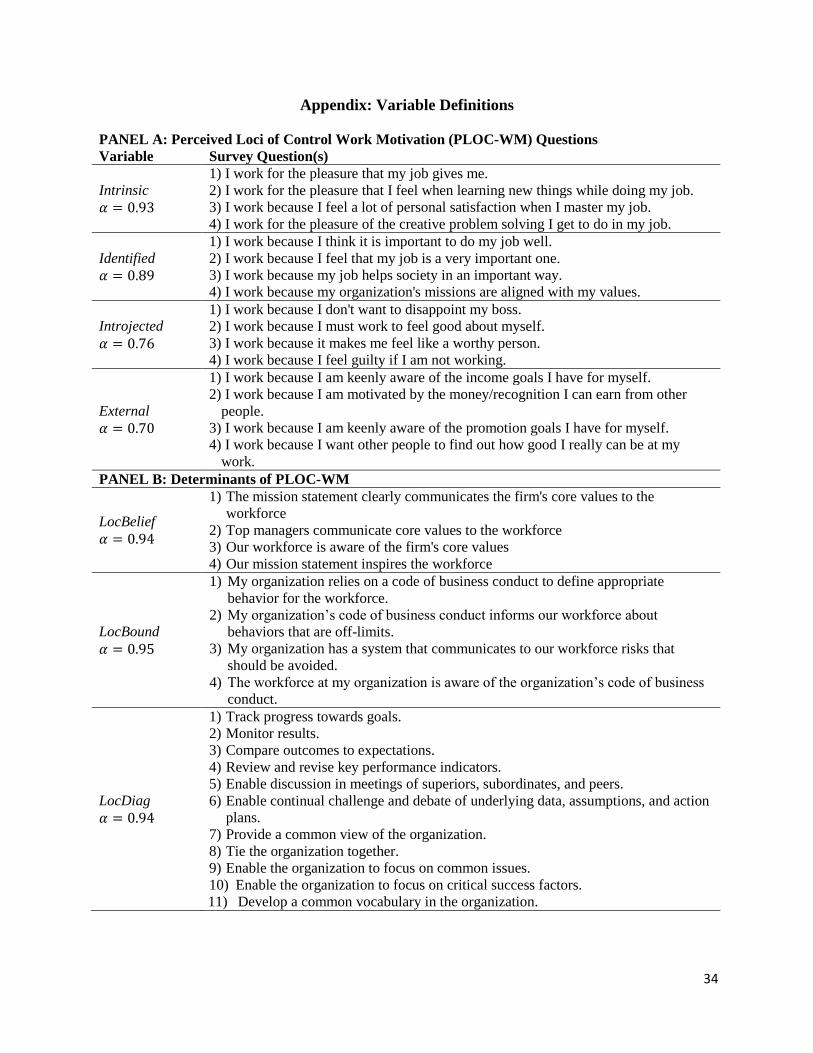
Appendix: Variable Definitions
PANEL A: Perceived Loci of Control Work Motivation (PLOC-WM) Questions
Variable Survey Question(s)
Intrinsic
1) I work for the pleasure that my job gives me.
2) I work for the pleasure that I feel when learning new things while doing my job.
3) I work because I feel a lot of personal satisfaction when I master my job.
4) I work for the pleasure of the creative problem solving I get to do in my job.
Identified
1) I work because I think it is important to do my job well.
2) I work because I feel that my job is a very important one.
3) I work because my job helps society in an important way.
4) I work because my organization's missions are aligned with my values.
Introjected
1) I work because I don't want to disappoint my boss.
2) I work because I must work to feel good about myself.
3) I work because it makes me feel like a worthy person.
4) I work because I feel guilty if I am not working.
External
1) I work because I am keenly aware of the income goals I have for myself.
2) I work because I am motivated by the money/recognition I can earn from other
people.
3) I work because I am keenly aware of the promotion goals I have for myself.
4) I work because I want other people to find out how good I really can be at my
work.
PANEL B: Determinants of PLOC-WM
LocBelief
1) The mission statement clearly communicates the firm's core values to the
workforce
2) Top managers communicate core values to the workforce
3) Our workforce is aware of the firm's core values
4) Our mission statement inspires the workforce
LocBound
1) My organization relies on a code of business conduct to define appropriate
behavior for the workforce.
2) My organization’s code of business conduct informs our workforce about
behaviors that are off-limits.
3) My organization has a system that communicates to our workforce risks that
should be avoided.
4) The workforce at my organization is aware of the organization’s code of business
conduct.
LocDiag
1) Track progress towards goals.
2) Monitor results.
3) Compare outcomes to expectations.
4) Review and revise key performance indicators.
5) Enable discussion in meetings of superiors, subordinates, and peers.
6) Enable continual challenge and debate of underlying data, assumptions, and action
plans.
7) Provide a common view of the organization.
8) Tie the organization together.
9) Enable the organization to focus on common issues.
10) Enable the organization to focus on critical success factors.
11) Develop a common vocabulary in the organization.

35
LocInter
1) Senior managers in your organization pay little day-to-day attention to the
performance measurement system.*
2) Non-senior managers in your organization are involved infrequently and on an
exception basis with the performance measurement system.*
3) Senior managers in your organization pay day-to-day attention to the performance
measurement system.
4) Senior managers in your organization interpret information from the performance
measurement system.
5) Non-senior managers in your organization are frequently involved with the
performance measurement system.
Subjective
1) To what extent are the weights on your performance measures determined before
the beginning of the evaluation period*
2) When your performance is being evaluated, to what extent are objective measures
used?*
3) To what extent are predetermined criteria used for evaluating and rewarding your
performance?*
NonFinReward To what extent does your organization provide you with non-financial rewards (e.g.,
recognition, promotion, training)?
FinReward To what extent does your organization provide you with financial rewards (e.g.,
bonuses, share-based rewards)?
GroupBased To what extent does your organization use individual-based incentives as opposed to
group-based incentives?
PayPerfSens To what extent does your organization provide fixed compensation relative to pay-
for-performance compensation?
Penalty To what extent does your organization motivate employees using penalties?
Reward To what extent does your organization motivate employees using rewards?
CorpCit To what extent is your organization a good corporate citizen?
BenefitSoc To what extent does your organization benefit society?
Autonomy
1) A. I always feel like I choose the things I do.
B. I sometimes feel that it is not really me choosing the things I do.
2) A. I choose to do what I have to do.
B. I do what I have to, but I don't feel like it is really my choice.
3) A. I do what I do because it interests me.
B. I do what I do because I have to.
4) A. I am free to do whatever I decide to do.
B. What I do is often not what I'd choose to do.
5) A. I feel pretty free to do whatever I choose to.
B. I often do things that I don't choose to do.
Narc
1) People see me as a natural leader.
2) I hate being the center of attention.*
3) Many group activities tend to be dull without me.
4) I know that I am special because everyone keeps telling me so.
5) I like to get acquainted with important people.
6) I feel embarrassed if someone compliments me.*
7) I have been compared to famous people.
8) I am an average person.*
9) I insist on getting the respect I deserve.
36
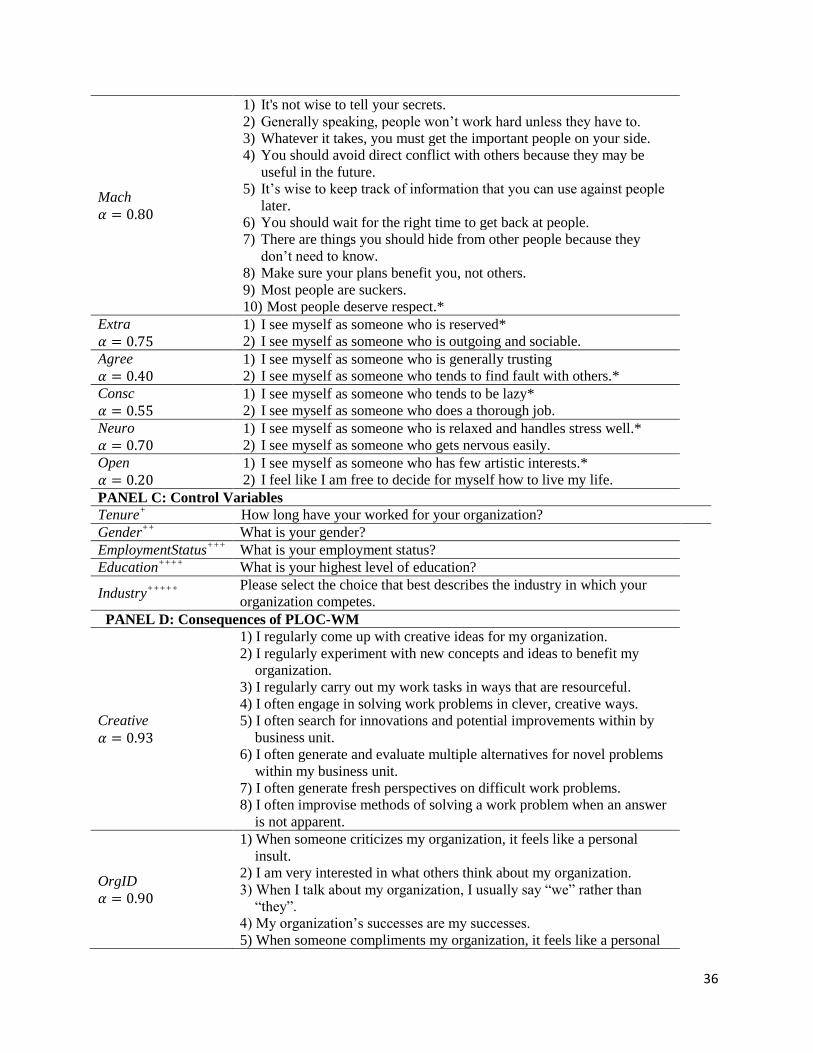
Mach
1) It's not wise to tell your secrets.
2) Generally speaking, people won’t work hard unless they have to.
3) Whatever it takes, you must get the important people on your side.
4) You should avoid direct conflict with others because they may be
useful in the future.
5) It’s wise to keep track of information that you can use against people
later.
6) You should wait for the right time to get back at people.
7) There are things you should hide from other people because they
don’t need to know.
8) Make sure your plans benefit you, not others.
9) Most people are suckers.
10) Most people deserve respect.*
Extra
1) I see myself as someone who is reserved*
2) I see myself as someone who is outgoing and sociable.
Agree
1) I see myself as someone who is generally trusting
2) I see myself as someone who tends to find fault with others.*
Consc
1) I see myself as someone who tends to be lazy*
2) I see myself as someone who does a thorough job.
Neuro
1) I see myself as someone who is relaxed and handles stress well.*
2) I see myself as someone who gets nervous easily.
Open
1) I see myself as someone who has few artistic interests.*
2) I feel like I am free to decide for myself how to live my life.
PANEL C: Control Variables
Tenure+ How long have your worked for your organization?
Gender++
What is your gender?
EmploymentStatus+++
What is your employment status?
Education++++
What is your highest level of education?
Industry+++++ Please select the choice that best describes the industry in which your
organization competes.
PANEL D: Consequences of PLOC-WM
Creative
1) I regularly come up with creative ideas for my organization.
2) I regularly experiment with new concepts and ideas to benefit my
organization.
3) I regularly carry out my work tasks in ways that are resourceful.
4) I often engage in solving work problems in clever, creative ways.
5) I often search for innovations and potential improvements within by
business unit.
6) I often generate and evaluate multiple alternatives for novel problems
within my business unit.
7) I often generate fresh perspectives on difficult work problems.
8) I often improvise methods of solving a work problem when an answer
is not apparent.
OrgID
1) When someone criticizes my organization, it feels like a personal
insult.
2) I am very interested in what others think about my organization.
3) When I talk about my organization, I usually say “we” rather than
“they”.
4) My organization’s successes are my successes.
5) When someone compliments my organization, it feels like a personal

37
compliment.

38
OCB
1) How often do you attend functions that are not required but that help your
organization's image?
2) How often do you keep up with developments in your organization?
3) How often do you defend your organization when other people criticize it?
4) How often do you show pride when representing your organization in public?
5) How often do you offer ideas to improve the functioning of your organization?
6) How often do you express loyalty toward your organization?
7) How often do you take action to protect your organization from potential
problems?
8) How often do you demonstrate concern about the image of your organization?
Effort
1) My job requires that I work very hard.
2) Altogether, my job requires a high level of either mental or physical effort.
3) I put effort into my job beyond what is required.
Performance
1) How often is your performance higher than other employees with the same job
position?
2) How often is the quality of your work higher than it what it needed to be?
3) How would you rate your overall job performance?
Turnover
1) Which of the following statements most clearly reflects your feelings about
your future with your organization in the next year?*
2) How do you feel about leaving your organization?
3) If you were completely free to choose, would you prefer or not prefer to
continue working for your organization?*
4) How important is it to you personally that you spend your career in this
organization rather than some other organization? This table provides the survey questions asked to measure our constructs of interest. For constructs measured using
multiple questions, Cronbach’s Alpha (α) is provided, indicating inter-item reliability. Unless otherwise indicated,
all questions were measured using a 7-point Likert Scale with higher responses indicating higher levels of the
variable.
* indicates question was reverse-coded. +
indicates question is measured using a sliding scale from 0 to 50 years ++
indicates question is measured with the following scale: 1 = male; 2 = female +++
indicates question is measured using the following scale: 1 = Full Time; 2 = Part Time (< 36 hours per week); 3 =
Unemployed ++++
indicates question is measured using the following scale: 1 = Less than high school degree; 2 = High school
degree; 3 = Some university or college; 4 = University or college degree; 5 = Graduate degree or more +++++
indicates participants were provided with a list of industries from which they could choose. Please see Table 3,
Panel A for the list of industries.
39
REFERENCES
Adler, P. S. (1993). The "learning bureaucracy": New United Motor Manufacturing
Incorporated. In B. M. Staw, & L. L. Cummings (Eds.), Research in Organizational
Behavior (pp. 111-194). Greenwich, CT: JAI Press.
Adler, P. S., and C. X. Chen. 2011. Combining creativity and control: Understanding individual
motivation in large-scale collaborative creativity. Accounting, Organizations, and Society
36 (2): 63-85.
Ahrens, T., and C. S. Chapman. 2004. Accounting for Flexibility and Efficiency: A Field Study
of Management Control Systems in a Restaurant Chain. Contemporary Accounting
Research 21 (2): 271–302.
Amabile, T. M. (1996). Creativity in context: Update to the social psychology of creativity.
Boulder, CO: Westview Press.
Amabile, T. M., K. G. Hill, B. A. Hennessey, and E. M. Tighe. 1994. The Work Preference
Inventory: Assessing Intrinsic and Extrinsic Motivational Orientations. Journal of
Personality and Social Psychology 66 (5): 950–67.
Benware, C. A., and E. L. Deci. 1984. Quality of Learning With an Active Versus Passive
Motivational Set. American Educational Research Journal 21 (4): 755–765.
Balakrishnan, R., G. Sprinkle, and M. Williamson. 2011. Contracting benefits of corporate
giving: An experimental investigation. The Accounting Review 86 (6): 1887-1907.
Berinsky, A. J., G. A. Huber, and G. S. Lenz. 2012. Evaluating Online Labor Markets for
Experimental Research: Amazon.com’s Mechanical Turk. Political Analysis 20 (3): 351–
368.
Bielby, D. D., and W. T. Bielby. 1988. She Works Hard for the Money: Household
Responsibilities and the Allocation of Work Effort. American Journal of Sociology 93 (5):
1031–1059.
Bol, J. C. 2008. Subjectivity in Compensation Contracting. Journal of Accounting Literature 27:
1–24.
Bonner, S. E., R. Hastie, G. B. Sprinkle, and S. M.Young. 2000. A Review of the Effects of
Financial Incentives on Performance in Laboratory Tasks: Implications for Management
Accounting. Journal of Management Accounting Research 12: 19–64.
Bono, J. E., & Judge, T. A. (2003). Self-concordance at work: understanding the motivational
effects of transformational leaders. Academy of Management Journal, 46, 554–571.

40
Brown, J.D. 2009. Choosing the Right Type of Rotation in PCA and EFA. JALT Testing &
Evaluation 13(3); 20-25.
Campbell, D. T., and D. W. Fiske. 1959. Convergent and Discriminant Validation by the
Multitrait-Multimethod Matrix. Psychological Bulletin 56 (2): 81–105.
Cattell, R. B. 1966. The scree test for the number of factors. Multivariate Behavioral Research
1, 245-276.
Chen, C. X., M. G. Williamson, and F. H. Zhou. 2012. Reward system design and group
creativity: An experimental investigation. The Accounting Review 87(6): 1885-1911.
deCharms, R. (1968). Personal Causation. New York, NY: Academic Press.
Deci, E. L. (1975). Intrinsic Motivation. New York, NY: Plenum.
Deci, E. L., & Ryan, R. M. (1985). Intrinsic Motivation and Self-determination in Human
Behavior. New York, NY: Plenum.
Deci, E. L., Connell, J. P., & Ryan, R. M. (1989). Self-determination in a work organization.
Journal of Applied Psychology, 74, 580–590.
Drucker, P. 1954. The Practice of Management. New York: Harper & Brothers.
Gagne´, M. (2003). The role of autonomy support and autonomy orientation in the engagement
of prosocial behavior. Motivation and Emotion, 27, 199–223.
Gagné, M., Chemolli, E., Forest, J., & Koestner, R. (2008). The temporal relations between work
motivation and organizational commitment. Psychologica Belgica, 48, 219-241.
Gagne, M. and E. L. Deci. 2005. Self-Determination Theory and Work Motivation. Journal of
Organizational Behavior 26 (4) (June): 331–362.
Grolnick,W. S., & Ryan, R. M. (1989). Parent styles associated with children’s self-regulation
and competence in school. Journal of Educational Psychology, 81, 143–154.
Gottfried, A. E. (1990). Academic intrinsic motivation in young elementary school children.
Journal of Educational Psychology, 82, 535-538.
Greene-Demers, I., Pelletier, L. G., & Me´nard, S. (1997). The impact of behavioral difficult on
the saliency of the association between self-determined motivation and environmental
behaviors. Canadian Journal of Behavioural Science, 29, 157–166.

41
Griffin, M. A., A. Neal, and S. K. Parker. 2007. A New Model of Work Role Performance:
Positive Behavior in Uncertain and Interdependent Contexts. Academy of Management
Journal 50 (2): 327–347.
Guo, L., B. Wong-On-Wing, and G. Lui. 2013. Input-based performance evaluation, incentive
intensity, and proactive work behavior. Advances in Management Accounting 22: 185-
223.
Guttman, L. 1954. A new approach to factor analysis: The radix. In P. Lazarfeld (Ed.),
Mathematical Thinking in the Social Sciences (pp. 258-348). New York: Free Press of
Glencoe.
Heider, F. (1958). The Psychology of Interpersonal Relations, New York, NY: Wiley.
Horton, J. J., and L. B. Chilton. 2010. The Labor Economics of Paid Crowdsourcing.
Proceedings of the 11th ACM Conference on Electronic Commerce.
Horton, J. J., D. G. Rand, and R. J. Zeckhauser. 2011. The Online Laboratory: Conducting
Experiments in a Real Labor Market. Experimental Economics 14: 1–36.
Huberts, G. J. 2012. Differences in management control systems in large and small
organisations: a configurational approach. Unpublished dissertation.
Hurst, A. 2014. The Purpose Economy: How Your Desire for Impact, Personal Growth and
Community is Changing the World. Elevate: Boise, ID.
Ilardi, B. C., Leone, D., Kasser, T., & Ryan, R. M. (1993). Employee and supervisor ratings of
motivation: main effects and discrepancies associated with job satisfaction and
adjustment in a factory setting. Journal of Applied Social Psychology, 23, 1789–1805.
Jørgensen, B., and M. Messner. 2009. Management Control in New Product Development: The
Dynamics of Managing Flexibility and Efficiency. Journal of Management Accounting
Research 21: 99–124.
Kaiser, H.F. 1960. The application of electronic computers to factor analysis. Educational and
Psychological Measurement 20, 141-151.
Kim, Y., M. S. Park, and B. Wier. 2012. Is Earnings Quality Associated with Corporate Social
Responsibility? The Accounting Review 87 (3): 761–796.
Koestner, R., R. J Vallerand, G. F. Losier, and D. Carducci. 1996. Identified and Introjected
Forms of Political Internalization: Extending Self-Determination Theory. Journal of
Personality and Social Psychology 70 (5): 1025–1036.
Kunz, A. H., & Pfaff, D. (2002). Agency theory, performance evaluation, and the hypothetical
construct of intrinsic motivation. Accounting, Organizations, and Society, 27, 275-295.

42
Lee, K., and N. J. Allen. 2002. Organizational Citizenship Behavior and Workplace Deviance:
The Role of Affect and Cognitions. Journal of Applied Psychology 87 (1): 131–142.
Luft, Joan. 1994. Bonus and Penalty Incentives Contract Choices by Employees. Journal of
Accounting and Economics 18: 181–206.
Lynch, M. F. Jr., R. W. Plant, and R. M. Ryan. 2005. Psychological needs and threat to safety:
Implications for staff and patients in a psychiatric hospital for youth. Professional
Psychology: Research and Practice 36(4): 415-425.
Mael, F., and B. E, Ashforth. 1992. Alumni and their Alma Mater: A partial test of the
reformulated model of organizational identification. Journal of Organizational Behavior:
13(2): 103-123.
Majors, T.. 2014. Communicating Measurement Uncertainty: An Experimental Study of
Financial Reporting Implications for Managers and Investors. Working Paper
Marin, L., S. Ruiz, and A. Rubio. 2008. The Role of Identity Salience in the Effects of Corporate
Social Responsibility on Consumer Behavior. Journal of Business Ethics 84 (1) (March 14):
65–78.
Martin, P. R., and D. V. Moser. 2011. Managers’ Green Investment and Related Disclosure
Decisions. Working Paper.
Matten, D., and A. Crane. 2005. Corporate Citizenship: Toward an Extended Theoretical
Conceptualization. Academy of Management Journal 30 (1): 166–179.
McClurg, L. N. 2001. Team Rewards: How Far Have We Come? Human Resource Management
40 (1): 73–86. doi:10.1002/hrm.4017. http://doi.wiley.com/10.1002/hrm.4017.
Moser, D. V., and P. R. Martin. 2012. A Broader Perspective on Corporate Social Responsibility
Research in Accounting. The Accounting Review 87 (3): 797–806.
Moulang, C. 2013. Performance Measurement System Use in Generating Psychological
Empowerment and Individual Creativity. Accounting & Finance.
O’Reilly, C., & Chatman, J. (1986). Organizational commitment and psychological adjustment:
the effects of compliance, identification, and internalization on prosocial behavior. Journal
of Applied Psychology, 71, 492–499.
Paolacci, G., J. Chandler, and P. G. Ipeirotis. 2010. Running Experiments on Amazon
Mechanical Turk. Judgment and Decision Making 5 (5): 411–419.
Pelletier, L. G., Fortier, M. S., Vallerand, R. J., Tuson, K. M., Brière, N. M., & Blais, M. R.
(1995). Toward a new measure of intrinsic motivation, extrinsic motivation, and

43
amotivation in sports: The Sport Motivation Scale (SMS). Journal of Sport & Exercise
Psychology, 17, 35-53.
Pelletier, L. G., Tuson, K. M., Greene-Demers, I., Noels, K., & Beaton, A. M. (1998). Why are
you doing things for the environment? The Motivation Toward the Environmental Scale
(MTES). Journal of Applied Social Psychology, 28, 437–468.
Podsakoff, P. M., MacKenzie, S. B., & Bommer, W. H. (1996). Transformational leader behaviors and substitutes for leadership as determinants of employee satisfaction, commitment, trust, and organizational citizenship behaviors. Journal of Management, 22, 259–298.
Podsakoff, P. M., S. B. MacKenzie, J. Y. Lee, and N. P. Podsakoff. 2003. Common method
biases in behavioral research: A critical review of the literature and recommended remedies.
Journal of Applied Psychology 88 (5): 879-903.
Posdakoff, P. M., and D. W. Organ. 1986. Self-Reports in Organizational Research: Problems
and Prospects. Journal of Management 12 (4): 531–544.
Rammstedt, B., and O. P. John. 2007. Measuring Personality in One Minute or Less: A 10-Item
Short Version of the Big Five Inventory in English and German. Journal of Research in
Personality 41 (1): 203–212.
Rennekamp, K. 2012. Processing Fluency and Investors’ Reactions to Disclosure Readability.
Journal of Accounting Research 50 (5): 1319–1354.
Ryan, R. M., & Connell, J. P. (1989). Perceived locus of causality and internalization:
Examining reasons for acting in two domains. Journal of Personality and Social
Psychology, 57, 749-761.
Shirom, A.,Westman, M., & Melamed, S. (1999). The effects of pay systems on blue-collar
employees’ emotional distress: the mediating effects of objective and subjective work
monotony. Human Relations, 52, 1077–1097.
Shore, L. M., and H. J. Martin. 1989. Job Satisfaction and Organizational Commitment in
Relation to Work Performance and Turnover Intentions. Human Relations 42 (7): 625–638.
Simons, R. (1995). Levers of control: how managers use innovative control systems to drive
strategic renewal. Boston, MA: Harvard Business School Press.
Stevens, J.P. 1992. Applied multivariate statistics for the social sciences, 2nd
edition. Hillsdale,
NJ. Erlbaum.
Tabachnick, B. G., & Fidell, L. S. (2007). Using multivariate statistics (5th ed.). Upper Saddle
River, NJ: Pearson Allyn & Bacon.

44
Terkel, S. (1972). Working. New York, NY: Avon Books.
Van der Stede, W. A., Young, S. M., and Chen, C. X. 2005. Assessing the quality of evidence in
empirical management accounting research: The case of survey studies. Accounting,
Organizations and Society 30: 655–684.
Van Maanen, J., & Schein, E. H. (1979). Towards a Theory of Organizational Socialization.
Research in Organizational Behaviour, 1, 209–64.
Widener, S. K. 2007. An Empirical Analysis of the Levers of Control Framework. Accounting,
Organizations and Society 32 (7-8): 757–788.
Wong-On-Wing, B., L. Guo, and G. Lui. 2010. Intrinsic and extrinsic motivation and
participation in budgeting: Antecedents and consequences. Behavioral Research in
Accounting 22(2): 133-153.

45
TABLE 1: PLOC-WM Validation
Panel A: Factor Analysis – Promax Oblique Rotation
Factor 1 Factor 2 Factor 3 Factor 4
Intrinsic 1 0.77 0.19 -0.05 -0.02
Intrinsic 2 0.85 0.04 0.02 -0.03
Intrinsic 3 0.80 0.07 0.03 0.04
Intrinsic 4 0.91 -0.03 0.04 -0.08
Identified 1 0.27 0.41 -0.04 0.20
Identified 2 0.19 0.76 -0.03 0.01
Identified 3 0.06 0.83 -0.04 -0.04
Identified 4 0.14 0.72 0.08 -0.04
Introjected 1 -0.12 0.13 0.21 0.38
Introjected 2 0.17 0.04 -0.07 0.75
Introjected 3 0.18 0.10 -0.02 0.68
Introjected 4 -0.18 -0.13 0.12 0.72
External 1 -0.06 -0.09 0.31 0.07
External 2 0.01 0.04 0.69 0.01
External 3 0.17 0.05 0.58 -0.01
External 4 0.16 0.06 0.59 0.12
Eigenvalue: 7.32 1.93 1.25 0.93
Cumulative
Variance Explained: 43.5% 52.1% 56.1% 60.2%

46
Panel B: Correlation Among all Questions used to Measure PLOC-WM
Intrinsic Identified Introjected External
1a 2a 3a 4a 1b 2b 3b 4b 1c 2c 3c 4c 1d 2d 3d 4d
1a 1.00
2a 0.77* 1.00
3a 0.79* 0.78* 1.00
4a 0.77* 0.80* 0.75* 1.00
1b 0.55* 0.55* 0.64* 0.51* 1.00
2b 0.71* 0.63* 0.66* 0.61* 0.66* 1.00
3b 0.61* 0.59* 0.55* 0.52* 0.53* 0.75* 1.00
4b 0.67* 0.62* 0.61* 0.59* 0.57* 0.73* 0.72* 1.00
1c 0.21* 0.19* 0.25* 0.19* 0.28* 0.24* 0.22* 0.30* 1.00
2c 0.42* 0.40* 0.41* 0.37* 0.43* 0.42* 0.36* 0.39* 0.33* 1.00
3c 0.46* 0.46* 0.50* 0.40* 0.54* 0.50* 0.40* 0.44* 0.34* 0.72* 1.00
4c 0.06 0.06 0.10 0.04 0.14* 0.08 0.06 0.07 0.40* 0.46* 0.41* 1.00
1d 0.01 0.06 0.04 0.04 0.12* 0.05 -0.02 0.03 0.07 0.06 0.15* 0.11* 1.00
2d 0.32* 0.34* 0.36* 0.33* 0.27* 0.32* 0.27* 0.36* 0.22* 0.27* 0.33* 0.18* 0.19* 1.00
3d 0.39* 0.45* 0.45* 0.43* 0.34* 0.40* 0.33* 0.42* 0.27* 0.32* 0.35* 0.12* 0.28* 0.46* 1.00
4d 0.48* 0.48* 0.51* 0.47* 0.37* 0.45* 0.40* 0.44* 0.36* 0.39* 0.42* 0.27* 0.09 0.58* 0.52* 1.00
Panel C: Correlation Among PLOC-WM
Intrinsic Identified Introjected External
Intrinsic 1.00
Identified 0.79* 1.00
Introjected 0.47* 0.50* 1.00
External 0.58* 0.53* 0.52* 1.00 This table provides validity around the PLOC-WM construct. Panel A reports the results of factor analysis on the 16 PLOC-WM questions with promax
rotation. Factor loadings above 0.30 are reported in bold font. The eigenvalue and cumulative variance explained using each factor is provided on the
bottom of Panel A. The promax oblique rotation is used because it allows correlation to exist among the extracted factors. Given both theoretical (Adler
and Chen 2011) and pragmatic reasons (i.e., high correlation among factor shown in Panel C), promax rotation is appropriate. Panel B reports the
correlation among the 16 questions asked to measure PLOC-WM. Panel C reports the correlation among the four extracted PLOC-WM factors.

47
TABLE 2: Descriptive Statistics of Variables Panel A: Perceived Loci of Control Work Motivation (PLOC-WM) Questions Variable 1
st Quartile Median 3
rd Quartile Mean Std. Dev.
Intrinsic* 3.25 4.50 5.75 4.39 1.73
Identified* 3.25 4.50 5.75 4.44 1.60
Introjected* 3.50 4.25 5.25 4.21 1.36
External* 3.50 4.25 5.25 4.30 1.30
Panel B: Determinants of PLOC-WM
LocBelief* 3.13 4.75 5.75 4.32 1.87
LocBound* 4.00 5.50 6.25 4.99 1.77
LocDiag* 4.00 4.82 5.55 4.65 1.29
LocInter* 3.60 4.20 5.20 4.38 1.24
Subjective* 2.67 3.67 4.67 3.79 1.38
NonFinReward 2.00 4.00 5.00 3.77 1.84
FinReward 1.00 3.00 5.00 3.07 1.92
GroupBased 2.00 4.00 5.00 3.57 1.71
PayPerfSens 1.00 2.50 4.00 2.97 1.86
Penalty 1.00 2.00 4.00 2.85 1.82
Reward 2.00 3.00 5.00 3.39 1.88
CorpCit 4.00 5.00 6.00 4.80 1.56
BenefitSoc 4.00 5.00 6.00 4.74 1.77
Panel C: Personality and Control Variables
Autonomy* 3.80 4.80 5.60 4.66 1.26
Narc* 2.78 3.56 4.22 3.49 1.00
Mach* 3.10 3.80 4.35 3.74 0.96
Extra* 2.50 3.50 4.50 3.59 1.56
Agree* 4.00 5.00 6.00 4.82 1.29
Consc* 1.50 2.50 3.50 2.55 1.21
Neuro* 4.00 5.00 6.00 4.69 1.53
Open* 2.00 3.00 4.00 2.95 1.23
Tenure+ 2.00 3.00 7.00 5.28 5.77
Gender++
1.00 1.00 2.00 1.45 0.50
JobStatus+++
1.00 1.00 2.00 1.55 0.77
Education++++
3.00 4.00 4.00 3.58 0.84
Panel D: Consequences of PLOC-WM Creative* 3.88 4.75 5.50 4.65 1.28 OrgID* 3.00 4.40 5.40 4.23 1.59 OCB* 3.44 4.50 5.50 4.39 1.37 Effort* 4.33 5.33 6.33 5.20 1.34 Performance* 4.83 5.67 6.00 5.43 1.00 Turnover* 3.00 4.00 5.00 3.98 1.16 This table reports descriptive statistics for all variable of interest. Please see Appendix 1 for variable definitions and
questions used to measure each variable. Unless otherwise specified, all responses were based on a seven point
Likert Scale with higher values reflecting higher levels of the variable.

48
* indicates multiple questions were used to measure the variable. For this table, all responses to all questions
measuring the variable are averaged together for each participant. The mean, median, and standard deviation of the
averages for all participants is reported. +
indicates question is measured using a sliding scale from 0 to 50 years ++
indicates question measured with the following scale: 1 = male; 2 = female +++
indicates question is measured using the following scale: 1 = Full Time; 2 = Part Time (< 36 hours per week); 3 =
Unemployed ++++
indicates question is measured using the following scale: 1 = Less than high school degree; 2 = High school
degree; 3 = Some university or college; 4 = University or college degree; 5 = Graduate degree or more
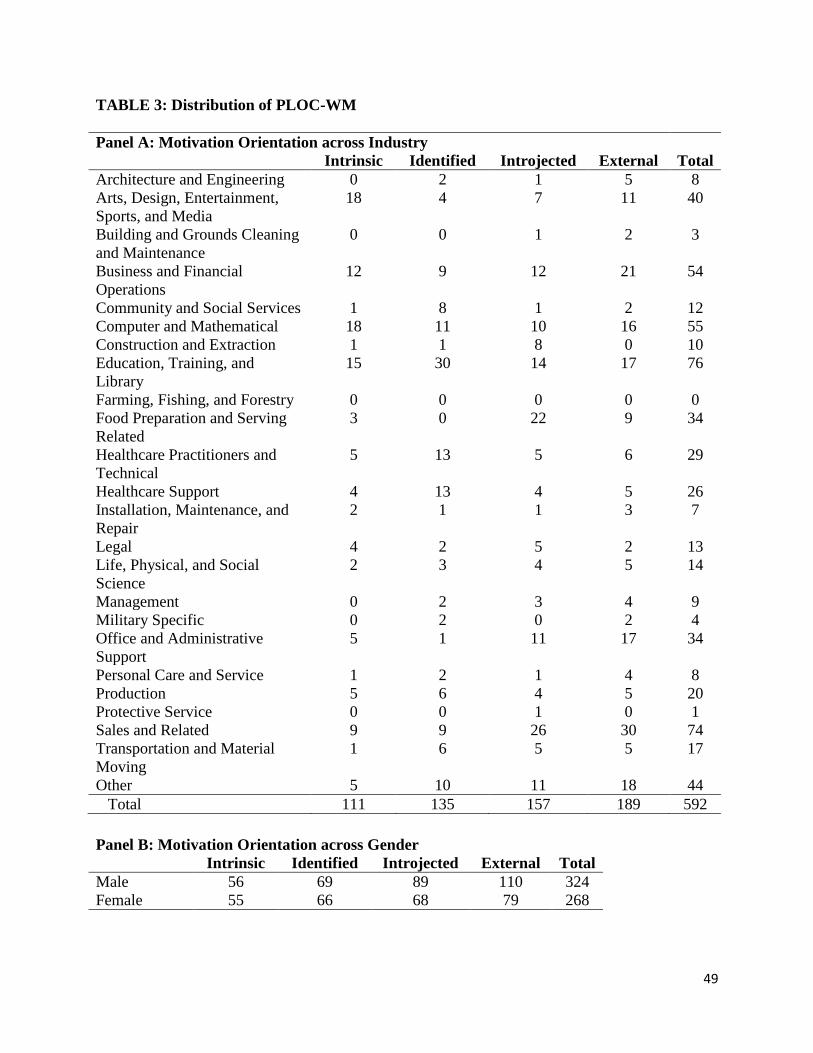
49
TABLE 3: Distribution of PLOC-WM
Panel A: Motivation Orientation across Industry
Intrinsic Identified Introjected External Total
Architecture and Engineering 0 2 1 5 8
Arts, Design, Entertainment,
Sports, and Media
18 4 7 11 40
Building and Grounds Cleaning
and Maintenance
0 0 1 2 3
Business and Financial
Operations
12 9 12 21 54
Community and Social Services 1 8 1 2 12
Computer and Mathematical 18 11 10 16 55
Construction and Extraction 1 1 8 0 10
Education, Training, and
Library
15 30 14 17 76
Farming, Fishing, and Forestry 0 0 0 0 0
Food Preparation and Serving
Related
3 0 22 9 34
Healthcare Practitioners and
Technical
5 13 5 6 29
Healthcare Support 4 13 4 5 26
Installation, Maintenance, and
Repair
2 1 1 3 7
Legal 4 2 5 2 13
Life, Physical, and Social
Science
2 3 4 5 14
Management 0 2 3 4 9
Military Specific 0 2 0 2 4
Office and Administrative
Support
5 1 11 17 34
Personal Care and Service 1 2 1 4 8
Production 5 6 4 5 20
Protective Service 0 0 1 0 1
Sales and Related 9 9 26 30 74
Transportation and Material
Moving
1 6 5 5 17
Other 5 10 11 18 44
Total 111 135 157 189 592
Panel B: Motivation Orientation across Gender
Intrinsic Identified Introjected External Total
Male 56 69 89 110 324
Female 55 66 68 79 268

50
Panel C: Motivation Orientation across Employment Status
Intrinsic Identified Introjected External Total
Full Time 67 82 94 123 366
Part Time 27 24 34 41 126
Unemployed 17 29 29 25 100
Panel D: Motivation Orientation across Job Tenure
Intrinsic Identified Introjected External Total
0-4 years 54 75 94 123 347
5-9 years 34 33 40 44 152
10-14 years 12 12 18 12 54
15-19 years 5 10 1 5 21
20 + years 6 5 4 5 20
Panel E: Motivation Orientation
Full Sample
(n=594)
Max Intrinsic
(n=111)
Max Identified
(n=135)
Max Introjected
(n=158)
Max External
(n=190)
Mean Med SD Mean Med SD Mean Med SD Mean Med SD Mean Med SD
Intrinsic 4.38 4.50 1.73 5.84 6.00 1.04 4.59 4.75 1.61 3.51 3.50 1.59 4.10 4.25 1.69
Identified 4.44 4.50 1.60 4.79 4.75 1.29 5.50 5.75 1.36 3.74 3.75 1.50 4.06 4.00 1.56
Introjected 4.21 4.25 1.36 3.80 3.75 1.24 3.86 4.00 1.27 5.01 5.00 1.14 4.03 4.13 1.40
External 4.29 4.25 1.30 4.09 4.00 1.20 3.93 4.00 1.24 3.92 3.75 1.23 4.98 5.00 1.20
This table reports the frequency of the dominant PLOC-WM across industry, gender, employment status, and job tenure. To calculate the dominant PLOC-WM,
we identify the maximum composite score of the four PLOC-WM composites. For example, if a respondent’s composite score was highest for identified
motivation, then this respondent would be counted in the “identified” column for the purpose of this table. Panel A provides the distribution of dominant PLOC-
WM across different industries. Panels B-D provides the distribution of dominant PLOC-WM across gender, employment status, and job tenure. Panel E
provides mean, median, and standard deviation of all four PLOC-WM across the participants identified as having a specific dominant PLOC-WM.

51
TABLE 4: Correlations Among Variables
Panel A: Correlation Among Determinants
Intrin Ident Intro Exter LocBel LocBou LocDia LocInt Subje NonFin
Intrin 1.00
Ident 0.79 1.00
Intro 0.47 0.50 1.00
Exter 0.58 0.53 0.52 1.00
LocBel 0.28 0.40 0.13 0.26 1.00
LocBou 0.16 0.23 0.11 0.18 0.53 1.00
LocDia 0.33 0.37 0.21 0.36 0.52 0.37 1.00
LocInt 0.25 0.28 0.15 0.24 0.38 0.28 0.57 1.00
Subje -0.15 -0.19 -0.13 -0.21 -0.29 -0.34 -0.51 -0.38 1.00
NonFin 0.38 0.38 0.18 0.34 0.30 0.23 0.40 0.26 -0.37 1.00
FinRe 0.24 0.18 0.11 0.32 0.19 0.10 0.29 0.23 -0.30 0.35
Group 0.07 0.12 -0.01 0.02 0.06 0.01 0.15 0.09 -0.03 0.08
PayPer 0.19 0.06 0.02 0.17 0.07 0.03 0.15 0.13 -0.24 0.17
Pen -0.05 -0.03 0.04 0.02 0.01 0.07 0.03 0.09 -0.18 -0.01
Rew 0.26 0.22 0.12 0.33 0.28 0.18 0.36 0.30 -0.39 0.44
CorpCit 0.40 0.50 0.22 0.27 0.36 0.22 0.32 0.26 -0.22 0.32
BenSoc 0.43 0.64 0.21 0.25 0.37 0.21 0.29 0.18 -0.17 0.28
Panel A (Continued): Correlation Among Determinants
FinRe Group PayPer Pen Rew CorpCit BenSoc
FinRe 1.00
Group 0.07 1.00
PayPer 0.46 -0.04 1.00
Pen 0.07 0.06 0.13 1.00
Rew 0.63 0.08 0.44 0.16 1.00
CorpCit 0.15 0.05 0.07 -0.20 0.25 1.00
BenSoc 0.02 0.11 -0.03 -0.08 0.08 0.57 1.00
Panel B: Correlation Among Consequences
Intrin Ident Intro Exter Creat OrgID OCB Effort Perf Turn
Intrin 1.00
Ident 0.79 1.00
Intro 0.47 0.50 1.00
Exter 0.58 0.53 0.52 1.00
Creat 0.63 0.51 0.23 0.37 1.00
OrgID 0.65 0.69 0.39 0.46 0.61 1.00
OCB 0.63 0.66 0.32 0.40 0.68 0.79 1.00
Effort 0.54 0.49 0.30 0.30 0.60 0.48 0.50 1.00
Perf 0.30 0.29 0.15 0.19 0.44 0.27 0.38 0.42 1.00
Turn -0.48 -0.53 -0.22 -0.39 -0.34 -0.58 -0.53 -0.22 -0.13 1.00 This table reports the correlation among determinants and consequences of PLOC-WM. Values in bold font indicate
p-value significance at < 0.01.

52
TABLE 5: Ordinary Least-Squares Regression Examining PLOC-WM Determinants
This table reports the estimates from the regression based on the following model.
Panel A: Models with Industry/Education Controls
Base Model without Org. Variables Full Model with Org. Variables
Intrinsic Identified Introjected External Intrinsic Identified Introjected External
LocBelief
0.01
(0.24)
0.04**
(2.07)
-0.02
(-0.70)
-0.01
(-0.19)
LocBound
-0.01
(-0.28)
-0.01
(-0.57)
0.01
(0.52)
0.02
(0.78)
LocDiag
0.03*
(1.68)
0.02
(1.09)
0.03
(1.46)
0.05***
(2.91)
LocInter
0.03
(1.24)
0.03
(1.49)
0.01
(0.16)
0.01
(0.59)
Subjective
0.07**
(2.37)
0.05**
(2.05)
0.01
(0.06)
0.06**
(1.93)
NonFinReward
0.09***
(4.39)
0.07***
(3.74)
0.04*
(1.63)
0.05***
(2.64)
FinReward
0.01
(0.46)
0.02
(1.19)
0.02
(0.71)
0.04
(1.59)
GroupBased
0.01
(0.24)
0.01
(0.89)
-0.02
(-1.03)
-0.03
(-1.33)
PayPerfSens
0.05***
(2.56)
0.01
(0.27)
-0.02
(-1.04)
-0.01
(-0.13)
Penalty
0.02
(0.91)
0.03**
(1.93)
0.05**
(2.39)
0.01
(0.42)
Rewards
0.01
(0.42)
0.01
(0.26)
0.01
(0.33)
0.06***
(2.53)

53
CorpCit
0.07***
(2.55)
0.09***
(3.68)
0.08***
(2.46)
0.05*
(1.87)
BenefitSoc
0.12***
(4.78)
0.20***
(9.28)
0.05*
(1.68)
0.06**
(2.37)
Autonomy 0.08***
(3.33)
0.10***
(4.55)
0.03
(1.31)
0.05**
(2.15)
0.05**
(2.43)
0.06***
(3.65)
0.01
(0.61)
0.03
(1.25)
Narc 0.11**
(4.04)
0.12***
(4.87)
0.03
(0.93)
0.15***
(5.87)
0.05**
(2.21)
0.06***
(3.05)
0.01
(0.05)
0.11***
(4.59)
Mach -0.03
(-1.14)
-0.01
(-0.09)
0.06**
(2.13)
0.05**
(2.16)
-0.03
(-1.51)
-0.01
(-0.17)
0.04*
(1.68)
0.04*
(1.70)
Extra -0.09**
(-2.39)
-0.07**
(-2.07)
-0.07*
(-1.82)
-0.07**
(-2.06)
-0.05
(-1.50)
-0.03
(-1.09)
-0.06
(-1.58)
-0.05*
(-1.66)
Agree 0.13***
(3.21)
0.13***
(3.60)
0.12***
(3.04)
0.05
(1.26)
0.05
(1.39)
0.05*
(1.69)
0.08**
(2.05)
-0.02
(-0.53)
Consc 0.12***
(3.53)
0.11***
(3.47)
0.15***
(4.41)
0.09***
(2.77)
0.08***
(2.57)
0.07***
(2.51)
0.12***
(3.59)
0.05
(1.60)
Neuro 0.01
(0.11)
0.04
(1.29)
0.13***
(3.89)
0.09***
(2.82)
-0.02
(-0.74)
0.01
(0.38)
0.12***
(3.45)
0.06**
(2.17)
Open 0.05
(1.28)
-0.01
(-0.14)
-0.02
(-0.47)
0.02
(0.58)
0.04
(1.12)
-0.01
(-0.12)
-0.03
(-0.78)
-0.01
(-0.12)
Tenure 0.02***
(3.54)
0.02***
(3.88)
0.02***
(3.01)
0.01*
(1.80)
0.02***
(3.09)
0.02***
(3.18)
0.02***
(2.54)
0.01
(1.40)
Gender -0.02
(-0.21)
0.08
(1.08)
-0.11
(-1.30)
-0.10
(-1.27)
-0.06
(-0.81)
0.03
(0.51)
-0.15*
(-1.84)
-0.12*
(-1.68)
JobStatus Yes Yes Yes Yes Yes Yes Yes Yes
Education Yes Yes Yes Yes Yes Yes Yes Yes
Industry Yes Yes Yes Yes Yes Yes Yes Yes
Observations 592 592 592 592 592 592 592 592
Adjusted R2
0.25 0.29 0.10 0.17 0.41 0.56 0.15 0.31
F-statistic 6.11 7.39 2.67 4.08 9.07 15.54 3.06 6.09

54
TABLE 5 (Continued)
Panel B: Model without Industry/Education Controls
Intrinsic Identified Introjected External
LocBelief -0.01
(-0.24)
0.04**
(2.11)
-0.03
(-1.71)
-0.01
(-0.61)
LocBound -0.01
(-0.66)
-0.01
(-0.83)
0.01
(0.37)
0.02
(0.94)
LocDiag 0.04**
(2.03)
0.02
(1.32)
0.03*
(1.68)
0.06***
(3.39)
LocInter 0.03
(1.14)
0.03
(1.32)
0.01
(0.32)
0.01
(0.25)
Subjective 0.09***
(3.17)
0.06**
(2.40)
0.02
(0.46)
0.06**
(2.23)
NonFinReward 0.10***
(4.75)
0.07***
(4.03)
0.04
(1.51)
0.06***
(3.03)
FinReward 0.01
(0.56)
0.02
(0.81)
0.02
(0.74)
0.04*
(1.80)
GroupBased 0.01
(0.34)
0.03*
(1.65)
-0.03
(-1.19)
-0.03*
(-1.75)
PayPerfSens 0.05***
(2.63)
-0.01
(-0.25)
-0.03
(-1.30)
-0.01
(-0.17)
Penalty 0.01
(0.26)
0.02
(1.41)
0.04*
(1.81)
0.01
(0.14)
Rewards 0.02
(0.78)
0.01
(0.33)
0.01
(0.14)
0.06***
(2.56)
CorpCit 0.07***
(2.63)
0.07***
(3.18)
0.06**
(2.04)
0.04
(1.48)
BenefitSoc 0.13***
(5.78)
0.23***
(11.92)
0.05**
(1.96)
0.06***
(2.76)
Autonomy 0.04**
(2.20)
0.06***
(3.52)
0.02
(0.75)
0.02
(1.06)
Narc 0.07***
(2.94)
0.07***
(3.27)
0.03
(0.97)
0.13***
(5.41)
Mach -0.05**
(-2.38)
-0.01
(-0.53)
0.03
(1.11)
0.03
(1.34)
Extra -0.07**
(-2.15)
-0.03
(-1.13)
-0.07*
(-1.90)
-0.06**
(-1.97)
Agree 0.03
(0.98)
0.05*
(1.71)
0.09**
(2.34)
-0.01
(-0.27)
Consc 0.09***
(2.90)
0.07***
(2.65)
0.12***
(3.53)
0.06**
(1.96)
Neuro -0.01
(-0.40)
0.02
(0.61)
0.14***
(4.18)
0.08***
(2.75)

55
Open 0.05
(1.55)
0.01
(0.04)
-0.02
(-0.63)
-0.01
(-0.31)
Tenure 0.02***
(3.46)
0.02***
(3.55)
0.01**
(2.19)
0.01
(1.20)
Gender -0.05
(-0.73)
0.07
(1.23)
-0.08
(-0.97)
-0.07
(-1.08)
JobStatus Yes Yes Yes Yes
Education No No No No
Industry No No No No
Observations 592 592 592 592
Adjusted R2
0.39 0.55 0.12 0.30
F-statistic 16.08 29.45 4.22 11.10 *, **, and *** indicate statistical significance at the 10%, 5% and 1% level, respectively (all tests two-tailed).
Coefficients and t-statistics (in parentheses) are provided for each variable. For all variables measured using
multiple questions, factor loadings are used. Please see the Appendix for all questions used to measure each
variable.

56
TABLE 6: Ordinary Least-Squares Regression Examining Consequences of PLOC-WM
This table reports the estimates from the regression based on the following model.
Panel A: Model Including Education and Industry Controls
Creative OrgID OCB Effort Performance Turnover
Intrinsic 1.24***
(9.14)
0.36***
(3.37)
0.52***
(4.13)
0.53***
(5.61)
0.20**
(2.03)
-0.06
(-0.56)
Identified 0.14
(1.04)
1.05***
(9.44)
1.09***
(8.40)
0.26***
(2.71)
0.09
(0.37)
-0.91***
(-8.04)
Introjected -0.20**
(-1.96)
-0.03
(-0.31)
-0.16*
(-1.63)
0.02
(0.35)
-0.04
(-0.55)
0.28***
(3.41)
External 0.05
(0.46)
0.17*
(1.84)
0.13
(1.18)
-0.05
(-0.57)
0.09
(1.08)
-0.35***
(-3.65)
Autonomy -0.19***
(-4.04)
-0.06
(-1.51)
-0.04
(-0.86)
-0.05
(-1.45)
-0.03
(-1.02)
-0.01
(-0.34)
Narc 0.20***
(3.67)
0.01
(0.02)
0.01
(0.01)
0.01
(0.15)
0.08**
(1.94)
0.13***
(2.99)
Mach -0.02
(-0.41)
0.01
(0.21)
0.01
(0.19)
-0.03
(-0.83)
-0.05
(-1.38)
-0.01
(-0.34)
Extra -0.03
(-0.38)
-0.05
(-0.80)
0.01
(0.14)
-0.03
(-0.50)
-0.01
(-0.01)
-0.07
(-1.18)
Agree -0.02
(-0.21)
0.11*
(1.72)
0.05
(0.73)
-0.09*
(-1.72)
-0.12**
(-2.03)
-0.15**
(-2.36)
Consc 0.29***
(4.33)
-0.01
(-0.06)
0.15**
(2.37)
0.33***
(7.04)
0.53***
(10.66)
0.02
(0.29)
Neuro 0.03
(0.45)
0.07
(1.36)
0.01
(0.01)
0.11**
(2.28)
-0.04
(-0.89)
-0.03
(-0.47)
Open 0.40***
(5.10)
0.11*
(1.83)
0.19***
(2.53)
0.08
(1.39)
0.05
(0.79)
0.04
(0.56)
Tenure 0.03**
(2.41)
0.01
(0.95)
0.03**
(2.26)
0.01
(0.77)
0.02*
(1.89)
-0.03***
(-3.28)
Gender -0.01
(-0.05)
-0.05
(-0.38)
0.39***
(2.63)
-0.14
(-1.23)
0.44***
(3.75)
0.02
(0.14)
JobStatus Yes Yes Yes Yes Yes Yes
Education Yes Yes Yes Yes Yes Yes
Industry Yes Yes Yes Yes Yes Yes
Obs. 592 592 592 592 592 592
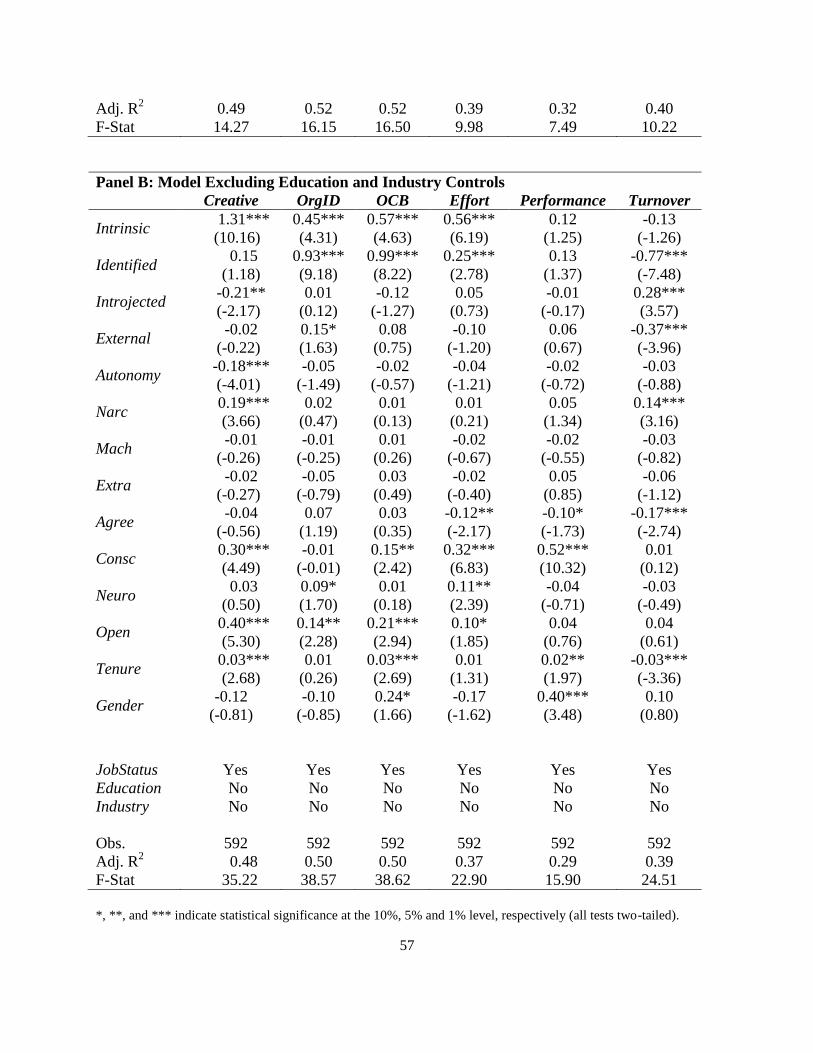
57
Adj. R2
0.49 0.52 0.52 0.39 0.32 0.40
F-Stat 14.27 16.15 16.50 9.98 7.49 10.22
Panel B: Model Excluding Education and Industry Controls
Creative OrgID OCB Effort Performance Turnover
Intrinsic 1.31***
(10.16)
0.45***
(4.31)
0.57***
(4.63)
0.56***
(6.19)
0.12
(1.25)
-0.13
(-1.26)
Identified 0.15
(1.18)
0.93***
(9.18)
0.99***
(8.22)
0.25***
(2.78)
0.13
(1.37)
-0.77***
(-7.48)
Introjected -0.21**
(-2.17)
0.01
(0.12)
-0.12
(-1.27)
0.05
(0.73)
-0.01
(-0.17)
0.28***
(3.57)
External -0.02
(-0.22)
0.15*
(1.63)
0.08
(0.75)
-0.10
(-1.20)
0.06
(0.67)
-0.37***
(-3.96)
Autonomy -0.18***
(-4.01)
-0.05
(-1.49)
-0.02
(-0.57)
-0.04
(-1.21)
-0.02
(-0.72)
-0.03
(-0.88)
Narc 0.19***
(3.66)
0.02
(0.47)
0.01
(0.13)
0.01
(0.21)
0.05
(1.34)
0.14***
(3.16)
Mach -0.01
(-0.26)
-0.01
(-0.25)
0.01
(0.26)
-0.02
(-0.67)
-0.02
(-0.55)
-0.03
(-0.82)
Extra -0.02
(-0.27)
-0.05
(-0.79)
0.03
(0.49)
-0.02
(-0.40)
0.05
(0.85)
-0.06
(-1.12)
Agree -0.04
(-0.56)
0.07
(1.19)
0.03
(0.35)
-0.12**
(-2.17)
-0.10*
(-1.73)
-0.17***
(-2.74)
Consc 0.30***
(4.49)
-0.01
(-0.01)
0.15**
(2.42)
0.32***
(6.83)
0.52***
(10.32)
0.01
(0.12)
Neuro 0.03
(0.50)
0.09*
(1.70)
0.01
(0.18)
0.11**
(2.39)
-0.04
(-0.71)
-0.03
(-0.49)
Open 0.40***
(5.30)
0.14**
(2.28)
0.21***
(2.94)
0.10*
(1.85)
0.04
(0.76)
0.04
(0.61)
Tenure 0.03***
(2.68)
0.01
(0.26)
0.03***
(2.69)
0.01
(1.31)
0.02**
(1.97)
-0.03***
(-3.36)
Gender -0.12
(-0.81)
-0.10
(-0.85)
0.24*
(1.66)
-0.17
(-1.62)
0.40***
(3.48)
0.10
(0.80)
JobStatus Yes Yes Yes Yes Yes Yes
Education No No No No No No
Industry No No No No No No
Obs. 592 592 592 592 592 592
Adj. R2
0.48 0.50 0.50 0.37 0.29 0.39
F-Stat 35.22 38.57 38.62 22.90 15.90 24.51
*, **, and *** indicate statistical significance at the 10%, 5% and 1% level, respectively (all tests two-tailed).

58
Coefficients and t-statistics (in parentheses) are provided for each variable. For all variables measured using
multiple questions, factor loadings are used. Please see the Appendix for all questions used to measure each
variable.