domino’s pizza investor day 2008 - iis windows...
TRANSCRIPT
Domino’s Pizza Investor Day 2008 Domino’s Pizza Leadership Team
October 28, 2008

Forward-Looking Statements
2
This presentation and our accompanying comments may contain “forward-looking statements.” These statements relate to future events or our future financial performance and involve known and unknown risks, uncertainties and other factors that may cause our actual results, levels of activity, performance or achievements to differ materially from these expressed or implied by these forward-looking statements. Although we believe that the expectations reflected in the forward-looking statements are reasonable, we cannot guarantee future results, levels of activity, performance or achievements. We caution you not to place undue reliance on forward-looking statements, which reflect our analysis only and speak only as of the date of this presentation. We undertake no obligation to update the forward-looking statements to reflect subsequent events or circumstances.
This presentation contains trade names, trademarks and service marks of other companies. We do not intend our use or display of other parties’ trade names, trademarks and service marks to imply a relationship with, or endorsement or sponsorship of, these other parties.
2
Today’s Agenda
○ A Context: When the “Game Began to Change”○ The Turnaround Plan – Our Current Position○ 2009 and Beyond…○ Supply Chain Costs – a Range of Possibilities○ Q&A○ Lunch: New Store Concept and Test Product Review○ Financial Overview ○ Q&A○ International – Master Franchisee Perspective ○ Q&A○ Closing

A Context:When the “Game Began to Change”
Domino’s Pizza 2005 – 2008
David A. BrandonChairman & CEO
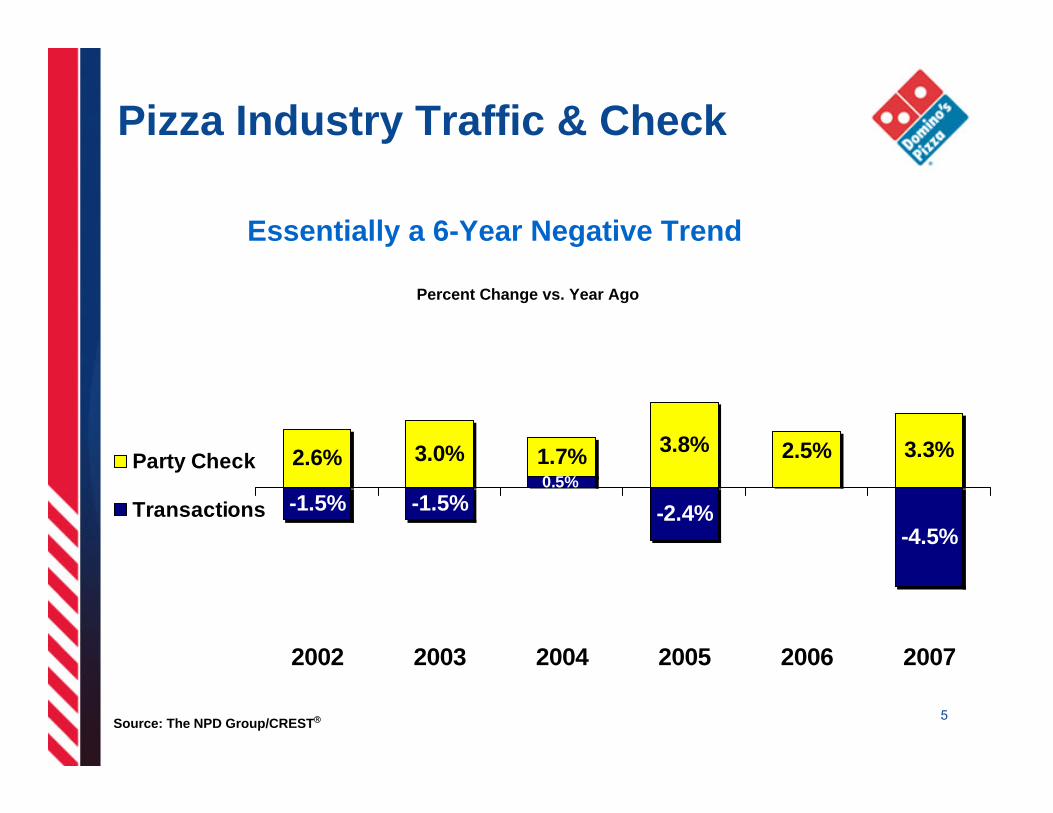
Pizza Industry Traffic & Check
5
Percent Change vs. Year Ago
Essentially a 6-Year Negative Trend
-1.5% -2.4%-4.5%
2.6% 3.0% 1.7% 3.8% 3.3%0.5%
0.0%-1.5%
2.5%
2002 2003 2004 2005 2006 2007
Party Check
Transactions
Source: The NPD Group/CREST®

6
7%
-2%
4%
-3% -1%
5%
-1%
2%
1%4% 0%
-2%
Party Check
Transactions
Percent Change vs. Year Ago
2002 2003 2004 2005 2006 2007
Source: The NPD Group/CREST®
Domino’s Pizza Traffic & Check

Domino’s Overview – Circa 2005
○ National Marketing was driving strong results
○ Franchisee attitudes and behavior
○ The results of our environment and strategy – Store growth– Strong unit economics– Heavy reliance on national promotions / marketing– National Advertising Fund growth

Marketing Spend
3% of sales in 2004
4% of sales in 2005
5% of sales in 2006
5% of sales in 2007
4% of sales in 2008
Avg. 2.3% of sales in ‘04
Avg. 1.5% of sales in ‘05
Avg. 0.5% of sales in ‘06
Avg. 0.5% of sales in ‘07
Avg. 2% of sales in ‘08
Store by store decision
Averages 3% - 5% of sales
Highly dependent on franchisee resources and confidence
8
National(TV – Print PR)
Co-Op(Spot TV – Radio –
Print)
Local(Box-toppers,
local sponsorships)
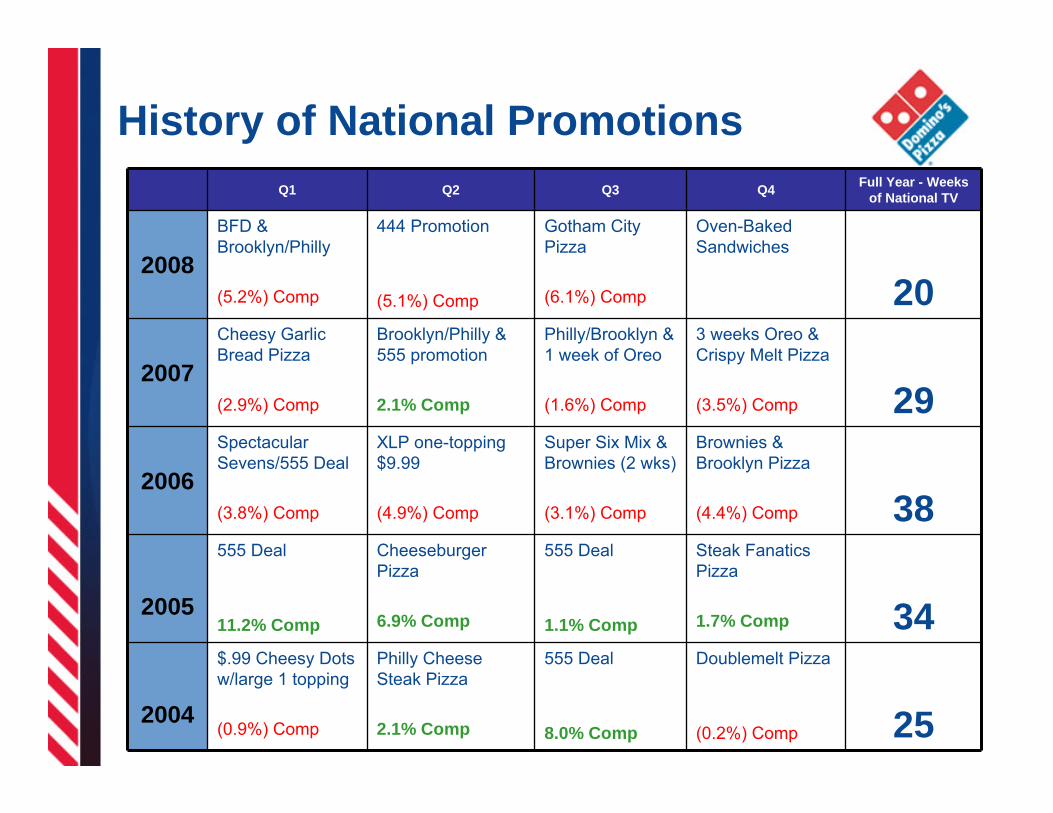
History of National PromotionsQ1 Q2 Q3 Q4 Full Year - Weeks
of National TV
2008BFD & Brooklyn/Philly
(5.2%) Comp
444 Promotion
(5.1%) Comp
Gotham City Pizza
(6.1%) Comp
Oven-Baked Sandwiches
20
2007Cheesy Garlic Bread Pizza
(2.9%) Comp
Brooklyn/Philly & 555 promotion
2.1% Comp
Philly/Brooklyn & 1 week of Oreo
(1.6%) Comp
3 weeks Oreo & Crispy Melt Pizza
(3.5%) Comp 29
2006Spectacular Sevens/555 Deal
(3.8%) Comp
XLP one-topping $9.99
(4.9%) Comp
Super Six Mix & Brownies (2 wks)
(3.1%) Comp
Brownies & Brooklyn Pizza
(4.4%) Comp 38
2005
555 Deal
11.2% Comp
Cheeseburger Pizza
6.9% Comp
555 Deal
1.1% Comp
Steak Fanatics Pizza
1.7% Comp 34
2004
$.99 Cheesy Dots w/large 1 topping
(0.9%) Comp
Philly Cheese Steak Pizza
2.1% Comp
555 Deal
8.0% Comp
Doublemelt Pizza
(0.2%) Comp 25
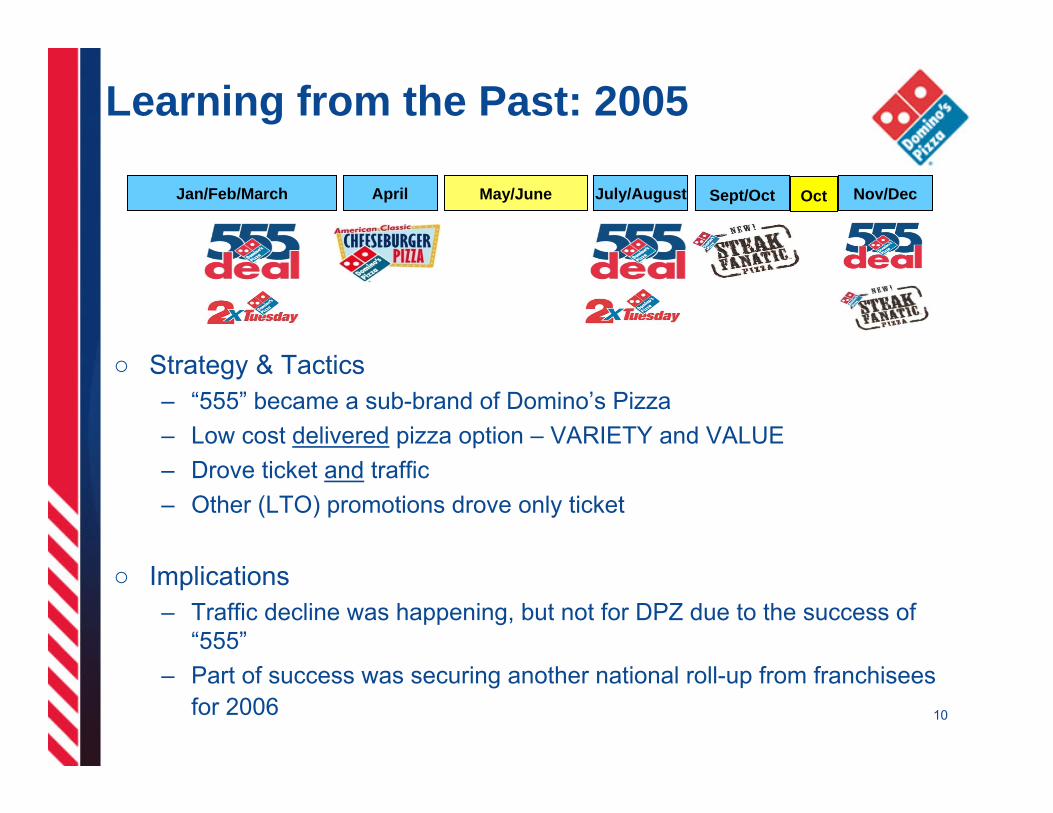
Learning from the Past: 2005
10
○ Strategy & Tactics– “555” became a sub-brand of Domino’s Pizza – Low cost delivered pizza option – VARIETY and VALUE– Drove ticket and traffic– Other (LTO) promotions drove only ticket
○ Implications– Traffic decline was happening, but not for DPZ due to the success of
“555”– Part of success was securing another national roll-up from franchisees
for 2006
Jan/Feb/March April May/June July/August Sept/Oct Nov/DecOct

Learning From the Past: 2006
○ Strategy & Tactics– Knew rolling ’05 comps would be tough – Had more national TV weeks (38 vs. 34)– Pursued aggressive ticket growth strategy (through LTO/bundles)– Delivery charges were rolling out fast
○ Implications– Bad test reads and bad market timing
• 555 success skewed tests from the previous year• Missed the consumer (ticket too high – too fast)
– Bundles drove ticket, but traffic fell at a faster rate (LTOs underperformed)– Secured another roll-up from franchisees for 2007– Delivery charge (“consumer tax”) - further negative traffic pressure
6 wks 4 wks 6 wks 6 wksFeb/MarJan/Feb Apr/May May/June June/July August Aug/Sept Nov/DecOct
11

Learning from the Past: 2007
○ Strategy & Tactics– Rolling weak comps (9 less TV weeks due to media inflation/alternative
media investments)– Continued with LTO promotions – national events dominated calendar – Local store marketing (LSM) campaigns were most successful
• Q2 positive comps– Increased prices (both menu and delivery) during year as costs rose
○ Implications– LTO events didn’t drive traffic – The steadily-rising ticket was weakening traffic more – Comps were weak – the system was relying on national promotions that
weren’t working – no roll-up for 2008!12
Nov Feb/MarJan April May June July OctSeptJuly/Aug Nov/Dec
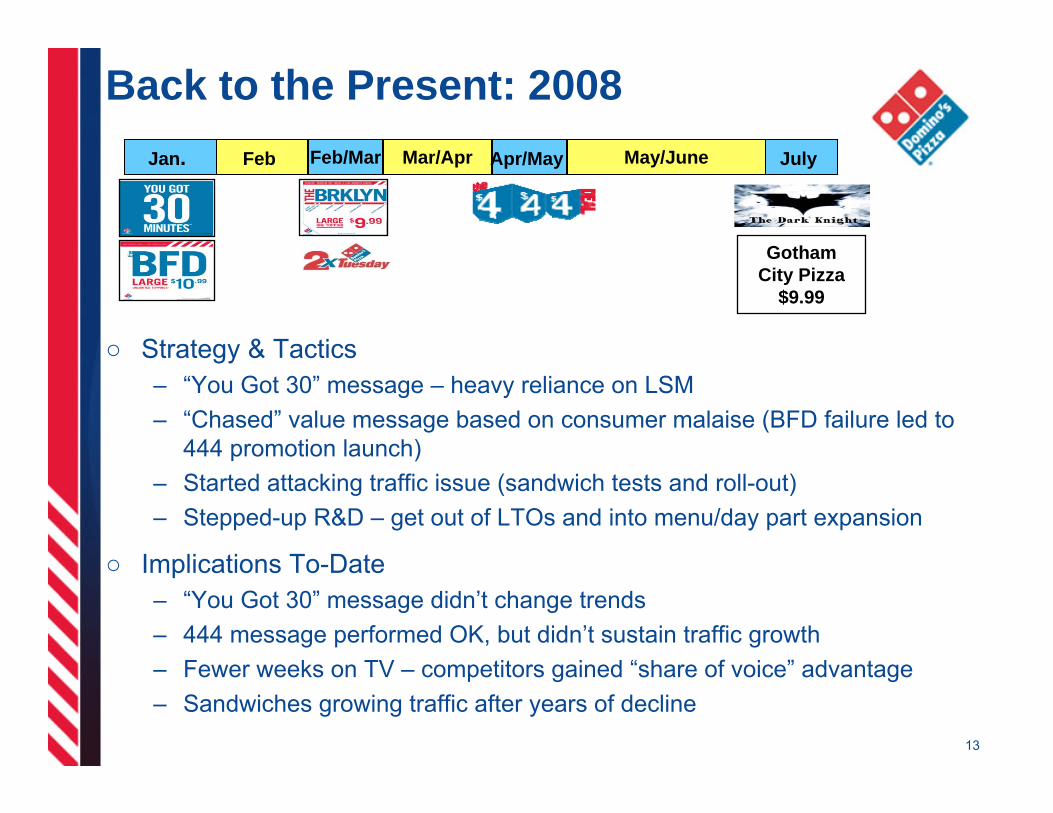
Back to the Present: 2008
13
○ Strategy & Tactics– “You Got 30” message – heavy reliance on LSM – “Chased” value message based on consumer malaise (BFD failure led to
444 promotion launch)– Started attacking traffic issue (sandwich tests and roll-out)– Stepped-up R&D – get out of LTOs and into menu/day part expansion
○ Implications To-Date– “You Got 30” message didn’t change trends– 444 message performed OK, but didn’t sustain traffic growth– Fewer weeks on TV – competitors gained “share of voice” advantage – Sandwiches growing traffic after years of decline
FebJan. Feb/Mar Mar/Apr Apr/May May/June July
Gotham City Pizza
$9.99
The Consequences: Franchisee Reactions
2005: Happiness!○ Love the roll-up○ Signed up for increased
roll-up in 2006○ National marketing doing
much of the “work”○ Costs “in check” – making
lots of money!
14
2006: What Happened?○ Must be a blip…rolling
over tough comps○ Costs are moving…but
store economics still good
○ Let’s “give Ann Arbor another chance”– Rolled-up again for 2007– Less local
spending/activity
The Consequences: Franchisee Reactions
15

2007: What the Hell Happened?○ National promotions “don’t work any more”○ Less money for Ann Arbor for 2008 (no roll-up)○ Some increase in local store marketing○ Environment getting tougher – increasing costs are
a major problem!
The Consequences: Franchisee Reactions
16

2008: When will it End?○ Agency / client learning curve○ Reduced share of voice
– Less weeks on national TV than in many years!
○ Continued traffic declines and tremendous cost inflation
○ “No matter what I do, it isn’t working” – store level economics lousy
○ Hope on the horizon – promising test products and new media strategy (no more LTOs!)
The Consequences: Franchisee Reactions
17

The Consequences: Store Growth
Total2001 2002 2003 2004 2005 (’01-’05)
DPZ U.S.
Store Count 4,813 4,848 4,904 5,008 5,092 +279Pizza Hut
Store Count 6,569 6,503 6,400 6,306 6,254 -315
Papa John’s
Store Count 2,589 2,585 2,574 2,565 2,599 +10
18
Historically Steady Growth
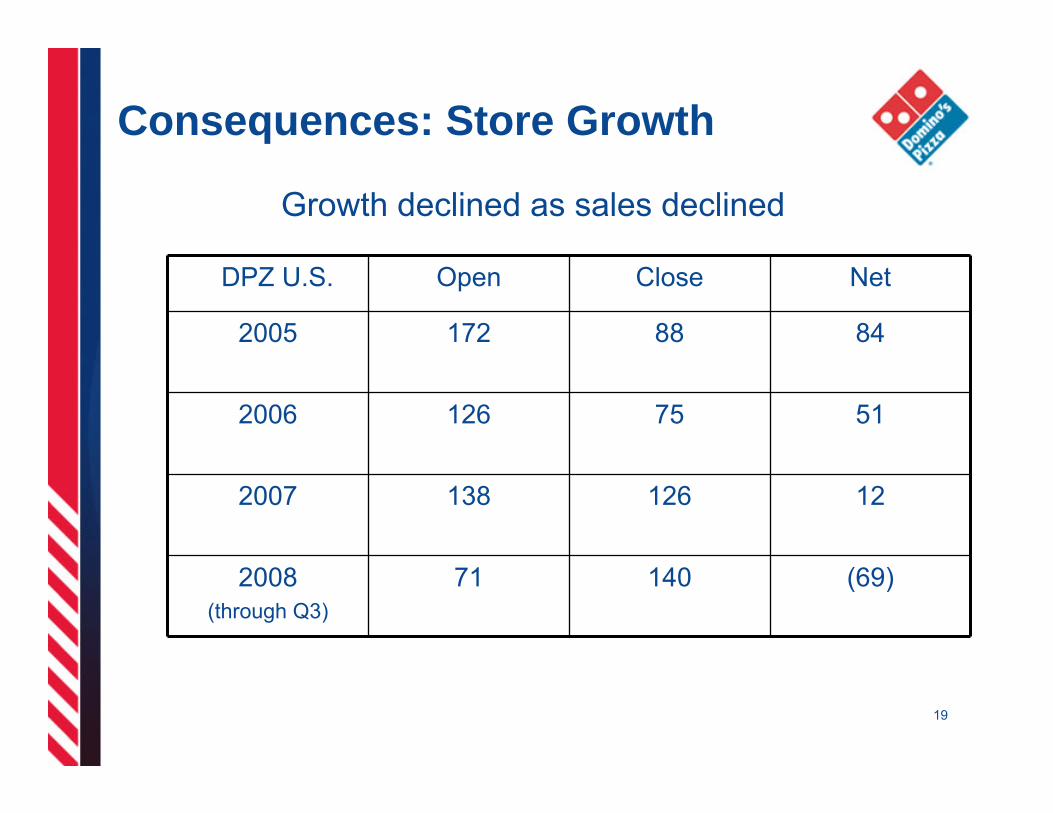
Consequences: Store Growth
DPZ U.S. Open Close Net
2005 172 88 84
2006 126 75 51
2007 138 126 12
2008(through Q3)
71 140 (69)
19
Growth declined as sales declined

Consequences: Unit Economics Squeezed
Sales Declines
Profits Squeezed
Higher Minimum
Wage
Higher Food Cost
Lower Traffic
Higher Delivery
Cost
Decreasing Advertising
20

Consequences: Unit Economics
Historically Now• Growing Sales
• Low Cost Volatility
• High ROI
• Good stores sold at lower multiples
• Bad stores sold at “fire-sale” rates
• More upside potential than ever
$150-$250K to build Bargains available

What We’ve Learned…
○ Traffic growth is key – bring excitement back to Domino’s Pizza– Sustainable, organic growth– Today’s traffic = tomorrow’s same-store sales results
○ LTOs don’t drive sustained traffic– Need product platforms, not “product-of-the-month”– Need day part expansion
○ Need timely consumer insight and strategic response– Delivery charge “management”– Better pricing model (“barbell”)– Menu strategy
22
The 2008 Turnaround Plan
Patrick DoylePresident, Domino’s USA
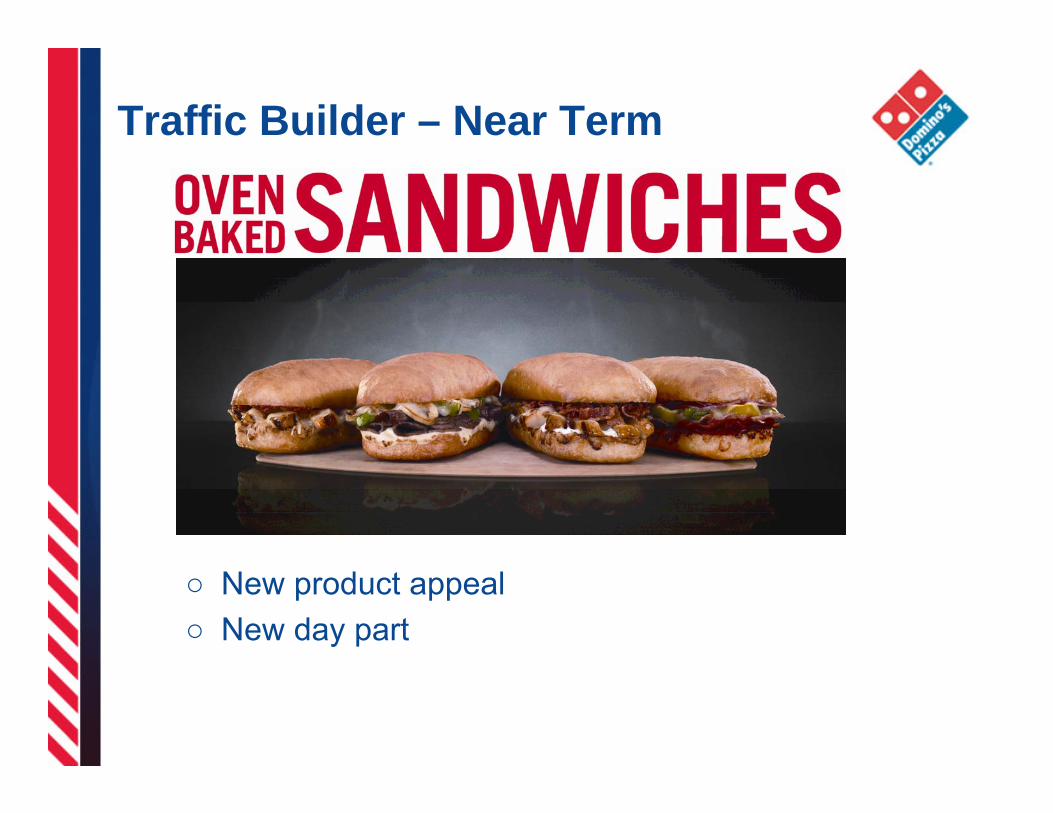
Traffic Builder – Near Term
○ New product appeal○ New day part

Sandwiches Results from Test
○ Drove strong traffic and increased sales
○ 40% of sandwich orders included a pizza○ Sandwiches increased customer frequency by 30%
– Improves the overall profitability of each customer
○ Sandwiches skewed towards carry-out (better margins)
○ Sandwich customers reported:– High product satisfaction– High repurchase intent– Better perception of Domino’s
25

Sandwiches – National Roll-Out
○ Results from the first couple of weeks show that:– Traffic is strong – the best results in over a year
– Early sales results promising
– Sandwiches are over 20% of mix
– Still skewing towards carry-out (especially at lunch)
– 40% of sandwich orders include a pizza
– Driving strong lunch sales (but we’re also selling a lot at
dinner)
– So far, national results are coming in close to test results

Menu Strategy: New Product Platforms
○ Value – Large party, small party & carry out
○ Premium – Local Legends
○ Day part / menu expansion / variety – sandwiches & pasta
○ Core pizza – improve!
○ Ticket – Desserts, sides and beverage
○ Online – Enabler for broader menu, higher ticket
27

Menu Strategy New Product Platforms
Pasta Perfecta Local Legends
Three Cheese Mac-n-Cheese
Italian Sausage Marinara
Chicken Alfredo
Chicken Carbonara
Pasta Primavera
Philly Cheese Steak
Honolulu Hawaiian
Memphis Barbecue Chicken
Cali Chicken Bacon Ranch
Pacific Coast Veggie
Buffalo Chicken Pizza

Menu Strategy New Product Platforms
Ready-To-Go Chicken
Traditional and boneless
Six sauce flavorsOnly in select stores
Three hot-hold, ready-to-go items

Improve Current Product
○ Improved core pizza product– Dough– Sauce– Cheese – Toppings
○ Respect the Food
More Advertising
○ Asking franchisees for a roll-up in national advertising
○ Looking at options for partnership funding
○ Enough advertising to support all product and promotional initiatives
32
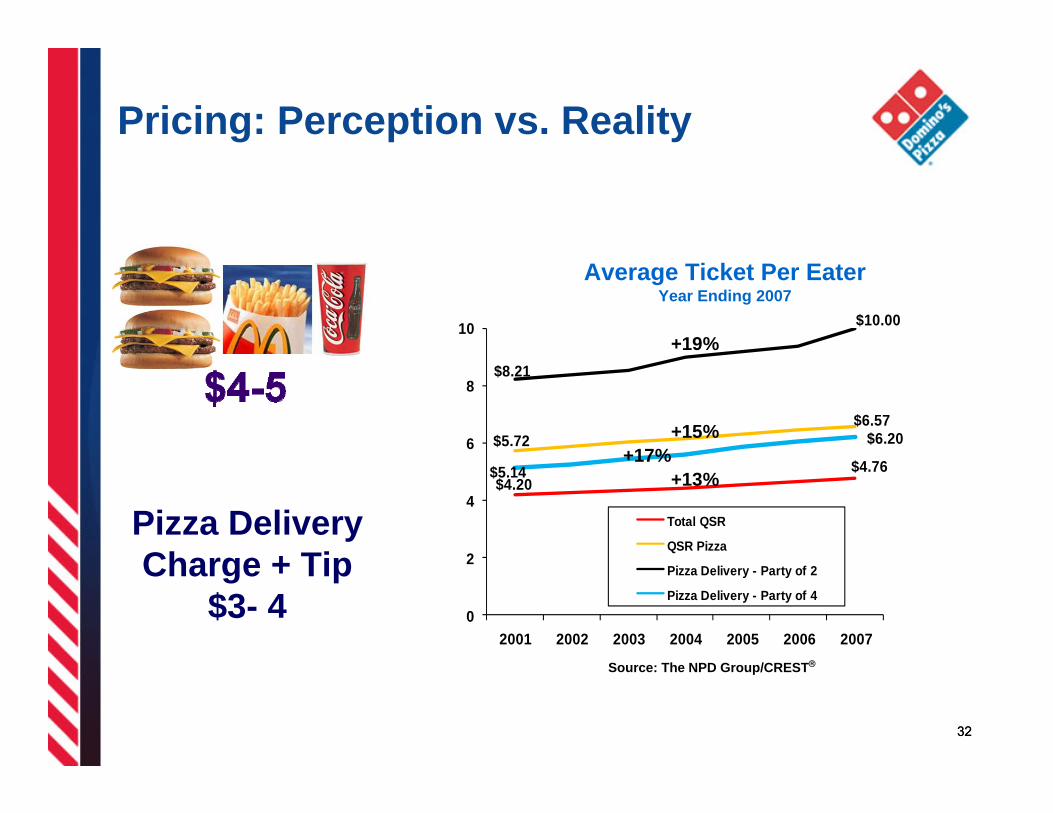
$4.20$4.76
$5.72$6.57
$8.21
$10.00
$5.14
$6.20
0
2
4
6
8
10
2001 2002 2003 2004 2005 2006 2007
Total QSR
QSR Pizza
Pizza Delivery - Party of 2
Pizza Delivery - Party of 4
Average Ticket Per EaterYear Ending 2007
Source: The NPD Group/CREST®
Pizza DeliveryCharge + Tip
$3- 4
+19%
+15%
+13%
32
+17%
Pricing: Perception vs. Reality
Pricing Lessons: “$-Eye”
○ Don’t over-price the single pie
○ Don’t increase delivery charge too much
○ Cull down coupons
○ Expand day part (lunch, late night)
○ Leverage online ordering
33

34
“A,” “B” and “F” Franchisees’ YTD Stats
“A” Franchisees “B” Franchisees “F” Franchisees
Franchisees 143 829 247
Stores 933 2895 644
Avg. Stores/Fran 6.5 3.5 2.5
2008 AWUS YTD 13,460 11,311 9,412
2008 PCYA -5.0% -5.9% -8.5%
2008 DOT % 77.3% 76.3% 75.5%

35
Store Development & Recruitment
○ On track to open 100 -120 stores (125 opened in 2007)
○ 70 new franchisees in the system YTD (vs. 93 for full year 2007)
○ 58 potential franchisees have attended Discovery Day
○ Plans are in place to save and transfer as many at-risk stores as possible
U.S. Store Growth Expectations
○ Open 100 to 120○ Close 225 to 250○ Net -100 to -150
○ Bill Kapp leading financial effort– Working to prevent closures– Even A’s and B’s struggling to finance purchases in past few weeks
○ Transition to store growth driven by sales growth
36
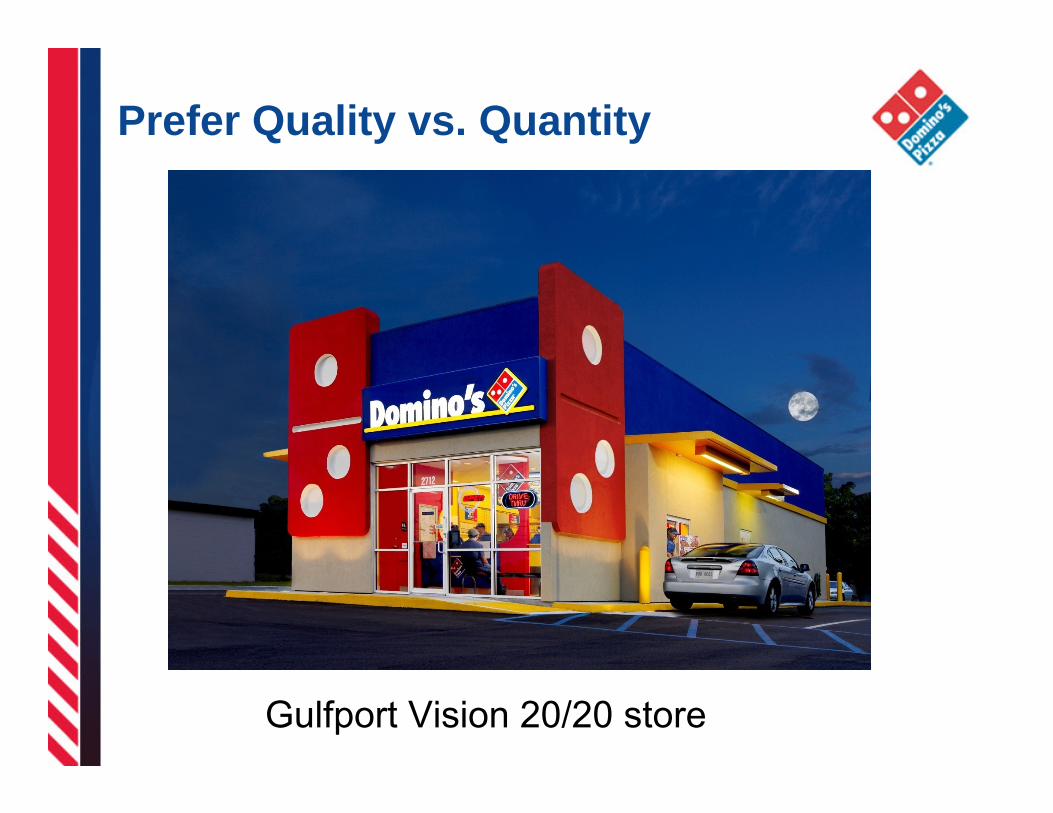
Prefer Quality vs. Quantity
Gulfport Vision 20/20 store

2009 and Beyond

39
Russell Weiner, CMO
Domino’s and Michigan: my new home!
○ “Classically-trained marketer”– Consumer brands (Pepsi, Phillip Morris)– Company and agency side
○ General management– Large projects, large teams, agency relationships
○ Collaborative philosophy– Attracts talent and drives results

Why I’m Here
○ The Domino’s team
○ The Domino’s brand
○ Upside potential!
○ Can make a difference
○ Karma ☺
40
The next 90 days…
41
Forge a Lighthouse Identity for the Domino’s brand– Grounded in consumer insights– Informed by our past and inspired by the future
Lighthouse drives brand decisions – Store design– Advertising & Communications– Innovation
Innovation Philosophy…
42
○ Long-Term Approach• 30 days and 30 years
○ Quality, Quality, Quality!• We’re delivery. We’re service. We’re 30 minutes…
AND the FOOD is great• Deliciously Fast
○ Born out of a rational business need…Developed with an emotional POV that makes it uniquely Domino’s
○ Drive incremental growth and profitability

Our Vision for the MenuThen and Now
(Handouts)
Operators of the Future
○ Closer to 5+ stores on average per franchisee
○ All “A” and “B” franchisees
○ No “F” franchisees
○ Targeted exceptions for external franchisees
44
Team USA of the Future
○ Contribute more EBITDA
○ Test platforms
○ People pipeline
45
Maintain & Grow Stores
○ Same store sales increases...leverage “the four walls”
○ Targeted real estate improvements
○ Focus on struggling stores during tough times
○ Grow as business improves
46
Future Unit Economics
○ Need to assume that costs won’t dramatically change– Minimum wage increases staying– Commodities might flatten, might not– Delivery costs probably won’t improve– If costs decrease, we have upside
○ The way we will strengthen unit economics is to grow the top line– “Grow your way to greatness”
47

Commodities and CostsDavid Mounts, EVP Supply Chain

Q3 2008 Update
○ Commodities tough, but… a better outlook
– Domino’s commodity index
– Domino’s food basket
○ Holy cow… what’s up with cheese?
○ What we’re doing about it
49
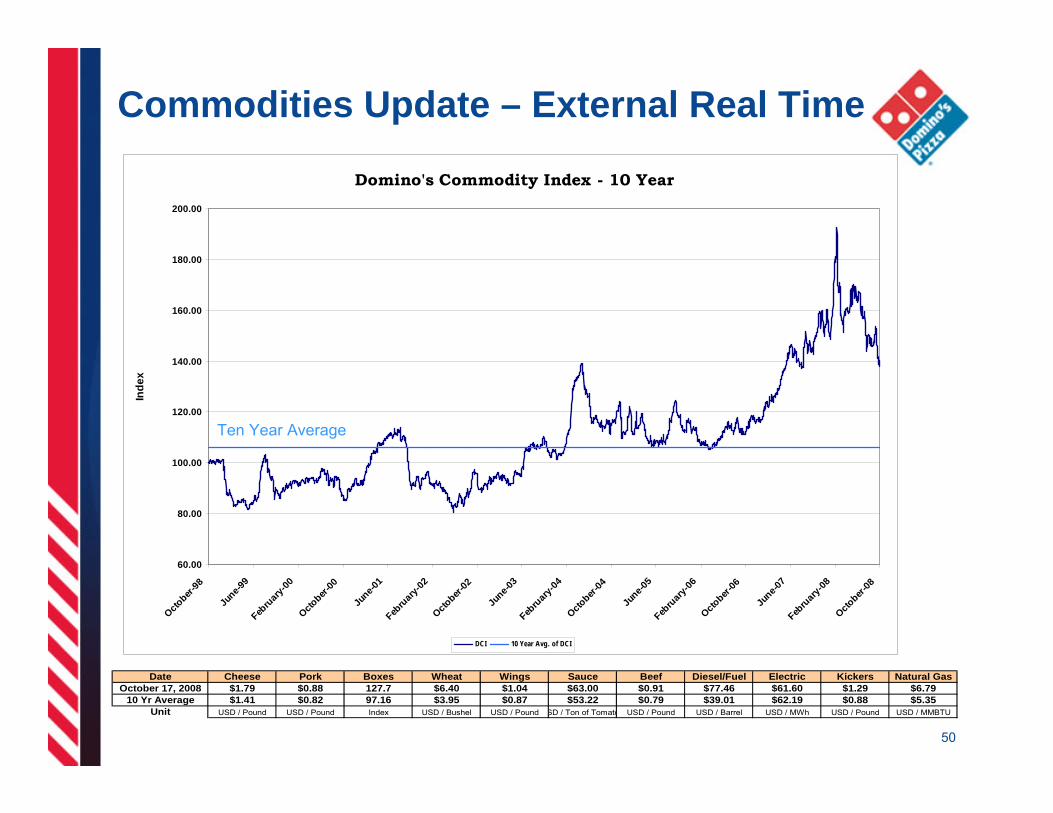
Commodities Update – External Real Time
50
Date Cheese Pork Boxes Wheat Wings Sauce Beef Diesel/Fuel Electric Kickers Natural GasOctober 17, 2008 $1.79 $0.88 127.7 $6.40 $1.04 $63.00 $0.91 $77.46 $61.60 $1.29 $6.79
10 Yr Average $1.41 $0.82 97.16 $3.95 $0.87 $53.22 $0.79 $39.01 $62.19 $0.88 $5.35Unit USD / Pound USD / Pound Index USD / Bushel USD / Pound SD / Ton of Tomato USD / Pound USD / Barrel USD / MWh USD / Pound USD / MMBTU
Domino's Commodity Index - 10 Year
60.00
80.00
100.00
120.00
140.00
160.00
180.00
200.00
October-
98
June-9
9Feb
ruary
-00Octo
ber-00
June-0
1Feb
ruary
-02Octo
ber-02
June-0
3Feb
ruary
-04Octo
ber-04
June-0
5Feb
ruary
-06Octo
ber-06
June-0
7Feb
ruary
-08Octo
ber-08
Inde
x
DCI 10 Year Avg. of DCI
Ten Year Average

Commodities – Last Two Years, Ugh. Why???
Domino's Commodity Index - 2 Year
60.00
80.00
100.00
120.00
140.00
160.00
180.00
200.00
October-
06
December-
06
Febru
ary-07
April-07
June-0
7
August-07
October-
07
December-
07
Febru
ary-08
April-08
June-0
8
August-08
October-
08In
dex
DCI 2 Year Avg. of DCI
51

Crude (blue) vs. Corn Futures
Commodities - Energy and FoodFor 8 of 10 Years Not Correlated
52
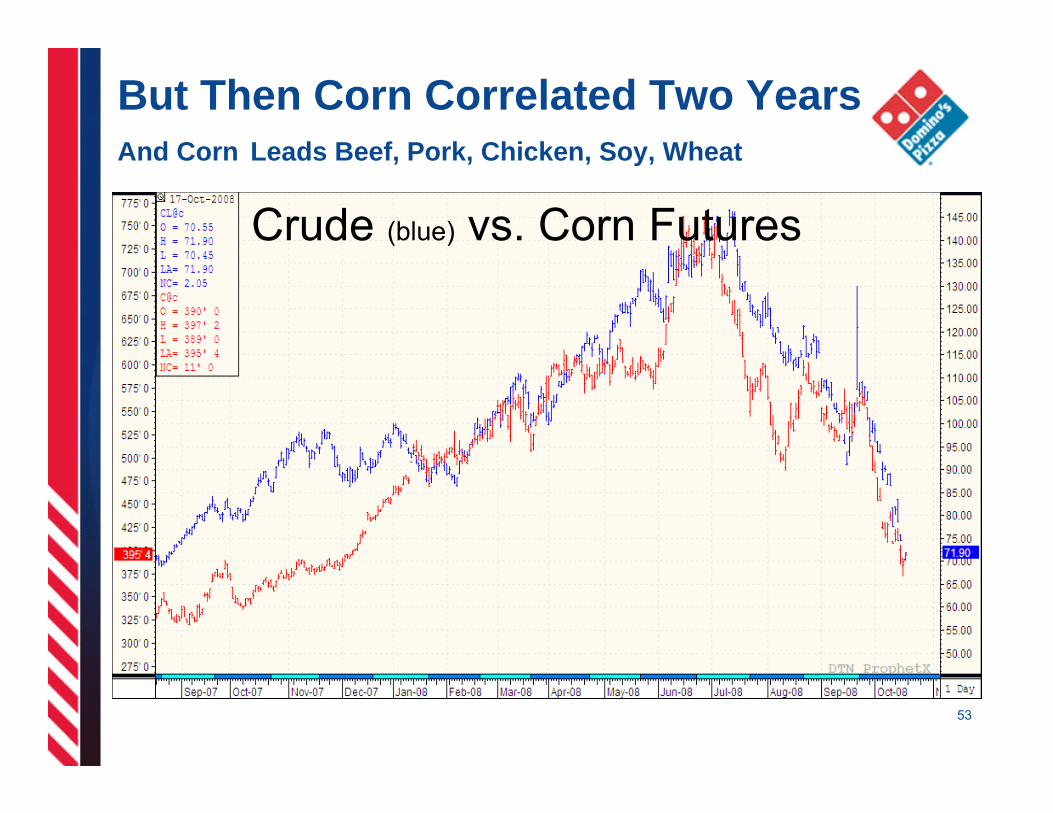
But Then Corn Correlated Two YearsAnd Corn Leads Beef, Pork, Chicken, Soy, Wheat
Crude (blue) vs. Corn Futures
53

Q3 Culprits – Fuel on EverythingCheese Stayed High and…
Kickers
$0.00
$0.20
$0.40
$0.60
$0.80
$1.00
$1.20
$1.40
$1.60
October-
98Feb
ruary
-99Ju
ne-99
October-
99Feb
ruary
-00Ju
ne-00
October-
00Feb
ruary
-01Ju
ne-01
October-
01Feb
ruary
-02Ju
ne-02
October-
02Feb
ruary
-03Ju
ne-03
October-
03Feb
ruary
-04Ju
ne-04
October-
04Feb
ruary
-05Ju
ne-05
October-
05Feb
ruary
-06Ju
ne-06
October-
06Feb
ruary
-07Ju
ne-07
October-
07Feb
ruary
-08Ju
ne-08
October-
08
Dolla
rs p
er p
ound
Chicken
Beef
$0.00
$0.20
$0.40
$0.60
$0.80
$1.00
$1.20
October-
98Feb
ruary
-99Ju
ne-99
October-
99Feb
ruary
-00Ju
ne-00
October-
00Feb
ruary
-01Ju
ne-01
October-
01Feb
ruary
-02Ju
ne-02
October-
02Feb
ruary
-03Ju
ne-03
October-
03Feb
ruary
-04Ju
ne-04
October-
04Feb
ruary
-05Ju
ne-05
October-
05Feb
ruary
-06Ju
ne-06
October-
06Feb
ruary
-07Ju
ne-07
October-
07Feb
ruary
-08Ju
ne-08
October-
08
Dolla
rs p
er p
ound
BeefSauce*
$0.00
$10.00
$20.00
$30.00
$40.00
$50.00
$60.00
$70.00
October-
98Feb
ruary-99
June-9
9Octo
ber-99
February
-00Ju
ne-00
October-
00Feb
ruary-01
June-0
1Octo
ber-01
February
-02Ju
ne-02
October-
02Feb
ruary-03
June-0
3Octo
ber-03
February
-04Ju
ne-04
October-
04Feb
ruary-05
June-0
5Octo
ber-05
February
-06Ju
ne-06
October-
06Feb
ruary-07
June-0
7Octo
ber-07
February
-08Ju
ne-08
October-
08
Dol
lars
per
Ton
of T
omat
os
Paperboard
0
20
40
60
80
100
120
140
October-
98Feb
ruary
-99Ju
ne-99
October-
99Feb
ruary
-00Ju
ne-00
October-
00Feb
ruary
-01Ju
ne-01
October-
01Feb
ruary
-02Ju
ne-02
October-
02Feb
ruary
-03Ju
ne-03
October-
03Feb
ruary
-04Ju
ne-04
October-
04Feb
ruary
-05Ju
ne-05
October-
05Feb
ruary
-06Ju
ne-06
October-
06Feb
ruary
-07Ju
ne-07
October-
07Feb
ruary
-08Ju
ne-08
October-
08
Inde
x
Sauce
Boxes
54
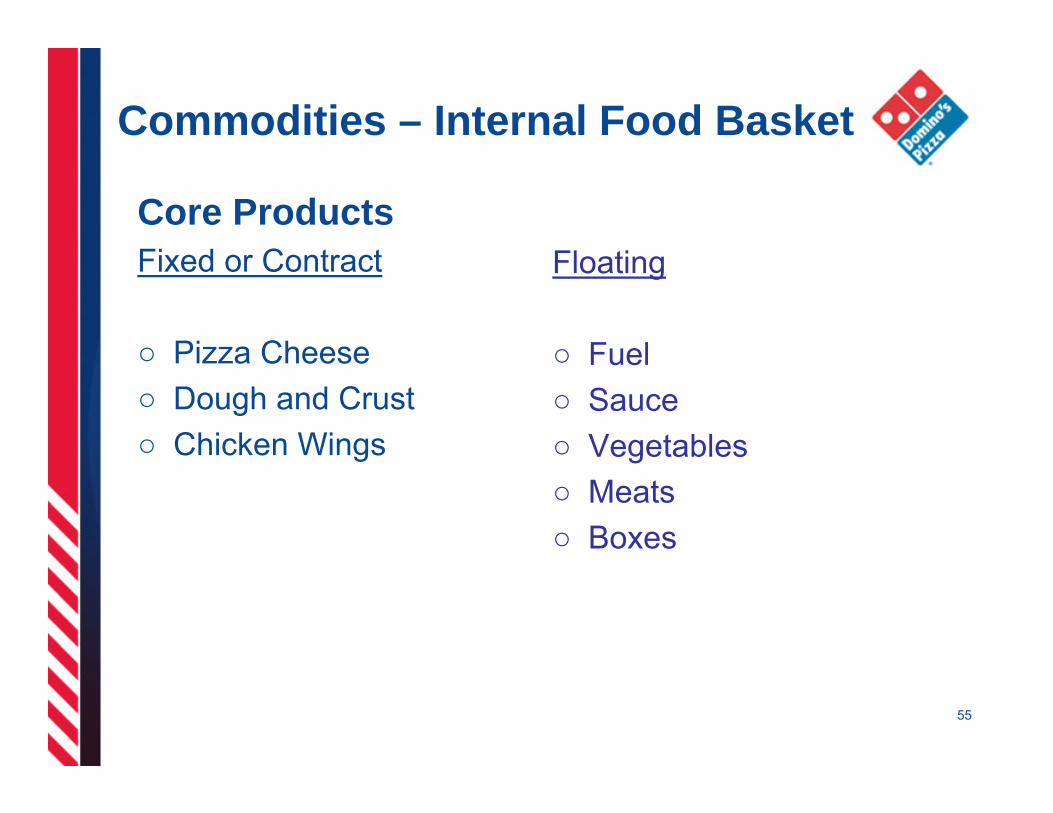
Commodities – Internal Food Basket
Core ProductsFixed or Contract
○ Pizza Cheese ○ Dough and Crust○ Chicken Wings
Floating
○ Fuel○ Sauce○ Vegetables○ Meats○ Boxes
55
○ An indication of food cost to store
○ Hypothetical store - $10K/week AWUS
○ Heavily influenced by price of cheese
○ Cheese and dough are approximately 50% of the price
of the basket
○ Competitive comparison quarterly
Commodities – Internal Food Basket
56
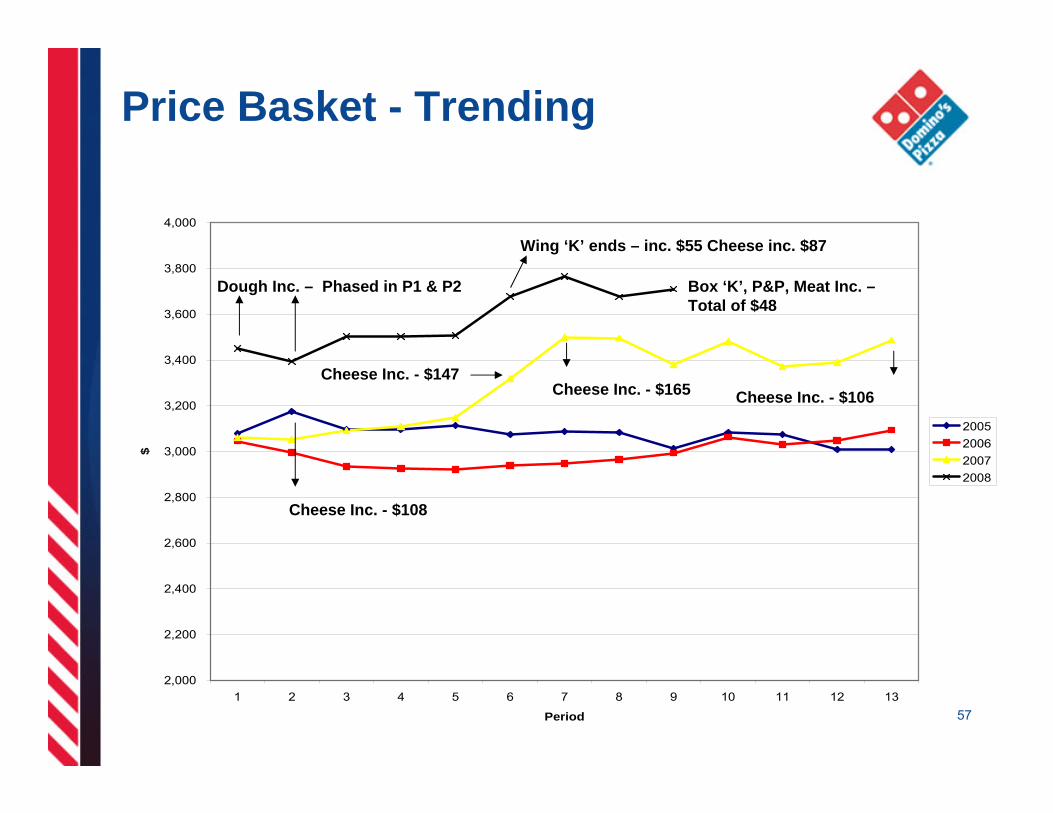
Price Basket - Trending
2,000
2,200
2,400
2,600
2,800
3,000
3,200
3,400
3,600
3,800
4,000
1 2 3 4 5 6 7 8 9 10 11 12 13
Period
$
2005200620072008
Cheese Inc. - $147Cheese Inc. - $165
Dough Inc. – Phased in P1 & P2
Wing ‘K’ ends – inc. $55 Cheese inc. $87
Cheese Inc. - $108
Box ‘K’, P&P, Meat Inc. –Total of $48
Cheese Inc. - $106
57

Increases of DCI and Food Basket
2006 2007 YTD 2008
DCI (1.74)(1.53%)
24.8221.85%
47.0141.39%
Food Basket ($83.85)(2.73%)
$230.107.48%
$499.2516.23%
Increase over 2005
58
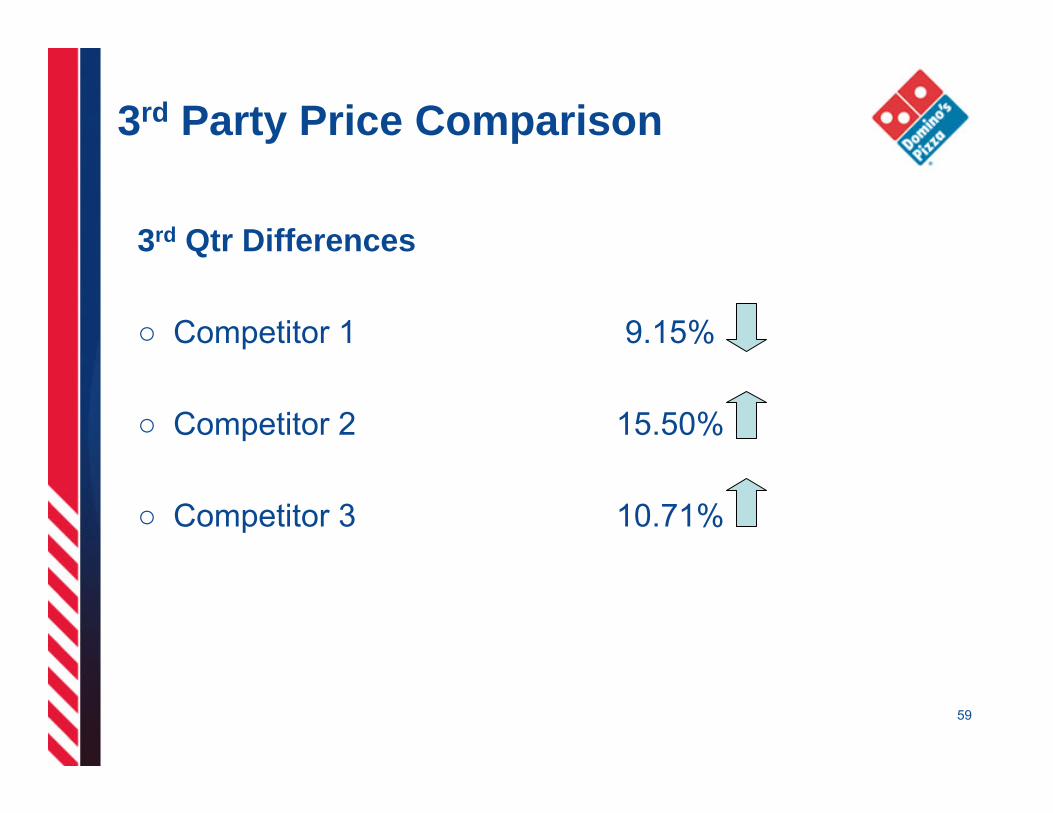
3rd Party Price Comparison
3rd Qtr Differences
○ Competitor 1 9.15%
○ Competitor 2 15.50%
○ Competitor 3 10.71%
59

Holy Cow…What’s Up With Cheese?
○ Not moving with oil
○ Supply / demand tight in dairy, particularly cheese
○ International prices above U.S. – strong foreign demand
○ Butter has not carried its weight until recently
○ High farm input prices for feed
– Causing liquidations and productivity reductions
60

Holy Cow…What’s Up With Cheese?
Summer○ High gas and other high prices decreased domestic
demand○ Milk flowed into cheese and powder increasing supply○ International buying then picked up
Fall○ Seasonal school milk tightened domestic demand○ Cheese buyers replenished inventories, increasing
demand
61
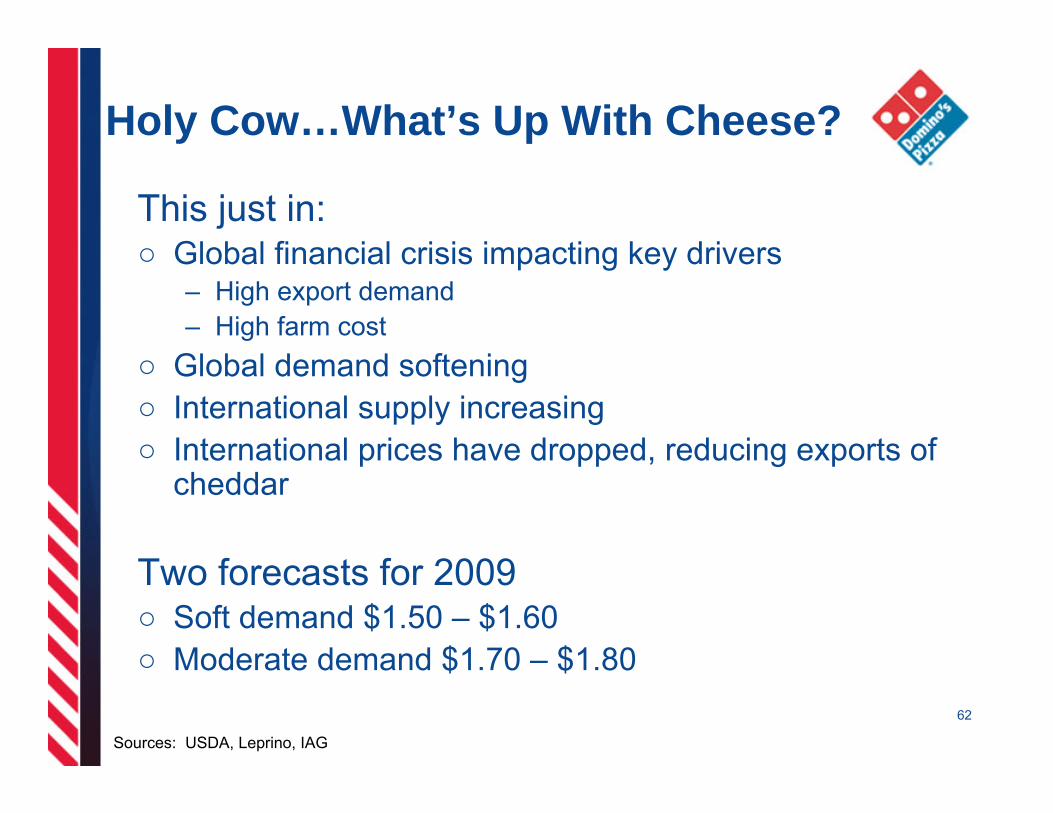
Holy Cow…What’s Up With Cheese?
This just in:○ Global financial crisis impacting key drivers
– High export demand– High farm cost
○ Global demand softening○ International supply increasing○ International prices have dropped, reducing exports of
cheddar
Two forecasts for 2009 ○ Soft demand $1.50 – $1.60○ Moderate demand $1.70 – $1.80
Sources: USDA, Leprino, IAG
62

What are We Doing About all This?
63
○ New contract strategies:– Better supply contracts
– Locked in prices via forwards
– End-to-end price and logistics savings
○ New operating efficiencies:– Drove fewer miles
– Used less fuel
– More efficient warehouses

Panel Q&A

What’s Next? Lunch!Brandon Solano, VP Brand Innovation
○ Vision 20/20 store
○ New product operations
○ Sampling test products at our “chef’s table” in the test kitchen– Taste products that have been or are in test– Not guaranteed to roll out nationally
○ Brand strategy at work!
65
Web-cast Break for Lunch
Back Around 1:15 p.m. EST

Financial Overview
Wendy Beck, CFO

Agenda
Asset Backed Securitization (ABS)ABS 101
Revolver
Liquidity
Free Cash Flow
Operational considerationsLabor & Product Mix
Foreign currency impacts
Long Range Outlook
6868
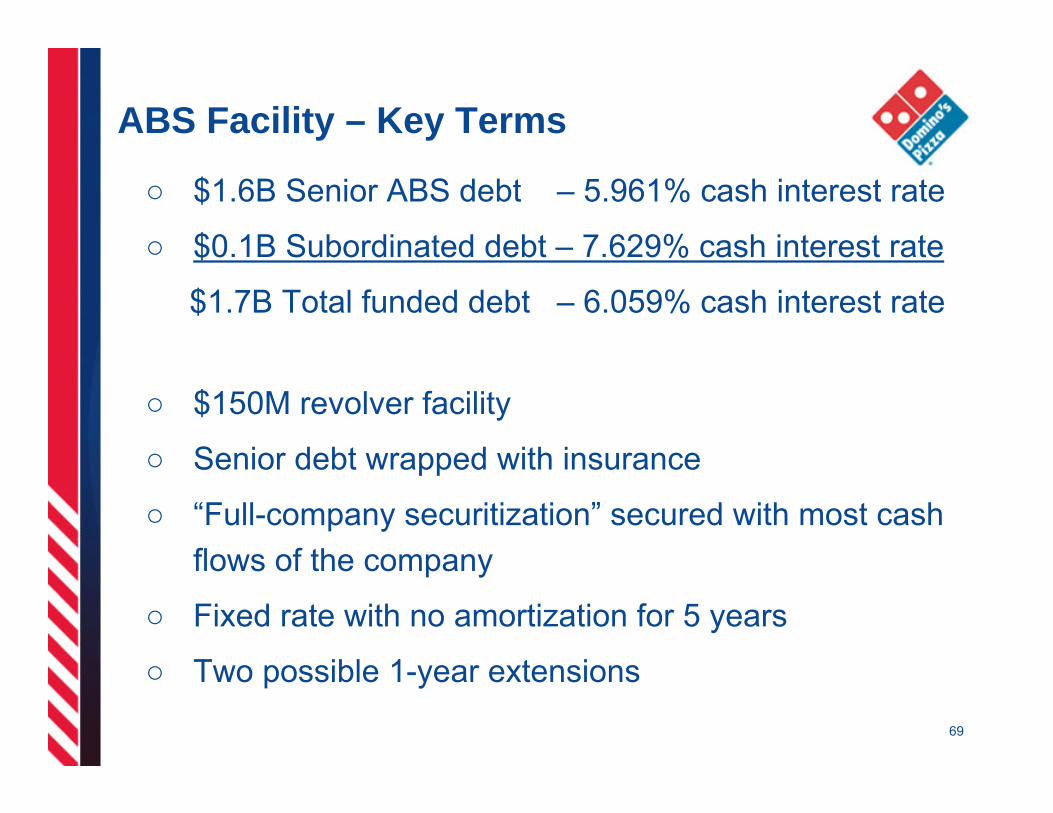
ABS Facility – Key Terms
○ $1.6B Senior ABS debt – 5.961% cash interest rate
○ $0.1B Subordinated debt – 7.629% cash interest rate
$1.7B Total funded debt – 6.059% cash interest rate
○ $150M revolver facility
○ Senior debt wrapped with insurance
○ “Full-company securitization” secured with most cash flows of the company
○ Fixed rate with no amortization for 5 years
○ Two possible 1-year extensions
69

ABS Time Line
7070
April 16, 2007 - $1.7 billion ABS Debt Facility funded• 6.06% fixed cash interest rate• Also includes $150 million unfunded revolver
April 16, 2014 – Maturity if both 1-year extensions exercised
If not refinanced after 5 or 7 years:• 30-Year Legal Maturity • 100% of cash flow beyond servicing fee amortizes
April 16, 2012 – 5-year expected maturity,• Extensions likely to be more attractive than refinancing
. . .
5 Yrs
7 Yrs
1 Yr
30 Yrs
October 28, 2008 – Investor Day, 1 year and 6 months after ABS
70
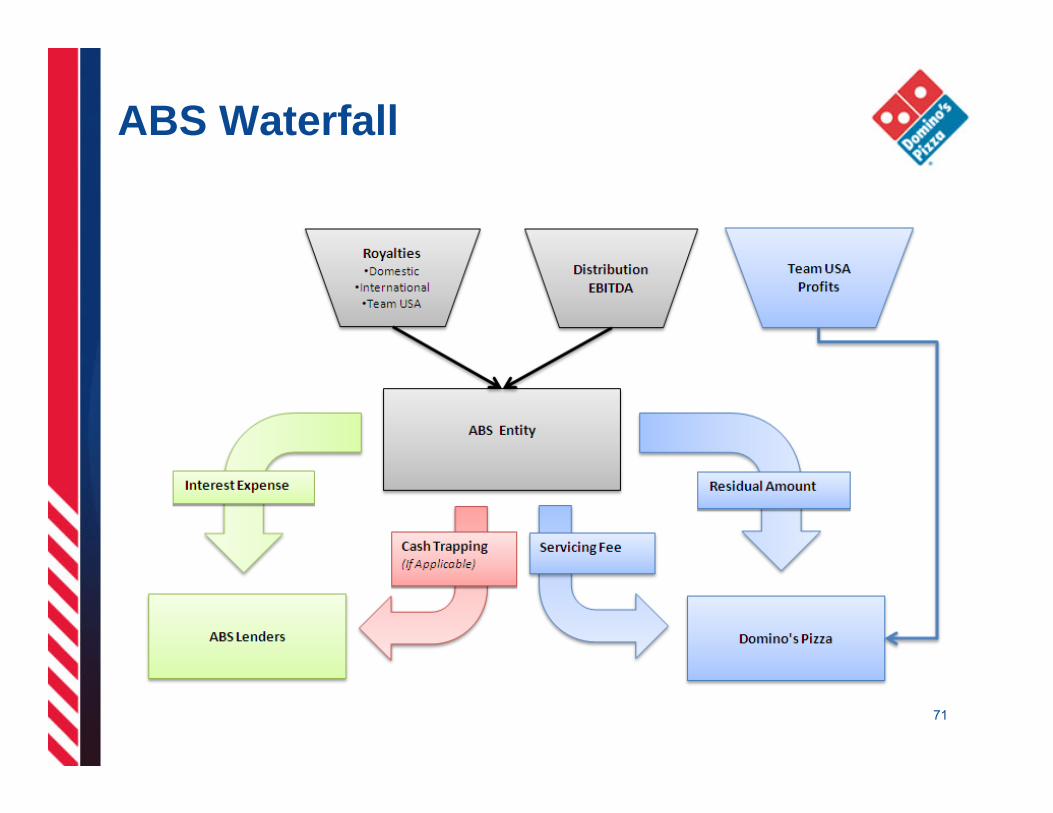
ABS Waterfall
71

Debt Service Coverage Ratio (DSCR)
– Defined as Collections / Senior Interest Expense
– Collections cannot be calculated using publicly-disclosed information, but it tracks closest to EBITDA
– EBITDA performance would need to drop by $65 - $75M annually before first trigger is reached
– Triggers: Est EBITDA % of water-
Trigger drop fall trapped (*)First $65-$75M 25%Second $75-$85M 50%Third $95-$105M 100%
– (*) Waterfall is after interest and minimal G&A service fee7272

ABS DSCR Extreme Stress Test
73
○ 2009 Assumptions:– Domestic Net Store Growth (500)
– Domestic Same Store Sales Growth (10%)
○ Results:– Our DSCR still exceeds the first trigger

Current Credit Markets - Insurers
○ Bond insurers have experienced credit issues – MBIA and Ambac wrapped our ABS debt facility
○ Insurer Impact on Domino’s– Insurers’ troubles do not impact our current debt
facility or debt costs
– Availability of future ABS-type debt facility diminished in current economic climate
7474

Current Credit Markets – Revolver Lenders
7575
○ In Q4, one of Domino’s lenders declared bankruptcy
– Lender’s troubles do not impact our current senior or subordinated debt or debt costs
– Our revolver is likely impacted, though
– However, we do NOT need the revolver for operating needs
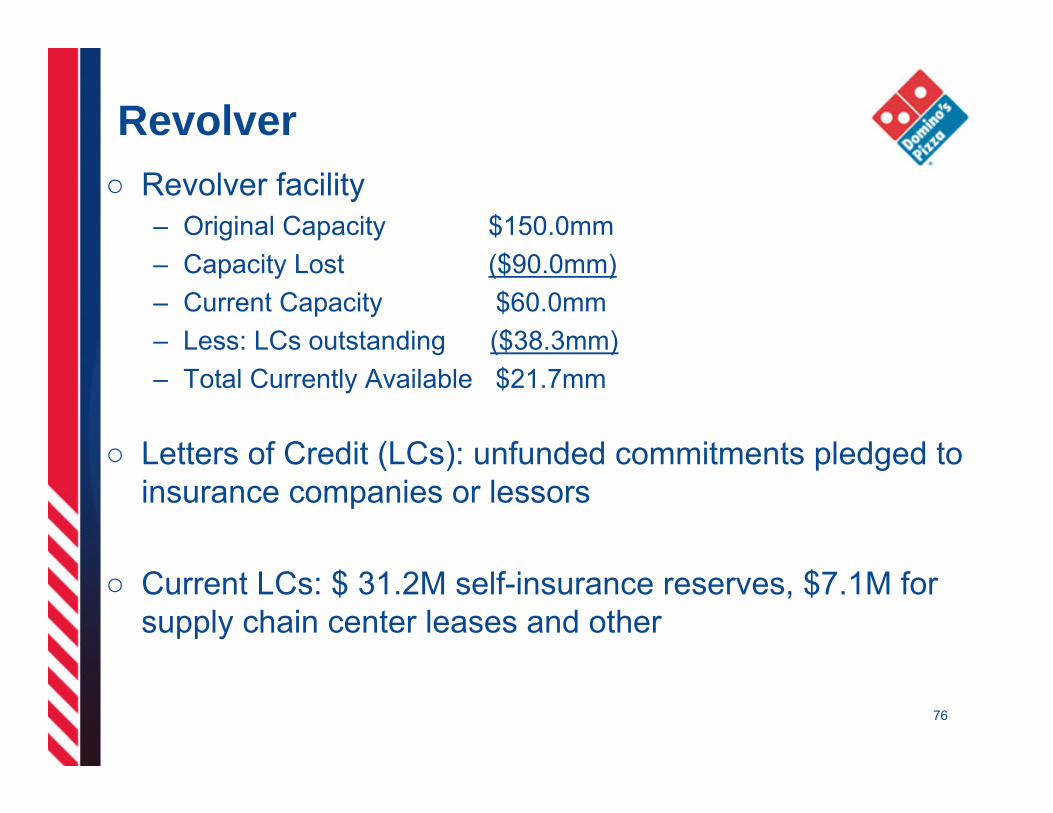
Revolver○ Revolver facility
– Original Capacity $150.0mm– Capacity Lost ($90.0mm)– Current Capacity $60.0mm– Less: LCs outstanding ($38.3mm)– Total Currently Available $21.7mm
○ Letters of Credit (LCs): unfunded commitments pledged to insurance companies or lessors
○ Current LCs: $ 31.2M self-insurance reserves, $7.1M for supply chain center leases and other
76
Liquidity○ Main source is, and has always been, our free cash flow
○ We generate FCF of over $1M per week, on average (please see chart on next page)
○ We have unrestricted cash of $20.1M at the end of Q3
○ The current revolver, as well as previous revolver facilities, have not been used for working capital needs, but instead for dividend payments and opportunistic share repurchases
○ We are exploring alternative sources of liquidity for maximum flexibility but, again, we do not need the revolver for operating needs
77
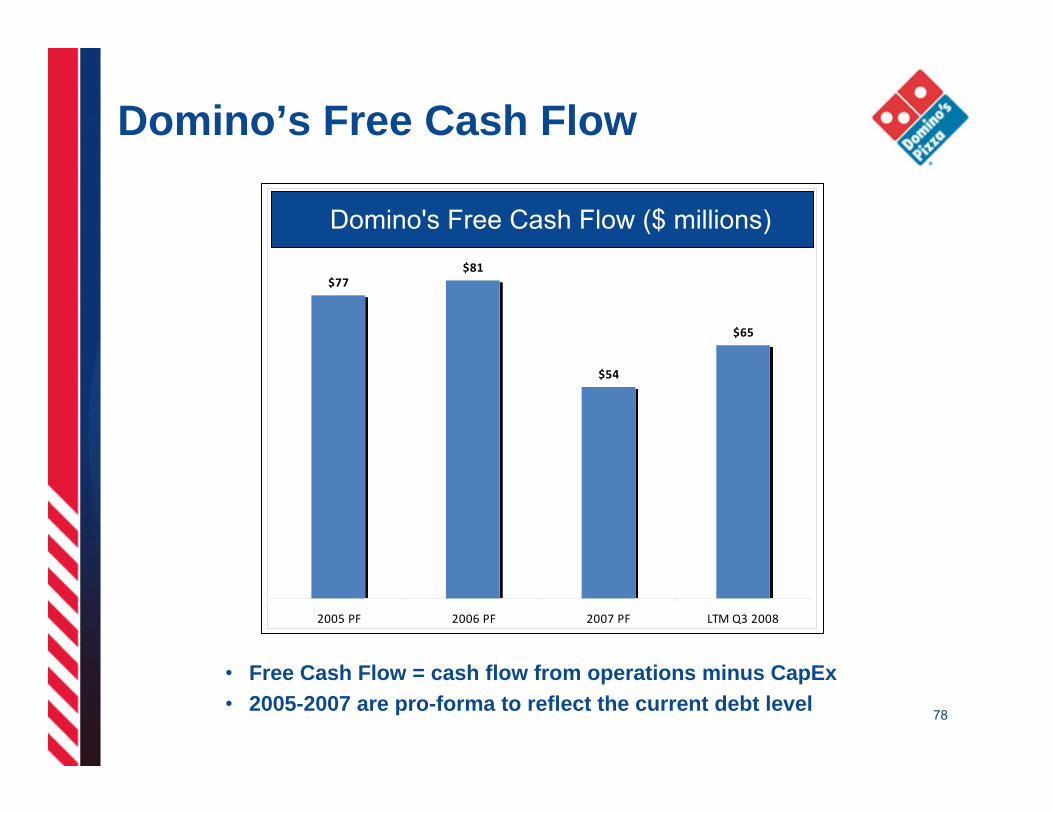
Domino’s Free Cash Flow
Domino's Free Cash Flow ($million)
$77$81
$54
$65
2005 PF 2006 PF 2007 PF LTM Q3 2008
• Free Cash Flow = cash flow from operations minus CapEx• 2005-2007 are pro-forma to reflect the current debt level
Domino's Free Cash Flow ($ millions)
78
Uses of Free Cash Flow
79
○ Return of Capital○ Share Repurchases○ Dividend Payments○ Debt Repayments
○ Reinvest in the Business

Debt & Liquidity Summary
○ Comfortable with our capital structure and terms of our ABS debt facility
○ Debt facility with:– 6.06% fixed interest rates
– A 5-year term with two 1-year extensions
○ Business model with low cash needs that generates strong operating cash flow
8080
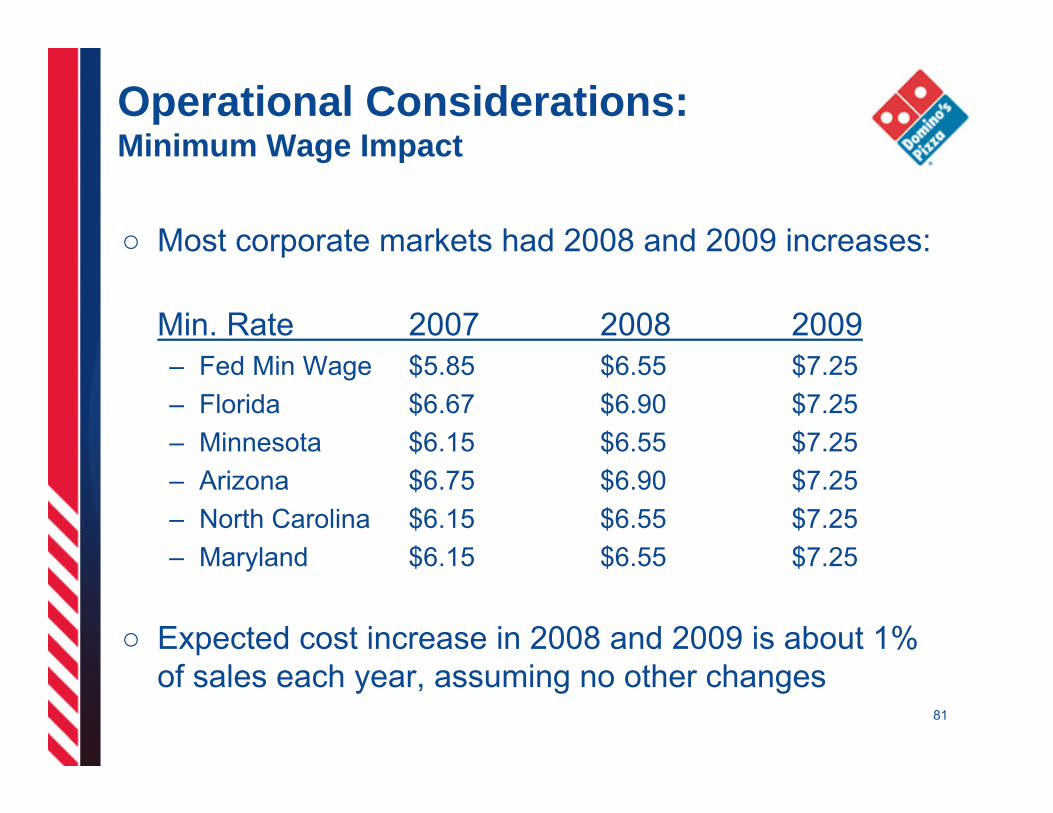
Operational Considerations:Minimum Wage Impact
○ Most corporate markets had 2008 and 2009 increases:
Min. Rate 2007 2008 2009– Fed Min Wage $5.85 $6.55 $7.25– Florida $6.67 $6.90 $7.25– Minnesota $6.15 $6.55 $7.25– Arizona $6.75 $6.90 $7.25– North Carolina $6.15 $6.55 $7.25– Maryland $6.15 $6.55 $7.25
○ Expected cost increase in 2008 and 2009 is about 1% of sales each year, assuming no other changes
81
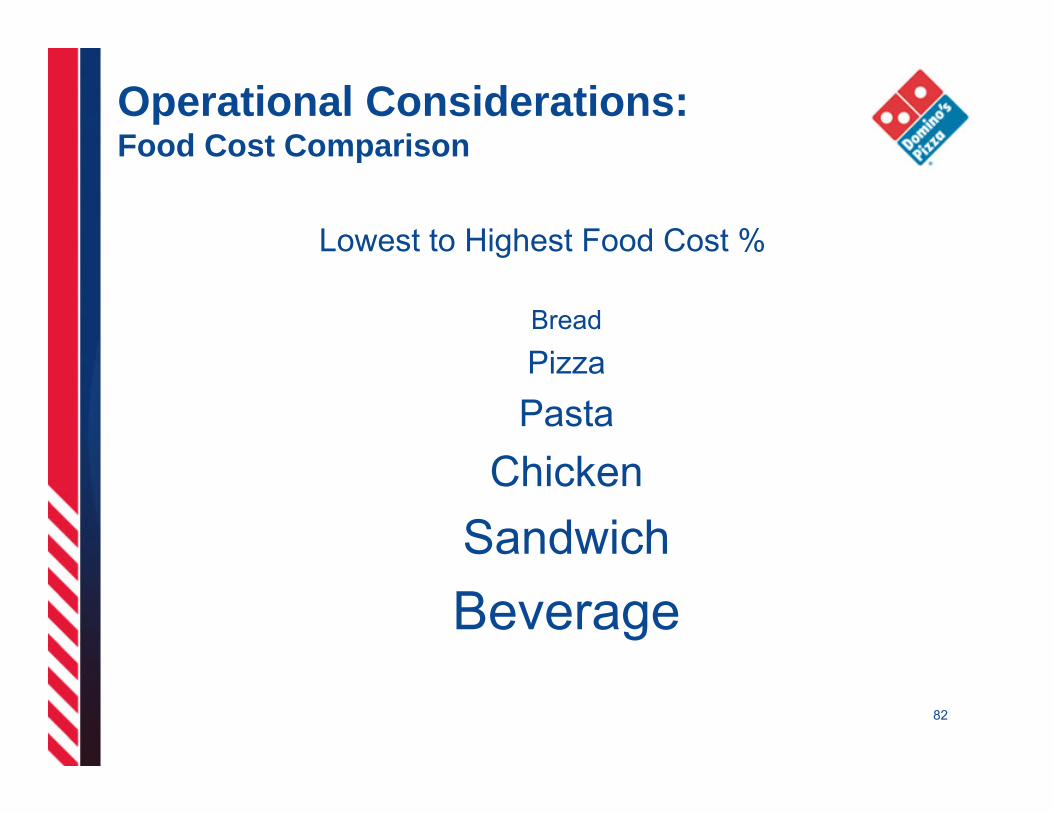
Operational Considerations:Food Cost Comparison
Lowest to Highest Food Cost %
Bread
PizzaPasta
ChickenSandwichBeverage
82

Foreign Currency Impact
○ International royalties are earned in local currencies
○ When the U.S. dollar strengthens, we receive fewer U.S. dollars for the same amount of local currency
○ Currency has helped us to a limited extent the last several years, as the U.S. dollar has weakened
○ This impact has turned negative for the 4th quarter, as the U.S. dollar has strengthened
83
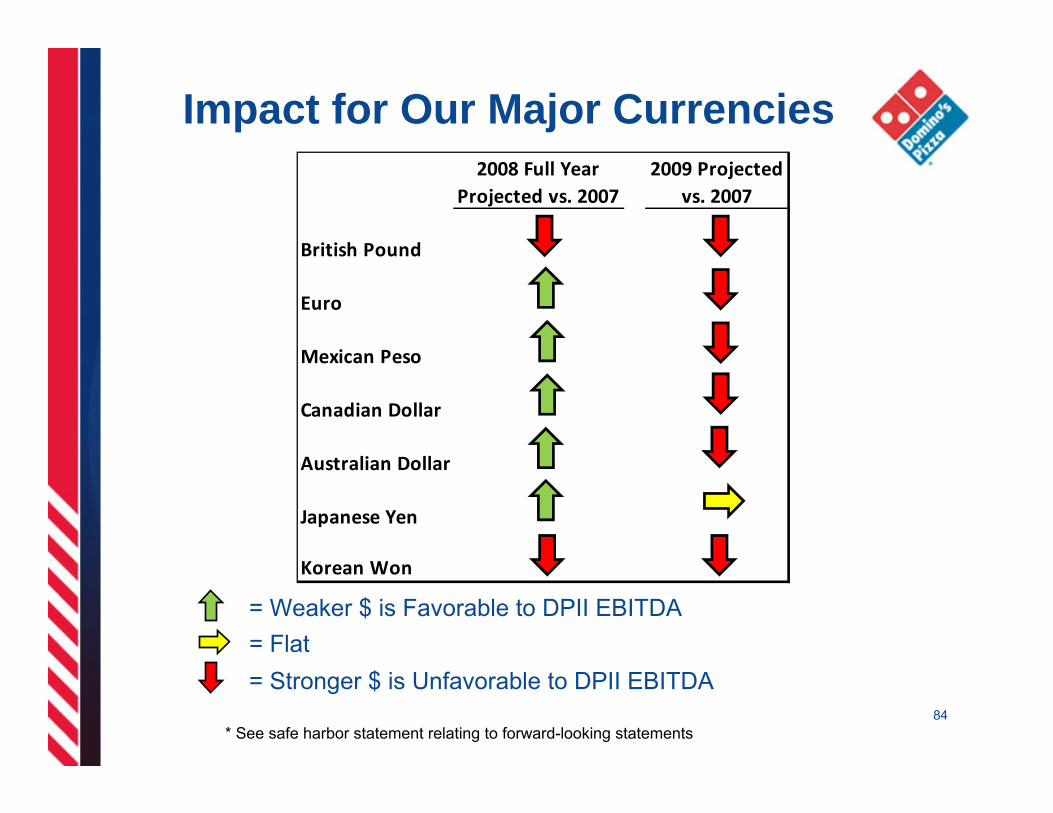
Impact for Our Major Currencies
= Weaker $ is Favorable to DPII EBITDA
84
2008 Full Year Projected vs. 2007
2009 Projected vs. 2007
British Pound
Euro
Mexican Peso
Canadian Dollar
Australian Dollar
Japanese Yen
Korean Won
= Flat= Stronger $ is Unfavorable to DPII EBITDA
* See safe harbor statement relating to forward-looking statements
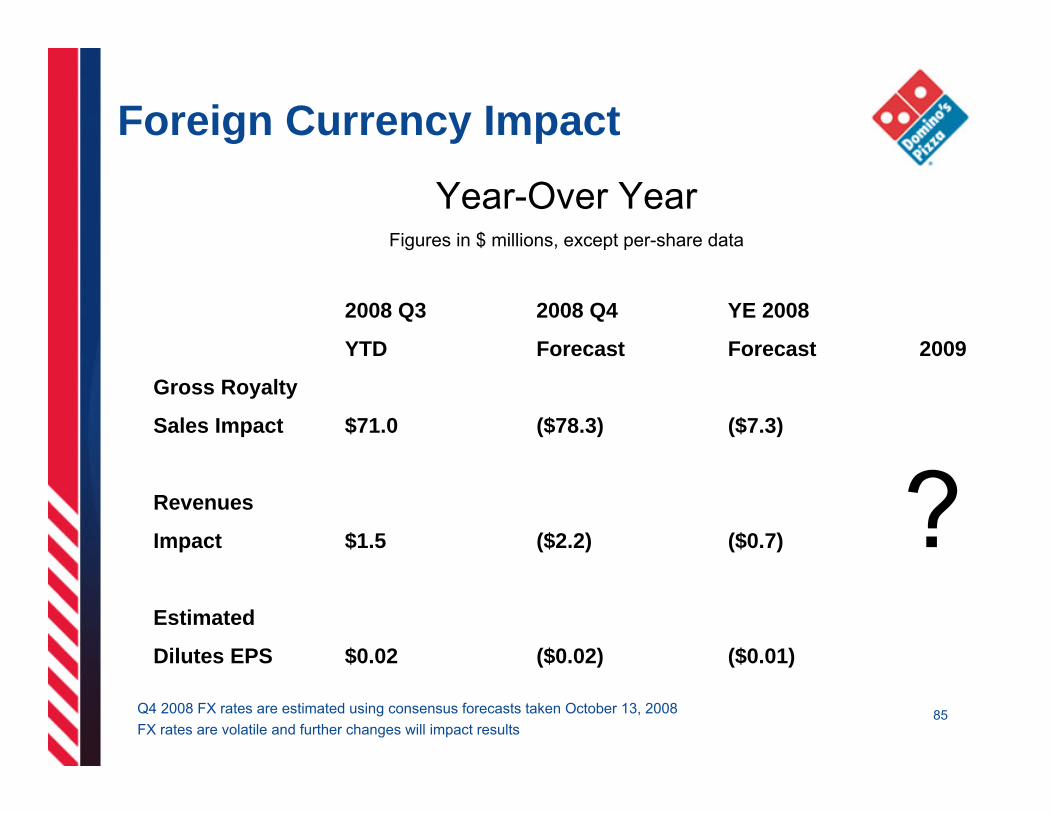
Foreign Currency Impact
85Q4 2008 FX rates are estimated using consensus forecasts taken October 13, 2008FX rates are volatile and further changes will impact results
Year-Over YearFigures in $ millions, except per-share data
2008 Q3 2008 Q4 YE 2008
YTD Forecast Forecast 2009
Gross Royalty
Sales Impact $71.0 ($78.3) ($7.3)
Revenues
Impact $1.5 ($2.2) ($0.7)
Estimated
Dilutes EPS $0.02 ($0.02) ($0.01)
?

86
Long Range Outlook & Possibilities
• Long Range Outlook and Possibilities do not constitute specific earnings guidance. Domino’s does not provide quarterly or annual earnings estimates. See safe harbor statement relating to forward looking statements.
Long Range Bull Middle BearOutlook Case Case Case
Top Line Growth - Domestic Same Store Sales +1% to +3% 5% 2% -2%- International Same Store Sales +3% to +5% 6% 4% 2%- Net Units 200 to 250 300 150 -50 Domestic 0 -100 -250 International 300 250 200- Global Retail Sales +4% to 6% 7% 4% 0%
2009 Possibilities

Q&A

Domino’s PizzaMichael Lawton
EVP Domino’s Pizza International
89
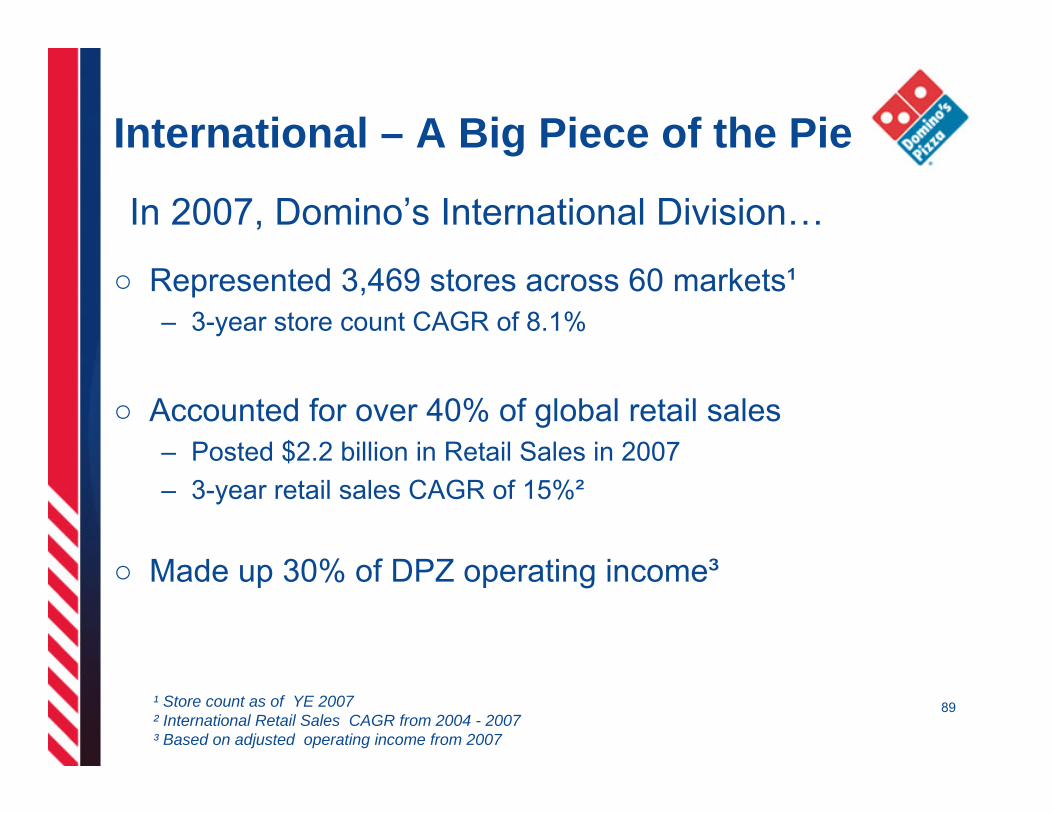
International – A Big Piece of the Pie
○ Represented 3,469 stores across 60 markets¹– 3-year store count CAGR of 8.1%
○ Accounted for over 40% of global retail sales – Posted $2.2 billion in Retail Sales in 2007– 3-year retail sales CAGR of 15%²
○ Made up 30% of DPZ operating income³
In 2007, Domino’s International Division…
¹ Store count as of YE 2007² International Retail Sales CAGR from 2004 - 2007³ Based on adjusted operating income from 2007
90
Q3 2008 marks the 59th consecutive quarter of positive same store sales

91
International Leadership with Significant Upside
¹ Based on 2007 YE total store count
² Potential store count based on Domino’s Pizza International estimates
Top 10 MarketsYE 2007 Stores
Delivery Market Position Potential Store Count
Mexico 566 #1 700
United Kingdom 467 #1 900Australia 405 #1 550
South Korea 289 #3 350
Canada 277 #3 400
Japan 180 #3 700
India 176 #1 400
Taiwan 122 #2 150
France 121 #1 700
Turkey 84 #1 300
TOTAL 2,687 5,150

92
Market Highlights
○ Smaller markets: Greece and Israel– Greece reached critical mass and began TV ads for the first time– Israel is growing phenomenally lately and Domino’s is the #1 pizza
brand in the country
○ Medium-sized markets: Malaysia and Saudi Arabia – Domino’s stores in Malaysia are expanding outside of Kuala Lumpur– 46 stores in Saudi Arabia as sales continue to grow
93
Market Highlights
○ Continued success: France, Netherlands and India– France recently began advertising on TV
○ Up and coming market: Brazil– Strong growth from new partners– Building more stores - currently in Rio and São Paulo is next target
○ New market: Indonesia, Qatar and Shanghai – First store in Jakarta opened in August

Continuing Success: 2008 Milestones!
750Stores operated by Domino’s Pizza Enterprises(Australia, New Zealand, Netherlands, France, Belgium)
94
300Stores operated by Domino’s Pizza Korea
200Stores operated by Domino’s Pizza India
100Stores operated by Domino’s Pizza Turkey
95
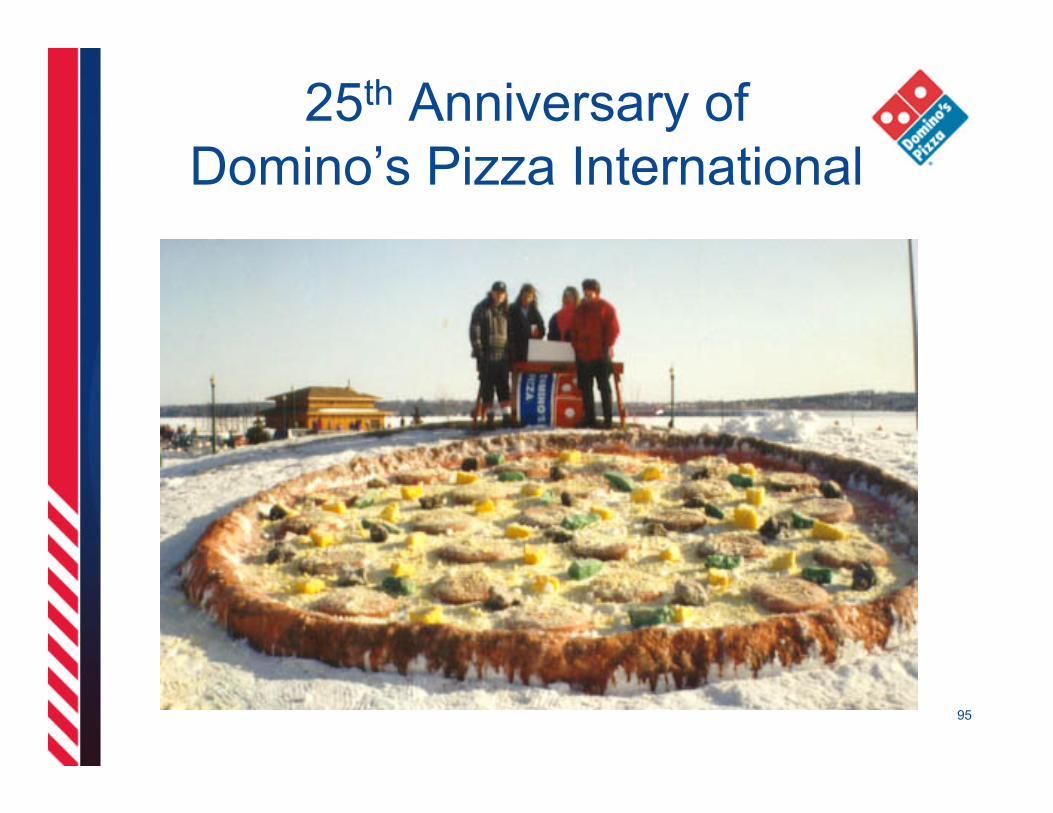
25th Anniversary of Domino’s Pizza International

96
Michael Berkman – Grupo Mozzarella International Area Franchisee
○ Domino’s Pizza International Franchisee since 1993
○ Began career as sub-franchisee for ALSEA in Mexico– Became the largest sub-franchisee in
Mexico○ Michael is now the Master Franchisee for
Panama, Costa Rica and Honduras○ Joint Venture with the Master Franchisee
of Peru ○ Clipped the ribbon on the 3,000th
international store
Domino’s Pizza Michael Berkman – Grupo Mozzarella
Agenda
○ Grupo Mozzarella - Current Status
○ How Did We Get There?
○ Maintaining One Brand, One System
○ Continuing Success
○ Q&A

Grupo Mozzarella Where We Are Today
99

International Master Franchise Model
100
DPZAnn Arbor, Michigan
Master Franchisee:ALSEA
Distribution System
Corporate Stores
Sub- Franchise Stores (Grupo Mozzarella)
Royalty
Royalty
Store ProfitsDistribution
System Profits
Where Grupo Mozzarella Started

International Master Franchise Model
101
DPZAnn Arbor, Michigan
Master Franchisee:Grupo Mozzarella
Distribution System
Corporate Stores
Royalty
Store ProfitsDistribution
System Profits
Where Grupo Mozzarella is Today

o 1993: Sub-franchised first store in Mexico from ALSEA• Quickly became the top sales store in Mexico
o 1996: Opened stores in two Wal-Mart stores• First Domino’s stores in Mexico to open inside another retail
outlet
o 1997: El Rosario store joins Domino’s Million Dollar Club
o 2000: Opens first store outside of Mexico City
o 2004: Becomes Mexico’s biggest sub-franchise with 27 stores
o 2005: ALSEA purchases all of Grupo Mozzarella’s stores
Grupo Mozzarella - How it All Began
102

Grupo Mozzarella MexicoYearly Sales 1993 – 1998 ($ in Millions)
1995 1996 1997 1998
$2.6
$4.2$4.8
19941993
$.45
$1.4
$6.8
210%
89%
61%
14%
42%
103
CAGR: 72.1%
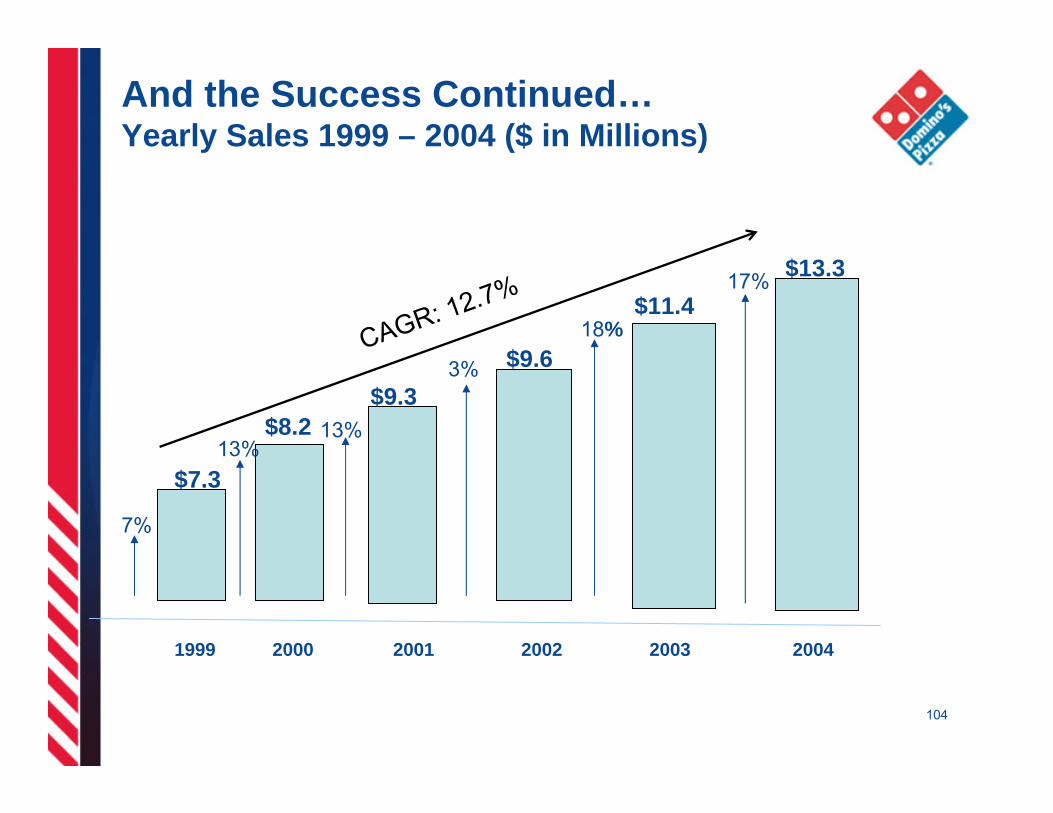
2001 2002 2003 2004
$9.3$9.6
$11.4
20001999
$7.3
$8.2
$13.3
13%13%
3%
18%
17%
7%
104
And the Success Continued…Yearly Sales 1999 – 2004 ($ in Millions)
CAGR: 12.7%

How Did We Do It?
○ People– Robust training for all Managers, Customer Service Representatives,
Pizza Makers and Drivers – Strong relationships with suppliers, customers and the community
○ Intense focus on a quality product
○ Service: store operations built around 30-minute guarantee
○ Investment in the new store image, computer systems and store-owned motorcycles.
105
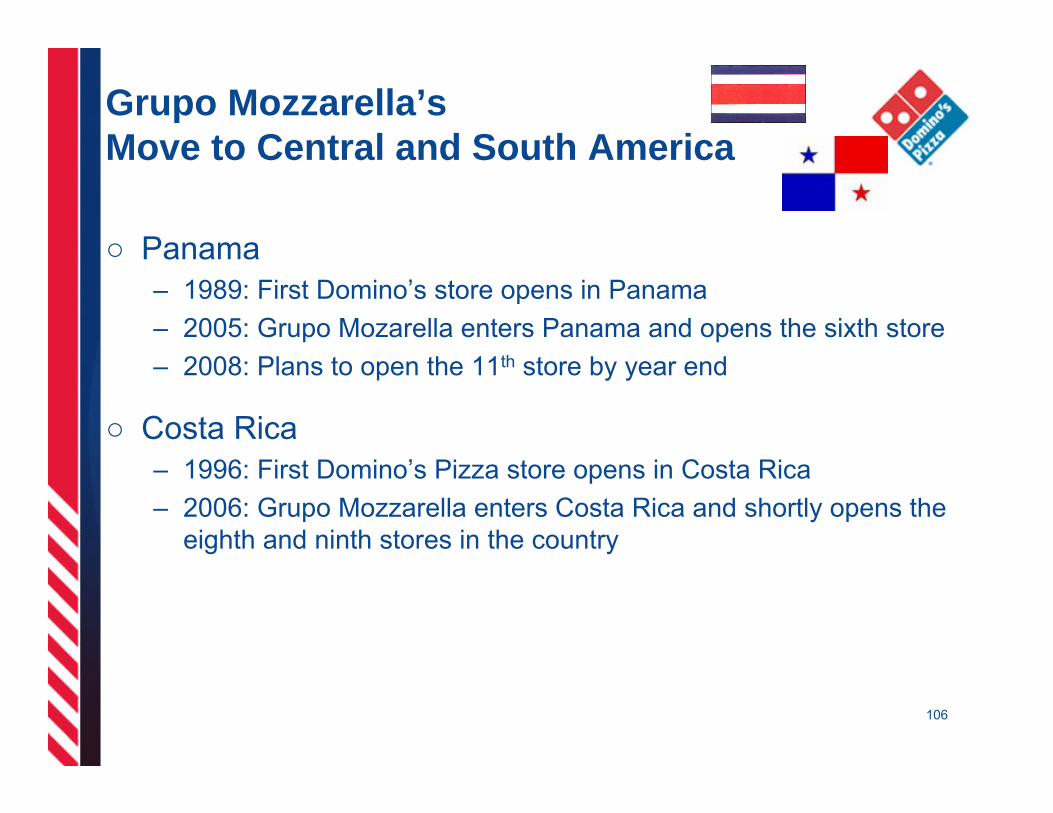
Grupo Mozzarella’sMove to Central and South America
○ Panama– 1989: First Domino’s store opens in Panama– 2005: Grupo Mozarella enters Panama and opens the sixth store– 2008: Plans to open the 11th store by year end
○ Costa Rica– 1996: First Domino’s Pizza store opens in Costa Rica– 2006: Grupo Mozzarella enters Costa Rica and shortly opens the
eighth and ninth stores in the country
106

Grupo Mozzarella’sMove to Central and South America
○ Peru– 1992: First store opens in Peru– 2006: Grupo Mozarella enters into a Joint Venture with the Bolona
Family – 2008: Operating 21 stores in Peru
○ Honduras– 1987: First ever Domino’s Pizza store opens in Latin America– 2008: Grupo Mozarella enters Honduras with plans to open stores
number 10 and 11 in 2009
11

Market Opportunity - Panama
108
○ Republic of Panama – Population of 3.4 Million
○ Panama Economics– Dollarized Economy– 37% below poverty line and 6.4% unemployment
○ Economic activities: banking, Panama Canal, construction and tourism
○ Competition – Pizza Hut, Tamburelli, Leonardos and Sbarro

Market Opportunity - Costa Rica
○ Republic of Costa Rica– Population of 4.5 Million…..smaller than West Virginia!
○ Costa Rican Economics:– 13% devaluation of currency, the Colon, in 2008– 16% below poverty line and 4.6% unemployment
○ Economic activities: agriculture, call centers and tourism
○ Competition – Pizza Hut, 2X1 Pizza and Papa John’s
109

Market Opportunity - Honduras
110
○ Republic of Honduras– Population of 7.4 Million– Tegucigalpa– 1.2 Million
○ Honduras Economics:– Currency is the Lempiras– 50% below poverty line and 27% unemployment
○ Primary economic activities: agriculture (coffee) and tourism
○ Competition – Pizza Hut, Little Caesar’s and Sbarro

Grupo Mozzarella in PanamaAnnual Sales ($ in millions)
2005 2006 2007 2008
$1.9
$2.5
$3.1$4.8
32%
21%
56%
$1.171%
2004
111
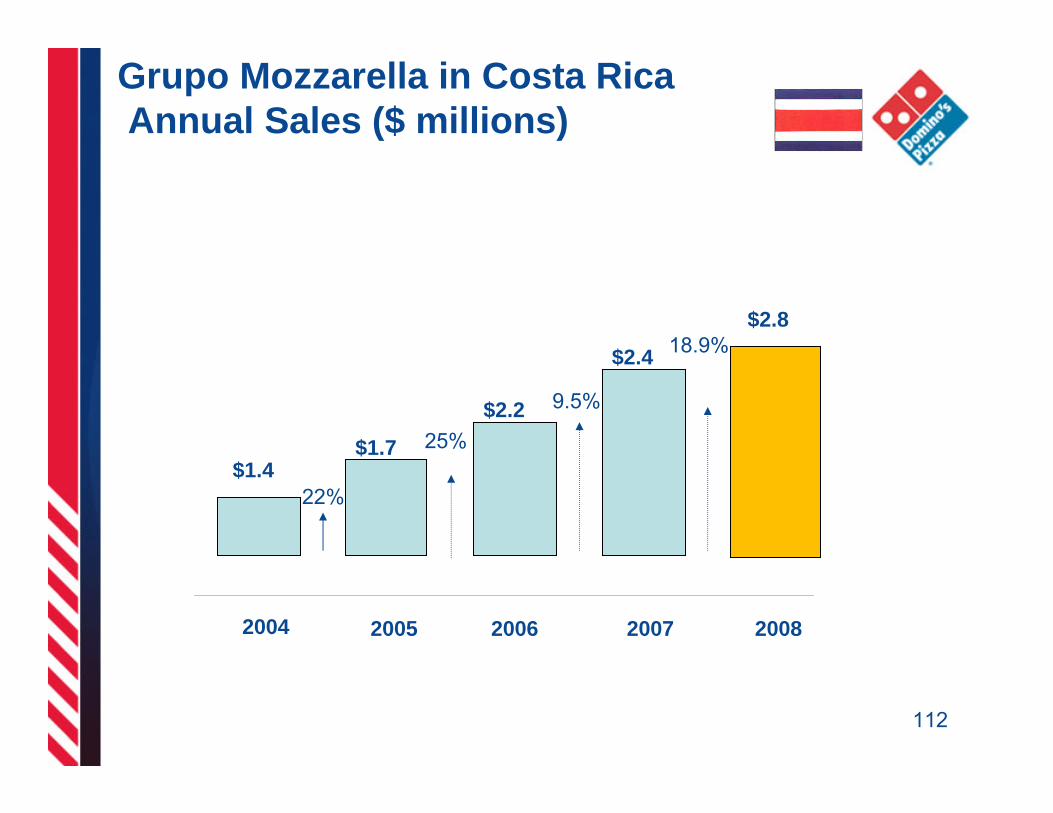
Grupo Mozzarella in Costa Rica Annual Sales ($ millions)
2005 2006 2007 2008
$1.7
$2.2
$2.4
$2.8
25%
9.5%
18.9%
$1.422%
2004
112
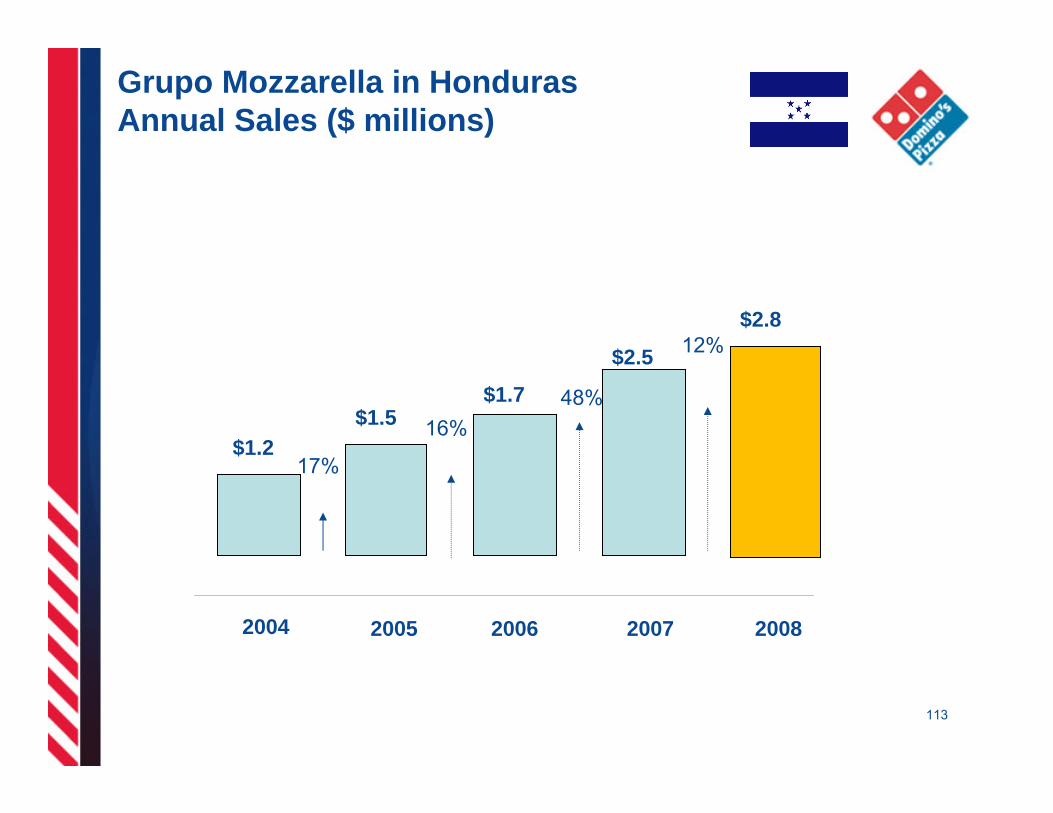
Grupo Mozzarella in HondurasAnnual Sales ($ millions)
2005 2006 2007 2008
$1.5$1.7
$2.5
$2.8
16%48%
12%
$1.217%
2004
113

8,000th Domino’s Pizza Store Opening
January 2006○ Grupo Mozzarella clipped the ribbon on the 3,000th
international store in Panama City– 5,000th store in the U.S. opened simultaneously in Huntley, Illinois
○ Celebration included fireworks and a visit from Panama’s First Lady
○ Kicked off a program, “Gracias, Panama” where Grupo Mozzarella donated 8,000 pizzas to local charities
114

115
Best Practicesfrom Central America
○ Local store marketing– Direct mail– Massive door hanging events
○ Support system of strong area supervisors
○ Focusing on financial results: sales and profits
116
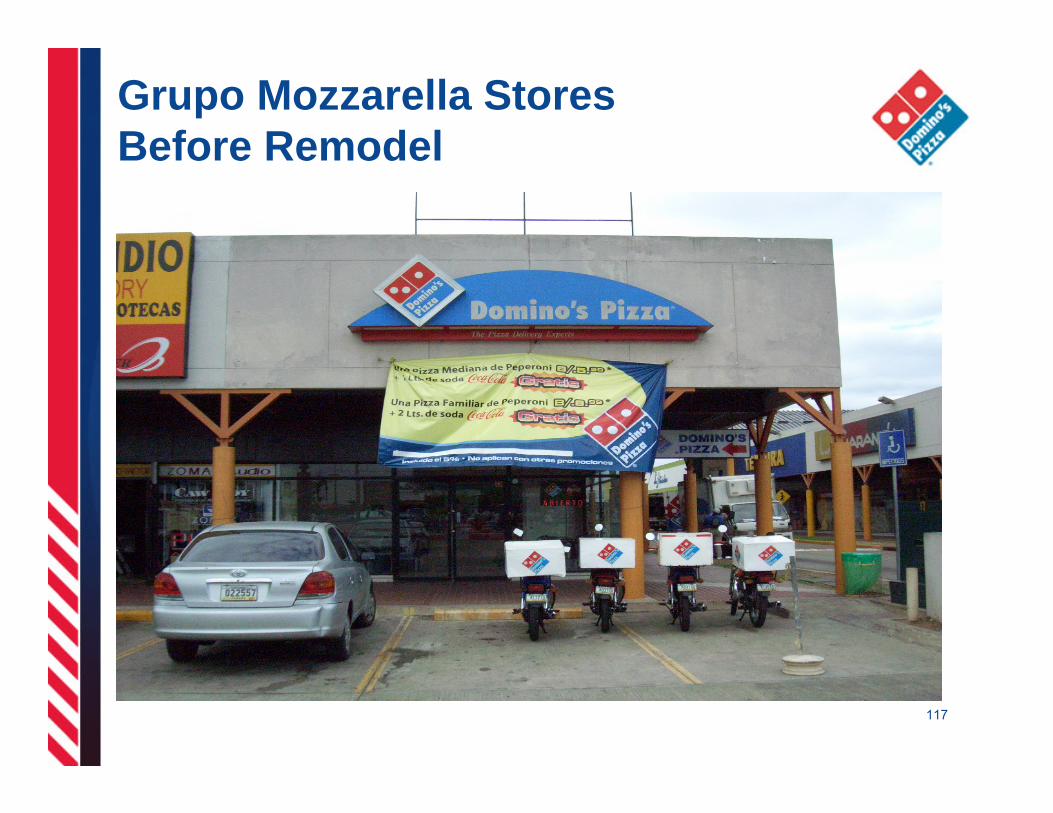
GRUPO MOZZARELLA CENTRAL AMERICAStores before....
Grupo Mozzarella Stores Before Remodel
117

GRUPO MOZZARELLA CENTRAL AMERICANew Image
Grupo Mozzarella – New Image
118
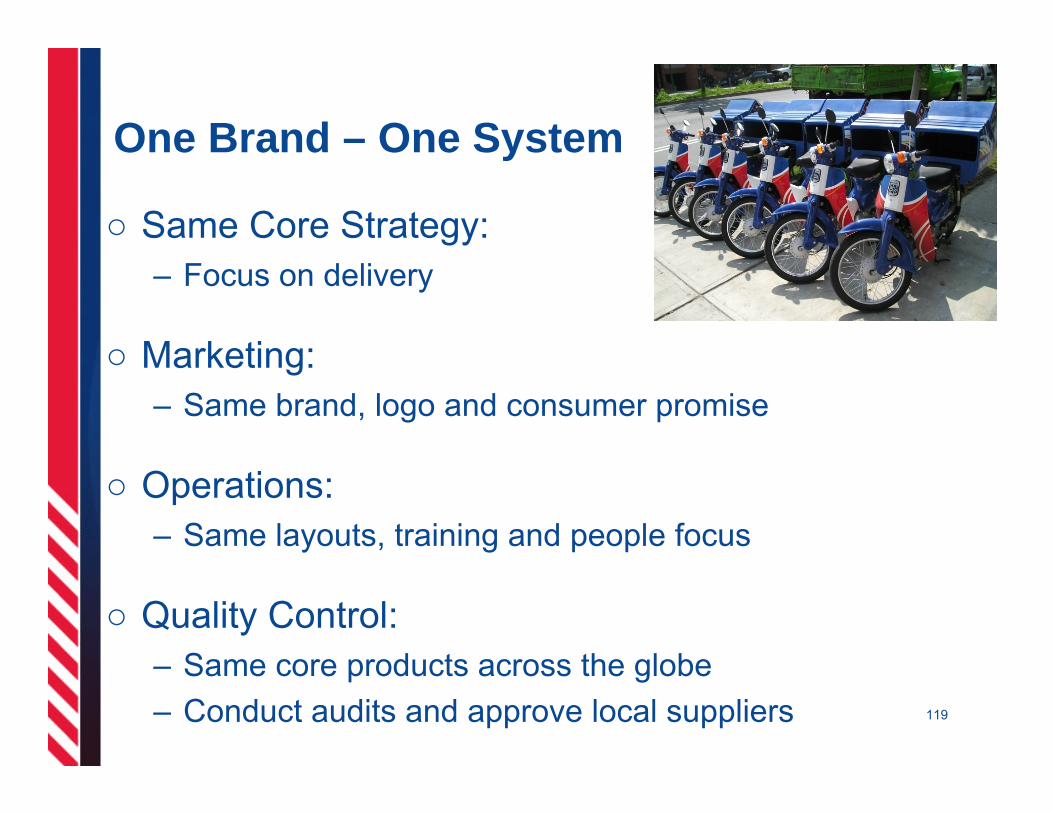
One Brand – One System
○ Same Core Strategy: – Focus on delivery
○ Marketing: – Same brand, logo and consumer promise
○ Operations: – Same layouts, training and people focus
○ Quality Control: – Same core products across the globe– Conduct audits and approve local suppliers 119
Localization
○ Store Operations– Central American stores often have sit-down area
• People in developing countries prefer dining out • Over 50% is carry-out or in-store dining business
○ Local Product Adaptations– Crust, sauce and cheese remain the same as Domino’s
U.S.– Toppings and side items, if they meet Domino’s
specifications, are our local twist120

○ Teriyaki Pizza in Peru– Mozzarella Cheese– Peppers– Onions– Mushrooms– Chicken – Teriyaki Sauce
121
Local Product Adaptations
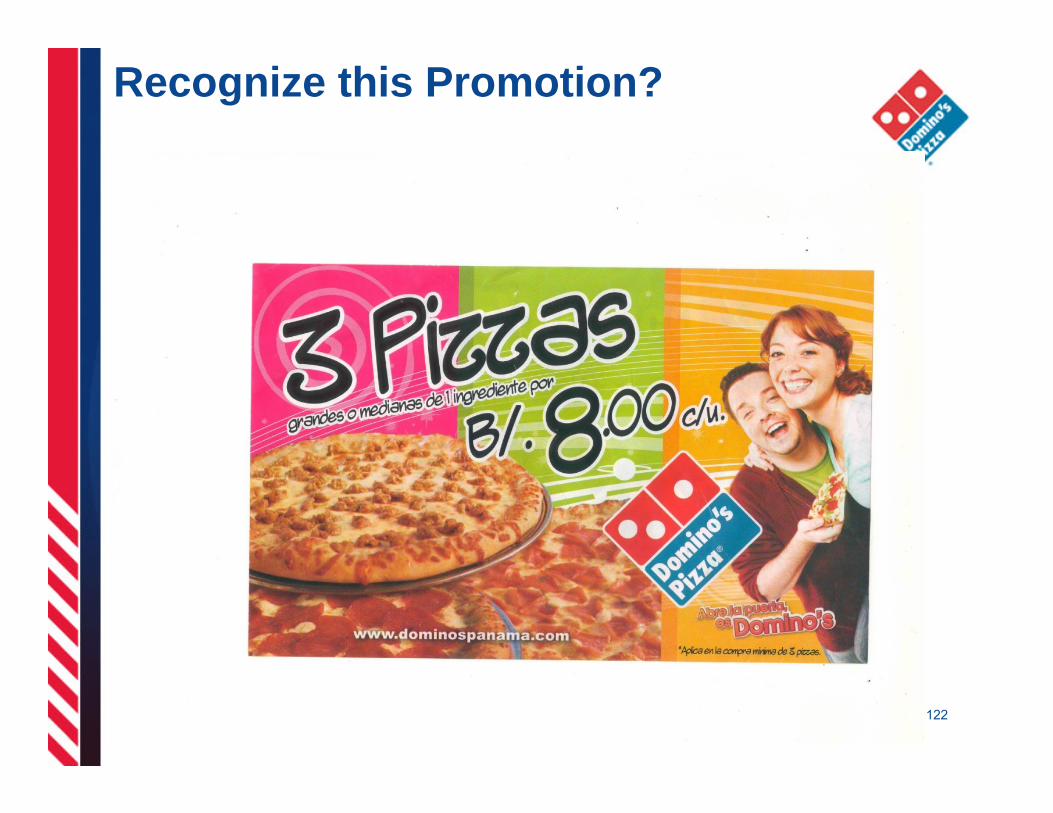
GRUPO MOZZARELLA CENTRAL AMERICAPROMOTIONS
Recognize this Promotion?
122

GRUPO MOZZARELA CENTRAL AMERICA
PROMOTIONS
“2X Tuesday” in the United States…
“2X1 Everyday” Limited-Time Promotion in Costa Rica
123

Continuing Success in Central America
○ Change stores to the new Vision 20/20 image
○ Optimize pricing
○ Call Center (a single phone number for the region)
○ Consolidate suppliers for more effective buys
○ Streamline promotions between the Central American countries
124

What’s Next for Grupo Mozzarella ○ Store opening events
– Company motorcycle caravans– Free pizzas to team members’ families– Mobil unit– Massive flyer distribution – Press
○ Expanding to other countries– Currently a Joint Venture with Peru– Goal is to also be in El Salvador and Nicaragua
○ Exciting promotions– Any pizza $7.99 - Panamá– 2X1 for 15 days - Costa Rica– Mega-Deal - Honduras 125

Thank you!
Questions?