dopmevel nenafnci a mtesesss en t for samoa
TRANSCRIPT

Development Finance Assessment for Samoa Leveraging �nance for sustainable development

© Government of Samoa & UNDP 2019All rights reserved
Disclaimer: The views expressed in this publication are those of the authors and do not necessarily represent those of the United Nations, including UNDP, or the UN Member States or the AP-DEF and its development partners.
Contact information:UNDP Samoa: Christina Mualia-Lima ([email protected] Bangkok Regional Hub: Emily Davis ([email protected])
Design and layout: Inis Communication – www.iniscommunication.com

Development Finance Assessment for SamoaLeveraging �nance for sustainable development
With support from

II
Acknowledgements
This report was developed as result of a Development Finance Assessment process in Samoa (DFA) commissioned and led by the Government of Samoa with support from UNDP. To lead the process of the DFA a national Oversight Team was formed comprising key officials from relevant ministries who guided the DFA exercise. The DFA Technical Team undertook the research and analysis that formed the substance of the DFA alongside colleagues from UNDP Samoa Country Office.
This report was written by Jens Claussen and Salote Meredith (independent consultants) under the leadership and guidance of the Ministry of Finance with the active participation in the team work of members of the Ministry of Finance (MoF), the Samoa Bureau of Statistics (SBS) and Central Bank of Samoa (CBS) who managed the process of collecting and compiling data for the financial mapping process and provided key information on public sector management systems and procedures. The report benefitted from valuable inputs from the members of the Government Oversight Team which provided guidance to the consultants throughout the DFA process. Guidance was provided by Thomas Beloe (Governance, Climate Change Finance and Development Effectiveness Advisor) and Emily Davis (Policy Specialist, Development Finance & Effectiveness) of UNDP Bangkok Regional Hub. Gratitude is also expressed to all stakeholders and partners, both within and outside the Government of Samoa, for their inputs and guidance throughout the process.
Special thanks to Duarte Branco (Communications Specialist, UNDP) and Andy Quan (editor) for finalizing the report. Photos are by Alvaro Hoyos Ramos.
Methodological support and technical guidance was provided by UNDP’s Development Finance Assessment Guidance developed by the Asia-Pacific Development Effectiveness Facility (AP-DEF) and UNDP Bangkok Regional Hub. Financial contributions and support from the Australian Department of Foreign Affairs and Trade (DFAT) are greatly appreciated.
Asia Pacific Development Effectiveness Facility (AP-DEF) AP-DEF is a country-led regional platform, chaired by the Government of Bangladesh, which supports countries to implement their national agendas on Development Finance and Cooperation. The Facility is a platform for regional dialogue, cooperation, and sharing of country knowledge and experiences. It is responding to the growing demand from countries in Asia and the Pacific to establish evidence and analysis, and introduce policy and institutional reforms for managing the increasing complexity of domestic and international sources of finance for development. AP-DEF has its Secretariat at the UNDP Bangkok Regional Hub.
Disclaimer: The views expressed in this publication are those of the authors and do not necessarily represent those of the United Nations, including UNDP, or the UN Member States or the AP-DEF and its development partners.
Contact information: UNDP Samoa: Christina Mualia-Lima [email protected] Bangkok Regional Hub: Emily Davis ([email protected]) Design and layout: Inis Communication – www.iniscommunication.com

III
Foreword
Over the past two decades, Samoa has established a solid track record of economic reform and performance. Underpinning these achievements is Samoa’s development agenda, which is articulated in our Strategy for the Development of Samoa 2016-2020 (SDS). The SDS sets out the overarching strategy for accelerating sustainable development and creating opportunities for all, and outlines the key policy priorities that the government is pursuing to achieve.
However, Samoa, like other Small Island Development States (SIDS) faces challenges of fiscal sustainability, and more so the substantial risks from natural disasters and the effects of climate change. The cross-cutting nature of climate change merits a renewed assessment of financial flows ensuring that the government’s approach towards financing is effectively aligned to Samoa’s development goals.
Hence, the Government of Samoa (GoS) requested the support of the United Nations Development Programme (UNDP) to commission this Development Finance Assessment (DFA) to take forward policy and institutional reforms to enable more integrated management of a broader set of finance flows to support the implementation of Samoa’s national priorities and the SDGs.
DFA takes into account the social, economic and environmental dimensions of development and it analyses the roles that different development finance flows play for or against sustainable development considering all these dimensions.
More importantly, the effective implementation of the necessary reforms in this DFA is crucial, to well-manage finance flows for macro-socio economic stability and sustainable developments for Samoa.
Hon. Sili Epa TuiotiMinister of Finance

IV
Content
Acknowledgements. . . . . . . . . . . . . . . . . . . . . . . . . . . . . . . . . . . . . . . . .II
Foreword . . . . . . . . . . . . . . . . . . . . . . . . . . . . . . . . . . . . . . . . . . . . . . III
List of Abbreviations . . . . . . . . . . . . . . . . . . . . . . . . . . . . . . . . . . . . . . .VII
Executive summary . . . . . . . . . . . . . . . . . . . . . . . . . . . . . . . . . . . . . . . . .1
1. Introduction. . . . . . . . . . . . . . . . . . . . . . . . . . . . . . . . . . . . . . . . . . . .4
1.1 Objectives and scope of work . . . . . . . . . . . . . . . . . . . . . . . . . . . . . . . . . . . . . . . . . 4
1.2 DFA methodology . . . . . . . . . . . . . . . . . . . . . . . . . . . . . . . . . . . . . . . . . . . . . . . . 5
1.3 The DFA approach in Samoa . . . . . . . . . . . . . . . . . . . . . . . . . . . . . . . . . . . . . . . . . . 6
2. Country context . . . . . . . . . . . . . . . . . . . . . . . . . . . . . . . . . . . . . . . . .9
2.1 Political developments. . . . . . . . . . . . . . . . . . . . . . . . . . . . . . . . . . . . . . . . . . . . . . 9
2.2 Economic performance . . . . . . . . . . . . . . . . . . . . . . . . . . . . . . . . . . . . . . . . . . . . 10
2.3 Poverty and Inequality . . . . . . . . . . . . . . . . . . . . . . . . . . . . . . . . . . . . . . . . . . . . . 12
3. Mapping Samoa’s finance flows . . . . . . . . . . . . . . . . . . . . . . . . . . . . . . 14
3.1 Government revenues . . . . . . . . . . . . . . . . . . . . . . . . . . . . . . . . . . . . . . . . . . . 14
3.2 Official Development Assistance . . . . . . . . . . . . . . . . . . . . . . . . . . . . . . . . . . . . . . 17
3.3 Global concessional funds . . . . . . . . . . . . . . . . . . . . . . . . . . . . . . . . . . . . . . . . . . 22
3.4 Other Official Flows (OOF) . . . . . . . . . . . . . . . . . . . . . . . . . . . . . . . . . . . . . . . . . . 23
3.5 International Non-governmental Organisations . . . . . . . . . . . . . . . . . . . . . . . . . . . . . 24
3.6 Government borrowing . . . . . . . . . . . . . . . . . . . . . . . . . . . . . . . . . . . . . . . . . . . . 26
3.7 Private sector equity and credit . . . . . . . . . . . . . . . . . . . . . . . . . . . . . . . . . . . . . . . 27
3.8 Foreign Direct Investment. . . . . . . . . . . . . . . . . . . . . . . . . . . . . . . . . . . . . . . . . . . 35
3.9 Public-Private Partnerships . . . . . . . . . . . . . . . . . . . . . . . . . . . . . . . . . . . . . . . . . . 37
3.10 Remittances. . . . . . . . . . . . . . . . . . . . . . . . . . . . . . . . . . . . . . . . . . . . . . . . . . . 38
4. Policy and Institutional Assessment. . . . . . . . . . . . . . . . . . . . . . . . . . . . 39
4.1 Policy coherence and vision for results . . . . . . . . . . . . . . . . . . . . . . . . . . . . . . . . . . . 39
4.2 Leadership and political buy-in . . . . . . . . . . . . . . . . . . . . . . . . . . . . . . . . . . . . . . . 41
4.3 Institutional coherence and management capacity. . . . . . . . . . . . . . . . . . . . . . . . . . . 43
4.4 Finance opportunities to achieve policy targets . . . . . . . . . . . . . . . . . . . . . . . . . . . . 44
4.5 Planning, monitoring and evaluation. . . . . . . . . . . . . . . . . . . . . . . . . . . . . . . . . . . . 46
4.6 Environment for dialogue and engagment of non-state actors . . . . . . . . . . . . . . . . . . . 47

V
5. Conclusions and recommendations. . . . . . . . . . . . . . . . . . . . . . . . . . . .48
5.1 Future financial flows to achieve policy targets . . . . . . . . . . . . . . . . . . . . . . . . . . . . . 48
5.2 Summary along INFF dimensions . . . . . . . . . . . . . . . . . . . . . . . . . . . . . . . . . . . . . . 50
5.3 Outline of a roadmap for implementation of DFA recommendations for Samoa. . . . . . . . . 52
Annex 1: Concept Note/ToR for DFA Samoa . . . . . . . . . . . . . . . . . . . . . . . .53
Annex 2: List of persons met . . . . . . . . . . . . . . . . . . . . . . . . . . . . . . . . . .61
BoxesBlended funds with private sector participation . . . . . . . . . . . . . . . . . . . . . . . . . . . . . . . 23
Potential to scaleup Micro and SME funding through existing delivery systems . . . . . . . . . . . 31
Challenge and venture capital funds as means of promoting new business entries . . . . . . . . . 34
SDS Key Policy Outcomes/Targets . . . . . . . . . . . . . . . . . . . . . . . . . . . . . . . . . . . . . . . . 39
FiguresFigure 1. Revenue as percent of GDP . . . . . . . . . . . . . . . . . . . . . . . . . . . . . . . . . . . . . . 14
Figure 2. Tax revenue at constant 2016 Tala and total as percent of GDP . . . . . . . . . . . . . . . . 15
Figure 3. Tax revenue as percent of GDP and GDP per capita in USD. . . . . . . . . . . . . . . . . . . 16
Figure 4. Other revenue in Tala at 2016 prices. . . . . . . . . . . . . . . . . . . . . . . . . . . . . . . . . . 17
Figure 5. GDP per capita and ODA per capita 2015 in USD. . . . . . . . . . . . . . . . . . . . . . . . . . 18
Figure 6. GDP per capita and ODA per capita 2015 in USD. . . . . . . . . . . . . . . . . . . . . . . . . . 19
Figure 7. Domestic revenue share of projections, domestic expenditure share of budget and ODA disbursements percent share of commitments, 2010 - 2015 . . . . . . . . . . . . . . . . . . 20
Figure 8. Government capital expenditures as share of total expenditures and ODA share of Government capital expenditures, 2011/12 – 2016/17 . . . . . . . . . . . . . . . . . . . . . 21
Figure 9. Distribution of global concessional funds by source . . . . . . . . . . . . . . . . . . . . . . . 22
Figure 10. Other Official Flows in Tala million at 2016 prices and share of ODA . . . . . . . . . . . . 24
Figure 11. NGO share of total official development assistance. . . . . . . . . . . . . . . . . . . . . . . 25
Figure 12. Official development assistance through NGOs by sector, share of total 2011–2015 . . 25
Figure 13. Public Sector Debt as percent of GDP . . . . . . . . . . . . . . . . . . . . . . . . . . . . . . . 26
Figure 14. Gross fixed capital formation in Tala million at 2016 prices . . . . . . . . . . . . . . . . . . 27

VI
Figure 15. World Bank Doing Business rating Samoa and Pacific Island States . . . . . . . . . . . . . 28
Figure 16. Bank credit in Tala million at 2016 prices and share of GDP . . . . . . . . . . . . . . . . . . 29
Figure 17. Interest spreads (lending rate minus deposit rate) in percent. . . . . . . . . . . . . . . . . 29
Figure 18. State owned enterprises return on assets and equity (percent), FY2002 – FY2014. . . . 32
Figure 19. Foreign Direct Investment share of GDP – country levels and region/group averages . 35
Figure 20. Samoa Foreign Direct Investment share of GDP . . . . . . . . . . . . . . . . . . . . . . . . . 36
Figure 21. Remittances share of GDP. . . . . . . . . . . . . . . . . . . . . . . . . . . . . . . . . . . . . . . 38
Figure 22. Policy decision and planning framework in Samoa . . . . . . . . . . . . . . . . . . . . . . . 42
Figure 23. Distribution of financing for development, 2015 . . . . . . . . . . . . . . . . . . . . . . . . 48
TablesTable 1. Categorization of financial flows included in the financial flow analysis . . . . . . . . . . . . 7
Table 2. Real GDP percentage growth over previous year. . . . . . . . . . . . . . . . . . . . . . . . . . 10
Table 3. Contribution to GDP by Sector . . . . . . . . . . . . . . . . . . . . . . . . . . . . . . . . . . . . . 11
Table 4. Proportion of Population Below Poverty Line . . . . . . . . . . . . . . . . . . . . . . . . . . . . 12
Table 5. Roadmap outline for implementation of DFA recommendations . . . . . . . . . . . . . . . 51

VII
List of Abbreviations
ADB Asian Development Bank
AECF Africa Enterprise Challenge Fund
AMP Aid Management Platform
AP-DEF Asia Pacific Development Effectiveness Facility
BCBS Basel Core Principles for Effective Banking Supervision
BDS Business Development Services
CBA Central Bank of Samoa Act
CBS Central Bank of Samoa
CDM Clean Development Mechanism
CERs Certified Emission Reductions
CIFs Climate Investment Funds
COFOG Classification of the Functions of Government
CTF The Clean Technology Fund
DBS Development Bank of Samoa
DFA Development Finance Assessment
DFI Development Finance Institution
DFID Department for International Development
DIS Deposit Insurance Scheme
ELA Emergency Liquidity Assistance
FDI Foreign Direct Investment
FI Financial Institution
FY Fiscal Year
GAVI Global Alliance for Vaccines and Immunization
GBS General Budget Support
GDP Gross Domestic Product
GEEREF The Global Energy Efficiency and Renewable Energy Fund
GEF Global Environment Facility
GFATM Global Fund to Fight AIDS, Tuberculosis and Malaria
GFI Global Financial Integrity
GFS Government Finance Statistics

VIII
GNI Gross National Income
GoS Government of Samoa
GPE Global Partnership for Education
GPEDC Global Partnership for Effective Development Cooperation
HDI Human Development Index
IBC International Business Company
IFC International Finance Corporation
IFF Illicit Financial Flows
IFRS International Financial Reporting Standards
IMF International Monetary Fund
INFF Integrated National Financing Framework
INGO International Non-Governmental Organization
KP Kyoto Protocol
LIC Low Income Country
LMIC Lower Middle-Income Country
MCIL Ministry of Commerce, Industry and Labor
MDBs Multilateral Development Banks
MDGs Millennium Development Goals
MDTF Multi-Donor Trust Fund
MFI Microfinance Institution
MIC Middle Income Country
MoF Ministry of Finance
MTEF Medium-Term Expenditure Framework
MTO Money Transfer Operator
NGO Non-Governmental Organization
NNGO National Non-Governmental Organizations
NPL Non-Performing Loan
NPS National Payment System
ODA Official Development Assistance
OECD Organization for Economic Co-operation and Development

IX
OECD/DAC Organization for Economic Co-operation and Development / Development Assistance Committee
OOF Other Official Flows
PEFA Public Expenditure and Financial Accountability
PFI Public Financial Institution
PFM Public Financial Management
PIDA Policy and Institutional Diagnostic Analysis
PPA Power Purchase Agreements
PPP Public-Private Partnership
RBS Risk-based Supervision
SAT Samoa Tala
SBEC Small Business Enterprise Centre
SBS Samoa Bureau of Statistics
SDGs Sustainable Development Goals
SDS Samoa Development Strategy
SHC Samoa Housing Corporation
SIFA Samoa International Financial Authority
SLAC Samoa Life Assurance Corporation
SME Small and Medium-sized Enterprises
SNPF Samoa National Provident Fund
SOE State Owned Enterprise
SPBD Samoa Pacific Business Development
SWAP Sector-Wide Approach to Programming
ToR Terms of Reference
UNDP United Nations Development Programme
WB The World Bank
WDI World Development Indicators
UTOS Unit Trust of Samoa

X
DEVELOPMENT FINANCE ASSESSMENT FOR SAMOA

1
ExECUTIVE SUMMARY
Executive summary
This Development Finance Assessment (DFA) was commissioned by Samoa’s Ministry of Finance (MoF) with support from the United Nations Development Programme (UNDP).
The overall objective of the DFA is to provide an overview of development finance flows, and the management and institutional arrangements to utilize finance to deliver national development goals and priorities. This includes forward-looking analysis about the most pertinent financing challenges the country will face over the timeline of the Sustainable Development Goals (SDGs).
Based on these analyses the DFA identifies policy changes and reforms that can support increased mobilization and enhanced management of finance for the SDGs. The resulting recommendations are presented in a roadmap of interventions. It is using the concept of an Integrated National Financing Framework (INFF) to increase the alignment of financing flows to national development goals and the SDGs.
The Government of Samoa (GoS) has a national development vision/plan with a well-articulated set of priorities and results related to the SDG agenda, including costed targets and indicators. While the Samoa Development Strategy (SDS) targets are to a large extent aligned to the SDGs there is a scope for further alignment for next and consecutive 4-year SDS. One option is to conduct a longer-term perspective study based on what will be required to achieve the SDGs within the 2030 which is then incorporated into the 4-year SDSs.
Samoa - Trends in financial flows 2010-2015 (mill Tala constant 2016 prices)
500
450
400
350
300
250
200
150
100
50
Tax revenue
Remittances
Domestic credit
FDI
Other revenue excl. ODA
ODA loans
ODA grants
Other �nancial services
OOF
2010 2011 2012 2013 2014 2015
Source: MoF, World Bank, OECD and IMF Government Finance Statistics

2
DEVELOPMENT FINANCE ASSESSMENT FOR SAMOA
The outcomes of the financial mapping and INFF assessment of this DFA suggest there are several financing opportunities that can be considered for more effective use of existing finance and accessing new sources of finance. Among them are efforts in further raising tax revenue, increase the predictability of aid by continued engagement with its ODA partners to enter into longer term joint financing agreements for sector programs, attract concessional and/or venture capital from Development Finance Institutions (DFIs), promote small and medium scale enterprises (SME) by allocating more funds for some of the existing SME schemes, promote SME venture capital funds including startup grants for “green field” companies in priority areas of comparative advantage and financing Business Development Services (BDS) outsourced to private sector management companies as additional means to promote private sector development. Samoa is also eligible for blended funds targeting middle income countries and emerging markets. There is a scope to promote more Public Private Partnership (PPP) contracts and scale up further Non-Governmental Organizations’ (NGO) engagement by outsourcing in the form of service or management agreements.
GoS has a comprehensive framework for planning, budgeting and monitoring public revenues and expenditure. an effective system for monitoring and evaluation of the use of finance for results. They consist of several planning, budgeting and monitoring instruments. A challenge is that they cover different periods of time thus not fully aligned. There is a scope to further consolidate the current planning and budgeting instruments into three levels; (i) SDS with sector plans translating SDS targets into sector strategies covering the same time frame as the overreaching SDS, (ii) Introduce Medium Term Expenditure Frameworks (MTEF) as a rolling plan and forward budget with a time frame of three years and subsequently (iii) use rolling corporate plans as detailed operational plans linked to the MTEFs with specification of activities to achieve the targets.
The analysis of the composition of finance for development presented in this report shows that Tax revenue is a significant source of finance, a source of government revenue that compares favorably with low-income countries and other countries in the region. The major source of external flows is remittances, which is high compared to the other Pacific Island Countries but will likely level out and even decline if policies to generate domestic employment and income opportunities succeeds. Net domestic credit serves as a smaller share of finance compared to other countries in the region and Lower-Middle Income Countries (LMICs) and has the potential to increase with recommended interventions among others reflected in the GoS financial inclusion strategy.
Based on the analysis of financial flows in Samoa and comparison to other countries in the region at the same income level (LMIC), the following are suggested as opportunities for increasing the efficiency in the use of finance and accessing additional concessional and non-concessional sources of finance:
• The two key efforts in further raising tax revenue will be to broaden the tax base and improving tax compliance. If using the average of the group of all Small Pacific Island States as a benchmark, then Samoa could potentially raise its tax revenues by 18%. If comparing to LMIC average the equivalent figure would be 10%.
• The GoS can potentially increase the predictability of aid by continued engagement with its Official Development Assistance (ODA) partners to enter into longer term joint financing agreements for sector programs. The above will allow a further move towards modalities of budget support with disbursements triggered by results instead of input-based financing dominated by project tied aid.

3
ExECUTIVE SUMMARY
• Access to affordable credit to promote private sector development has been identified as a key constraint in Samoa. To promote private sector investments GoS could consider establishing Challenge Funds or Venture Capital Funds subcontracted to private management companies which combine financial and non-financial services.
• Samoa has the potential to attract concessional and/or venture capital from DFIs at significantly higher levels and DFIs could also be a source finance for the planned divestments of State-Owned Enterprises (SOEs) and PPP projects.
• GoS could promote micro/SMEs by allocating more funds for some of the existing Micro/SME schemes jointly with development partners and/or DFIs.
• DFIs can also serve as partners in SME venture capital funds even if they will likely be limited by the size in demand as most of the DFIs have minimum investment thresholds of above 50 million USD, though in exceptional cases as low as 5 million USD.
• GoS could also consider financing BDS and startup grants for “green field” companies with management outsourced to private sector companies as additional means to promote private sector development.
• Samoa has yet to pursue blended funds targeting middle income countries and emerging markets. Several of these funds promote private sector participation in a range of sectors like renewable energy, transport and communication as well as PPP contracts.
• To rationalize and increase productivity of its SOE, reducing the need for subsidies and raising levels of revenue from this source, GoS is continuing implementation of reforms. This includes engagement in more Public Private Partnership (PPP) contracts as an incentive for increase in productivity in service delivery. These reforms can potentially raise additional equity finance from foreign investors alongside equity and debt finance from DFIs.
• There is a potential to scale up further NGO engagement through outsourcing in the form of service or management agreements. This can attract additional funding from their international NGO partners, a source of funding which draws on other allocations of donor aid budgets targeting NGOs and raise additional equity financed from the same INGOs.
• The scope to attract more FDI is not only linked to the general business climate and the constraints of small economies in achieving economy of scale, but also the extent to which Samoa can attract more FDI to some key sectors in which scale of investment can yield higher returns like fisheries and tourism. The plan to promote new PPP arrangements linked to SOEs can likely attract some FDI to bring in technology and management for improved productivity and profitability.
• While remittances play an important role in financing household investments and spending, less is used for savings and/or investment in productive assets. If addressing the challenges related to business climate and entry of new financial intermediaries and instruments in the financial sector, remittances can play a significant role as an additional source of finance for development purposes.
The above are translated into a suggested “Roadmap for implementation of DFA recommendations” presented in the concluding section of this report.

4
DEVELOPMENT FINANCE ASSESSMENT FOR SAMOA
1. Introduction
1.1 Objectives and scope of work This Development Finance Assessment (DFA) was commissioned by Samoa’s Ministry of Finance (MoF) with support from the United Nations Development Programme (UNDP).
The DFA was undertaken during the period October 2017 to January 2018. The DFA team was comprised of one international consultant and one national consultant with the active participation in data collection and compilation by a team from the Ministry of Finance (MoF), Central Bank of Samoa (CBS) and Samoa Bureau of Statistics (SBS), with the MoF as the team’s designated focal point.
The overall objective of the DFA is to provide an overview of development finance flows, and the management and institutional arrangements to utilize finance to deliver national development goals and priorities. This includes forward-looking analysis about the most pertinent financing challenges the country will face over the timeline of the SDGs. Based on these analyses the DFA identifies policy changes and reforms that can support increased mobilization and enhanced management of finance for the SDGs. The resulting recommendations are presented in a roadmap of interventions. It is using the concept of an Integrated National Financing Framework (INFF), to increase the alignment of financing flows to national development goals and the SDGs, improving the basis for achieving development results.
To achieve the objective, the scope of work covers the following:
• Provide an overview of the trends and composition of financing for development. The overview includes an assessment of challenges and opportunities for utilising the existing finances more efficiently and how additional finance can be mobilised to achieve Samoa’s national development priorities and the SDGs;
• Assess the role of the planning and budgeting process in linking both public and private finance with results, in the context of the SDGs;
• Assess the roles and responsibilities of national institutions in managing or influencing the development of individual financial flows to contribute to the national development plan and SDGs;

5
1. INTRODUCTION
The report is structured in the following sections;
1. The first section covers the introduction.
2. Section 2 presents the DFA methodology.
3. Section 3 presents the political and socio-economic context.
4. Section 4 presents the mapping of financial flows with analysis of trends and composition of different sources of finance.
5. In section 5, the report provides an assessment of challenges and opportunities related to the policy and institutional environment.
6. Section 6 presents a summary of financial flows and alternative future trajectories.
7. Section 7 presents the conclusions and recommendations of the analysis with a road map of actions to be considered for the Government jointly with non-government stakeholders.
1.2 DFA methodologyThe DFA methodology was developed by the UNDP Bangkok Regional Hub, the Secretariat of the Asia Pacific Development Effectiveness Facility (AP-DEF), in response to demand from countries for support in managing the increasingly complex landscape of development finance. The Third International Conference on Financing for Development, held in Addis Ababa in July 2015, opened discussions on how to mobilize the unprecedented amounts of financial resources that will be required to achieve the Sustainable Development Goals (SDGs) by 2030. The Addis Ababa Action Agenda assumes that countries will use their own national development strategies and plans to respond to the SDGs and calls for the use of Integrated National Financing Frameworks (INFFs) as an analytical framework for assessing challenges and opportunities for more effective use of finance for development and in identifying additional sources of finance.1 The DFA supports governments to help strengthen policies and actions for mobilizing different types of finance for sustainable development in a given country context.
1 United Nations. “Addis Ababa Action Agenda of the Third International Conference on Financing for Development.” (2015).

6
DEVELOPMENT FINANCE ASSESSMENT FOR SAMOA
A DFA uses INFF as an analytical framework to produce a roadmap that a government may implement to effectively and efficiently mobilize and utilize finance to achieve the SDGs and national development goals.2 The DFA provides a roadmap of actions based on the following INFF dimensions;
1. A national development vision/plan with a well-articulated set of priorities and results related to the SDG agenda, including costed targets and indicators.
2. Leadership and political buy-in at highest level of government.
3. Institutional coherence and management capacity at various political, technical, and working levels.
4. Finance opportunities; more efficient use of existing finance and accessing additional financial sources for development.
5. A system for monitoring and evaluation of the effective use of finance for results, in various time frames.
6. An enabling environment for accountability and dialogue for the use of finance for results.
1.3 The DFA approach in SamoaThe financial flow analysis, presented in section 3, covers the last 10 years from Fiscal Year (FYs) 2006/07 to 2015/16. It maps the domestic and external, public and private capital flows that potentially can serve to finance the GoS policy targets and SDGs. To contextualize the financial mapping, comparison is made to regional averages and/or countries at a similar income level measured by Gross National Income (GNI) per capita.
The mapping has been organized into three analytical levels. At the highest level (level 1) the analysis covers a) domestic public; b) external public; c) domestic private; and d) external private flows. At level 2 the analysis covers conventional disaggregation of each of the level 1 financial flows, whereas level 3 analyses financial flows of specific interest where data availability allows for detailed disaggregated analysis in areas of relevance and interest (e.g. tax and non-tax revenues, different forms and channels of ODA grants, funds for promoting private sector investments and Public-Private Partnerships).
Data has been subject to triangulation between different sources, using national official statistics and public-sector finance data presented by the GoS as the primary source. In addition, the data analysis, in particular at disaggregated levels, has been supplemented by data and results from surveys and reviews undertaken on particular subjects. Table 1 categorizes the financial flows included in the DFA as domestic/external and public/private.
2 United Nations Development Programme (UNDP)/Asia Pacific Development Effectiveness Facility (AP-DEF). “Development Finance Assessment and Integrated Financing Solutions: Achieving the Sustainable Development Goals in the Era of the Addis Ababa Action Agenda.” (2017).

7
1. INTRODUCTION
Table 1: Categorization of financial flows included in the financial flow analysis
Public Private
Domestic • Tax revenues• Non-tax revenues• Government borrowing
• Domestic equity• Domestic credit• National NGOs
External • ODA grants and loans• Other Official Flows (OOF)
• International financial markets• International NGOs• Foreign Direct Investment (FDI)• Remittances
Following the mapping of finance flows, the results analysis of the INFF dimensions to identify challenges and opportunities at policy, management and institutional levels for more efficient use of current and additional sources of finance is presented
The INFF dimensions are assessed based on three sources of information, i) the outcome of the financial mapping, ii) primary data from interviews with public and private sector stakeholders collected by the DFA team, and iii) secondary data from diagnostic studies such as the Public Expenditure and Financial Accountability (PEFA), sector studies and reviews and thematic studies and surveys. Based on this analysis, baselines of each of the six INFF building dimensions are summarized.
The above is followed by a prospective analysis that presents the trends and composition of Samoa’s finance flows compared with other countries at a similar income level. The analysis aims to illustrate the potential that Samoa may have to mobilize additional finance.
1.4 Data collectionThe analysis is based on primary financial data provided by MoF, SBS, CBS and various sector ministries and agencies. These have been combined with data from, among others, the World Bank, the International Monetary Fund (IMF), the Organisation for Economic Co-operation and Development (OECD), various United Nations agency databases as well as others. This has enabled, among others, to make comparison to other countries in the region and at the same income level. In addition, the analysis was supplemented by data and results from various surveys undertaken to enable further analysis at disaggregated levels.
The team also collected qualitative data from a range of stakeholders including government institutions, private sector institutions, NGOs, and development partners, which provided additional information by sharing relevant assessments, reviews and evaluations, as well as government documents. The data sources mentioned partly overlap, which gave the team the opportunity to triangulate the data between the different sources.
The public finance data are based on data from the GoS Financial Management Information System (FMIS); “Finance One”3. Data on external flows have been based on information from the CBS, while the more disaggregated analysis of individual flows has been based on the information from the MoF,
3 Finance One is the Government of Samoa Financial and Payroll/Human Resource Management Information System, and incorporates a number of modules including General Ledger, Procurement, Accounts Payable, Accounts Receivable, Bank Reconciliation, Assets Management, Payroll and Human Resource Registry.

8
DEVELOPMENT FINANCE ASSESSMENT FOR SAMOA
SBS, CBS, OECD/DAC, World Bank, and IMF, amongst others. The former is based on data generated and complied by the national institutions while OECD/DAC, IMF and the World Bank data are from their respective international headquarters. The World Bank and IMF data were reconciled with the CBS, SBS and MoF data. While there are deviations between the different sources, the aggregates are based on primary sources from public accounts and balance of payments statistics. The disaggregated data, with more detailed information about a particular flow (purpose, nature of disbursement, etc.), has been based on the other sources.
The disaggregated analysis of some flows, like remittances and private equity funds, have in some cases been based on information from sample surveys, in which case they serve as estimates rather than actual accounts.

9
2. COUNTRY CONTExT
2. Country context
2.1 Political developmentsThe Independent State of Samoa, formerly known as Western Samoa, is a country encompassing the western part of the Samoan Archipelago in the South Pacific Ocean. The 1960 Constitution is based on the British Westminster parliamentary democracy albeit modified to reflect Samoan Matai systems and customs. Samoa is a democracy where Parliament is elected every five years through universal suffrage. Existing alongside the country’s Westernized political system is the chiefly system of socio-political governance and organization, central to understanding Samoa’s political system.
The government of the day (malo) consist of the Cabinet (executive) and Parliament (the legislative assembly). The Cabinet is formed from the party which holds the majority seats in parliament. Executive power is exercised by the Cabinet. Legislative power is vested in parliament. The Judiciary is independent of the executive and the legislature. There is a separate court to resolve disputes over land and traditional titles.
The ruling party, Human Rights Protection Party (HRPP), has been in power for more than 30 years since it was founded in 1982 by its first leader, the late Honourable Tofilau Eti Alesana. To date, the HRPP has continued in power under the leadership of the Honourable Prime Minister Tuilaepa Sailele Malielegaoi. The 2016 elections saw the HRRP party return to power with a landslide victory.
Samoa has enjoyed political stability for more than three decades and this stability has enabled the government to implement long term investments. The government articulates its national priority areas of development through the Strategy for Development of Samoa (SDS) with a timeframe of 4 years, the current one being 2017-2020. The SDS is linked to the 14 Sector Plans. Ministries are operationally guided by ministry level corporate plans linked to the Sector Plans and SDS. To reflect the global development efforts such as the Sustainable Development Goals (SDGs), the SAMOA Pathway, the Paris Agreement, the Financing for Development Action Agenda; the government aligns to these global agendas through the SDS.

10
DEVELOPMENT FINANCE ASSESSMENT FOR SAMOA
2.2 Economic performanceSamoa is a small open economy and geographically isolated from the main trading routes. Samoa faces some structural economic imbalances. One is related to trade, another is the dual economic structure of a large informal sector and rural economy alongside a formal and urban economy and the extent in which these two economies are disjointed. To address its trade imbalance, the government has adopted both export led initiatives and import substitution policies, to be driven mainly by and through private sector development. However, government has been and continues to be challenged in how to address the existence of a dual economy.
Like the other small Pacific Island Countries (PICs), Samoa faces many constraints which pose public financing challenges. In particular, Samoa’s geographic characteristics – smallness, remoteness, and internal dispersion – tend to give rise to structural gaps between domestic revenues and public expenditure. As a proportion of GDP, public spending is systematically higher due in part to the challenge of achieving economy of scale given the size of the population, as well as the high cost of imported inputs. As a result, there is a financing gap between available revenue and cost of service delivery. This gap is generally financed by a combination of grants from development partners, trust fund flows, resource-related revenues such as fishing license fees, and concessional or semi-concessional loans.
Samoa also faces frequent natural disasters and climate-related impacts which have destructive effects on livelihoods and the capital stock. Annual losses from natural disasters has been averaging around 2–3 per cent of GDP and Samoa lacks the fiscal space required as a resource buffer against these events. Accordingly, it has been relying on donor finance in their aftermath. The process of accessing finance from development partners after a disaster, however, has sometimes been lengthy thought sufficient to return the physical capital stock to its pre-disaster level.
Both fiscal and monetary policies are set by MOF and CBS with the primary objective of securing macroeconomic stability in the medium to long term. Fiscal policy sets the environment to contain budget deficits. These include personnel costs; public debt; State Owned Enterprise performances; and strengthening compliance in revenue collection. The main fiscal policy pursed by government over the last 20 years has been to maintain fiscal stability by limiting the budget deficit to less than 3.5% of GDP and public debt to below 50% of GDP. The other regular fiscal policy has been to invest in key infrastructure development such as roads, sea walls, telecommunication and both air and sea ports.
Monetary policy is set to accommodate the fiscal policy stance to achieve sustainable economic growth with the targets of maintaining a low level of inflation and sufficient foreign exchange reserves to cover imports for 4-6 months. The main monetary instrument used by the CBS is the exchange rate which is pegged to a basket of currency with Samoa’s main trading partners albeit being adjusted when appropriate by the Central Bank.
Table 2: Real GDP percentage growth over previous year
2012/2013 2013/2014 2014/2015 2015/2016 2016/2017Forecast
2017/2018
GDP growth rate -1.9 1.2 1.6 7.1 2.4 1.9
Source: Samoa Bureau of Statistics, June Quarter 2017; Central Bank of Samoa – Monetary Policy Statement 2017-2018

11
2. COUNTRY CONTExT
The economy has performed relatively well over the last five years, recording four consecutive years of growth. The FY 2015/2016 exhibited the strongest growth of 7.1% in real terms. The main drivers for GDP growth has been Commerce, Fishing, Construction and Transport sectors. However, the contraction of these same industries with the exception of Commerce, were the main cause of reduced economic growth in FY 2016/2017. The Central Bank of Samoa forecasted the economy to grow at around the 2% mark for the year 2017/20184.
Samoa launched its first Employment Policy (SNEP) 2016-2020 in October 2016. The vision was to provide productive employment opportunities which will generate adequate incomes and thereby improve the quality of life for all Samoans. The policy spelt out the key macroeconomic conditions necessary to achieve this goal; the economy needs to grow above 4% if unemployment is to be averted, to maintain price stability and medium term fiscal sustainability.
Table 3: Contribution to GDP by Sector
Sector % contribution to GDP % contribution to GDP growth
2015/2016 2016/2017 2015/2016 2016/2017
Agriculture 6.6 7.6 -0.5 1.2
Fishing 3.8 3.2 1.3 -0.5
Food & Beverages manufacturing 3.5 3.6 0.4 0.2
Other manufacturing 5.6 5.9 0.2 0.4
Construction 11.0 9.6 1.3 -1.2
Electricity and water 3.9 4.0 -0.1 0.2
Commerce 31.2 32.5 2.1 2.1
Accommodation and restaurants 2.1 2.0 0.6 0.0
Transport 5.0 4.7 1.0 -0.2
Communication 4.4 3.8 0.3 -0.6
Public administration 7.2 7.0 0.1 -0.1
Financial services 3.7 3.9 0.2 0.3
Less: Enterprise share of FISIM -1.2 -1.2 -0.1 -0.1
Business services 2.7 2.7 -0.3 0.1
Ownership of dwellings 5.2 5.1 0.0 0.0
Personal and other services 5.2 5.6 0.6 0.6
Source: Samoa Bureau of Statistics, June Quarter 2017
It is estimated that Agriculture employs about two-thirds of the labour force mainly as subsistence farmers. In terms of formal employment, 24,137 were formally employed as of June 20175. The industries with the highest percentage of formal employment were the Public Sector, Commerce, Other Services, Transport, Food Manufacturing and Other Manufacturing although the latter is expected to decline in share as a result in the closure of Yazaki company, one of the largest Non-Food Manufacturers.
4 SBS June 2017 Quarterly report and Central Bank Monetary Policy Statement 2017/2018.
5 SBS Employment Report June 2017 – (Employee that contributed to Samoa national Provident Fund)

12
DEVELOPMENT FINANCE ASSESSMENT FOR SAMOA
According to Central Bank of Samoa forecasts, the near-term growth outlook is positive. GDP is expected to grow between 2-3 percent per year. Growth will be driven by improvements in the business climate, tourism, and construction, including infrastructure projects. The performance of the tourism sector is expected to further improve in the medium-term. There has been major capital investment in hotel infrastructure such as Sheraton Aggie Grey Hotel and Taumeasina Resort, and the 2017 launch of local airline Samoa Airways in November. The closure of Yazaki, the largest manufacturing employer, is estimated to reduce growth by about 0.9 percentage points for FY 2017/18 with a further reduction of about 0.1 percentage points in 2018/196. Average inflation is expected to pick up with increasing commodity and fuel prices but remain around 3.0 percent over the medium term.
2.3 Poverty and InequalityThere is no extreme poverty in Samoa largely due to a strong social fabric network of culture and extended family support coupled with an abundance of land and rich sea resources. According to the Government and UNDP Samoa Hardship and Poverty 2016 Report, Samoa does not have extreme poverty, however there are still people who lack the necessities to live a quality life.
The 2013/2014 Household and Income Expenditure (HIES) Report identified that poverty in Samoa has declined. Those living below the Food Poverty Line7 (FPL) and Basic Needs Poverty Line8 (BNPL) have declined from 2002 to 2013 although there are year on year changes also due to the impact of natural disasters such as cyclones.
Table 4: Proportion of Population Below Poverty Line
Percent of population 2002 2008 2013/2014
Below Food Poverty Line 10.6 4.9 4.3
Below Basic Needs Poverty Line 22.9 26.9 18.8
Source: Samoa Hardship and Poverty Report 2013/2014
Poverty and hardship is higher among the unemployed and individuals working in the informal sector who are involved in unpaid family and community work, household duties and subsistence production.
The formal sector made up of government and public-sector employees are better off compared to their counterparts in the private sector. Students (part-time and full-time) and retirees are among the most vulnerable groups. Most interesting to note, people in the informal sector in Savai’i are significantly better off than their informal sector counterparts in other regions of Samoa. In terms of geographical location, the urban areas of Apia and North-West Upolu have higher incidences of poverty compared to other regions of Samoa.
6 Central Bank of Samoa, Monetary Policy Statement for The Financial Year 2017/2018
7 Food Poverty Line (FPL) is defined as number of calories required by an individual to meet minimum nutrition standard. For Samoa the value of 2,100 kilocalories/day per capita, determined by the HIES 2013/2014.
8 Basic Need Poverty Line (BNPL) is defined as cost of living that an individual need to meet his/her minimum living standard. For Samoa the value in 2013/2014 was $60 per week per capita.

13
2. COUNTRY CONTExT
Whilst the proportion of the population living below the Food Poverty Line and Basic Needs Poverty Line have declined, inequality on the other hand between the ‘haves’ and ‘have not’ has increased significantly. Although there has been a positive shift in living standards for the lower end of the scale, those on the top end of scale are increasing their incomes at a much faster rate. This is confirmed by the increase in the Gini Coefficient which measures the level of inequality from 0.43 in 2002 to 0.56 in 2013/20149.
Samoa now has a higher proportion of its population in the vulnerable group, meaning that any adverse changes to their circumstances would result in them falling below the poverty line. The highly disadvantaged are those who have very little access to cash incomes. One example is the closure of Yazaki company this year resulting in the loss of about 800 jobs which is expected to affect the highly vulnerable group leading to an increase in poverty.
9 Samoa Bureau of Statistics and UNDP Pacific Centre, Samoa Hardship and Poverty Report

14
DEVELOPMENT FINANCE ASSESSMENT FOR SAMOA
3. Mapping Samoa’s finance flows
3.1 Government revenues Government revenues, which consist of taxes, grants and other revenues, serve as a major source of finance for GoS investments and programs to achieve the SDS and SDGs. In the case of Samoa, the GoS has displayed continued improvements in revenue performance over the last decade, as illustrated in the figure below.
Figure 1: Revenue as percent of GDP
Source: MoF
Source: MoFSamoa has displayed a higher share of government tax and non-tax revenue than Fiji although lower than Tonga. This can be explained by level of ODA grants which is higher per capita in Tonga relative to GDP while significantly lower levels of ODA relative to GDP per capita in Fiji i.e. Samoa enjoys access to higher levels of ODA grants for public sector spending than Fiji and significantly higher if compared to other LMIC countries. For some years the increase in revenue as share of GDP in Samoa is due partly to donor country responses following natural disasters in the aftermath of cyclones that has had relatively more devastating impact on Samoa than Fiji (the latest being Cyclone Evan in December 2012). The increase in revenues then stems from among other emergency relief assistance and investments in rehabilitation.
55
50
45
40
35
30
25
202007 2008 2009 2010 2011 2012 2013 2014 2015 2016 2017
Samoa TongaFiji

15
3. MAPPING SAMOA’S FINANCE FLOWS
When comparing revenues excluding grants (i.e. revenue from taxes and other state revenue), the relative tax burden has been lower in Samoa since 2011, however, gradually increased, partly as a result of tax management reforms (more effective systems for tax collection and monitoring).
3.1.1 Tax RevenuesIn Samoa the Ministry for Revenue (MfR) collects tax and customs revenue. The Inland Revenue Service is responsible for administration of the tax system of the country and the Customs Service is responsible for border control and facilitation of trade at the border.
Some recent changes for Inland Revenue have taken place with the new legislation passed in 2012 and a new Customs Act was passed by Parliament in August 2014, as part of the Government of Samoa’s Customs Modernization Project. These changes have led to improvements in taxpayer compliance through increased education and awareness activities, and enforcement procedures.
Figure 2: Tax revenue at constant 2016 Tala and total as percent of GDP
Source: MoF and IMF Government Finance Statistics
The above-mentioned measures have given results in the form of significant increases in revenue from taxes on goods and services in real terms as illustrated in the figure above. The major tax on goods and services are VAGST. The rate of growth of this tax income has been higher than the growth of GDP.
The increase in revenue from VAGST has served as the main factor in the overall increase in the share of total tax revenues to GDP. While VAGST has been contributing to total tax revenue increasing relative to GDP and above the average of lower middle-income countries, it is still lower if comparing tax level to GDP per capita with the average of other Pacific Island States (ref. figure below).
The small size of the Samoan economy precludes some economic activity with significant challenges in reaching economies of scale. In small Pacific island countries like Samoa, provision of public goods is costly because many government institutions have high fixed costs.
Total tax revenue percent of GDP
Taxes on income
Taxes on property
Taxes on goods and services
Taxes on trade
350
300
250
200
150
100
50
0
30
25
20
15
10
5
0
2010 2011 2012 2013 2014 2015 2016

16
DEVELOPMENT FINANCE ASSESSMENT FOR SAMOA
Generally, the smaller the country, the higher the per capita cost of providing services. Because of these factors, the tax base in many Pacific island countries (including Samoa) is small as compared to the relatively high cost of providing public goods and services. Thus, all the Pacific Island states at LMIC levels of income have relatively higher tax rates than the LMIC average. A further increase in tax burden may adversely impact on growth through private sector development though there are notable reform measures suggested from several reviews and the GoS is continuously making efforts in improving its tax administration and adjust its tax policy.
Figure 3: Tax revenue as percent of GDP and GDP per capita in USD
Source: MoF and IMF Government Finance Statistics
The two key efforts in further raising tax revenue will be to broaden the tax base and improving tax compliance. Broadening of the tax base implies a review of the current system for personal income tax as well as further reform related to tax exemptions for different businesses and organizations drawing on the practice of other countries in the region. Improving tax compliance includes further development of web based electronic tax filing and payment system as well as application of audit systems to more effectively target underreported taxable income and tax evasion. If using the average of the group of all Small Pacific Island States as a benchmark, then Samoa could potentially raise its tax revenue by 18%. If comparing to LIMIC average the equivalent figure would be 10%.
3.1.2 Other revenuesOther revenues in total constituted 16 percent of total Government revenue in 2016. This includes foreign grants (ODA grants), administrative fees and user charges (from provision of services) and property income. The main source of other revenues has been ODA grants though with significant year on year fluctuations, in 2016 constituting 7.6% of total government revenues.
Tax
reve
nue
perc
ent o
f GD
P
GDP per capita
Solomon Islands
Paci�c island small states
FijiSamoa
Kiribati
Lower middle income
1,000 2,000 3,000 4,000 5,000 6,000
35
30
25
20
15
10
5
0

17
3. MAPPING SAMOA’S FINANCE FLOWS
Grants have varied significantly over the years, partly because of emergency relief following natural disasters (Cyclones) and partly from peak of externally funded infrastructure investments. Over the years, the GoS has also experienced significant fluctuations in returns (dividends) from its assets, most prominently from the State-Owned Entities (SOEs) and with subsidies exceeding the total return from the state-owned corporations.
Figure 4: Other revenue in Tala at 2016 prices.
Source: MoF and IMF Government Finance Statistics
The GoS can potentially reduce the volatility of aid by it continued engagement with its ODA partners to enter into longer term joint financing agreements for sector programs rather than shorter term standalone projects. However, to achieve there may be a need to adjust GoS system for planning and management of its public-sector interventions if to move further towards modalities of budget support with disbursements triggered by results instead of input-based financing dominated by project tied aid.
To rationalize and increase productivity of its SOE rather reducing need for subsidies and raising levels of revenue from this source, GoS is continuing implementation of reforms. This including completion of audits of annual reports to more effectively facilitate collection of dividends and consider divestment or engagement in more Public Private Partnership (PPP) contracts as an incentive for increase in productivity in service delivery. The above issues will be discussed further in sections below.
3.2 Official Development AssistanceSamoa has relative high levels of ODA grants and loans per capita as compared to its peers (LMIC and Pacific Island States averages). As displayed in the figure below even countries with significantly lower income also have lower ODA per capita; i.e. Samoa is at the forefront in mobilization of ODA for its development finance.
160
140
120
100
80
60
40
20
0
2010 2011 2012 2013 2014 2015 2016
Other
Property income
Sales of goods and services
Grants
18
DEVELOPMENT FINANCE ASSESSMENT FOR SAMOA
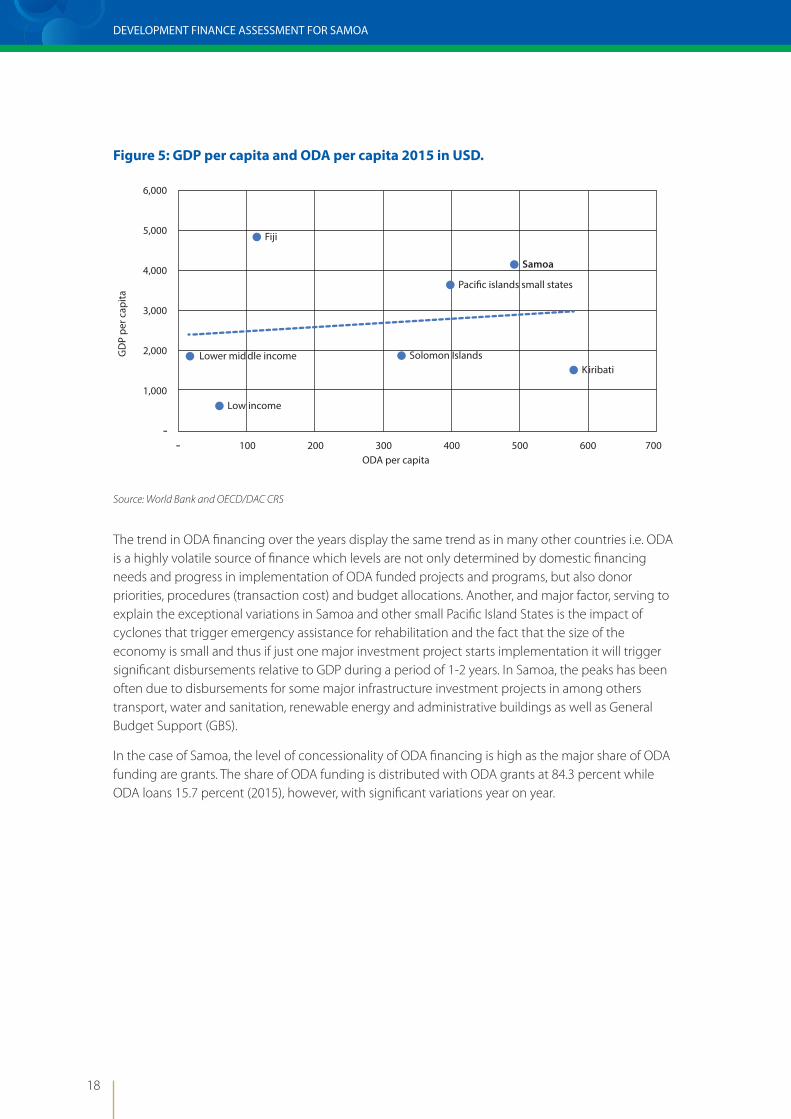
Figure 5: GDP per capita and ODA per capita 2015 in USD.
Source: World Bank and OECD/DAC CRS
The trend in ODA financing over the years display the same trend as in many other countries i.e. ODA is a highly volatile source of finance which levels are not only determined by domestic financing needs and progress in implementation of ODA funded projects and programs, but also donor priorities, procedures (transaction cost) and budget allocations. Another, and major factor, serving to explain the exceptional variations in Samoa and other small Pacific Island States is the impact of cyclones that trigger emergency assistance for rehabilitation and the fact that the size of the economy is small and thus if just one major investment project starts implementation it will trigger significant disbursements relative to GDP during a period of 1-2 years. In Samoa, the peaks has been often due to disbursements for some major infrastructure investment projects in among others transport, water and sanitation, renewable energy and administrative buildings as well as General Budget Support (GBS).
In the case of Samoa, the level of concessionality of ODA financing is high as the major share of ODA funding are grants. The share of ODA funding is distributed with ODA grants at 84.3 percent while ODA loans 15.7 percent (2015), however, with significant variations year on year.
Fiji
Samoa
Paci�c islands small states
Lower mid dle income Solomon IslandsKiribati
Low income
6,000
GD
P pe
r cap
ita
5,000
4,000
3,000
2,000
1,000
100 200 300 400ODA per capita
500 600 700

19
3. MAPPING SAMOA’S FINANCE FLOWS
Figure 6: GDP per capita and ODA per capita 2015 in USD.
Source: MoF and World Bank
The figure below displays comparisons of revenue projections, budget allocations and ODA commitments to actual levels. Variation in actual ODA disbursement compared to commitments has been significant over the years. This may be due to different factors.
As mentioned, changes in donor priorities and domestic policies may change the actual commitments made prior to the budget year. Changes in aid modalities may make aid more or less predictable. Delays by development partners in timely sharing of their commitments is also claimed by GoS to be an issue to include these resources in its budgeting and planning process. External factors like cyclones may trigger extraordinary levels of aid in the form of emergency assistance. Changes in GoS planning and budgeting taking into account external resources may improve over time making budget forecasts including aid more predictable. Absorptive capacity to execute ODA funded projects may change over time triggered by changes in domestic execution capacity and changes in modalities of ODA finance (from discrete project tied aid to program aid/budget support).
900
800
700
600
500
400
300
200
100
25
20
15
10
5
2006 2007 2008 2009 2010 2011 2012 2013 2014 2015
ODA shareof GNI
ODA percapita

20
DEVELOPMENT FINANCE ASSESSMENT FOR SAMOA
Figure 7: Domestic revenue share of projections, domestic expenditure share of budget and ODA disbursements percent share of commitments, 2010 - 2015
Source: OECD DAC CRS
In the case of Samoa, the rate of ODA utilization has declined over the last years (ref. table 8 above showing a declining trend of ODA disbursements versus commitments. The cause of this change does not reflect the general predictability of the budget if using PEFA indicators, however, it serves to explain low absorptive capacity of planned investments as expenditures on investments continuously fall short of budget allocations for the same. Domestic revenue collection has for all years been within 10% of projection and actual domestic funded expenditures within 15% of the budget during 2010 – 2015. Since ODA constitutes a major share of GoS capital expenditures (approx. an average of 47 percent during the same period), the predictability of ODA disbursements impact on the predictability of capital expenditure, or put differently, ODA funded actual expenditures fall significantly short of planned investments.
250%
200%
150%
100%
50%
02010 2011 2012 2013 2014 2015
Disbursements share of commitments
Actual revenue share of projections
Actual expenditures share of budget

21
3. MAPPING SAMOA’S FINANCE FLOWS
Figure 8: Government capital expenditures as share of total expenditures and ODA share of Government capital expenditures, 2011/12 – 2016/17
Source: MoF and World Bank.
The scenarios from World Bank10 projections of financing needs for Pacific Island States (PICs) development suggest that there will be a continued need for aid across the Pacific over the next 25 years. Most PICs already face risks of debt distress and thus have limited opportunities for additional debt finance. On the other hand, as per the scenario analysis, the baseline projections reflect an expectation that current levels of aid to the PICs will not persist over the longer-term. In the case of Samoa, it is already at an ODA level exceeding the average of PICs and LMICs, the latter setting limits on level of concessionality by some sources.
However, as the above analysis shows, there is scope to improve predictability and efficiency of aid from current sources. While there have been some attempts to shift towards program aid/budget support whereby aid is disbursed to the Treasury based on result triggers (untied to expenditures) rather than input-based financing, it will require changes in planning and budgeting processes if the majority of aid is to feature on budget and managed through the regular release process of budget allocations for the GoS. It will require adjustments to the current planning and budgeting system of the GoS, an issue discussed in more detail in sections below.
10 “Financing Pacific Governments for Pacific Development”, World Bank, 2016.
70%
60%
50%
40%
30%
20%
10%
0%
FY20
11/2
012
FY20
12/2
013
FY20
13/2
014
FY20
14/2
015
FY20
15/2
016
FY20
16/2
017
ODA share of capital expenditures
Capital share of total expenditures

22
DEVELOPMENT FINANCE ASSESSMENT FOR SAMOA
3.3 Global concessional funds Only a few global and regional ODA funds serve as a source of finance for development in Samoa. However, in total they accounted for 9.8 percent of total ODA to GoS in 2015. The funding is dominated by one major source, the Global Environment Facility (GEF) and recently Green Climate Fund (GCF) which accounted for 86 percent of the total funding from these sources.
Figure 9: Distribution of global concessional funds by source
Source: MoF and OECD/DAC
The South Pacific Applied Geoscience Commission (SOPAC), an agency which since 2010 is under the Secretariat of the Pacific Community (SPC), has served as a source of funding for climate resilience awareness and water/sanitation programs. The International Union for Conservation of Nature (IUCN) has been financing projects for water conservation and training and awareness in energy efficiency for greenhouse gas abatement. In addition, Samoa was provided funding from the Global Fund to Fight AIDS, Tuberculosis and Malaria (GFTAM frequently referred to as only “The Global Fund”). The funding was provided to the SPC from which Samoa received funding for interventions against HIV/AIDS and TB. In addition to the above, the Adaptation Fund under the United Nations Framework Convention on Climate Change (UNFCCC) has been channeling funds through UNDP for climate resilience interventions. Also other global funds/programs are managed through the UN agencies, most notably UNDP, of which several targeting climate resilience/environment.
According to the Climate Funds Update,11 Asia has received the most international climate finance to date, largely for mitigation activities. China and India both receive and spend the largest amount of climate finance globally, whereas the region’s most vulnerable countries, particularly the small Pacific Island states, in general receive little to no funding.
11 The Climate Funds Update is a joint initiative of the Heinrich Böll Stiftung (HBS) and the Overseas Development Institute (ODI). It monitors dedicated climate change funds from the stage when donors pledge funding, through to the actual disbursement of financing for projects.
IUCN 7%
SOPAC 6%
GEF 86%
SPC 1%

23
3. MAPPING SAMOA’S FINANCE FLOWS
The Multilateral Development Banks, led by the World Bank Group and the Asian Development Bank, and acting mainly through the Climate Investment Funds and the Global Environmental Facility, are major players in the delivery of climate finance in the region. The multilaterals partners are also the main financiers of major development infrastructural projects in sectors such as infrastructure/transport, agriculture, health, education and energy.
Japan, Australia, New Zealand, European Union, China and the USA are also active through bilateral channels where funding assistance is mainly for smaller scale programs in the social sectors and smaller allocations for infrastructure programs to address “Aid for Trade” initiatives.
Compared to other Pacific Island States, Samoa has been able to access several of the global and regional concessional funding they are eligible for and is at the forefront in accessing climate funds. However, the interventions financed by these funding sources remain to a large extent fragmented and managed though standalone projects rather than wider sector program interventions.
While the menu of concessional funds that Samoa is eligible for has been reduced after graduating to LMIC status, it still enjoys concessional funds that make exemptions for small economies with limitation in economy of scale. On the other hand, as an LMIC country, Samoa has yet to pursue blended funds targeting middle income countries and emerging markets. Several of these funds promote private sector participation in a range of sectors like renewable energy, transport and communication.
Blended funds with private sector participation
The Global Energy Efficiency and Renewable Energy Fund (GEEREF) is a Public-Private Partnership (PPP), designed to maximize the private finance leveraged through public funds, funded by the European Commission and managed by the European Investment Bank. GEEREF is structured as a fund of funds and invests in private equity sub-funds that specialize in financing small and medium-sized project developers and enterprises to implement energy efficiency and renewable energy projects in developing countries and economies in transition. While a small market Samoa under the umbrella of cooperation among the Pacific Island States could consider similar fund management arrangements ref. the current GEEREF portfolio of several regional/country level blended funds http://geeref.com/portfolio.
3.4 Other Official Flows (OOF)12 Samoa is a destination for Other Official Flows (OOF) from non-OECD countries like Australia but at a very low level compared to many other LMICs. In total OOF has only added another 0.2 – 1 percent over and above ODA contributions during the last years as shown in the figure below. The extent to which this source of funding can be increased depends on the capacity of the GoS to plan and execute added investments (ref. the observation related to GoS capacity to fully utilize ODA commitments discussed in sections above).
12 Other Official Flows (OOF) are defined as official sector transactions that do not meet Official Development Assistance (ODA) criteria. Official Development Assistance (ODA) is defined as government aid designed to promote the economic development and welfare of developing countries. ODA may be provided bilaterally, from donor to recipient, or channelled through a multilateral development agency such as the United Nations or the World Bank. ODA includes grants, ”soft” loans (where the grant element is at least 25% of the total) and the provision of technical assistance.
24
DEVELOPMENT FINANCE ASSESSMENT FOR SAMOA
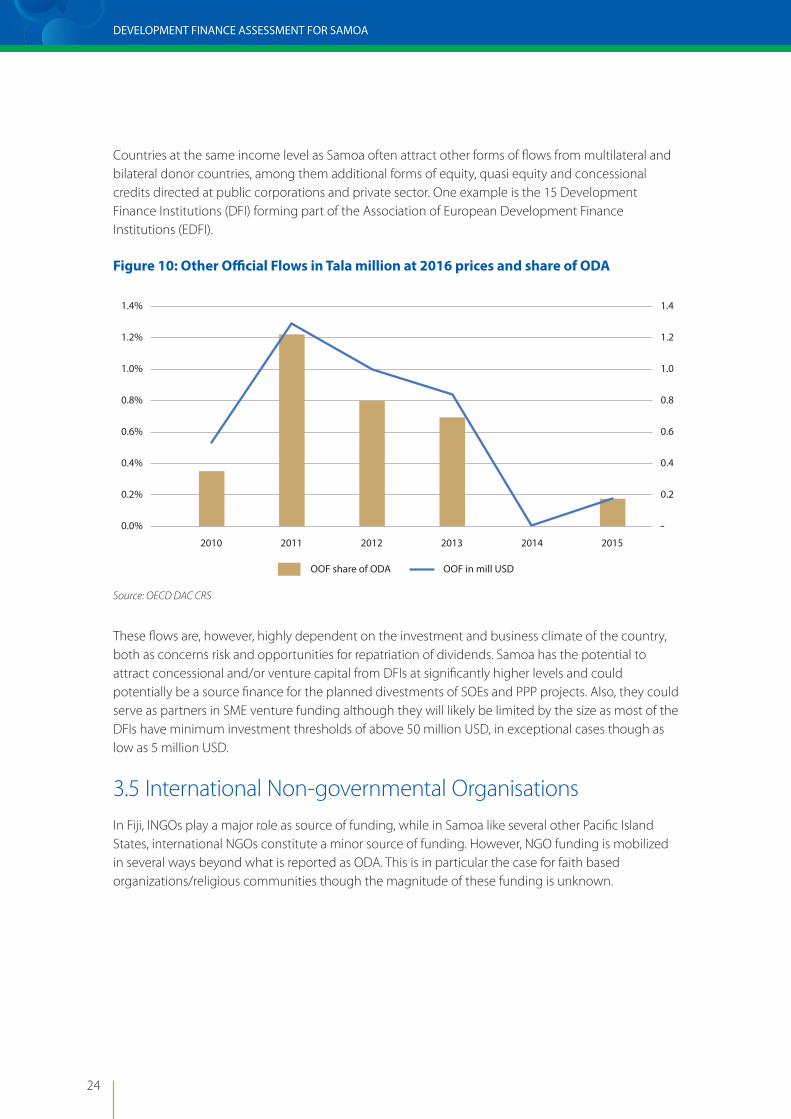
Countries at the same income level as Samoa often attract other forms of flows from multilateral and bilateral donor countries, among them additional forms of equity, quasi equity and concessional credits directed at public corporations and private sector. One example is the 15 Development Finance Institutions (DFI) forming part of the Association of European Development Finance Institutions (EDFI).
Figure 10: Other Official Flows in Tala million at 2016 prices and share of ODA
Source: OECD DAC CRS
These flows are, however, highly dependent on the investment and business climate of the country, both as concerns risk and opportunities for repatriation of dividends. Samoa has the potential to attract concessional and/or venture capital from DFIs at significantly higher levels and could potentially be a source finance for the planned divestments of SOEs and PPP projects. Also, they could serve as partners in SME venture funding although they will likely be limited by the size as most of the DFIs have minimum investment thresholds of above 50 million USD, in exceptional cases though as low as 5 million USD.
3.5 International Non-governmental OrganisationsIn Fiji, INGOs play a major role as source of funding, while in Samoa like several other Pacific Island States, international NGOs constitute a minor source of funding. However, NGO funding is mobilized in several ways beyond what is reported as ODA. This is in particular the case for faith based organizations/religious communities though the magnitude of these funding is unknown.
1.4%
1.2%
1.0%
0.8%
0.6%
0.4%
0.2%
0.0%
1.4
1.2
1.0
0.8
0.6
0.4
0.2
2010 2011 2012 2013 2014 2015
OOF share of ODA OOF in mill USD

25
3. MAPPING SAMOA’S FINANCE FLOWS
Figure 11: NGO share of total official development assistance
Source: OECD/DAC CRS
The main sectors of focus for ODA through NGOs are education and health services. They also have played a significant role in climate resilience interventions and community type awareness programs. The GoS has also proactively involved national NGOs, some with funding from INGOs, in public sector interventions and service delivery.
Figure 12: Official development assistance through NGOs by sector, share of total 2011–2015
Source: OECD/DAC CRS
25%
20%
15%
10%
5%
0%
2011 2012 2013 2014 2015
Fiji Kiribati Samoa Solomon Islands
Economic Infrastructure &
Services
Production Sectors
Multi-Sector
Humanitarian Aid
10%
5%
10%
9%
66%Social sectors

26
DEVELOPMENT FINANCE ASSESSMENT FOR SAMOA
SUNGO is a national network in Samoa of Civil Society Organizations that has Non-Governmental Organizations (NGOs), Community Based Organizations (CBOs), Civil Society Organizations (CSOs), Faith Based Organizations (FBOs) and Trusts among its 193 members. Their funding is provided, among other sources, through the Samoa Civil Society Support Programme (CSSP). CSSP is a multi-donor supported program administered by the MoF for the benefit of community projects which aims to strengthen civil society groups to better serve their communities and target populations by providing funding support and capacity building assistance.
Scaling up further NGO engagement through outsourcing in the form of service or management agreements can potentially attract additional funding from their international NGO partners. NGOs have access to other allocations of donor aid budgets targeting NGOs. This approach could accordingly raise additional equity financed from INGOs that many of the SUNGO members have or could mobilize as partners and can serve as an added source of finance.
3.6 Government borrowingSamoa has increased its debt stock significantly over the last years. The public debt to GDP ratio was 52.5 percent of GDP in 2016 and debt service requirements will increase in 2017/18 to 2.7 percent of GDP. Most of the debt financing is on concessional terms thus restructuring of debt to better concessional terms is limited. Accordingly, rather than considering increased debt finance for public investments, continued efforts are needed to reduce the public-sector debt to mitigate the vulnerabilities that may cause needs for exceptional finance from, among others, natural disasters.
Figure 13: Public Sector Debt as percent of GDP
Source: CBS and World Bank
0
10
20
30
40
50
60
70
2005 2006 2007 2008 2009 2010 2011 2012 2013 2014 2015 2016

27
3. MAPPING SAMOA’S FINANCE FLOWS
Samoa has developed a Medium-Term Debt Strategy (MTDS), including a minimum 35 percent concessional component for new borrowing. It among others, assumes a medium-term target of public debt to GDP ratio of 40 percent as a level that will reduce the risk of debt distress and increase space for fiscal responses to emerging needs. As mentioned in sections above, the concessionality level of ODA financing including debt financing is already at a high level. Thus, the main focus will be on reducing overall debt stock with less possibility to switch further to debt with even higher grant element.
3.7 Private sector equity and credit Availability and cost of equity (returns) and credit (interest) is a key driver for private sector investments. In Samoa, gross fixed capital formation is almost equally distributed between public and
Figure 14: Gross fixed capital formation in Tala million at 2016 prices
Source: MoF, SBS and DFA team estimates
Private sector faces some specific additional challenges in Samoa related to access to credit. The World Bank “Ease of Doing Business Index” ranks countries against each other based on how the environment is conducive to business operations. The higher the rank the better conditions are for business formation and operations.
Total share of GDP
Public sector
Private sector
-
20
40
60
80
100
120
140
160
180
200
0%
5%
10%
15%
20%
25%
30%
2010
/201
1
2011
/201
2
2012
/201
3
2013
/201
4
2014
/201
5
2015
/201
6

28
DEVELOPMENT FINANCE ASSESSMENT FOR SAMOA
Figure 15: World Bank Doing Business rating Samoa and Pacific Island States
Source: World Bank
Comparing the 2017 Doing Business rating for Samoa with the average of the Pacific Island States, one dimension in particular gives Samoa a lower score than the PIC in total; namely access to credit (ref. Figure 15 above).
Access to credit is a major driver for financing of new investments and allows people to purchase assets. Excessive lending and borrowing creates monetary risks while credit availability promotes economic development. If domestic credit to the private sector is 70 – 100% of GDP, a country is considered to have a relatively well developed financial system. The amount of credit even exceeds 200% of GDP in some advanced economies. In some countries, domestic credit is less than 15% of GDP, i.e. firms and households essentially do not have access to credit for investment and purchase of assets.
The financial sector in Samoa is small, concentrated and undiversified. There are four commercial banks of which two are locally incorporated foreign companies, and two are domestic companies. The local banks are Samoa Commercial Bank (SCB) and the National Bank of Samoa (NBS). Locally incorporated, international banks are ANZ Samoa and Bank of South Pacific (BSP formerly Westpac Bank). ANZ bank is the market leader, holding over 40% of the market share followed by BSP with about 30%. Commercial banks provide conventional financial services to the public, such as savings and checking accounts, money transfers, credit and debit cards, and loans.
Starting a business
Dealing with construction permits
Getting electricity
Registering property
Getting credit
Protecting minority investors
Paying taxes
Enforcing contracts
Resolving insolvency
0
50
100
Samoa
Paci�c Islands (average)
Trading across borders

29
3. MAPPING SAMOA’S FINANCE FLOWS
Figure 16: Bank credit in Tala million at 2016 prices and share of GDP
Source: CBS
In addition to the commercial banks, state-owned financial institutions also play a significant role in providing a wide variety of financial services that are similar to the services provided by commercial banks and other private sector providers. State-owned financial institutions are Samoa National Provident Fund (SNPF), Development Bank of Samoa (DBS), Samoa Housing Corporation (SHC), Accident Compensation Corporation (ACC) and Unit Trust of Samoa (UTOS).
While the four commercial banks provide almost 60 percent of credit to the economy, the most important state-owned financial institutions are the Samoa National Provident Fund and the Development Bank of Samoa which account for around 30 percent.
Figure 17: Interest spreads (lending rate minus deposit rate) in percent.
Sources: IMF 2017 Article IV Consultation
% of GDP
Tala million
0%
10%
20%
30%
40%
50%
60%
70%
80%
90%
-
200
400
600
800
1,000
1,200
2006 2007 2008 2009 2010 2011 2012 2013 2014 2015 2016
SamoaPaci�c Islands (average)
5
6
7
8
9
10
2010 2011 2012 2013 2014 2015 2016
30
DEVELOPMENT FINANCE ASSESSMENT FOR SAMOA
The lack of collateral and active security markets has posed continued constraints for growth in bank credit to private sector in Samoa. Despite this, it has grown steadily over the years and exceeded 70% of GDP by end of 2016. Part of the explanation is that Samoa strengthened access to credit with the implementation of the Personal Property Securities Act and by establishing a collateral registry to register all types of charges and functional equivalents. Another may be the slight decline in the cost of credit with the reduced spread between savings and credit interest rates.
Mobile money services are on the rise in Samoa and has the potential to reduce transaction cost of financial services significantly. Currently, several financial institutions offer mobile banking in Samoa. Two banks (ANZ and BSP) offer branchless banking services. ANZ Samoa offers “Go Money”, a mobile banking service, that allows registered users to make deposits, withdrawals, pay bills, check their balance, transfer funds to another registered user (Person to Person), and top-up mobile phone credits. ANZ is considering other purchases to be included into their Go Money payments. The move is aligned with the business strategy to migrate mass customers to digital platforms.
Despite the service functionality, the use of the service remains at low levels due to several factors of which Samoa is basically a cash economy and there is lack of awareness of the product among customers. According to a recent survey of banking practices of individuals, only 39% of Samoan adults have a bank account, only 12% use other formal services such as credit unions, microfinance, insurance, or finance companies and 34% are excluded from both formal and informal financial services. Accordingly, the potential for outreach of mobile banking is significant.
There is a small number of specialized private sector financial services providers that mainly provide microfinance such as South Pacific Business Development (SPBD) and credit unions such as the teacher’s credit union providing some financial services to their members. In addition, a few NGOs provide financial and/or business services to small and micro enterprises. These are Small Business Enterprise Centre (SBEC) and Women in Business Development Inc. (WIBDI). NGOs mainly channel donor-funded government programs, such as the Private Sector Support Facility (PSSF) and the Civil Society Support Program (CSSP) to their beneficiaries.
The Central Bank of Samoa continues to extend its Credit Line Facility to non-monetary financial institutions, namely the Development Bank of Samoa and the Samoa Housing Corporation, as a means of injecting liquidity into Samoa’s main priority sectors such as tourism, agriculture and fisheries, manufacturing and housing. Approximately 40% of SNPF investments is lending to its members and 20% lending to the public through SPBD as well as to the government and state-owned enterprises.
Despite the recent growth of the financial sector and several attempts to bring in innovative business solutions, the menu of financial services offered to the public remains limited and inaccessible to the low-income groups and SMEs, particularly those in rural areas. Services such as transactions, saving accounts and bill payments are mostly available in the urban areas. Despite a growing number of ATMs and new initiatives such as in-store merchants and mobile banking, there is still significant space to improve access to financial services.
Credit and micro/SME finance comprise a very small percentage of the total services offered by commercial banks in Samoa, mainly because of a perceived high risk and the lack of available collateral. A large percentage of credit, particularly loans provided by commercial banks is directed

31
3. MAPPING SAMOA’S FINANCE FLOWS
towards construction and infrastructure, followed by trade and business services. Manufacturing, agriculture, forestry and fishery combined only receive about 5% of total loans provided.
As commercial banks refrain from providing micro and SME credit, this service is mainly provided by an array of multipurpose NGOs, credit unions and specialized microfinance organizations. Credit unions, however, lend only to their members and most of their loans are targeted for consumption. This in the case of Samoa, it’s a potential to scale up access to finance, in particular for micro/SMEs they will require added public sector subventions to achieve economy of scale.
Potential to scaleup Micro and SME funding through existing delivery systems
The Small Business Enterprise Centre (SBEC) offers loan guarantees for up to 50,000 Tala on commercial interest rates to all entrepreneurs. It guarantees 100% of loans up to 10,000 Tala and 80% of loans up to 50,000 Tala. By end 2015, SBEC had supported close to 2,000 small businesses through these arrangements. It is funded by ODA from the Government of New Zealand and the Government of Samoa. The backend guarantee is provided by the New Zealand support as well as Government of Samoa through a loan from ADB as part of their Private Sector Development Initiative. In addition to their financial services, they also provide non-financial services in the form of training in business administration.
Women in Business Development Incorporated (WIBDI) is a NGO that provides support to village families who have small, mainly agricultural businesses. It supports a range of community-based projects aimed at alleviating poverty, creating sustainable village economies and revitalizing the agricultural sector. They have outreach to more than 100 rural villages across Samoa. However, as a multi-purpose NGO they are heavily dependent on donor funds which limits their supply capacity.
SPBD is the only licensed microfinance institution. It has outreach to 8,000 clients in 330 villages in Samoa covering over 90% of rural areas. It offers a range of microfinance services, including credit-linked life insurance and education linked credit. As of end 2015, it had it had a total loan portfolio of approximately 7.5 million Tala and 1,000,000 Tala in client deposits. SPBD also offers savings services to its customers and with over 20,000 savings accounts, SPBD has many more savers than borrowers. It offers a market rate of interest with added benefit of deposit collections done in the villages through its Client Centers.
There are several private finance companies offering retail credit at varying interest rate. The usual borrowers are those who are unable to meet the conditions to qualify for a loan from the formal banking sector. The finance company may be a group of persons pooling personal savings to finance a portfolio of small personal loans or a larger organization, incorporated to do extend credits to businesses. Since these are not regulated by the Central Bank of Samoa, the performance data is not available. It is estimated that interest rate is in the range of 12-24%.
Samoa has developed a national financial inclusion strategy in response to lack of coordination as the prime factor needing the attention of government policy makers13. According to survey results presented in the strategy 39% of Samoan adults currently have a bank account, while 12% have access to other formal services. The remaining 49% are not included in the formal financial sector. While the proportion of financially included adults in Samoa is comparable to that of other
13 The National Financial Inclusion Strategy 2017-2020 (NFIS).

32
DEVELOPMENT FINANCE ASSESSMENT FOR SAMOA
lower-middle-income countries as per the World Bank Global Financial Inclusion Index, financial inclusion levels, in the region, vary widely with Samoa having the largest number of adults being entirely excluded from both formal and informal financial services.
Various service providers are trying to expand the market share through several innovative approaches, like agent network and mobile banking. However, due to the lack of coordination and competition, they are not sharing the basic infrastructure, which could benefit everyone. Likewise, there has been no national coordination platform for stakeholders to share and discuss ideas for improved financial access and usage. It could likely serve to promote infrastructure sharing among service providers.
The above mentioned National Financial Inclusion Strategy calls for a multidimensional response including among others broadening of financial services, a move to digitalized solutions and client education through the education system.
Promoting private sector development is also linked to the marked access and opportunities of private sector vis a vis public sector entities. The portfolio of Samoa’s state-owned enterprises is sizable, with assets estimated at approximately 60 percent of GDP. Many have displayed challenging financial performance and in total their estimated total contribution to GDP was just 3 percent. There are 15 SOEs engaged in a diverse range of activities, including transport, utilities, subsidized housing, postal services, banking, land development, and trustee services. A comprehensive SOE Act was adopted in 2012 and there is an overarching reform and divestment strategy calling for privatization of all nonstrategic SOEs.
Figure 18: State owned enterprises return on assets and equity (percent), FY2002 – FY2014
Return of EquityReturn on Assets
-5
-4
-3
-2
-1
0
1
2
3
4
2002 2003 2004 2005 2006 2007 2008 2009 2010 2011 2012 2012 2014
Sources: Government of Samoa, State-Owned Enterprise Monitoring Unit, Ministry of Finance and IMF 2017 Article IV Consultation.

33
3. MAPPING SAMOA’S FINANCE FLOWS
In January 2015, the cabinet approved a new SOE Ownership, Performance and Divestment Policy, committing to privatizing commercial SOEs. With the enactment of the Competition and Consumer Act in 2016 it requires ministers to consider the competitive impact of their decisions on the provision of goods and services by SOEs. It will encourage the competitive tendering of government contracts for private sector, restrict subsidies to SOEs, and deter anticompetitive collusion and abuse of market power. Building on the reforms already introduced this could potentially have a positive impact on SOE performance.
As mentioned above, access and cost of credit as well as limited financial innovation remain impediments to private sector investment and growth. There are some recommendations that could potentially address the above constraints. There is scope for entry of venture funds in Samoa to foster competitiveness and increase outreach, given the gap in access to finance and business development services. Furthermore, in many countries like Samoa, access to finance is one among other constraints; for example, access on concessional (grant) terms to business development and advisory services to develop their business and lines of production has proven equally important as also evident by the demand for services from SBEC and WIBDI.
Scaling up their services and encouraging additional competing and innovate arrangements of a similar nature will require GoS financing as initial subversion of green operations and start-ups. In some countries these forms of financial services are structured as Challenge Funds or Venture Capital Funds subcontracted to private management companies which combines financial and non-financial services (similar to services provided by SBEC but fully on commercial terms after receiving initial concessional funding from government).
In addition, governments finance business development services outsourced to private sector management companies on a competitive basis who in turn promote start-ups with a dedication for putting their business into practice by servicing them at a small user charge. In some countries, governments also take the lead in building infrastructure to form business incubators and promote product and market innovation.

34
DEVELOPMENT FINANCE ASSESSMENT FOR SAMOA
Challenge and venture capital funds as means of promoting new business entries
Challenge Funds for promoting SME development and investments
A challenge fund is a competitive financing facility to disburse funding for development projects, typically utilizing public sector or private foundation funds for market-based or incentive driven solutions. Typically, a challenge fund uses competition to find solutions to problems in areas related to a development objective.
Small and medium-sized enterprises, organizations, institutions and individuals compete by submitting their project proposals. While they have to meet predetermined and fixed criteria, the applicants have freedom in the design of their solution. The winning proposals are supported financially and matched by own equity or contributions. An illustration of a funding arrangement that could be considered for Samoa is the Africa Enterprise Challenge Fund (AECF). AECF supports businesses in agriculture, agribusiness, rural financial services and communications systems, renewable energy and adaptations to combat climate change. The AECF provides catalytic funding in the form of repayable and non-repayable grants to businesses that would not otherwise have access to adequate financing. The AECF is part of the Alliance for Green Revolution in Africa (AGRA) and has been supported by the governments of Australia, Canada, Denmark, the Netherlands, Sweden and the United Kingdom, and international financial institutions such as the Consultative Group to Assist the Poor and IFAD.
Venture capital leveraging domestic finance to promote SME growth and employment
Venture capital for small and medium-sized enterprises (SMEs) typically provides risk capital and technical assistance to entrepreneurs and fund managers in challenging markets. SMEs in countries like Samoa have the potential to drive job creation and economic growth but they have limited access to the capital they need. They are typically too large to be served by micro-finance institutions, yet too small to be served by commercial banks. They also face other challenges, such as a lack of management skills or industry knowledge.
Venture capital funds and programs in countries at the same income level as Samoa provide entrepreneurs with risk capital such as equity, loans, and quasi-loans combined with technical assistance. By investing in SME firms, that have served to expand their businesses which in turn create a significant number of jobs. SME venture programs also provide support to fund managers as they establish themselves in these markets. On a wider economic level, some of the SME venture programs have paved the way for other private equity firms to enter these markets. This has happened by supporting needed changes in the regulatory environment to make it more conducive to private equity investments.

35
3. MAPPING SAMOA’S FINANCE FLOWS
3.8 Foreign Direct InvestmentForeign Direct Investment (FDI) is defined as the ownership of production facilities in a foreign country. To be classified as FDI, a foreign investor has to own at least 10% of a local company. If the ownership is less than 10% of the value of the local company, the investment is classified as portfolio investment.14 The investment could have originated as a greenfield investment, as an acquisition or as a joint venture (joint ownership with a local company).
When foreign companies start operations they hire people, especially if the investment is greenfield, i.e. if a new facility is created and/or if the production is more labor intensive. Often, local companies become suppliers to a large new foreign investor and this increases employment, which contributes to more value added through the entire value chain.
FDI also frequently leads to development or entry of new technologies and management practices. The training of local personnel will after some years lead to new business, due to knowledge transfer from the international partners to national counterparts and employees that subsequently start up new domestic companies based on training and acquiring new knowledge. Foreign companies also have established channels for placing their output on international markets.
Figure 19: Foreign Direct Investment share of GDP – country levels and region/group averages
Source: World Bank
14 OECD. “OECD Benchmark Definition of Foreign Direct Investment.” Fourth Edition. (2008).
-10
-5
0
5
10
15
20
25
30
Fiji
Kiribati
Low income
Lower middle income
Paci�c island small states
Solomon Islands
Samoa2009 2013 2014 201520112010 2012
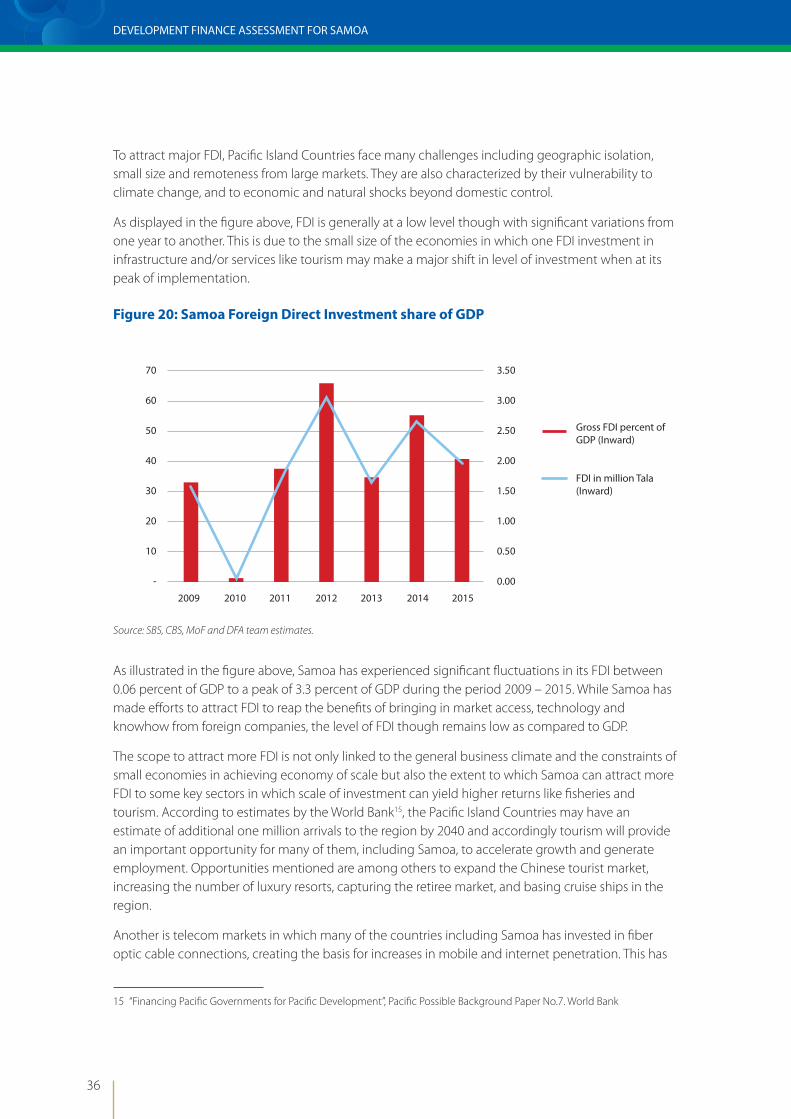
36
DEVELOPMENT FINANCE ASSESSMENT FOR SAMOA
To attract major FDI, Pacific Island Countries face many challenges including geographic isolation, small size and remoteness from large markets. They are also characterized by their vulnerability to climate change, and to economic and natural shocks beyond domestic control.
As displayed in the figure above, FDI is generally at a low level though with significant variations from one year to another. This is due to the small size of the economies in which one FDI investment in infrastructure and/or services like tourism may make a major shift in level of investment when at its peak of implementation.
Figure 20: Samoa Foreign Direct Investment share of GDP
Source: SBS, CBS, MoF and DFA team estimates.
As illustrated in the figure above, Samoa has experienced significant fluctuations in its FDI between 0.06 percent of GDP to a peak of 3.3 percent of GDP during the period 2009 – 2015. While Samoa has made efforts to attract FDI to reap the benefits of bringing in market access, technology and knowhow from foreign companies, the level of FDI though remains low as compared to GDP.
The scope to attract more FDI is not only linked to the general business climate and the constraints of small economies in achieving economy of scale but also the extent to which Samoa can attract more FDI to some key sectors in which scale of investment can yield higher returns like fisheries and tourism. According to estimates by the World Bank15, the Pacific Island Countries may have an estimate of additional one million arrivals to the region by 2040 and accordingly tourism will provide an important opportunity for many of them, including Samoa, to accelerate growth and generate employment. Opportunities mentioned are among others to expand the Chinese tourist market, increasing the number of luxury resorts, capturing the retiree market, and basing cruise ships in the region.
Another is telecom markets in which many of the countries including Samoa has invested in fiber optic cable connections, creating the basis for increases in mobile and internet penetration. This has
15 “Financing Pacific Governments for Pacific Development”, Pacific Possible Background Paper No.7. World Bank
Gross FDI percent of GDP (Inward)
FDI in million Tala (Inward)
-
10
20
30
40
50
60
70
2009 2010 2011 2012 2013 2014 2015
0.00
0.50
1.00
1.50
2.00
2.50
3.00
3.50
37
3. MAPPING SAMOA’S FINANCE FLOWS
the potential to enhance productivity, enhance the quality and attractiveness of existing activities and create new market opportunities enhancing the business climate also for FDI. Fisheries and marine harvesting is also mentioned as a sector with a potential to attract significant additional investments, both harvesting and land-based processing with introduction of new technologies among others for fish farming and sea mining.
The plan to promote new PPP arrangements linked to SOEs can likely also attract some FDI to bring in technology and management for improved productivity and profitability.
3.9 Public-Private PartnershipsPublic-Private Partnerships (PPPs) are used across a wide range of economic sectors in many countries in the Asia-Pacific region. However, given the relatively small size of the Pacific Island economies and the dominance of the public sector, many of them have limited experience with PPPs.
In Samoa, however, there are several examples of successful PPP arrangements from contracting of private entities for road construction and maintenance to restructuring of airline, strengthening public-private partnerships for the routine maintenance of the urban drainage network and the recent investment in the Tui Samoa Submarine Cable operated by the Samoa Submarine Cable Company, a partnership between Government and SOEs. From a DFA perspective PPPs are seen as a way to raise added private domestic and international equity and debt finance for public service delivery.
There are no data available to assess the additional equity and debt finance raised by PPP arrangements in Samoa. However, the above examples of PPP arrangements have led to efficiency gains and turning subsidized SOE service delivery (cost) into profitable joint venture or outsourced service delivery with tax and dividends for the GoS (benefit). There are many additional areas today dominated by SOEs and/or public-sector agencies that could potentially be promoted through new PPP arrangements in additional sectors through management and/or service agreements or Build Operate Transfer arrangements.
Establishing a Ministry for Public Enterprises (MPE) in 2016 was a major step in implementing the “Framework for the planning and implementation of the Public Private Partnerships in Samoa” approved by the Cabinet in 2014. MPE has subsequently published a “Public Private Partnership Handbook”16. This is a tool which may serve to guide government agencies in forming PPP arrangements for increased service delivery and in MPEs corporate plan17 for 2017 – 2020 some new PPP arrangements has been targeted for among others the Land Transport Authority (LTA), Samoa Ports Authority (SPA) and Samoa Airport Authority (SAA). The enactment of the Competition and Consumer Act in 2016 will encourage the competitive tendering of government contracts for private sector and subsequently promote more competitive arrangements including PPP arrangements.
Compilation and publication of data on the equity and debt finance raised for the various PPP contracts as well as annual performance reports (similar to what MPE produces already for the SOEs) should be considered to make more informed decisions on the costs and benefits of PPP arrangements current and future PPP arrangements as PPP.
16 Public Private Partnership Handbook”, Ministry for Public Enterprises, March 2017
17 “Corporate Plan 2017 – 2020 for the Ministry for Public Enterprises”, Ministry for Public Enterprises, March 2017.

38
DEVELOPMENT FINANCE ASSESSMENT FOR SAMOA
3.10 RemittancesOver the last decade, remittances from abroad to the Samoan economy have been fluctuating around 20 percent of GDP. In 2015 remittances was 16.3 percent of GDP. It’s significantly higher than the LMIC and Pacific Island states averages. Since New Zealand and Australia are the main migration destinations for Samoa, these two countries, together, account for nearly 75 percent of the total remittances, followed by 15 percent from the USA.
Figure 21: Remittances share of GDP
Source: World Bank
The main recipients of remittances in Samoa are individuals and families as well as non-profit institutions such as churches, NGOs and charities. The significance of workers remittances to the economy makes money transfer an essential financial service, especially for low-income groups. It is estimated that only 15 – 25 percent of remittances are transferred through commercial banks, and nearly 75 percent are sent through non-banking Money Transfers Operators (MTOs). A total of 14 Money Transfer Operators/Restricted Foreign Exchange Dealers and one Money Changer are registered in Samoa, however, survey based information suggests that many more operate unregistered.
While remittances play an important role in financing household investments and spending, less is used for savings and/or investment in productive assets. If addressing the challenges related to business climate and entry of new financial intermediaries and instruments in the financial sector, remittances can play a significant role as an additional source of finance for development purposes.
2006 2007 2008 2009 2010 2011 2012 2013 2014 2015-
5
10
15
20
25
Samoa
Fiji
Kiribati
Solomon Islands
Low income
Lower middle income
Paci�c island small states

39
4. POLICY AND INSTITUTIONAL ASSESSMENT
4. Policy and Institutional Assessment
4.1 Policy coherence and vision for resultsThis chapter is using the INFF as an analytical framework to address different dimensions on how Samoa can use existing access to finance more efficiently and opportunities to access additional sources of finance for development.
This section will first assess the coherence between the National Plan and the SDG goals and targets and secondly assess the current institutional framework in terms of how effectively and efficiently they implement these plans by specifically looking at planning, budgeting and monitoring progress against set goals and targets.
The Samoa Development Strategy (SDS) is the national policy and planning document detailing the government’s priority plans for Samoa. It focuses on four key priority areas: Economic, Social, Infrastructure and Environment. From these key priority areas, the sector plans are formulated and subsequently the ministry/agency corporate plans. The current Strategy for the Development of Samoa (SDS) 2016-2020 is based on a long-term vision of “Accelerating Sustainable Development and Broadening Opportunities for All” to be realized when the 14 key policy outcomes/targets are achieved.
SDS Key Policy Outcomes/Targets
1. Macroeconomic Resilience Increased and Sustained
2. Agriculture and Fisheries Productivity Increased
3. Export Products Increased
4. Tourism Development and Performance Improved
5. Participation of Private Sector in Development Enhanced
6. A Healthy Samoa and Well-being Promoted
7. Quality Education and Training Improved
8. Social Institutions Strengthened
9. Access to Clean water and Sanitation sustained
10. Transport System and Networks Improved
11. Improved and Affordable Country Wide ICT Connectivity
12. Quality Energy Supply
13. Environmental Resilience
14. Climate and Disaster Resilience

40
DEVELOPMENT FINANCE ASSESSMENT FOR SAMOA
The Government of Samoa is supportive of the SDG 2030 agenda. In the Mid Term Review of the last SDS, an Integrated Assessment of the SDS against the SDGs was carried out to indicate the level of alignment between the SDG and SDS targets. Changing the theme of the SDS from “An Improved Quality for Life for All” to “Accelerating Sustainable Development and Broadening Opportunities for All” reflected the government’s efforts to align the current national plan to the Sustainability theme of the Sustainable Development Goals. In addition, the Samoa Bureau of Statistics had provided key sector stakeholders with a list of SDG indicators to comment on their relevance to the national and sector plans indicators.
Generally, the SDS is aligned to SDG goals and targets. Specifically, for goals 1 to 6 and goal 10 since these were carried over from the Millennium Development Goals. The SDG goals may not exactly match word for word with an Outcome from the SDS but can be readily identified and linked to several Key Outcomes of the SDS that may all contribute to achieving a particular SDG. For example, SDG Goal Poverty can be linked to SDS Key Outcome 1, 2, and Key Outcomes 5 to 7. The SDG Goals of Hunger and Food security, Health, Education, Gender, Water and Sanitation, Infrastructure, Energy, Climate Action, Marine Resources, Land and Ecosystems and Governance are all linked to SDS Key Outcomes. Other SDG goals like Inequality, Cities, Sustainable Consumption and production, Global Partnerships and means to implementation will continue to be mainstreamed into the national development plan in the years ahead.
Whilst the SDGs and SDS are broadly aligned, there are a few areas that their linkages could be further strengthened. These include:
• Aligning SDS and SGDs timeframes to ensure there is some measure of success. As an example, the SDG may have an indicator to be completed 100% by 2030 and the SDS ending at 2020 for instance may have the same indicator with a target of 50% completion albeit under a slightly different heading.
• A clear standardized set of indicators and targets to be incorporated into both documents as illustrated above.
Aligning the SDS timeframe to the SDG timeframe will provide a better way to keep track of the progress. The current national plan will conclude in 2020 while the SDG targets are 2030. There are two 5-year timeframes in between 2020 and 2030 and the GoS may consider aligning the next two SDS to coincide with the end of the 2030 SDG Agenda or develop a longer-term perspective strategy setting the roadmap for SDGs at an aggregate level.
A key part of the ongoing Localization Project of SDG Goals is to ensure a clear set of standardized indicators and targets are incorporated into the Monitoring and Evaluation (M&E) Frameworks of both documents. This will facilitate the monitoring and evaluation process by removing the burden of dealing with two sets of M&E frameworks.
The SDG agenda faces more or less the same challenges as those identified in the MDG period. The key constraints for Samoa to deliver on the SDG agenda is the availability of resources both human and capital for implementation purposes, institutional and human capacities and availability of data such as baseline data to name a few for monitoring of progress against targets.

41
4. POLICY AND INSTITUTIONAL ASSESSMENT
There is a need to strengthen Development Partner coordination in Samoa because not only do they provide financial assistance through different disbursement modalities or arrangements but also capacity building through Institutional Strengthening Programs. Development Partners played a significant role in implementing programs targeted towards the achievement of MDGs. To date, Government is working closely with Development Partners to ensure the SDGs are structured in such a way as to reflect local priorities, hence the need for a more coordinated approach.
The Bureau of Statistics underwent an institutional strengthening program in 2011-2014 to strengthen its capacity to produce high quality data for policy and planning purposes. The 2030 SDG agenda is much bigger (than MDGs) with 17 goals and 169 targets and put more pressure on SBS to produce baseline data and analysis for tracking progress of SDGs.
Before the introduction of sector planning, the corporate plans and performance targets of government ministries were formulated directly from the SDS. However, reforms in the Public Finance Management saw the Sector plans accompanied by Medium Term Expenditure Frameworks (MTEF) with associated Monitoring & Evaluation Frameworks being gradually introduced into the planning framework. The rationale of an MTEF was to enhance the linkages between sector planning and the implementation of the plans specifically through the budgetary process.
4.2 Leadership and political buy-inGoS places great importance on using existing country processes, system and institutions for policy making, planning, execution and monitoring/evaluation. The existing institutional framework is supporting the GoS for its recently established National SDG Task Force responsible for the coordination and monitoring of the SDG agenda in Samoa.
The national SDG Task Force is chaired by Ministry of Foreign Affairs & Trade and two main members Ministry of Finance, Samoa Bureau of Statistics with representatives from key relevant line Ministries or sectors as well as representatives from private sector and civil society.

42
DEVELOPMENT FINANCE ASSESSMENT FOR SAMOA
Figure 22: Policy decision and planning framework in Samoa
The SDG Task force took the lead role in the integration of the SDG Goals to the SDS and making sure that they were relevant to Samoa’s development context. An integrated assessment of the SDS against the SDGs was conducted initially to provide an indication of the level of alignment between the two documents. This gave government the opportunity to further align the new and current SDS 2016-2020 and to contextualize the SDG Agenda to Samoa’s situation.
The main pillars of sustainable development in the SDS namely economic, environmental and climate change and social development already cover most of the 17 SDG Goals. The process by which the sustainable development goals were integrated into the Samoa’s current national plan priorities was through open inclusive consultative process, including all government levels and the public represented by civil societies and the private sector.
The Cabinet Development Committee (CDC) oversees the approval and monitoring of development projects that would achieve the national objectives specified in the SDS. However, the line ministries/agencies are responsible for the preparation of their respective sector plans and further identify, formulate and design projects that would achieve sector objectives and ultimately the SDS objectives. Line ministries are also responsible for the implementation of projects. MoF’s role as the secretariat for CDC is to appraise development projects before it is considered by the CDC and monitor approved and ongoing projects.
At the sector level, the sector plans have localized the SDG Goals and indicators to make it more relevant and aligned to sector priorities. The line ministries on the other hand understand the SDG agenda well but it is still not clear how their corporate plans are linked or reflect the SDG Goals. It has been noted that there are still gaps in the alignment of sector plans to line ministries’ corporate plans and consequently sectors may have a weak link to the budget process as the allocation of resources are based on the performance targets of the corporate plans for the line ministries.
Parliament
Cabinet
Cabinet Development Committee
Sector Lead Agency/ 14 Sectors
Government Ministries
National Plan – Samoa Development Strategy
Boards & Steering Committee/SDG
Task Force
Sector Plans

43
4. POLICY AND INSTITUTIONAL ASSESSMENT
Parliamentarians are also well informed on the importance of making SDG Goals part of Samoa’ development. However, there have been no specific debates and discussions on SDGs in parliament sessions or parliamentary committees. SDGs have been included in capacity building training workshops for parliamentarians
MoF is solely responsible for setting the fiscal policy stance, while the Central Bank of Samoa the monetary policy. Both institutions form the Macroeconomic Committee which set the macroeconomic policy framework and broad economic targets for Samoa. These broad macroeconomic targets provide guidance for the budget formulation every year.
4.3 Institutional coherence and management capacityThe government planning and budgeting system is the main instrument for ensuring an integrated approach to deliver on the SDS. The Planning and Budgeting Cycle is almost a full year event. The government budget follows a July-June fiscal year budget. The new budget preparations are developed around October of the new budget cycle once the actual Government Finance Statistics have been compiled for the previous fiscal year.
The mid-term budget review is undertaken in January and any adjustments are reflected in a Supplementary Budget. Whilst Supplementary Budgets are not encouraged, these have become a norm. In January of the following year preparation for the new budget commences with meetings held between the CBS and MOF (Macroeconomic Committee) to discuss the broad budget parameters. Potential revenue estimates are discussed in detail in the Revenue Board and any proposed changes are factored into the new budget estimates. Once this is finalized a budget ceiling (envelope) is estimated for each ministry and this is relayed to government ministries as part of their preparations for the new-year budget estimates.
The MOF maintains a robust economic model that is used to forecast broad budget parameters in relation to a given GDP and inflation forecast. In March, the following year, the MOF carries out budget screening with all government ministries and related corporations. The budget estimates are finalized usually after a second round of discussions with key revenue and expenditure ministries. The government has stated some key targets such as the level of deficit to GDP and external debt to GDP ratios. To address natural disasters and unforeseen expenditures, 3% of the budget is appropriated for this purpose. The government adopts a User Pay principal and this is reflected in the fees and charges levied by government ministries and corporations. However, government continues to subsidize key social services such as health and education.
Ministries are required to cost their services under an output structure accompanied by a performance statement. The outputs have stated indicators that measure “Quantity”, “Quality” and “Timeliness” for the delivery of these outputs. There is room for the GoS to improve the relevancy and quality of indicators used to measure stated budget outputs and to link these measures to the Sector Plans.
The main budget instruments at government disposal are tax and incentive measures used to direct public and private investments into areas that have been identified in the SDS and sector plans. The recent approval of tax reduction on electric cars is a good example of how the tariffs are used to reflect emerging GoS priorities such as renewable energy.

44
DEVELOPMENT FINANCE ASSESSMENT FOR SAMOA
The GoS also undertakes public borrowing on behalf of government corporations as government could access credit at lower interest rates. The GoS is committed to only undertake large borrowing to finance public investments such as air and sea ports and other major infrastructure projects.
Although Samoa has adopted a sector wide approach to its national planning framework, the budget process has not fully evolved to take into account these new changes. The budget process is still focussed at the ministerial level with minimal direct input from non-government actors such as NGOs and the private sector.
There are four main challenges that are noted in the current budget system that weakens policy coherence and achieving a fully operational outcome based planning and budgetary framework.
• Disconnect between budgeting and planning processes particularly for sector plans involving more than one ministry.
• The negotiation process to secure funding and determine resource allocation takes place at the ministerial level rather than at the sector level. Ministries involved in more than one sector find it difficult to effectively align their corporate plan and subsequent resource priorities against each sector they are involved with.
• Furthermore, ministries place greater emphasis on the Corporate Plans as their performances are measured directly from their Corporate Plan Implementation Matrices. This has resulted in a budget process that is more fragmented and does not fully reflect long term and end of sector plan outcomes but rather intermediate outcomes and outputs.
• Samoa is a developing country and ODA financing constitute close to 50% of public investments. Some of this assistance is through budgetary support programs. The rationale is to promote efficiency and relevancy in government and development partner assistance programs. However, to achieve this sufficient sector representation during the formulation and utilization of these resources are required.
The other avenue for assistances is through specific projects usually following a log frame approach. Individual projects require greater scrutiny to ensure their outcomes and targets are aligned to their respective sector plans. This is especially true when projects are international or regional thus comprising a broad group of objectives which may not be directly aligned with national priorities. Furthermore, there is a need to further strengthen the linkages between these projects to ensure they fully recognise the interdependency of their envisaged outcomes and targets.
4.4 Finance opportunities to achieve policy targets The financial flow analysis and the analysis of the public-sector management structures and procedures demonstrate that Samoa has a potential to utilize existing sources of finance more efficiently, and to mobilize additional sources of finance.
A comparison of funding with other countries at the same income level illustrates the potential that Samoa may have to mobilize additional funding for development. The analysis in section 4 shows Samoa’s potential to raise additional finance for development when using the averages of LMICs and countries in the region as “benchmarks”.

45
4. POLICY AND INSTITUTIONAL ASSESSMENT
Based on the analysis in sections above, the following are opportunities to consider for more efficient use of finance for development and increasing concessional and non-concessional sources of finance:
• The GoS can potentially increase the predictability of aid by continued engagement with its ODA partners to enter into longer term joint financing agreements for sector programs.
• The above will allow a further move towards modalities of full budget support with disbursements triggered by results instead of input-based financing dominated by discrete project and tied aid.
• Samoa has the potential to attract concessional and/or venture capital from DFIs at significantly higher levels.
• DFIs could potentially also be a source of finance for the planned divestments of SOEs and PPP projects.
• GoS could promote micro/SMEs by allocating more funds for some of the existing Micro/SME schemes jointly with development partners and/or DFIs.
• DFIs can also serve as partners in SME venture capital funds even if they will likely be limited by the size in demand.
• GoS could also consider financing BDS outsourced to private sector management companies as additional means to promote private sector development.
• Samoa has yet to pursue blended funds targeting middle income countries and emerging markets.
• To rationalize and increase productivity of its SOEs reducing the need for subsidies and raising levels of revenue from this source, GoS is continuing implementation of reforms. This includes engagement in more Public Private Partnership (PPP) contracts as an incentive for increase in productivity in service delivery. These reforms can potentially raise additional equity finance from foreign investors alongside equity and debt finance from DFIs.
• There is a potential to scale up further NGO engagement through outsourcing in the form of service or management agreements. This can attract additional funding from their international NGO partners, a source of funding which draws on other allocations of donor aid budgets targeting NGOs and raise additional equity financed from the same INGOs.
• Access to affordable credit to promote private sector development has been identified as a key constraint in Samoa. To promote private sector investments in Samoa, GoS could consider establishing Challenge Funds or Venture Capital Funds subcontracted to private management companies which combines financial and non-financial services.
• GoS could also consider finance business development services outsourced to private sector management companies on a competitive basis who in turn apply a user charges to promote start-ups with a dedication for putting their business into practice.
• The scope to attract more FDI is not only linked to the general business climate and the constraints of small economies in achieving economy of scale but also the extent to which Samoa can attract more FDI to some key sectors in which scale of investment can yield higher returns like fisheries and tourism. The plan to promote new PPP arrangements linked to SOEs can like attract some FDI to bring in technology and management for improved productivity and profitability.
• While remittances play an important role in financing household investments and spending, less is used for savings and/or investment in productive assets. If addressing the challenges related to

46
DEVELOPMENT FINANCE ASSESSMENT FOR SAMOA
business climate and entry of new financial intermediaries and instruments in the financial sector, remittances can play a significant role as an additional source of finance for development purposes.
4.5 Planning, monitoring and evaluationGoS has a comprehensive framework for planning, budgeting and monitoring of public expenditures, which consist of a national plan, sector plans, medium-term expenditure frameworks, annual budget documents and corporate plans.
A challenge is that the some of the plans are made for a fixed period of 3-4 years not updated annually to adjust for required reprogramming based on the previous year’s performance. They also cover different periods of time thus are not fully aligned to overreaching planning instruments18.
The annual budget presents performance targets with previous fiscal year as the baseline and then an annual target for the budget year with corresponding budget allocation but not forward looking compliant with the targets of sector and corporate plans. In a separate document submitted alongside the annual budget, MoF do present revenue projections and budget estimates for additional two years beyond the budget year, though at an aggregate level.
The GoS is in the process of developing MTEFs at sector levels however, they have yet to serve as “forward budgeting instruments”. There is a scope to further consolidate the current planning and budgeting instruments into three levels;
1. SDS with sector plans translating SDS targets into sector strategies covering the same time frame as the overreaching SDS.
2. Introduce MTEF as the main planning and budgeting instrument with a time frame of three years with the first year serving as the annual target and budget allocation for approval by the Parliament and two additional years with future planned targets and budget estimates. With an MTEF to be updated each year it can serve as the main planning, budgeting and monitoring tool of public expenditures.
3. Based on the above, Corporate plans can serve as detailed operational plans with specification of activities to achieve the targets serving as management tools for respective ministry also to be updated each year as MTEF; i.e. rolling plan with forward targets and budgets.
For this adjustment to be implemented it will require that the budget process is harmonized further with revised chart of accounts and that all ODA funded expenditures should be fully integrated into the regular budget rather than as separate projects in a separate “Development budget” i.e. one overall budget capturing all expenditures in accordance with one uniform chart of accounts regardless of source of funding. The latter will assist the GoS also in promoting “real” budget support based on MTEF targets as disbursement triggers and align ODA funded spending with GoS budget and accounts.
18 Like the Health Sector Plan that covers the years 2008 – 2018, while the Corporate Plan was for the years 2013 to 2016 and Samoa Education Sector Plan is for the years 2013-2018 while the Corporate Plan covered 2012 - 2015.

47
4. POLICY AND INSTITUTIONAL ASSESSMENT
4.6 Environment for dialogue and engagment of non-state actors The GoS promotes the engagement of private sector and civil society/NGOs through different means. As mentioned in sections above, Samoa has faced several challenges that have limited private sector participation and development. These have been well documented including but not limited to the following:
i. Access to equity and affordable capital
• High capital costs (high interest rates) when compared to international prices. In addition, access to credit is highly restrictive especially when faced with stringent lending requirement that hugely favour the financial institutions whilst charging optimal interest rates.
• The financial institutions should be encouraged to explore more efficient and cost saving measures as to deliver the same services. This includes e-banking facilities.
ii. Greater partnership with key private sector players in developing large scale projects in key sectors such as agriculture, manufacturing and tourism with government securing technical assistance through various government/development partner funded assistance programs.
iii. Greater effort towards aligning the rural subsistence economy and the urban monetized economy. This has been noted in the other documents as a major constraint.
• This includes exploring innovative ways to engage rural organizations.
• Greater NGO participation in the budgetary process.
• Fully utilizing ICT to offer niche services as well as disseminating critical market information.
The Public Private Partnership (PPP) has been demonstrated to work well especially in areas where it has been proven that outsourcing to the private sector was more cost effective for government that delivering these services directly. This includes capital works as well as sanitation (rubbish collection) services, and other maintenance works and services. The government also works closely with village councils in maintaining farm access roads as well as drainages in the Apia Urban Area. However, there is still avenue for government to continue to outsource other services to the private sector.
A key prerequisite for the outsourcing option is to accurately cost and measure the effectiveness in government delivered services. This would provide a benchmark for the private sector when these services are outsourced. Furthermore, it is important for government to develop its capacity to effectively monitor and regulate the services delivered by non-government actors. Given the size of the Samoan economy and population, other key services such as utilities are still provided by the public sector.

48
DEVELOPMENT FINANCE ASSESSMENT FOR SAMOA
5. Conclusions and recommendations
5.1 Future financial flows to achieve policy targets The composition of finance for development as presented in this report is summarized in the figure below. The figure shows the current composition of different sources of finance. Tax revenue is another significant source of finance and as mentioned in sections above, a source of government revenue that compares favorably with low-income countries and other countries in the region. The major source of external flows is remittances, which is high compared to the other Pacific Island Countries, will likely level out and even decline if policies to generate domestic employment and income opportunities succeed. Net domestic credit serves as a smaller share of finance compared to other countries in the region and LMICs but has the potential to increase with recommended interventions among others reflected in the GoS financial inclusion strategy.
Figure 23: Distribution of financing for development, 201519
Sources: Ministry of Finance (AMP and data provided by the Budget Division to DFA team); data from NRB provided to DFA team
19 Sources of data for figure 22: Ministry of Finance (AMP and data provided by the Budget Division to DFA team); data from NRB provided to DFA team.
Tax revenue
Remittances
Domestic credit
FDI
Other revenue excl ODA
ODA loans excl. global funds
Other �nancial services
ODA global funds
ODA grants government ex. global funds
ODA NGO/others
OOF 0.04%
1.60%
1.92%
1.97%
2.53%
2.65%
4.83%
5.03%
7.60%
30.04%
41.76%
0.00% 10.00% 20.00% 30.00% 40.00% 50.00%

49
5. CONCLUSIONS AND RECOMMENDATIONS
Based on the analysis from the sections above which also includes comparison to other countries in the region at the same income level (LMIC), the following are opportunities for increasing the efficiency in the use of finance and accessing additional concessional and non-concessional sources of finance:
• The two key efforts in further raising tax revenue will be to broaden the tax base and improving tax compliance, efforts already being addressed by the GoS. If using the average of the group of all Small Pacific Island States as a benchmark, then Samoa could potentially raise its tax revenues by 18%. If comparing to LMIC average the equivalent figure would be 10%.
• The GoS can potentially increase the predictability of aid by continued engagement with its ODA partners to enter into longer term joint financing agreements for sector programs20.
• The above will allow a further move towards modalities of budget support with disbursements triggered by results instead of input-based financing dominated by project tied aid.
• Access to affordable credit to promote private sector development has been identified as a key constraint in Samoa. To promote private sector investments GoS could consider establishing Challenge Funds or Venture Capital Funds subcontracted to private management companies which combine financial and non-financial services.
• Samoa has the potential to attract concessional and/or venture capital from DFIs at significantly higher levels and DFIs could also be a source finance for the planned divestments of SOEs and PPP projects.
• GoS could promote micro/SMEs by allocating more funds for some of the existing Micro/SME schemes jointly with development partners and/or DFIs.
• DFIs can also serve as partners in SME venture capital funds even if they will likely be limited by the size in demand as most of the DFIs have minimum investment thresholds of above 50 million USD, though in exceptional cases as low as 5 million USD.
• GoS could also consider financing BDS and grants for start-ups (“green filed investments”) with management outsourced to private sector companies as additional means to promote private sector development.
• Samoa has yet to pursue blended funds targeting middle income countries and emerging markets. Several of these funds promote private sector participation in a range of sectors like renewable energy, transport and communication as well as PPP contracts.
• To rationalize and increase productivity of its SOE reducing the need for subsidies and raising levels of revenue from this source, GoS is continuing implementation of reforms. This includes engagement in more Public Private Partnership (PPP) contracts as an incentive for increase in productivity in service delivery. These reforms can potentially raise additional equity finance from foreign investors alongside equity and debt finance from DFIs.
• There is a potential to scale up further NGO engagement through outsourcing in the form of service or management agreements. This can attract additional funding from their international NGO partners, a source of funding which draws on other allocations of donor aid budgets targeting NGOs and raise additional equity financed from the same INGOs.
20 E.g. like sector programs in Nepal, Bangladesh, Vietnam and Sri Lanka

50
DEVELOPMENT FINANCE ASSESSMENT FOR SAMOA
• The scope to attract more FDI is not only linked to the general business climate and the constraints of small economies in achieving economy of scale but also the extent to which Samoa can attract more FDI to some key sectors in which scale of investment can yield higher returns like fisheries and tourism. The plan to promote new PPP arrangements linked to SOEs can like attract some FDI to bring in technology and management for improved productivity and profitability.
• While remittances play an important role in financing household investments and spending, less is used for savings and/or investment in productive assets. If addressing the challenges related to business climate and entry of new financial intermediaries and instruments in the financial sector, remittances can play a significant role as an additional source of finance for development purposes.
5.2 Summary along INFF dimensionsThe GoS has a national development vision/plan with a well-articulated set of priorities and results related to the SDG agenda, including costed targets and indicators. While the SDS targets are to a large extent aligned to the SDGs there is a scope for further alignment for next and consecutive 4-year SDS. One option is to conduct a longer-term perspective study based on what will be required to achieve the SDGs within the 2030 which is then incorporated into the 4-year SDSs.
In terms of Institutional coherence and management capacity at various political, technical, and working levels the GoS ministries and agencies are operationally guided by a comprehensive set of plans at various levels from SDS to sector and corporate plans. Some challenges relate to the disconnect between budgeting and planning processes particularly for sector plans involving more than one ministry. Ministries also place greater emphasis on the Corporate Plans that has resulted in a budget process that does not fully reflect longer term sector plan outcomes but rather intermediate outcomes and outputs. As ODA financing constitute close to 50% of public investments, the efficiency for this form of finance could be improved further by introducing sufficient sector representation during the formulation and utilization of these resources are required and by engagement with its ODA partners to enter into longer term joint financing agreements for sector programs.
The outcomes of the financial mapping of this DFA suggest there are several financing opportunities that can be considered for more effective use of existing finance and accessing new sources of finance. Among them are efforts in further raising tax revenue, increase the predictability of aid by continued engagement with its ODA partners to enter into longer term joint financing agreements for sector programs, attract concessional and/or venture capital from DFIs, promote micro/SMEs by allocating more funds for some of the existing Micro/SME schemes , promote SME venture capital fund, financing BDS outsourced to private sector management companies as additional means to promote private sector development, pursue blended funds targeting middle income countries and emerging markets and engagement in more Public Private Partnership (PPP) contracts. There is also a scope to scale up further NGO engagement through outsourcing in the form of service or management agreements.
i.e. an effective system for monitoring and evaluation of the use of finance for results. They consist of several planning, budgeting and monitoring instruments. A challenge is that they cover different

51
5. CONCLUSIONS AND RECOMMENDATIONS
periods of time thus not fully aligned to overreaching planning instruments21. There is a scope to further consolidate the current planning and budgeting instruments into three levels; (i) SDS with sector plans translating SDS targets into sector strategies covering the same time frame as the overreaching SDS, (ii) Introduce MTEF as a rolling plan and forward budget with a time frame of three years and subsequently (iii) maintain rolling corporate plans as detailed operational plans with specification of activities to achieve the targets.
Table 5: Roadmap outline for implementation of DFA recommendations
Thematic area Strategic actions
Efficiency in public sector finance
GoS should consolidate the current planning and budgeting instruments into three levels; (i) SDS with sector plans translating SDS targets into sector strategies covering the same time frame as the overreaching SDS, (ii) Introduce MTEF as a rolling plan and forward budget with a time frame of three years and subsequently (iii) maintain rolling corporate plans as detailed operational plans with specification of activities to achieve the targets. The above will also require an adjustment to the current charge of accounts and full integration of ODA into the regular budget.
Reduce the volatility of aid by continued engagement with its ODA partners by entering into longer term joint financing agreements for sector programs similar to many other countries and move further towards modalities of budget support with disbursements triggered by results instead of input based financing from discrete projects and tied aid.
GoS should conduct a review of additional services that potentially could be outsourced to NGOs and/or private sector through in the form of service or management agreements. This can attract additional funding from their international NGO partners, a source of funding which draws on other allocations of donor aid budgets targeting NGOs and raise additional equity financed from INGOs.
Raising domestic revenue
Raising tax revenue by broadening the tax base and improving tax compliance. Broadening of the tax base implies a review of the current system for personal income tax as well as further reform related to tax exemptions for different businesses and organizations drawing on the practice of other countries in the region. Improving tax compliance includes further development of web based electronic tax filing and payment system as well as application of audit systems to more effectively target underreported taxable income and tax evasion.
Raising revenue from SOEs by continued implementation of divestment program including pursuing possible PPP arrangements. To make an informed decision on what PPP arrangements could attract in terms additional equity and debt finance from private sector investors including FDI, GoS should consider undertaking an assessment of the net financial impact of past and current PPPs and regularly register the financial flows associated with SOE divestment and PPP arrangements.
Private sector To promote private sector investments Samoa, GoS could consider establishing Challenge Funds or Venture Capital Funds subcontracted to private management companies which combines financial and non-financial services. They could be modeled around similar arrangements in many other LIC/LMIC countries.
GoS should map and pursue blended funds targeting middle income countries and emerging markets. Several of these funds promote private sector participation in a range of sectors like renewable energy, transport and communication as well as PPP contracts.
GoS should map DFIs with equity and debt finance eligible for Samoa as financial partners to be contacted for engagement in Challenge/Venture Capital funds.
GoS should promote micro/SMEs by allocating more funds for some of the existing Micro/SME schemes jointly with development partners and/or DFIs.
GoS should also consider financing BDS outsourced to private sector management companies as additional means to promote private sector development.
21 Like the Health Sector Plan that covers the years 2008 – 2018, while the Corporate Plan was for the years 2013 to 2016 and Samoa Education Sector Plan is for the years 2013-2018 while the Corporate Plan covered 2012 - 2015.

52
DEVELOPMENT FINANCE ASSESSMENT FOR SAMOA
5.3 Outline of a roadmap for implementation of DFA recommendations for SamoaFrom the financial assessment and analysis along the INFF dimensions, some key actions have been identified as options for GoS to consider in improving efficiency in the use of existing finance for development as well as in pursuing additional sources of finance.

53
ANNEx 1: CONCEPT NOTE/TOR FOR DFA SAMOA
Annex 1: Concept Note/ToR for DFA Samoa
DRAFT
CONCEPT NOTE FOR A DEVELOPMENT FINANCE ASSESSMENT IN SUPPORT OF THE ACHIEVEMENT OF
THE STRATEGY FOR DEVELOPMENT FOR SAMOA (SDS) AND AGENDA 2030 IN SAMOA
1) BackgroundSubstantial changes are occurring in the development finance landscape worldwide. Samoa, like other Pacific Island countries (PICs) is going through transition in terms of mobilizing and managing resources – both domestic and external as well as public and private – to finance its development goals and aspirations. At a regional level much of the focus has been on addressing the development challenges presented by climate change and improving access to the management of climate change development finance. To this end the Pacific Islands Forum Secretariat has developed their Pacific Climate Change Finance Assessment Framework (PCCFAF). The need to optimize domestic capacity to manage development finance generally and climate finance specifically was also agreed upon in the S.A.M.O.A Pathway.
The cross-cutting nature of climate change merits a renewed assessment of financial flows ensuring that the government’s approach towards financing is effectively aligned to Samoa’s development goals. Samoa has outlined its development goals in its Strategy for Development (SDS) 2016/17-2019/20 where it sets out fourteen Keys Outcomes across four priority areas of development: economic, social, infrastructure and the environment. These priorities will be addressed under the mantra “Accelerating Sustainable Development and Broadening Opportunities for All”.
Against this backdrop of the development context of Samoa, global policy and dialogue processes are also relevant to Samoa’s efforts to achieve its national development goals and the SDGs. The Third International Conference on Financing for Development, held in Addis Ababa in July 2015, opened the discussions on how to mobilize the unprecedented amounts of financial resources that will be required to achieve the SDGs. The Addis Ababa Action Agenda assumes that countries will use their own national development strategies and plans to respond to the SDGs and calls for the adoption of Integrated National Financing Frameworks (INFFs). In this regard, Governments are now increasingly requesting for support to take forward policy and institutional reforms to enable more integrated management of a broader set of finance flows to support the implementation of their national priorities and the SDGs. There has been

54
DEVELOPMENT FINANCE ASSESSMENT FOR SAMOA
development of a tool to help countries construct Integrated National Financing Frameworks to implement the SDGs – the Development Finance Assessment (DFA).
DFAs are the very first development finance studies of their kind that seek to move away from fragmented views on the use of the different sources of funds that are primarily dedicated to addressing development issues. Rather, they aim to help countries to review how their own stated national development policy objectives are being reflected in public expenditures, and private investment more broadly and how institutions might be adjusted to ensure that development finance is delivered in a coherent way across all areas of government. The DFA provides a country with an overview of the landscape of development finance, and the alignment of different finance flows to national development priorities and results. UNDP is already supporting a number of countries to implement the flagship DFA methodology.22 The DFA provides planning, finance and other ministries, with data and analysis on the changing trends in development finance. It also provides a set of recommendations for how institutions and systems might be managed within a coherent framework, which better supports the achievement of national priorities and results including the SDGs.
An Integrated National Financing Framework is the system of policies and institutional structures that a government has in place for managing its approach toward financing. An Integrated National Financing Framework (INFF) can be understood as a conceptual model that can prompt governments to assess their financing frameworks as a whole and guide thinking about reforms that are needed to strengthen them to more effectively manage and mobilize financing for national development strategies. In responding to demand from developing countries,
Six building blocks emerge that underpin an Integrated National Financing Framework:
1. Leadership that facilitates institutional coherence
2. A clear vision for results
3. A strategic financing policy with a long term vision
4. Specific financing policies
5. A strong monitoring, evaluation and learning system
6. An enabling environment for accountability and dialogue
22 In the region UNDP has assisted with DFAs in Fiji, Marshall Islands, PNG and Timor Leste http://www.asia-pacific.undp.org/content/rbap/en/home/ourwork/democratic-governance-and-peacebuilding/ap-def.html

55
ANNEx 1: CONCEPT NOTE/TOR FOR DFA SAMOA
1 Leadership and institutional coherence
2 Vision for results
Long-termvision
Government action Investment outputs Investment outcomes Results
Less direct
More direct
Link toSDGs
Medium-termdevelopment plans
Annual resultsplans
Privatesector
Internationalcommunity
Civilsociety
Costedtargets
Internationalprivate
Domesticprivate
Domesticpublic
Internationalpublic
5 Monitoring and evaluation
3 Overarching �nancing strategy
4 Speci�c �nancing policies
6 Accountability and dialogue
UNDP has been undertaking Development Finance Assessments (DFAs) that analyze a country’s financing landscape and serve as a baseline for assessing the extent to which the essential elements of an INFF is in place.23 DFAs take into account the social, economic and environmental dimensions of development and it analyses the roles that different development finance flows play for or against sustainable development considering all these dimensions.
This concept note is for a Development Finance Assessment (DFA) for Samoa, which will consider the links between finance and national development priorities and the scope for stronger alignment of finance with Samoa’s Strategy for Development (SDS) and the SDGs moving forward. In particular, the DFA will provide recommendations for strengthening the INFF providing a Roadmap for a strengthened INFF and ways forward which could contribute to resource mobilization, capacity development and even possible policy institutional reforms that better link finance with results within the INFF lens.
23 In Samoa, some baseline figures already exist. For example, the Climate Public Expenditure and Institutional Review in 2012 traversed similar ground. Available at <https://www.climatefinancedevelopmenteffectiveness.org/sites/default/files/documents/05_02_15/cpeir%20samoa%20content_for%20web.pdf>.

56
DEVELOPMENT FINANCE ASSESSMENT FOR SAMOA
2) Objectives
Overall objective:
Objective: To deliver a Development Finance Assessment which provides an overview of development finance flows and the institutions and policies that align this finance with national development priorities, to include recommendations for a roadmap which will increase the alignment of financing flows – both public and private - to Samoa’s Strategy for Development (SDS) and the 2030 Agenda.
In particular the DFA will:
• Provide an overview of the evolution of the flows of financing for development and their allocation and contribution to national priorities and results, as expressed in plans and policies at national, sector and sub-national levels. In particular, the overview will look to how systems can be strengthened to better align finance with Samoa’s national development priorities and the Sustainable Development Goals (SDGs)
• Assess the role of the planning and budgeting process in linking both public and private finance with results, in the context of the SDGs
• Assess the roles and responsibilities of national institutions and their associated policies in managing or influencing the development of individual financial flows to contribute to the national development plan and SDGs
• Analyse the interface between different flows and the complementarities between the different sources of development finance in contributing to achieve national priorities and the SDGs
3) Scope of work
The scope of work provided below will be further expanded and detailed as part of the consultations to be undertaken under the auspices of the DFA Oversight Team (see below, Institutional Arrangements). Additional Terms of Reference will then be developed for the Oversight Team, and for the technical assistance team to support the delivery of the DFA.
i) Assessment of national planning and budgeting systems and their results orientation. The DFA will focus on the potential means to finance the country’s national development priorities. The assessment will seek to identify how priorities have been formulated in plans and strategies in the last planning cycle at thematic levels, as well as the current Strategy for Development (SDS). The DFA will include a particular focus on an assessment of the alignment of national development priorities and targets with financial strategies and allocations. The analysis will include an assessment of the degree to which plans and policies include targets which are costed; how results frameworks function in practice; the coherence between sector / thematic plans and the SDGs; and the extent to which multiple stakeholders are involved in the planning and monitoring process. Beyond the assessment of the degree to which plans are costed, the DFA will also assess the degree to which there are financial estimates / resource mobilisation targets associated with the results framework and if these estimates are translated into Medium Term Expenditure Frameworks or other types of fiscal planning documents which are associated with the national budgeting process. An overall question for the agencies dealing with development planning and finance is whether there are both results oriented systems and procedures as well as a results oriented organisational culture. Options for improving the results-focus of national development strategies and plans may be provided as part of the road map moving forward.

57
ANNEx 1: CONCEPT NOTE/TOR FOR DFA SAMOA
ii) Mapping and analysis of financing for development flows and their associated policy and institutional frameworks. Development finance flows are analysed according to two main categories: by source (domestic/external) and distinguishing them by public or private nature. This analysis will look to assess both quantitative trends in the changing nature of the development finance landscape over the past 10-15 years (depending on availability of data), as well as the policy and institutional coherence across flows in terms of their alignment with development priorities and the SDGs. The analysis will include an institutional assessment of current mechanisms for promoting coherence and coordination across flows as well as the strengths and weaknesses of existing data systems for providing evidence upon which to base financing policies. Finally, the analysis will assess the potential opportunities and constraints in expanding and aligning future development finance flows in the context of the SDGs.
iii) In depth analysis of policy and institutional options for strengthening the alignment of priority flows with the Strategy for Development (SDS) and the SDGs [and projections of future trends with these selected flows - if possible and desirable. The DFA Oversight Team chaired by the Ministry of Finance will determine 2-3 selected priority flows or case study areas for further in depth analysis to determine options for strengthening their potential for accelerating progress in the implementation of the national development priorities and the SDGs. If sufficient quantitative evidence is available, this analysis will include projections of the future evolution of these priority flows into the next 5-10 years. In addition to potential quantitative analysis, the assessment will include more detailed policy and institutional analysis of the options to make the best use of these resources for financing the SDGs. Initial consultations have suggested that this area of the DFA in Samoa might focus on (these will be narrowed down and/or revised during the Inception Mission):
• Attracting FDI and policy options for aligning this finance source with national development results
• Development financial institutions (DFIs)- options for improving the alignment of DFIs to the macro-economic institutional framework of the government (and ultimately the SDS)
• ODA- options for increasing strategic and catalytic use and complementarity with other flows
• Climate change finance
• Tax and domestic resources mobilization
• Harnessing remittances for development
iv) Roadmap to establish an Integrated National Financing Framework for achieving the national development goals and SDGs. The DFA will provide the government with policy and institutional recommendations for strengthening the alignment of development finance flows with national priorities and results. Part of the dialogue embedded in the DFA process will lead to the agreement of a roadmap which will support the government to: i) implement the main recommendations of the DFA analysis; ii) visualize the next logical and feasible steps to develop an Integrated National Financing Framework (INFF); and iii) identify the basis for support to be provided to the government as part of the proposed broader efforts to implement national development goals and the SDGs. This will require consultation with a range of stakeholders within the Oversight Team and beyond, throughout the process.
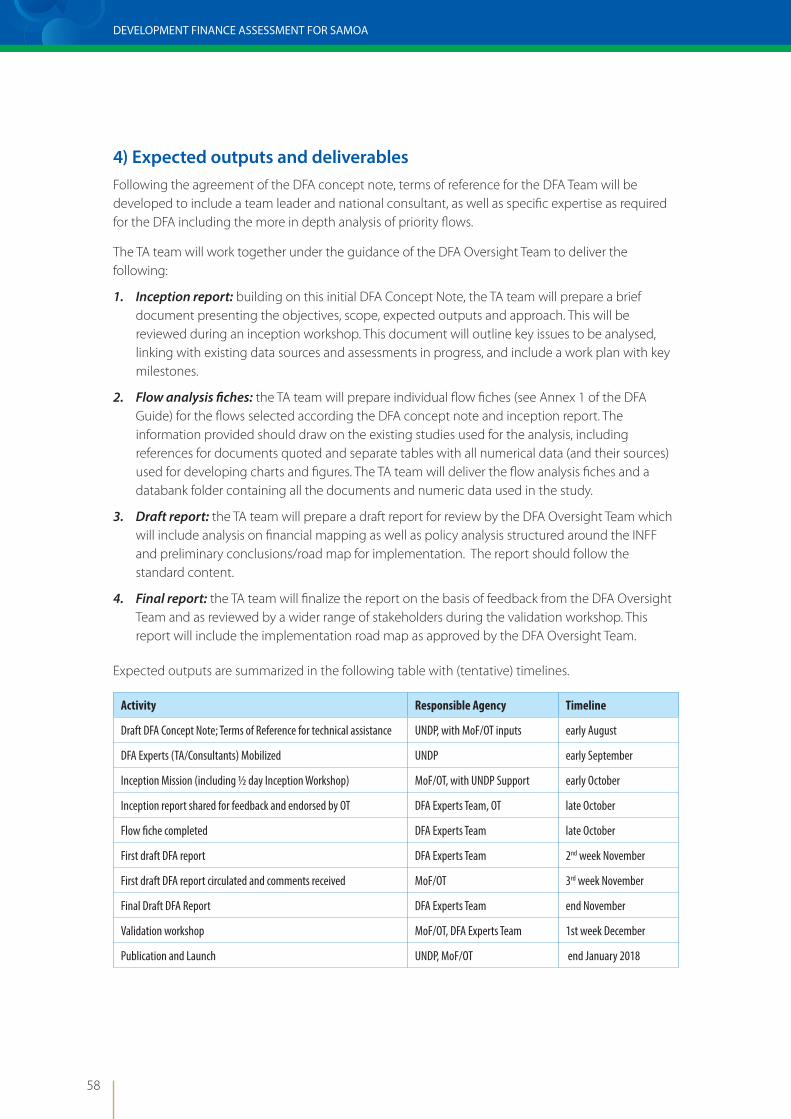
58
DEVELOPMENT FINANCE ASSESSMENT FOR SAMOA
4) Expected outputs and deliverablesFollowing the agreement of the DFA concept note, terms of reference for the DFA Team will be developed to include a team leader and national consultant, as well as specific expertise as required for the DFA including the more in depth analysis of priority flows.
The TA team will work together under the guidance of the DFA Oversight Team to deliver the following:
1. Inception report: building on this initial DFA Concept Note, the TA team will prepare a brief document presenting the objectives, scope, expected outputs and approach. This will be reviewed during an inception workshop. This document will outline key issues to be analysed, linking with existing data sources and assessments in progress, and include a work plan with key milestones.
2. Flow analysis fiches: the TA team will prepare individual flow fiches (see Annex 1 of the DFA Guide) for the flows selected according the DFA concept note and inception report. The information provided should draw on the existing studies used for the analysis, including references for documents quoted and separate tables with all numerical data (and their sources) used for developing charts and figures. The TA team will deliver the flow analysis fiches and a databank folder containing all the documents and numeric data used in the study.
3. Draft report: the TA team will prepare a draft report for review by the DFA Oversight Team which will include analysis on financial mapping as well as policy analysis structured around the INFF and preliminary conclusions/road map for implementation. The report should follow the standard content.
4. Final report: the TA team will finalize the report on the basis of feedback from the DFA Oversight Team and as reviewed by a wider range of stakeholders during the validation workshop. This report will include the implementation road map as approved by the DFA Oversight Team.
Expected outputs are summarized in the following table with (tentative) timelines.
Activity Responsible Agency Timeline
Draft DFA Concept Note; Terms of Reference for technical assistance UNDP, with MoF/OT inputs early August
DFA Experts (TA/Consultants) Mobilized UNDP early September
Inception Mission (including ½ day Inception Workshop) MoF/OT, with UNDP Support early October
Inception report shared for feedback and endorsed by OT DFA Experts Team, OT late October
Flow fiche completed DFA Experts Team late October
First draft DFA report DFA Experts Team 2nd week November
First draft DFA report circulated and comments received MoF/OT 3rd week November
Final Draft DFA Report DFA Experts Team end November
Validation workshop MoF/OT, DFA Experts Team 1st week December
Publication and Launch UNDP, MoF/OT end January 2018

59
ANNEx 1: CONCEPT NOTE/TOR FOR DFA SAMOA
5) Institutional arrangementsThe DFA will be led by an oversight team which will guide the focus of the exercise, oversee its implementation and help to shape the recommendations and policy proposals that it presents. The oversight team will help the DFA team access the data and information needed to complete the exercise, and will convene stakeholders during the process.
With UNDP support a Technical Assistance team will be contracted to support the implementation of the DFA. They will work under the supervision of the Ministry of Finance with technical back stopping and quality assurance from UNDP MCO and UNDP Bangkok Regional Hub.
The draft list of proposed members of the Oversight Team (‘OT’) is as follows:
• Ministry of Finance (Finance Sector Coordination & Public Financial Management Division, Aid Coordination and Debt Management Division, Economic Policy & Planning Division, Climate Resilience Investment and Coordination Unit)
• Central Bank of Samoa
• Ministry of Commerce, Industry and Labour (MCIL)
• Ministry of Works, Transport and Infrastructure (MWTI)
• Ministry of Natural Resources and Environment (MNRE)
• Public Service Commission (PSC)
The DFA team that undertakes the assessment itself and is responsible for writing the report will comprise:
• CEO, MOF
• National consultant – TBC
• Support from UNDP Pacific Centre and UNDP Bangkok Regional Hub
Objectives and Main Activities of the Oversight Team
The Oversight Team will play the overall governance and leadership role in the DFA process. The main objectives of the Oversight Team are proposed as follows:
• Support the DFA fieldwork. Facilitating the work of the research team by (i) ensuring access to key decision makers and government documents and (ii) removing any obstacles that may delay the DFA process
• Oversee quality and accuracy of the assessment. The OT will supervise and guide the research team by (i) reviewing the DFA intermediary and final outputs produced by the team (ii) ensuring that the assessment is accurate and provides the necessary depth to be useful for government decision-making
• Ensure government buy-in. The OT will lead the discussion with government, development partners and other relevant stakeholders about the DFA findings, as well as on implementation of the recommendations and next steps.

60
DEVELOPMENT FINANCE ASSESSMENT FOR SAMOA
The Oversight Team will formally meet at agreed milestones of the DFA process, and its members may informally engage to support specific tasks of the DFA team. The primary duties of the OT are proposed as follows:
• Support the DFA customization and determination of specific areas to be addressed, to ensure it addresses the Government of xxx’s strategic interests and objectives
• Approve objectives, scope, expected outputs and methodology of the DFA
• Approve and supervise the DFA work plan and key milestones
• Provide strategic directions and feedback, especially if the DFA team faces significant challenges
• Review the documents presented by the DFA team and provide comments within the agreed timeframe
• Endorse the outcomes of the DFA and the resulting Implementation Roadmap
• Facilitate in-depth discussion within the Government of xxx on the outcomes of the DFA and the recommendations expressed in the Roadmap
• Support follow-up to the assessment and the implementation of the Roadmap
• Support the dissemination of the DFA to wider audiences (parliament, development partners, Business and Civil Society Organisations, etc.
6) AnnexesTo be added:
• Key literature to be reviewed regarding development finance context in Samoa
• Development Finance Assessment Guidance Document
• Terms of Reference for Technical Team

61
ANNEx 2: LIST OF PERSONS MET
Annex 2: List of persons met
Name Title/position Institution/Organization
Mr. Lavea Iulai Lavea Chief Executive Officer Ministry of Finance (MOF)
Ms Peseta Noumea Simi Chief Executive Officer Ministry for Foreign Affairs and Trade (MFAT)
Ms Avalisa Viali-Fautualii Chief Executive Officer Ministry for Revenue (MfR)
Mr Ulu Bismark Crawley Chief Executive Officer Ministry for Natural Resources and Environment (MNRE)
Muagututia Mr Sefuiva Reupena and Management
Chief Executive Officer Samoa Bureau of Statistics (SBS)
Ms Elita Toala and Management Chief Executive Officer Ministry for Public Enterprises (MPE)
Ms Tootooleaava Dr Fanaafi Aiono-Le Tagaloa
Chief Executive Officer Samoa International Finance Authority (SIFA)
Ms Maryann Lameko-Vaai Chief Executive Officer Bank South Pacific (BSP)
Tagaloa Mr Eddie Wilson President Samoa Manufacturers Association (SAME)
Mr Colin Stringer Technical Adviser Samoa Manufacturers Association
Lemauga Mr Hobart Vaai Chief Executive Officer Samoa Chamber of Commerce
Mr Alatina Ioelu Chief Executive Officer Small Business Enterprise Centre (SBEC)
Afoa Mr Kolone Vaai Co-Managing Director (Former Financial Secretary)
KVA Consult
Silafau Mr Paul Meredith Managing Director Wizconsult
Ms Maeva Betham Vaai Focal Point World Bank
Ms Maria Melei-Alailima Focal Point Asian Development Bank
Ms Amanda Jewell Deputy High Commissioner/Counsellor Development
Australia High Commission
Ms Kalameli Ah Mu Development Programme Coordinator New Zealand High Commission
Mr Pati Mualia Programme Officer New Zealand High Commission
Representative Senior Officer JICA
Representative Senior Officer Chinese Embassy
Ms Lizbeth Culley Resident Representative UNDP
Notonegoro Deputy Resident Representative UNDP
Cherelle Fruean Programme Analyst - SDGs Localisation UNDP
Mr Amit Kumar Pacific Financial Inclusion Programme UNCDF
Mr Benjamin Pereira Deputy Governor Central Bank of Samoa (CBS)
Mr Karras Lui Assistant Manager - Research & Statistics Central Bank of Samoa (CBS)

62
DEVELOPMENT FINANCE ASSESSMENT FOR SAMOA
Name Title/position Institution/Organization
Mr Raymond Voigt Executive Member SUNGO - Civil Society
Ms Gaualofa Matalavea-Saaga Sector Coordinator - Health Ministry for Health (MOH)
Leota Mr Aliielua Salani ACEO - National Accounts and Finance Samoa Bureau of Statistics (SBS)
Ms Lilianetelani Hennemann Principal - National Accounts and Finance Samoa Bureau of Statistics (SBS)
Mr Mapu Mulitalo Chief Finance Officer National Provident Fund
Mr Raie Silipa Manager Finance Development Bank of Samoa
Ms Akenese Hansell Chief Finance Officer Unit Trust of Samoa (UTOS)
Mr Joe Wongsin Chief Investment Analyst Unit Trust of Samoa (UTOS)
Mr Lae Silva Assistant CEO PFM and Finance Sector Coordination Finance
MOF
Ms Lita Lui Assistant CEO - Aid Coordination and Debt Management
MOF
Ms Rosita Mauai Assistant CEO Accounts MOF
Ms Maliliga Vasa Principal - Macroeconomic Policy and Planning
MOF
Ms Sarona Esera Assistant CEO Human Resource Development
Public Service Commission (PSC)
Ms Osana Liki and Team Assistant CEO Sector Coordinator - Public Administration
Public Service Commission (PSC)
Mr Daniel Chan Boon Assistant CEO HR Management & Information System
PSC
Ms Lisi Faletutulu Assistant CEO - Corporate Service Ministry for Commerce, Inductry and Labour (MCIL)
Mr Muliufi Nickel Assistant CEO - Sector Coordinator Trade, Commerce & Manufacturing Sector
MCIL
Alaifea Ms Laititi Belford Su’a Asisstant CEO - Corporate Service Ministry of Education, Sports and Culture (MESC)
Faaiuaso Samoa Principal Policy Ministry of the Prime Minister and Cabinet
Mr Karanita Mavaega Principal Policy Ministry of the Prime Minister and Cabinet
Mr Muelu Meatoga Principal Policy Ministry of the Prime Minister and Cabinet

63
TABLES

64
DEVELOPMENT FINANCE ASSESSMENT FOR SAMOA

65
TABLES