samoa technical report
TRANSCRIPT

EU-SOPAC Project Report 112 Reducing Vulnerability of Pacific ACP States
SAMOA TECHNICAL REPORT High-Resolution Bathymetric Survey
Fieldwork Undertaken from 27 January to 1 March 2004
October 2008
Western Samoa three-dimensional Digital Elevation Model

Prepared by:
Jens Krüger and Salesh Kumar
SOPAC Secretariat
May 2008
PACIFIC ISLANDS APPLIED GEOSCIENCE COMMISSION
c/o SOPAC Secretariat
Private Mail Bag
GPO, Suva
FIJI ISLANDS
http://www.sopac.org
Phone: +679 338 1377
Fax: +679 337 0040
www.sopac.org
Important Notice
This report has been produced with the financial assistance of the European Community; however, the views expressed herein must never be taken to reflect the official opinion of the
European Community.

Samoa: High-Resolution Bathymetry EU EDF-SOPAC Reducing Vulnerability of Pacific ACP States – iii
TABLE OF CONTENTS
EXECUTIVE SUMMARY ......................................................................................................... 1
1. INTRODUCTION ........................................................................................................ 2
1.1 Background ................................................................................................................ 2 1.2 Geographic Situation .................................................................................................. 2 1.3 Geological Setting ...................................................................................................... 3 1.4 Previous Bathymetry Compilations............................................................................. 4
2. RESULTS AND DISCUSSION................................................................................... 6
2.1 Multibeam Bathymetry ................................................................................................ 6 2.2 Composite Grid .......................................................................................................... 7 2.3 Morphological Features ............................................................................................ 10
3. DATA ACQUISITION AND PROCESSING ............................................................. 12
3.1 Survey Particulars .................................................................................................... 12 3.2 Field Personnel ........................................................................................................ 12 3.3 Geodetic Reference System .................................................................................... 12 3.4 Vessel Description and Static Offsets ...................................................................... 13 3.5 Positioning Control ................................................................................................... 15 3.6 Survey Computer ..................................................................................................... 15 3.7 Multibeam Echosounder ........................................................................................... 15 3.8 Multibeam Echosounder Data Processing ............................................................... 16 3.9 Multibeam Backscatter ............................................................................................. 16 3.10 Tidal Information ....................................................................................................... 17 3.11 Sound Velocity Profiling ........................................................................................... 18 3.12 Composite DTM Model ............................................................................................. 20
4. REFERENCES ......................................................................................................... 22
APPENDICES ........................................................................................................................ 24
Appendix 1 – Equipment Performance, Statement of Uncertainty, Suitability for Charting 24 Appendix 2 – CTD profiles .................................................................................................. 28 Appendix 3 – High-resolution A0 charts, Western Samoa Bathymetry .............................. 32 Appendix 4 – Data supplement: Multibeam Log Sheet ...................................................... 33

iv –Samoa: High-Resolution Bathymetry EU EDF-SOPAC Reducing Vulnerability of Pacific ACP States
LIST OF FIGURES
Figure 1. Location map of Pacific Island countries and territories constituting SOPAC. . v
Figure 2. Presumed formation of the Samoan chain by movement of the Pacific crustal plate over a stationary hotspot of rising magma from the underlying mantle. .. 3
Figure 3. Plate tectonic map of the major submarine tectonic features in the region. ..... 4
Figure 4. MBES bathymetry coverage acquired during the survey. ................................ 7
Figure 5. Digital elevation model (DEM) of Samoa compiled for this report. ................... 8
Figure 6. Three-dimensional perspective image of the DEM of Samoa. ......................... 8
Figure 7. Shaded relief map of the 250 m compiled grid of Upolu and Savai’i. . .............. 9
Figure 8. Slope angle map of Samoa based on the 250 m compiled grid. ....................... 9
Figure 9. The chartered survey vessel Turagalevu. ...................................................... 13
Figure 10. Diagrams and measurements of the vessel Turagalevu. ............................... 14
Figure 11. Tidal elevations as measured by the Apia tide gauge and referenced to lowest astronomical tide (LAT); and tidal elevations predicted by Wxtide. ................ 17
Figure 12. Definition of levels for the tide gauge at Apia, Samoa (NTC, 2006). .............. 18
Figure 13. Map showing the location of CTD profiles with cast numbers for Samoa. ..... 20
Figure 14. Coverage map for the datasets summarised in the section above. ............... 21
Figure A1.1. Conceptual illustration of bathymetric data acquisition with an MBES. ......... 25
LIST OF TABLES
Table 1. Summary geography of Samoa. ...................................................................... 2
Table 2. Public multibeam datasets for Samoa. ............................................................. 5
Table 3. MBES bathymetry grid files for the 2004 survey. ............................................. 6
Table 4. Definition of common morphological terms. ................................................... 10
Table 5. Description of morphological features on the new bathymetric charts. .......... 11
Table 6A. Geodetic datum – WGS 72 (local determination). .......................................... 12
Table 6B. Geodetic datum – Universal Transverse Mercator Zone 2 South. ................. 13
Table 7A. Post-processing sequence and Table 7B. Chart production sequence. ........ 16
Table 8. CTD profile details. ......................................................................................... 19
Table A1.1. Recommended accuracy of survey orders. .................................................... 24
Table A1.2. Values for calculating error limits for depth accuracy. .................................... 25
Table A1.3. Projected footprint size under varying water depths. ..................................... 27

Samoa: High-Resolution Bathymetry EU EDF-SOPAC Reducing Vulnerability of Pacific ACP States – v
EU-SOPAC Project Report 112 – Krüger and Kumar 2008
Figure 1. Location map of Pacific Island countries and territories constituting SOPAC

vi –Samoa: High-Resolution Bathymetry EU EDF-SOPAC Reducing Vulnerability of Pacific ACP States
EU-SOPAC Project Report 112 – Krüger and Kumar 2008
Acronyms and their meaning
ACP African, Caribbean, and Pacific
ADCP Acoustic Doppler current profilers
ARGO Array for real-time geostrophic oceanography
ASCII American standard code for information interchange
CD Chart datum
CTD Conductivity – temperature – depth
DEM Digital elevation model
DTM Digital terrain model
EEZ Exclusive economic zone
GDEM Generalised digital environmental model
GEBCO General bathymetric chart of the oceans
GPS Global positioning system
LAT Lowest astronomical tide
MBES Multibeam echosounder
MRU Motion reference unit
MSL Mean sea level
NTC National Tide Centre
PI-GOOS Pacific Islands global ocean observing system
RTK Real-time kinematic GPS (centimetre accuracy)
SMNT Seamount catalogue
SOPAC Pacific Islands Applied Geoscience Commission
SPCZ South Pacific convergence zone
SRTM Shuttle radar topography model
TAO Tropical atmosphere ocean array
UTM Universal transverse Mercator
WGS World geodetic system

Samoa: High-Resolution Bathymetry EU EDF-SOPAC Reducing Vulnerability of Pacific ACP States – 1
EU-SOPAC Project Report 112 – Krüger and Kumar 2008
EXECUTIVE SUMMARY
Krüger, J. and Kumar, S. 2008: High-Resolution Bathymetric Survey of Samoa. EU EDF 8 & 9 – SOPAC Project Report 112. Pacific Islands Applied Geoscience Commission: Suva, Fiji. vi + 50 p. + 9 charts.
The Pacific Islands Applied Geoscience Commission (SOPAC) carried out a marine survey for Samoa around the islands of Savai’i and Upolu. The objective was to investigate the seabed and provide information about water depths around the islands using a Multibeam echosounder (MBES).
This report describes the high-resolution bathymetric mapping survey carried out over a period of five weeks from 27 January to 1 March 2004, resulting in the acquisition of over 2754 line-km of MBES data.
The survey achieved 100% coverage of the seafloor from approximately 50 m depth in the nearshore area to an average offshore distance of 10 km, reaching water depths of some 1500 m. Coverage was significantly less in some areas such as Apolima Strait.
The resultant data compilation was used to produce nine bathymetry charts for Samoa at a scale of 1 : 50 000. These new bathymetric maps provide a descriptive picture of the ocean bottom terrain, vividly revealing the size, shape and distribution of underwater features. They serve as the basic tool for scientific, engineering, marine geophysical and environmental studies, as well as for marine and coastal resource management.
2 –Samoa: High-Resolution Bathymetry EU EDF-SOPAC Reducing Vulnerability of Pacific ACP States
EU-SOPAC Project Report 112 – Krüger and Kumar 2008
1. INTRODUCTION
1.1 Background A marine survey for Samoa was carried out around the island of Savai’i and Upolu. The objective was to investigate the seabed and provide information about water depths around the islands using a multibeam echosounder (MBES). The wave and current regime at three main locations mainly in the passage between the two islands (Apolima Strait) was also investigated using acoustic Doppler current profilers (ADCP). The strength of the magnetic field was also continuously logged during the survey using a towed magnetometer. The present report presents the results of the MBES survey (data collected by the ADCPs and magnetometer are covered elsewhere). This work was initiated by the SOPAC/EU Reducing Vulnerability of Pacific ACP States Project, under the European Development Fund.
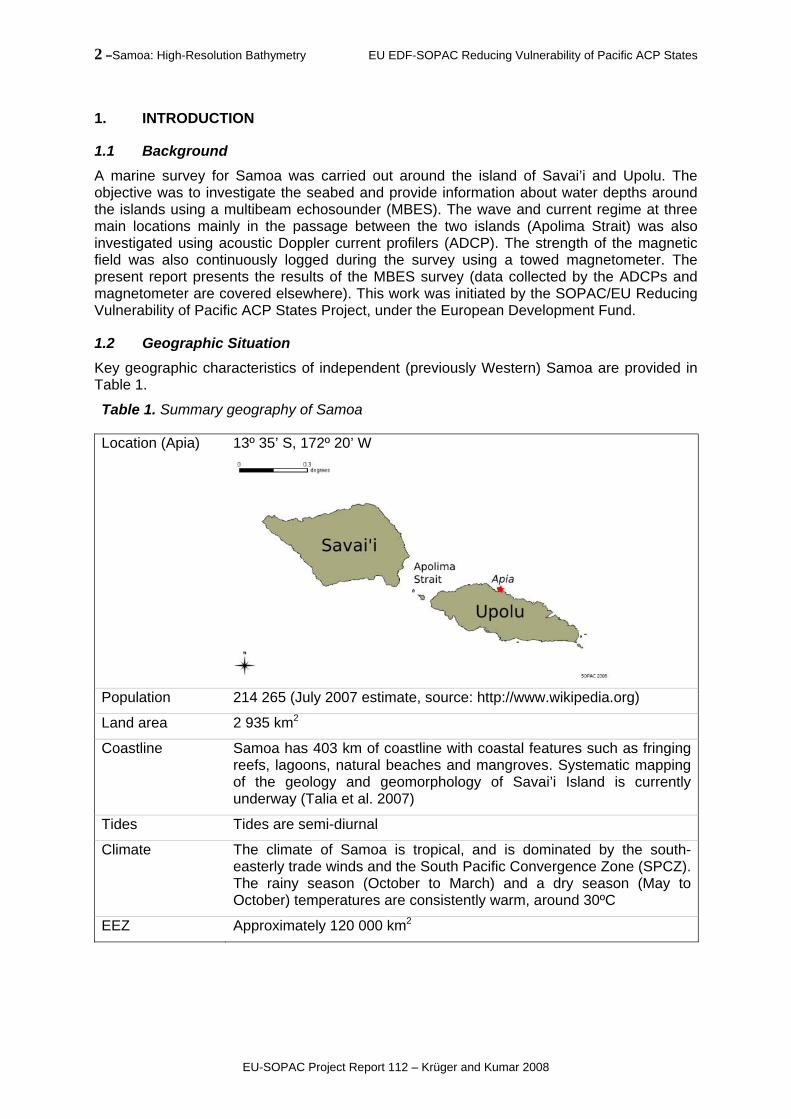
1.2 Geographic Situation Key geographic characteristics of independent (previously Western) Samoa are provided in Table 1.
Table 1. Summary geography of Samoa
Location (Apia) 13º 35’ S, 172º 20’ W
Population 214 265 (July 2007 estimate, source: http://www.wikipedia.org)
Land area 2 935 km2
Coastline Samoa has 403 km of coastline with coastal features such as fringing reefs, lagoons, natural beaches and mangroves. Systematic mapping of the geology and geomorphology of Savai’i Island is currently underway (Talia et al. 2007)
Tides Tides are semi-diurnal
Climate The climate of Samoa is tropical, and is dominated by the south-easterly trade winds and the South Pacific Convergence Zone (SPCZ). The rainy season (October to March) and a dry season (May to October) temperatures are consistently warm, around 30ºC
EEZ Approximately 120 000 km2

Samoa: High-Resolution Bathymetry EU EDF-SOPAC Reducing Vulnerability of Pacific ACP States – 3
EU-SOPAC Project Report 112 – Krüger and Kumar 2008
1.3 Geological Setting The Samoan volcanic chain lies near the north-northeast portion of the Tonga Trench. From west to east, the principal volcanic islands of independent Samoa are Savai’i and Upolu, and of American Samoa are five volcanic islands (Tutuila, Anunu, Ofu, Olosega, and Ta’u) as well as two coral atolls, Rose and Swain (Figure 2). The islands comprise a chain of predominantly basaltic volcanic domes and cones forming a central ridge along the island. This chain has been attributed either to volcanism along a seafloor fracture (Dana 1849; Kear and Wood 1959; Hawkins and Natland 1975; Natland 1980), or to a mantle plume (Farley et al. 1992; Hart et al. 2000; Courtlillot et al. 2003), as illustrated in Figure 2.
Figure 2. Illustration showing the presumed formation of the Samoan chain by movement of the Pacific crustal plate over a stationary hotspot of rising magma from the underlying mantle (Source: http://www.whoi.edu/oceanus).
The Samoan chain lies just east and 100 km north of the subduction of the Pacific plate beneath the northeastern corner of the Australian Plate at the Tonga Trench (Figure 3). The estimated westward convergence of the Australian Plate at the Tonga Trench is approximately 15 cm/yr (Lonsdale 1986). The Samoan chain is also unusual in that the islands are largest at the western end (Savai’i, Samoa), and deeply eroded in the middle (Tutuila, American Samoa); the easternmost feature (Rose Atoll, American Samoa) is a coral atoll that breaches the surface of the ocean and not an active underwater seamount (Hawkins and Natland 1975).

4 –Samoa: High-Resolution Bathymetry EU EDF-SOPAC Reducing Vulnerability of Pacific ACP States
EU-SOPAC Project Report 112 – Krüger and Kumar 2008
Figure 3. Plate tectonic map showing the major submarine tectonic features in the region (after Wright et al. 2000): the Samoan archipelago is marked by star, the Tonga Trench by a solid line with barbs on the overriding plate, the Fiji Fracture Zone and Vitiaz Trench Lineament by dashed lines, and the Louisville Ridge by a dotted line.
1.4 Previous Bathymetry Compilations Bathymetric maps are topographic maps of the seafloor, giving a descriptive picture of the ocean bottom terrain. With an exclusive economic zone (EEZ) of approximately 120 000 km2, the available bathymetric data is limited and the exact nature of seafloor is poorly known. Most available bathymetric data originates from sparse single-beam soundings from oceanographic cruises, and since the early 1970s, from MBES systems, as well as satellite-derived predicted depth (e.g. see http://topex.ucsd.edu/marine_topo/).
A bathymetry map at a scale of 1 : 375,000 at 200 m contour interval for Western Samoa was compiled by Hill and Tiffin (1991). The datasets used for this compilation are:
Seabeam bathymetry and GLORIA images of the 1989 SOPAC cruise.
SeaMARC II and 3.5 kHz echo sounder data of the 1987 RV Moana Wave cruise.
A 12-kHz echo sounder survey of Western Samoan waters conducted in 1985 by the Royal Australian Navy Detached Survey Unit aboard MV Cape Pillar.
MGD77-format geophysical data collected by oceanographic research institutions and held by the US National Geophysical Data Center in Boulder, Colorado, as well as by the SOPAC Technical Secretariat in Suva.
Soviet 1982 RV Kallisto survey (Pushchin et al. 1983) conducted over the northern Tonga Trench and adjacent area.
Data from SOPAC-Japanese joint survey on RV Natsushima (Honza et al. 1985) 1986 Tripartite II HMNZS Tui cruise (Glasby et al. 1986; Meylan 1986) office of the Royal New Zealand Navy for the General Bathymetric Chart of the Oceans (GEBCO) British Admirality Chart 1730 “Samoa Islands”, 1988 edition.

Samoa: High-Resolution Bathymetry EU EDF-SOPAC Reducing Vulnerability of Pacific ACP States – 5
EU-SOPAC Project Report 112 – Krüger and Kumar 2008
Seabeam data collected by RV Sonne (cruise SO67a) while in transit through the Western Samoan EEZ (Beiersdorf et al. 1990; Hill and Utanga 1990).
A search for public multibeam data on NOAA’s national geophysical data centre (http://map.ngdc.noaa.gov) and the Seamount Catalogue, SMNT (earthref.org) in February 2007 produced the scientific cruises for the area of interest show in Table 2.
Table 2. Public multibeam datasets for Samoa
Ship Survey ID Year
RV Washington RNDB15WT 1989
RV Revelle KIWI10RR 1998
RV Melville BMRG08MV 1996
RV Melville AVON05MV 1999
RV Melville COOK14MV 2001
RV Melville COOK20MV 2002
RV Kilo Moana KM0506 2005

6 –Samoa: High-Resolution Bathymetry EU EDF-SOPAC Reducing Vulnerability of Pacific ACP States
EU-SOPAC Project Report 112 – Krüger and Kumar 2008
2. RESULTS AND DISCUSSION
2.1 Multibeam Bathymetry The multibeam echosounder (MBES) bathymetry data acquired during this survey are available as grid files shown in Table 3 below. These grid files, as well as charts, metadata, and report, are available through the SOPAC GeoNetwork site. The report and full-size charts are also available from the SOPAC virtual library.
Table 3. MBES bathymetry grid files for the 2004 survey
Savai’i and Upolu, MBES coverage, 70 m grid.
Five-mile reef north of Apia, 10 m grid.
Apolima Strait, 10 m grid.

Samoa: High-Resolution Bathymetry EU EDF-SOPAC Reducing Vulnerability of Pacific ACP States – 7
EU-SOPAC Project Report 112 – Krüger and Kumar 2008
The bathymetry data contained in the 70 m grid file is presented on nine separate charts at a scale of 1 : 50 000 and contoured at intervals of 100 m. Reduced versions of these charts are appended to this report; an overview diagram with chart boundaries is shown in Figure 4.
Figure 4. Overview map showing the MBES bathymetry coverage acquired during the survey (blue colours indicate deep water areas, and red shallow water). Blue boxes are the chart bounds of the charts appended to this report.
The surveyed area generally extended from the inshore area to approximately 10 km offshore. Water depths within the surveyed area ranged from 5 to 80 m in the Apolima Strait to a maximum of 2000 m offshore, as dictated by the operational limit of the MBES system. Minimum water depths were measured near the coast on the outer slope of the fringing reef with depths becoming greater in a general seaward direction with irregular slope angles ranging from 0º to 83º and a mean slope angle of 31º.
2.2 Composite Grid Merging of the nearshore MBES data acquired during this survey with publicly available offshore grids (see Section 3.12 for detailed description) resulted in a 250 m grid shown in Figure 5 and Figure 6 below. This grid has been published as an A0-sized map at a scale of 1 : 250 000 by Krüger (2007), and is available through the SOPAC virtual library (chart PDF) and the SOPAC GeoNetwork site (grid file and metadata). The grid compilation is also shown as a shaded relief and slope angle maps in Figure 7 and Figure 8, respectively.

8 –Samoa: High-Resolution Bathymetry EU EDF-SOPAC Reducing Vulnerability of Pacific ACP States
EU-SOPAC Project Report 112 – Krüger and Kumar 2008
Figure 5. Digital elevation model (DEM) of Samoa compiled for this report. Land elevation (grey scale) and water depth (coloured scale) are referenced to sea level. Contour interval is 500 m. See text for details. The image shows some linear artefacts near the northern and northeastern edge of the image which are a result of the sparse data in these areas.
Figure 6. Three-dimensional perspective image of the digital elevation model of Samoa compiled for this report. The view is toward the NNW with an illumination from the NW. Elevation and depth values are in metres relative to sea level with a two-times vertical exaggeration. Scale varies in this perspective view.

Samoa: High-Resolution Bathymetry EU EDF-SOPAC Reducing Vulnerability of Pacific ACP States – 9
EU-SOPAC Project Report 112 – Krüger and Kumar 2008
Figure 7. Shaded relief map of the 250 m compiled grid of Upolu and Savai’i. The sun illumination angle is from the northwest, and the coastline is shown as a solid black line. Note the high detail in areas of multibeam echosounder (MBES) coverage.
Figure 8. Slope angle map of Samoa based on the 250 m compiled grid. Angles are shown from 50º to near-horizontal, red to blue, respectively. The striations to the north and northeast are artefacts resulting from grid interpolation in areas of poor MBES coverage.

10 –Samoa: High-Resolution Bathymetry EU EDF-SOPAC Reducing Vulnerability of Pacific ACP States
EU-SOPAC Project Report 112 – Krüger and Kumar 2008
2.3 Morphological Features Common scientific terms used to describe seabed morphology are outlined in Table 4.
Table 4. Definition of common morphological terms (adapted from IHO 2001)
Reef A ridge or mound comprised primarily of hard coral that is consolidated into limestone.
Ridge A feature of positive relief with long narrow elevation and steep sides. A ridge may comprise a line of isolated or joined pinnacles.
Pinnacle A high tower-shaped rock or coral outcrop that may be alone or close together to form a ridge like feature.
Terrace A relatively flat horizontal or gently inclined surface, which is bounded by a steeper ascending slope on one side and by a steeper descending slope on the opposite side.
Plateau A flat or nearly flat area of considerable extent, dropping off abruptly on one or more sides.
Canyon or channel A relatively narrow, deep depression with steep sides, the bottom of which generally has a continuous slope, developed characteristically on some continental slopes.
Saddle A broad pass, resembling in shape a riding saddle, in a ridge or between contiguous seamounts.
Escarpment or Scarp An elongated and narrow area of comparatively steep slope separating near-horizontal or gently sloping areas.
Shelf A zone around the island extending from the low water line to a depth at which there is a shelf break usually accompanied with a marked increase of slope toward the oceanic depths
Shelf break The line where the nearshore shelf and slope meet that marks the point of increasing seafloor gradient
Slope The area seawards of the shelf break to the upper edge of the abyssal plains
Generally, and with reference to the DTM model shown in Figure 5, Figure 6, and Figure 8, a shelf surrounds the islands of Savai’i and Upolu in water depths of approximately 100–200 m. This shelf is relatively narrow south of Savai’i and Upolu, and extends to a maximum offshore distance of 12 km northeast of Apia. The shelf occupies the broad Apolima Strait between Savai’i and Upolu. The Apolima Strait is interpreted as a drowned carbonate platform, which presumably interconnected the two islands of Savai’i and Upolu during the last glacial maximum (about 21 000 years ago) when sea level was approximately 120 m lower than today. Beyond the shelf edge, the flanks of the edifices vary greatly from place to place both in gradient and roughness. A terrace is evident in water depths of approximately 500–1200 m, exhibiting maximum widths of some 12 km (north of Apolima Strait). There are saddles that connect the terrace to the Tuapi’o and Taumatau seamount, west and north of Savai’i, respectively. A third saddle lies between the southeast of Upolu and the Tisa seamount.
The limited coverage and absence of any additional ground-truthing data prevents a detailed description of the seabed morphology, which is also beyond the scope of this survey report. The deeper submarine morphology of Savai’i and Upolu is described in more detail from sidescan sonar studies in Keating et. al. (2000), and Hill and Tiffin (1993). However, a brief summary of the dominant morphological features on each chart (see overview in Figure 4) as interpreted from the MBES data is presented in Table 5.

Samoa: High-Resolution Bathymetry EU EDF-SOPAC Reducing Vulnerability of Pacific ACP States – 11
EU-SOPAC Project Report 112 – Krüger and Kumar 2008
Table 5. Description of morphological features on the new bathymetric charts
Chart 1 A narrow shelf runs along the northern and southern coasts of Savai’i island, terminating at a shelf break in approximately 150 m water depths. The break exhibits an average slope angle of around 40º. Note that the vessel surveyed across the shelf in a water depth of around 100 m at the western extent of the island. The seafloor is relatively featureless except for a few bathymetry highs at the southwestern corner.
Chart 2 The MBES coverage shows the shelf break at water depths of 200 m, with some minor channels originating at the headscarp. The seafloor is predominantly featureless except for a saddle at 500 m that extends to the Taumata seamount.
Chart 3 This chart shows a large extent of the Apolima Strait at water depths of generally 100–200 m, with predominantly featureless seabed. A shelf break is well defined at depths of 200–700 m, before leveling off into a deeper terrace that extends into water depth of 1200 m. One of the dominant features is a plateau approximately 27 km north of Leulumoega, rising to about 100 m below sealevel from the surrounding terrace in 600 m water depths. Slope angles of the plateau are between 55º to 65º with a maximum of 70º. At its peak in water depths of 100 m, the plateau has an areal extend of 1.3 km2. An escarpment that terminates the terrace is evident at water depths of approximately 1200 m running for approximately 8 km in a seaward convex arc subparallel to the shoreline.
Chart 4 This chart shows good coverage of the shelf and its termination at the shelf break in water depth of 100 m water depth with an average slope angle of 65º. A continuation of the subparallel escarpment is also evident in water depths of 1200–1700 m. The terrace bound to the south by the shelf break and by the escarpment to the north exhibits numerous channels, predominantly in the area situated 20 km to the north of Apia.
Chart 5 The shelf and shelf break continues as described above. The escarpment described from Charts 3 and 4 above is less pronounced in the area shown in Chart 5. Numerous small channels are seen originating from the base of the terrace.
Chart 6 The area shown in this chart covers the southeastern extend of Upolu island. The shelf is at its maximum width at some 8 km to the northeast of Amaile. The dominant feature is the highly irregular seabed with numerous pinnacles to the southeast of Nu’ulua Island, forming a saddle to the Tisa seamount. The southern inshore area of Upolu has a shelf width of approximately 2 km, with a ridge protruding into the slope approximately 3.5 km south of Matavai.
Chart 7 The shelf break is narrow and occurs at approximately 2 km offshore in the east of the chart, widening toward the west to 7 km offshore. Numerous small channels originate at the base of the shelf break scarp.
Chart 8 The predominantly flat and featureless Apolima Strait shown to the north of Chart 8 drops off at slope angles locally exceeding 60º. A 2–3.5 km wide terrace lies below the shelf break in water depths of 600–1200 m. The terrace is incised by numerous channels that continue into 2000 m water depths.
Chart 9 The shelf south of Savai’i is relatively narrow, with the break occurring approximately 2 km offshore. The shelf slope exhibits an average angle of around 35º, and is incised by some minor channels.

12 –Samoa: High-Resolution Bathymetry EU EDF-SOPAC Reducing Vulnerability of Pacific ACP States
EU-SOPAC Project Report 112 – Krüger and Kumar 2008
3. DATA ACQUISITION AND PROCESSING
Fieldwork can be summarised as follows:
3.1 Survey Particulars
Survey vessel: RV Turangalevu
Fieldwork date: 27/01/04 to 01/03/04. All dates and times in this report are given in the local Samoa time zone (11:00h GMT = 23:00h local).
Equipment used: Reson 8160, deep water MBES.
3.2 Field Personnel
SOPAC: Quan Chung (Project Technician) and Ed Saphore (Marine Consultant)
Vessel: Steven Hay (Captain), Jon Tikokandavu (Engineer), Edward Smith (Crew).
Observers: Dean Solofa (Officer), Ausentalia Titimaea (Head of Meteorology Department), Lameko Talia (Geological Dept), Happy Valley Patu (Geological Dept), Isoposeta Upuse (Hydrology Dept), Faigame Sale (Geological Dept), Mafutaga Sela (Hydrology Dept), Pitone Taulia (Hydrology Dept), Mulipolu Antonio (Acting Director Fisheries).
3.3 Geodetic Reference System The survey was conducted in the Western Samoa Integrated Grid as defined in Table 6A. The final grid ASCII files were converted to UTM2S for charting purposes using the Blue Marble Geographic Calculator v3.01 software. Therefore, the resulting charts are defined in the coordinate system shown in Table 6B:
Table 6A. Geodetic datum – WGS 72 (local determination)
Ellipsoid WGS 72
Semi-major axis (a) 6378135.0000
Semi-major axis (b) 6356750.5200
Flattening 1/298.26
Origin Observation Doppler (011)
Latititude 13 48 52.98 (S)
Longitude 171 46 51.33 (W)
Height (MSL) 0.91 m
Projection name Western Samoa Integrated Grid (WSIG)
Longitude of origin 172 degrees West
Latitude of origin equator
False easting 700000 m
False northing 7000000 m
Central scale factor 1.0000
Zone width 2 degrees

Samoa: High-Resolution Bathymetry EU EDF-SOPAC Reducing Vulnerability of Pacific ACP States – 13
EU-SOPAC Project Report 112 – Krüger and Kumar 2008
Table 6B. Geodetic datum – Universal Transverse Mercator Zone 2 South
Ellipsoid WGS84
Semi-major axis (a) 6378137.000
Semi-major axis (b) 6356752.314
Inverse flattening (1/f) 298.257223563
Eccentricity sq. (e2 ) 0.0066943800
Projection UTM Zone 02 South
Projection type Transverse Mercator
Origin latitude 00° 00' 00.000" South
Origin longitude 171° 00' 00.000" West
Origin false easting 500000.0000
Origin false northing 10000000.0000
Scale factor 0.9996000000
Grid unit metres
3.4 Vessel Description and Static Offsets Details regarding the survey vessel are shown in Figure 9 and Figure 10.
Figure 9.The chartered survey vessel Turagalevu. Note the portside pole mount with fore and aft stabilisers.

14 – Samoa: High-Resolution Bathymetry EU EDF-SOPAC Reducing Vulnerability of Pacific ACP States
EU-SOPAC Project Report 112 – Krüger and Kumar 2008
Sensor X (m) Y (m) Z (m)
Reference point at water level 0.00 0.00 0.00
Motion reference unit (MRU) 0.00 0.00 –0.28
Positioning antenna (GPS) 1.72 2.31 6.56
Multibeam echosounder (MBES) 2.94 4.33 –0.75
Winch N/A
Vessel
Name RV Turagalevu
Length overall 18 m
Breadth (mid) 6 m
Draft (mid) 1.5 m
Displacement 26 t
Port of registry Suva
Radion Call Sign 3DN6531
Classification Westcoaster, Freemantle, Australia
Figure 10. Diagrams and measurements of the chartered survey vessel Turagalevu.
+X
-X
+Y-YWinch
MBES
MRU
GPS
Not to scale
MBES
Winch
GPS
-Z
+Z
+Y-Y
Water level
MRU

Samoa: High-Resolution Bathymetry EU EDF-SOPAC Reducing Vulnerability of Pacific ACP States – 15
EU-SOPAC Project Report 112 – Krüger and Kumar 2008
3.5 Positioning Control The vessel's reference point (X=0, Y=0, Z=0) was the motion reference unit (MRU) position at the waterline. Positioning was by stand-alone GPS, using an Ashtech Aquarius dual-frequency receiver. A good satellite constellation status was observed throughout the survey. The patch test was conducted in Suva, Fiji, using RTK GPS.
3.6 Survey Computer The survey computer was a Windows 2000 PC running Navisoft 2.2.2. This computer was used for continuous on-line data logging and computation of positioning and digital bathymetry. The package also provided a line control display for the helm. The on-line operator continuously monitored a range of quality control parameters.
An off-line Navisoft 2.2.2 package was used in the office for replaying and post-processing of track data and bathymetry. An A0 plotter was available for the production of charts.
3.7 Multibeam Echosounder A Reson SeaBat 8160 multibeam echosounder (MBES) was temporarily installed on MV Turangalevu (Figure 9 and Figure 10), and used to provide swath bathymetry data. A MBES provides high-resolution information about the depth of water from the surface to the seafloor in a water body. The main instrumental and operating parameters are:
3.7.1 Instrumentation
Multibeam echosounder Reson SeaBat 8160
Transducer mount Port side pole-mounted
Motion reference unit TSS DMS 2-05 Dynamic Motion Sensor
Gyro SG Brown Meridian Surveyor Gyro Compass
Sound velocity probe at transducer Installed
3.7.2 Operating Parameters 8160
Transducer Frequency 50 kHz
General water depth 10–2000 m
Average ship's speed 7 knots (3.6 m/s)
Transmit Power Variable 1–16
Pulse length Variable 0.5–10.0 ms
Horizontal coverage Approximately two times water depth
No of beams / beam spacing 126 / 1.2°
Ping rate Variable
3.7.3 Dynamic Offset Calibration Suva, Fiji, 27 January 2004
Roll correction –0.79
Pitch correction 10.45
Yaw correction 2.87
GPS Latency correction 4070
Gyro correction Not determined

16 – Samoa: High-Resolution Bathymetry EU EDF-SOPAC Reducing Vulnerability of Pacific ACP States
EU-SOPAC Project Report 112 – Krüger and Kumar 2008
3.8 Multibeam Echosounder Data Processing On return to the SOPAC office in Suva a combination of Navisoft Sweep 2.2.2 and Terramodel / Terravisualiser 10.30 software was used for the post-processing of the MBES survey data. Post-processing is a form of data reduction which involves checking, calibration, cleaning and preparation necessary to convert raw measurements into a form suitable for analysis, application and presentation. The product of post-processing is in the form of ASCII listings of gridded easting, northing, and depth (XYZ) points. Gridded XYZ points were used in Surfer 8.05 to produce final charts and figures. The post-processing and chart production sequences are listed in Tables 7A and 7B.
Table 7A. Post-processing sequence
Phase 1 Correct for sound velocity, tide, and patch test parameters using the Navisoft Sweep ‘Calculate’ program. This process converts RAW files into PRD files.
Phase 2 Editing and de-spiking of soundings in PRD files using the Navisoft Sweep ‘Data Edit’ module.
Phase 3 Deleting, interpolation, and manual editing of single and multiple points using the editor’s interactive tools.
XYZ output Cleaned PRD files are recorded on to a grid file in the Navisoft Sweep ‘Data Exchange’ Module, and exported as an ASCII XYZ file (easting, northing, depth) in the project coordinate system. The exported ASCII XYZ file is imported in Trimble’s Terramodel Terravisualiser where a final data cleaning process for outliers was carried out.
Table 7B. Chart Production Sequence
XYZ to grid XYZ data are reduced and gridded to approximately 1 mm (0.1%) at the charting scale. In the case of this survey, the final grid was created at a resolution of 70 m or less (see Figure 4).
Digital terrain model (DTM) A surface model is created from the grid. A search radius of approximately three times the grid spacing is used to fill data gaps. The DTM is also blanked against regions that contain no valid data such as land and shallow reef areas.
Chart output Various levels of smoothing are applied to the DTM and contours to give a realistic impression of the seabed, without removing any real features from the data set.
3.9 Multibeam Backscatter The MBES records echo strength data (reflected energy) that can be presented as seabed backscatter maps, similar to sidescan sonar mosaic, or backscatter image, shows information on the composition of the seafloor. The backscatter signal recorded during this survey was either faulty or not present, and is thus not presented here.

Samoa: High-Resolution Bathymetry EU EDF-SOPAC Reducing Vulnerability of Pacific ACP States – 17
EU-SOPAC Project Report 112 – Krüger and Kumar 2008
3.10 Tidal Information Observed soundings were reduced to chart datum using water level elevations for the port of Apia as predicted by the computer software Wxtide (freely available at www.wxtide32.com). Predicted amplitudes were found to be accurate when compared to official tidal water levels as reported by the United Kingdom Hydrographic Office (easytide.ukho.gov.uk), with a minimal difference in phase, as Wxtide lags the Admiralty predictions by two minutes. This seems to suggest that Wxtide makes use of the full harmonic dataset available for Apia.
The Wxtide predictions were also compared to measured water elevations downloaded from the National Tidal Centre (NTC), Bureau of Meteorology in digital format (www.bom.gov.au). The results are plotted in Figure 11, showing a ten-day period from 30 January to 8 February 2004. There is a consistent difference between the two measurements, with predicted tide levels as given by Wxtide consistently lower by approximately 0.26 m than observed tide gauge records. The Apia tide gauge was deployed by the NTC in 1993, as part of the South Pacific sea level and climate monitoring program, and has well established levels shown in Figure 12. The tidal value reported by the tide gauge is relative to the lowest astronomical tide (LAT), which is also tide gauge zero (NTC 2006). Harmonic analysis of tide gauge data shows the zero frequency level to be 0.75 m above tide gauge zero (NTC 2008). The predicted tidal values for Apia are very closely aligned to those published in the US Tidal Tables for the Central and Western Pacific Ocean, and are given relative to chart datum, which is approximately the level of Mean Lower Low Water, 0.49 m below Mean Sea Level (personal communication John Page, Head of Tides, UKHO). Soundings in this report are therefore relative to chart datum, which is 0.26 m above tide gauge zero, or 3.20 m below BM48.
Figure 11. Tidal elevations as measured by the Apia tide gauge (blue line marked with x) and referenced to lowest astronomical tide (LAT); and tidal elevations predicted by Wxtide (thick red line marked with o) above chart datum, for a period of 10 days in 2004. The two curves show good agreement with an average residual of 0.26 m (see text).

18 – Samoa: High-Resolution Bathymetry EU EDF-SOPAC Reducing Vulnerability of Pacific ACP States
EU-SOPAC Project Report 112 – Krüger and Kumar 2008
Figure 12. Definition of levels for the tide gauge at Apia, Samoa (NTC, 2006).
3.11 Sound Velocity Profiling The accuracy of the depth soundings depends in part on the variation of the speed of sound with water depth. Sound velocity profiles are therefore required in order to find the correct depth and location of water depth soundings. The speed of sound in seawater varies with temperature, salinity and depth, and was determined by measuring the conductivity, temperature and depth (CTD) through the water column. The main instrumental, operational, processing parameters are listed below.
3.11.1 CTD Instrumentation
Make SeaBird Electronics
Model SeaCat 19+ (self-powered, self-contained)
Serial number 4172
Depth rating 3000 m
3.11.2 Operating Parameters
Sample rate 1 scan every 0.5 s
Maximum depth Limited to 400 m due to wire rope length
Data recorded Profiles of conductivity, temperature, and pressure
3.11.3 Data Processing
Positioning The profile position was taken at the GPS antenna near the start of the downcast. No allowance was made for instrument or vessel drift over the duration of the profile, which may be significant (>500 m).

Samoa: High-Resolution Bathymetry EU EDF-SOPAC Reducing Vulnerability of Pacific ACP States – 19
EU-SOPAC Project Report 112 – Krüger and Kumar 2008
Data conversion Convert raw data (.hex) to a .cnv file. The following values are output from the recorded data:
Pressure, dbar
Depth, m (derived using salt water at local latitude)
Temperature, ºC (ITS-90)
Salinity, psu (derived)
Density, kg m–3 (derived)
Sound velocity, m s–1 (derived using Chen and Millero 1977)
Bin average Average data into 1 m depth bins. No filtering was applied.
Output Processed data is saved in ASCII text format with the file name date_location_bin.cnv.
The CTD profile details are listed in Table 8, and locations are shown in Figure 13. The summaries of the CTD profile data in graphical form are shown in Appendix 2.
Table 8. CTD profile details
Open water Profile Date Time Easting Northing Total Water Depth (m)
CTD cast 1 04/02/04 14:45 413209.94 8481471.71 600
CTD cast 2 08/02/04 15:30 385674.43 8477374.19 100
CTD cast 3 15/02/04 12:42 379258.04 8489393.16 800
CTD cast 4 17/02/04 06:31 425348.55 8447873.59 15
CTD cast 5 17/02/04 08:25 447067.76 89443917.7 900
CTD cast 6 17/02/04 13:57 461912.81 8455694.62 1000
CTD cast 7 17/02/04 16:09 445479.40 8469799.87 1000
CTD cast 8 19/02/04 13:28 380965.06 8504165.98 2000
CTD cast 9 23/02/04 10:49 364286.00 8460542.41 1300
CTD cast 10 29/02/04 13:53 310366.38 8509406.56 600
The on-board CTD probe could only be operated to maximum depth of 400 m due to restrictions on the wire rope length. The ship-based profile data were not complemented with external sources of sound velocity data, and corrections where therefore not applied for depths exceeding 400 m.

20 – Samoa: High-Resolution Bathymetry EU EDF-SOPAC Reducing Vulnerability of Pacific ACP States
EU-SOPAC Project Report 112 – Krüger and Kumar 2008
320000 340000 360000 380000 400000 420000 440000 460000
8460
000
848
0000
850
0000
0km 10km 20km 30km 40km
SAVAI'I
UPOLU
12
3
4 5
6
7
8
9
10
Figure 13. Map showing the location of CTD profiles with cast numbers for Samoa.
3.12 Composite DTM Model Publicly available bathymetry and topography data for the area on interest, approximately 230 x 190 km centred on Savai’i and Upolu, was collated as summarised below and in Figure 14.
S2004 This global grid is a blend of Smith and Sandwell (1997) bathymetry derived from satellite altimeter measurements below 1000 m depth, and General Bathymetric Chart of the Oceans (GEBCO) data in shallow water. Grid spacing is approximately 2 km (as referenced in Marks and Smith, 2006). (source: ftp://falcon.grdl.noaa.gov/pub/walter/Gebco_SandS_blend.bi2, accessed February 2007).
SOPAC/EU MBES data acquired under EU funding as documented in this report.
SMNT The Seamount Catalogue (SMNT) is a digital archive for seamount maps, containing multibeam data files collected by oceanographic survey vessels. Public MBES bathymetry for Savai’i and Upolu were obtained from the Seamount Catalogue (source: http://earthref.org, accessed February 2007). This data consisted of raw data files gridded at 180 m from the scientific cruises listed in section 1.4. The data contained considerable noise and many outliers, and was therefore manually cleaned using the hydrographic software package Hypack before being integrated into the dataset as described below.
SRTM Global land elevation data from the Space Shuttle Topography Mission, 2000. Global elevation data are available at a grid spacing of 90 m (source: http://seamless.usgs.gov, accessed February 2007).

Samoa: High-Resolution Bathymetry EU EDF-SOPAC Reducing Vulnerability of Pacific ACP States – 21
EU-SOPAC Project Report 112 – Krüger and Kumar 2008
Figure 14. Coverage map for the datasets summarised in the section above.
The datasets outlined above were merged using Golden Software Surfer 8.05, at a grid spacing of 250 m through the following method:
(1) Created multibeam grid by mosaicing SMNT and SOPAC/EU data.
(2) Calculated residual surface between S2004 and grid (1).
(3) Applied low-pass filter to grid (2) in areas with no multibeam coverage.
(4) Added residual grid from step (3) to S2004 grid.
(5) Replaced land areas with SRTM values in final grid.

22 – Samoa: High-Resolution Bathymetry EU EDF-SOPAC Reducing Vulnerability of Pacific ACP States
EU-SOPAC Project Report 112 – Krüger and Kumar 2008
4. REFERENCES
Beiersdorf, H. and Shipboard Party 1990: Geoscientific investigations at the Manihiki Plateau (Southwest Pacific Ocean), research cruise SO 67-1 with RV Sonne, February 19 to March 16, 1990, Final report. Bundesanstalt für Geowissenschaften und Rohstoffe, Hannover, 130 p.
Chen, C.T. and Millero, F.J. 1977: Speed of sound in seawater at high pressures. Journal of the Acoustical Society of America 62(5): 1129–1135.
Courtillot, V., Davaillie, A., Besse, J. and Stock, J. 2003. Three distinct types of hotspots in the Earth’s mantle, Earth planet Science Letters 205: 295–308.
Dana, J.D. 1849: U.S. Exploring Expedition during 1838–1842 under the command of Charles Wilkes, U.S.N., Geology 10: 307–336.
Farley, K.A., Natland, J.H., CRAIG, H. 1992. Binary mixing of enriched and undegassed (primitive?) mantle components (He, Sr, Nd, Pb) in Samoan lavas. Earth and planetary science letters 111(1): 183–199.
Generalised Digital Environmental Model. GDEM. https://128.160.23.42/gdemv/gdemv.html
Glasby, G.P., Meylan, M.A., McKelvey, B.C., Hill, P.J., Utanga, A.T., Helu, S.P., Rose, K.H. Main, W. del. and Arron, E.S. 1986: Geological and Geophysical studies of the Manihiki Plateau and adjacent seamounts and islands in the S.W. Pacific: HMNZS Tui cruise, 1986. Report prepared for the 16th session, CCOP/SOPAC, Raratonga, Cook Islands.
Global Topography. GTOPO. http://topex.ucsd.edu/marine_topo/mar_topo.html. Global topography data is available from: http://topex.ucsd.edu/cgi-bin/get_data.cgi
Hart, S.R., Studigel, H., Blusztaijn, J., Baker, E.T., Workman, R., Jackson, M., Hauri, E., Kurz, M., Sims, K., Fornari, D., Sael, A., and Lyons, S. 2000: Vailulu’u undersea volcano: the new Samoa, Geochemistry, Geophysics and Geosystems, 1;2000GC000108, 1–13.
Hawkins, J.W. Jr., and Natland, J.H. 1975: Nephelinites and basanities of the Samoan linear volcanic chain: their possible tectonic significance. Earth Planet Science Letters 24: 427–439.
Hill, P.J. and Tiffin, D.L. 1991: Marine geology and geophysics of the Western Samoan Exclusive Economic Zone; Results of Gloria, SeaMARC II and other shipboard studies, SOPAC Technical Report 135, 1–28.
Hill, P.J., and Tiffin, D.L. 1993: Geology, sediment patterns, and widespread deformation on the sea floor off Western Samoa revealed by wide-swath imagery. Geo-Marine Letters 13: 116–125.
Hill, P.J. and Utanga, A.T. 1990: Report on RV Sonne cruise to Manihiki Plateau, BGR Cruise SO67-1, February-March 1990. SOPAC Cruise Report 133, 22 p.
Honza, E, Lewis, K.B. and Shipboard Scientific Party 1985: Marine Geological and Geophysical Survey of North Tonga Ridge and Adjacent Lau Basin. CCOP/SOPAC Cruise Report 105, 29 p.
IHO 2001. Standardisation of undersea feature names: Guidelines, proposal form, terminology, International Hydrographic Bureau / Intergovernmental Oceanographic Commission, Monaco, p. 40.
Kear, D. and Wood, B.L. 1959. The geology and hydrology of Western Samoa. New Zealand Geological Survey Bulletin 63
Samoa: High-Resolution Bathymetry EU EDF-SOPAC Reducing Vulnerability of Pacific ACP States – 23
EU-SOPAC Project Report 112 – Krüger and Kumar 2008
Lonsdale, P. 1986: A Multibeam reconnaissance of the Tonga Trench axis and its intersection with the Louisville Guyot Chain, Marine Geophysical Researches 8: 295–327.
Keating, B.H., C.E. Helsley, and Karogodina I. 2000: Sonar studies of submarine mass wasting and volcanic structures off Savaii Island, Samoa. Pure and Applied Geophysics 157: 1285–1313.
Krüger, J. 2007: Composite bathymetric map of Samoa: Upolu and Savai’i. 1 : 250 000 Bathymetric Series Map 41. A0 map.
Lonsdale, P. 1986: A Multibeam Reconnaissance of the Tonga Trench Axis and its Intersection With the Louisville Guyot Chain, Marine Geophysical Researches 8: 295–327
Marks, K.M. and Smith, W.H.F. 2006: An evaluation of publicly available global bathymetry grids. Marine Geophysical Researches 27(1): 19–34
Meylan, M.A. 1986: A geophysical/geological cruise by HMNZS Tui to Manihiki Plateau and Adjacent Southwest Pacific areas including the investigation of cobalt crusts and manganese nodules as part of the Tripartite II Programme, March–May, 1986. CCOP/SOPAC Cruise Report 107, 17 p.
National Tidal Centre, Australian Bureau of Meteorology, 2008. Unpublished tidal constituents derived from analysis of SPSLCMP sea level data (1992 to 2005).
National Tidal Centre, Australian Bureau of Meteorology, 2006. Pacific Country Report, Sea Level & Climate: Their Present State, Samoa. 32 p.
Natland, J.H. 1980: The progression of volcanism in the Samoan linear volcanic chain. American Journal of Science 280A (Jackson Volume): 709–735.
Pushchin, I.K. and Shipboard Scientists 1983: New data on Tonga Trench geology (account of geological and geophysical research during the 16th R/V Kallisto cruise, 1982). Academy of Sciences of the USSR, Far East Science Centre, Pacific Oceanological Institute. Vladivostok, 245 pages.
Reson Inc. (2002), Seabat 8160 Multibeam Echo Sounder system Operator’s manual v. 3.00
Smith, W.H.F. and Sandwell, D.T. 1997: Global seafloor topography from satellite altimetry and ship depth soundings. Science 277: 195–196. http://topex.ucsd.edu/marine_topo/mar_topo.html
Talia, L., Taape, S., Chang, S.W., Kim S.P., and Chang, J.H. 2007: The geological and geomorphological mapping of Savai’i Island, Samoa 2005–2007. Abstracts of papers presented at the STAR session 2007. SOPAC Miscellaneous Report 650, p.73.
Wright, D.J., Bloomer, S.H., Macleod, C.J, Taylor, B. and Goodlife, A.M. 2000: Bathymetry of the Tonga Trench and forearc: A map series, Marine Geophysical Researches 21(5): 489–511.

24 – Samoa: High-Resolution Bathymetry EU EDF-SOPAC Reducing Vulnerability of Pacific ACP States
EU-SOPAC Project Report 112 – Krüger and Kumar 2008
APPENDICES
Appendix 1 – Equipment Performance, Statement of Uncertainty, and Suitability for Charting Bathymetric maps are topographic maps of the sea floor. The bathymetric map serves the basic tool for performing scientific, engineering, marine geophysical and environmental studies. The information presented in this report and enclosed charts are intended to assist persons and authorities engaged in recreation, tourism, marine resource related industries, hydrographic mapping, coastal development, trade and commerce, sovereignty and security, and environmental management. It is therefore important that users be informed of the uncertainties associated with the data and with products constructed from it. The following is an outline of the survey equipment used and the operating principles, including limitations and estimates regarding the data accuracy.
A1.1 Horizontal positioning
The methods used to acquire survey data will affect the final product accuracy. The global positioning system, GPS, uses radio signals from satellites that orbit the earth to calculate the position of the GPS receiver. Standalone GPS has an estimated accuracy as good as approximately 10 m, depending on satellite configuration and atmospheric conditions. In addition to this, equipment and measurements errors also need to be considered.
A general rule of thumb is that surveys should be conducted with a positioning accuracy of 1 mm at the scale of the chart. Therefore, at a scale of 1 : 10 000, the survey would be required to be accurate to 10 m.
The present S-44 4th Edition Standard of the International Hydrographic Office (IHO) includes a depth-dependent factor that takes into account the added uncertainty of the positions of soundings from multibeam echo sounder systems as depth increases. The relevant survey orders are listed in Table A1.1, with multibeam surveys conducted by SOPAC generally falling into orders 2 and 3.
Table A1.1. Recommended accuracy of survey orders
Survey order Application Recommended accuracy
Order 1 Harbours and navigation channels 5 m + 5% of depth
Order 2 Depths < 200 m 20 m + 5% of depth
Order 3 Depths > 200 m 150 m + 5% of depth
For the purpose of this survey, it was assumed that the use of GPS provided adequate precision in terms of horizontal position. Therefore, it is not recommended to interpret nearshore data at scales larger than 1 : 10 000, or a grid size smaller than 10 m. For areas with water depths greater than 200m, a charting scale of least 1 : 50 000 is recommended.
A1.2 Depth measurements
Bathymetric maps provide information about the depth of water from the water surface to the seabed. Through the use of detailed depth contours and full use of bathymetric data, the size, shape and distribution of underwater features are clearly revealed. The depth is measured using a ship-mounted Multibeam echo sounder (MBES). The MBES transducer produces an acoustic pulse designed as a fan that is wide in the across-track and narrow in the along-track direction (Figure A1.1). The seabed covered by this beam typically returns good data over a swath that is two to three times the water depth. The pulse of sound emitted from the MBES travels through the water column and is reflected back as an echo and received as numerous narrow beams by the receiving elements of the MBES. The measurements are time-based, and by using the speed of

Samoa: High-Resolution Bathymetry EU EDF-SOPAC Reducing Vulnerability of Pacific ACP States – 25
EU-SOPAC Project Report 112 – Krüger and Kumar 2008
sound in seawater each time is converted first to a range and then, knowing the beam angle, to a depth. The distance to the seabed is then combined with the movement of the vessel to stabilise it into a real-world framework. The framework is then positioned to provide XYZ soundings for each beam’s interaction with the seabed. A series of these swaths are then combined to produce a three-dimensional representation of the seafloor topography.
The accuracy of the MBES system is critically dependent on the corrections applied for vessel motion (heave, pitch, roll, yaw, and heading). However, the absolute accuracy of single-beam and multibeam bathymetry depends on several factors that are not easy to determine. For single beam data, probably the principal errors that may be introduced are due to topographic features falling between survey lines. Multibeam systems give far better coverage.
The S-44 4th Edition Standard of the IHO lists values “a” and “b” (Table A1.2) that should be introduced into the following equation to calculate the error limits for depth accuracy:
22 dba , where d = depth.
Table A1.2. Values for calculating error limits for depth accuracy
Survey order Application Constants
Order 1 Harbours and navigation channels a = 0.5 m, b = 0.013
Order 2 Depths < 200 m a = 1.0 m, b = 0.023
Order 3 Depths > 200 m a = 1.0 m, b = 0.023
For example, the IHO recommends that a near-shore coastal survey (Order 2) in water depths of 20 m should have a maximum error of ±1.1 m.
A MBES has, as any other measuring instrument, an inherent limit in its achievable accuracy. The total measurement accuracy, i.e. the uncertainty in the depth and location of the soundings, also depends upon the errors of the auxiliary instruments such as the motion reference unit, the gyro compass, and the measurements of the speed of sound through the water column. The sea state at the time of the survey also contributes significantly to the quality of the data. The possible accuracy of the measured depths may be estimated by considering the following main error sources.
Figure A1.1. Conceptual illustration of bathymetric data acquisition with a Multibeam echosounder, MBES (source: http://www.rcom.marum.de, accessed 10/01/2007).

26 – Samoa: High-Resolution Bathymetry EU EDF-SOPAC Reducing Vulnerability of Pacific ACP States
EU-SOPAC Project Report 112 – Krüger and Kumar 2008
A1.3 Error budget analysis for depths
Measurement The nadir-beam bottom detection range resolution of the multibeam system has a maximum limit of 0.1 m (Reson, 2002). However, multibeam systems are particularly susceptible to errors in the far range (outer beams), and detection is estimated at ±0.3 m plus 0.5 % of the depth. Errors also include the detection of the sea floor due to local variations of depth within the beam footprint, especially in the outer beams, and a varying density of the bottom material. This may be significant if a relatively low frequency transducer is used on soft marine muds in shallow water.
Transducer draft The transducer depth may be accurate to ± 0.1 m. However, the draft of the vessel due to the variability in vessel loading, e.g. fuel and fresh water storage, was not determined. It is estimated that this introduced a water depth independent error of up to ± 0.2 m. Dynamic draft errors, e.g. vessel squat, may also be significant.
Sound velocity The sound velocity profiles measured by the conductivity-temperature-depth sensor (CTD) probe did not reach full survey depths in waters exceeding 400 m water depths. An inaccurate sound path from the transducer to the bottom and back will affect not only the observed depth of water, but also the apparent position of the observed sounding. This error is presumed to exceed 0.5% of the water depth beyond the direct CTD measurements. In order to minimise this error, ARGO and GDEM data may be used to supplement the CTD data.
Heave This error is directly dependent on the sea state and the sensitivity of the motion sensor and installation parameters. The MRU installation did not account for the offset distance between MRU, the centre of gravity, and the MBES transducer mount. The software was able to perform lever arm calculations and heave compensation during post-processing, and the vertical error is assumed to be significant only in heavy seas.
Tide/water level Uncertainties due to tides may be significant, especially where predicted tides some distance from the survey area are used. Perhaps ± 0.3 m for uncertainty in tidal datum need to be considered.
From the listing above, it is estimated that the measured depths in 20 m have an uncertainty of ± 1.5 m. However, the complete bathymetric model, or digital terrain model (DTM), is based on some form of interpolation between the sampled depths from several survey lines. Consequently, the total uncertainty associated with a bathymetric model will include uncertainties due to horizontal positioning, and uncertainties introduced by the interpolation process, and will therefore be larger than the depth sounding uncertainty.
A1.4 Multibeam echosounder data density
The density of data used to construct a bathymetric grid is an important factor in its resolution – the denser the data, the higher the resolution that can be achieved. Sounding density is critical in terms of seabed feature detection and delineation. The two main factors that control the potential bathymetric target resolution capability of a multibeam echosounder are the distance between individual soundings (both in the cross-track and along-track dimensions), and the footprint size. The footprint is the area on the bottom covered by the sound pulse. Footprint size is a function of range, beam angle, and receiver and transmitter beam widths. A high sounding density and small footprint will result in higher-resolution data. Conversely, the target detection capability is going to decay as a result of a growing projected beam footprint and decreasing data density.
The along-track spacing is controlled by the ping rate, which in turn is limited by the two-way travel time from the source to the furthermost point imaged. The maximum across-track spacing depends

Samoa: High-Resolution Bathymetry EU EDF-SOPAC Reducing Vulnerability of Pacific ACP States – 27
EU-SOPAC Project Report 112 – Krüger and Kumar 2008
again primarily on the range, but also on the equiangular beam spacing. The size of the beams received by the MBES system is between one and one-and-a-half degrees. This means that a system mounted on a ship will have a larger projected footprint as the water depth increases. The footprint will also be larger at the outer beams than at the centre of the swath, as the range and incident angles increase with distance from the nadir beam. It is possible to have local variations of depth within the beam footprint, causing vertical error and affecting amplitude detection.
Table A1.3 shows a summary of the projected beam footprint size under varying water depths for the two MBES systems currently in use by SOPAC. It should be noted that the higher frequency system (SeaBat 8101) is not appropriate for applications in waters deeper than 200 m. Due to the constant beam width; the sounded area varies according to the depth and slope, which results in a variable data density in the survey area.
Table A1.3. Projected footprint size under varying water depths
Water depth
SeaBat 8160 (deep water) 50 kHz, 126 beams at 1.5
SeaBat 8101 (shallow water) 240 kHz, 101 beams at 1.5
(m) Inner footprint at
nadir (m) Outer footprint at
65º (m) Inner footprint,
nadir (m) Outer footprint
(m)
20 0.5 2.8 0.5 3.5
50 1.3 7.0 1.3 17.6
100 2.7 14.0 2.6 35.3
200 5.3 28.0 5.2 70.6
500 13.3 69.9 N/A N/A
1000 26.7 139.8 N/A N/A
1500 40.0 209.8 N/A N/A
2000 53.4 279.7 N/A N/A
Table A1.3 assumes a horizontal seabed, and shows the variation in across-track footprint size with water depth and beam angle. The sounding density and swath width will also vary when surveying steep slopes, or highly incised margins, as the footprint size varies strongly with topography. Therefore, deeper sections have larger projected footprints and fewer data point. This has the effect that a bathymetric feature whose lateral dimensions are less than the beam footprint size will not be resolved.
It should also be noted that the along-track resolution usually exceeds the across-track resolution due to ping rates, especially in deep water. Since ping rates are limited by the two-way travel time, rates for water depths of 20 m and 1500 m are 12.9 and 0.2 pings per second, respectively. Using maximum ping rates, or when surveying in deep water, the same area may be measured with the outer beams for several pings, which may give inconsistent sounding data due to the poor repeatability on uneven seabed.
In order to take into account depth-dependent point density, it is generally accepted to grid bathymetric data at a resolution that is on the order of the average beam footprint size, typically 10% of the water depth.

28 – Samoa: High-Resolution Bathymetry EU EDF-SOPAC Reducing Vulnerability of Pacific ACP States
EU-SOPAC Project Report 112 – Krüger and Kumar 2008
Appendix 2 – CTD profiles

Samoa: High-Resolution Bathymetry EU EDF-SOPAC Reducing Vulnerability of Pacific ACP States – 29
EU-SOPAC Project Report 112 – Krüger and Kumar 2008

30 – Samoa: High-Resolution Bathymetry EU EDF-SOPAC Reducing Vulnerability of Pacific ACP States
EU-SOPAC Project Report 112 – Krüger and Kumar 2008

Samoa: High-Resolution Bathymetry EU EDF-SOPAC Reducing Vulnerability of Pacific ACP States – 31
EU-SOPAC Project Report 112 – Krüger and Kumar 2008

32 – Samoa: High-Resolution Bathymetry EU EDF-SOPAC Reducing Vulnerability of Pacific ACP States
EU-SOPAC Project Report 112 – Krüger and Kumar 2008
Appendix 3 – High-Resolution A0 Charts, Western Samoa Bathymetry Charts are available from SOPAC, and can be downloaded from its website (www.sopac.org). Full size is 841 x 1189 mm. (Low-resolution A4 representations follow.)
Chart No Title Scale Drawing No.
1 Western Samoa, Upolu and Savai’i Bathymetry 1 : 50 000 ER112.1
2 Western Samoa, Upolu and Savai’i Bathymetry 1 : 50 000 ER112.2
3 Western Samoa, Upolu and Savai’i Bathymetry 1 : 50 000 ER112.3
4 Western Samoa, Upolu and Savai’i Bathymetry 1 : 50 000 ER112.4
5 Western Samoa, Upolu and Savai’i Bathymetry 1 : 50 000 ER112.5
6 Western Samoa, Upolu and Savai’i Bathymetry 1 : 50 000 ER112.6
7 Western Samoa, Upolu and Savai’i Bathymetry 1 : 50 000 ER112.7
8 Western Samoa, Upolu and Savai’i Bathymetry 1 : 50 000 ER112.8
9 Western Samoa, Upolu and Savai’i Bathymetry 1 : 50 000 ER112.9

Samoa: High-Resolution Bathymetry EU EDF-SOPAC Reducing Vulnerability of Pacific ACP States –33
EU-SOPAC Project Report 112 – Krüger and Kumar 2008
Appendix 4: SOPAC/EU/EDF8 Marine survey Samoa Multibeam Log sheet.
Annex #04F SOPAC EU EDF8 PROJECT / SAMOA 01-Feb-04
MBES data files
File: Area Azimuth Speed Start Stop COMMENTS
MBES data
010204.0001 S Apolima 068 7.9 09:00 10:19 In transit to Apia
010204.0002 Apolima 046 8.0 10:17 11:32 In transit to Apia
010204.0003 N Upolu 075 8.0 11:32 n/a In transit to Apia
Annex #04F SOPAC EU EDF8 PROJECT / SAMOA 04-Feb-04
MBES data files
File: Area Azimuth Speed Start Stop COMMENTS
MBES data
040204.0004 N Upolu 012 8.5 05:50 07:12 Heading for Mulifanua Harbour approach
040204.0005 N Upolu 253 7.8 07:12 08:24 Heading for Mulifanua Harbour approach
040204.0006 Mulifanua 217 8.0 08:24 08:45 Down leadin lights Mulifanua
040204.0007 Apolima Strait 290 8.0 09:34 n/a Set course for Salelolaga
040204.0008 Salelolaga approach 098 n/a 12:15 12:24 Lost C-Map and reset GPS
040204.0009 Apolima Strait 093 8.9 12:30 13:22 C-Map back on line
040204.0010 NW Upolu 076 8.2 13:23 15:17 Discover that Navisoft / C-map is off-set
040204.0011 N Upolu 119 7.5 15:17 15:49 Discover that Hypack / C-map is off-set
ADCP #1 data
040204 X 694796.41, Y 5473553.38 08:52 Deploy ADCP #1 at Mulifanua approach
240204 Retrieved on 24 Feb 04 13:00 Retrieve ADCP #1 at Mulifanua
ACDP #2 data
040204 X 678113.08, Y 5478717.99 11:21 Deploy ADCP #2 at Salelolaga approach
240204 Retrieved on 24 Feb 04 10:45 Retrieve ADCP #2 at Salelolaga
Annex #05F SOPAC EU EDF8 PROJECT / SAMOA 05-Feb-04
File: Area Azimuth Speed Start Stop COMMENTS
MBES data
050204.0012 Apia Harbour approach 328 8.2 12:59 13:32 Head for ADCP #3 site
050204.0013 N Upolu 109 8.0 13:40 08:24 Head for CTD #1 Site

34 – Samoa: High-Resolution Bathymetry EU EDF-SOPAC Reducing Vulnerability of Pacific ACP States
EU-SOPAC Project Report 112 – Krüger and Kumar 2008
CTD #1 data
X 721317.92, Y 5481000.15 13:32 13:46 Cast CTD #1 North Upolu @ Z=370m
ADCP #3 data
X 725394.18, Y 5472096.16 15:25 Deploy ADCP #3 at Apia Harbour approach
Apia 08:00 Retreived ADCP #3 on 5 March 2004
Annex #06F SOPAC EU EDF8 PROJECT / SAMOA 06-Feb-04
File: Area Azimuth Speed Start Stop COMMENTS
MBES data
060204.0014 N Upolu 313 8.2 06:00 06:50 Depart Apia Harbour and head west
060204.0015 NW Upolu 314 7.9 06:52 07:27 Bound for Apolima Sttrait
060204.0016 Apolima Strait 297 6.7 07:27 08:26
060204.0017 Apolima Strait 264 8.9 08:26 10:00 Line 4 Magnetometer on / lines @ 200m
060204.0018 Apolima Strait 7.4 10:12 11:02 Line 36 Changed line spacing to 150m
060204.0019 Apolima Strait 218 8.3 11:03 11:46 Line 37
060204.0020 Apolima Strait 042 6.8 11:46 12:10 Line 38
060204.0021 Apolima Strait 231 7.2 12:11 12:43 Line 39
060204.0022 Apolima Strait 044 6.6 12:43 13:03 Line 40
060204.0023 Apolima Strait 242 7.3 13:04 13:23 Line 41
060204.0024 Error, Started file by mistake
060204.0025 Apolima Strait 085 6.5 13:24 13:45 Line 42
060204.0026 Apolima Strait 234 7.1 13:47 14:06 Line 43
060204.0027 Apolima Strait 042 6.4 14:07 14:29 Line 44
060204.0028 Apolima Strait 240 6.7 14:30 14:49 Line 45
060204.0029 Apolima Strait 047 6.1 14:50 15:13 Line 46
060204.0030 Apolima Strait 231 6.9 15:14 15:33 Line 47
060204.0031 Apolima Strait 038 6.2 15:33 15:54 Line 48
060204.0032 Apolima Strait 239 7.7 15:55 16:12 Line 49
060204.0033 Apolima Strait 050 6.1 16:13 16:33 Line 50
060204.0034 Apolima Strait 216 7.6 16:35 16:52 Line 51
060204.0035 Apolima Strait 046 6.6 16:53 17:11 Line 52
060204.0036 Apolima Strait 141 8.2 17:14 17:44 Line 01 Head for Mulifanua Harbour
060204.0037 Mulifanua 329 1.6 18:05 18:30 Line 02 Anchor at Mulifanua Harbour

Samoa: High-Resolution Bathymetry EU EDF-SOPAC Reducing Vulnerability of Pacific ACP States –35
EU-SOPAC Project Report 112 – Krüger and Kumar 2008
MAG #1 Data
060204 Apolima Strait 08:26 17:15 MAGLOG Samoa Survey2
Annex #07F SOPAC EU EDF8 PROJECT / SAMOA 07-Feb-04
File: Area Azimuth Speed Start Stop COMMENTS
MBES data
070204.0038 Mulifanua 263 7.7 06:47 07:33 Line 1 To where we ended yesterday
070204.0039 Apolima Strait 049 6.7 07:33 07:58 Line 53 Start 150m spacing survey
070204.0040 Apolima Strait 049 7.0 07:58 08:00 Line 53 Traffic close to magnetometer
070204.0041 Apolima Strait 221 8.3 08:01 08:17 Line 54
070204.0042 Apolima Strait 042 6.5 08:18 08:38 Line 56 Skip to 2 line spacing
070204.0043 Apolima Strait 223 8.5 08:39 08:55 Line 58
070204.0044 Apolima Strait 038 6.7 08:57 09:16 Line 60
070204.0045 Apolima Strait 239 7.9 09:17 09:33 Line 62 Run line 25m off to port
070204.0046 Apolima Strait 049 6.5 09:35 09:51 Line 64
070204.0047 Apolima Strait 220 8.4 09:52 10:07 Line 65
070204.0048 Apolima Strait 023 6.6 10:08 10:24 Line 67
070204.0049 Apolima Strait 228 7.2 10:26 10:40 Line 69
070204.0050 Apolima Strait 050 7.0 10:42 10:57 Line 71
070204.0051 Apolima Strait 230 7.9 10:59 11:16 Line 73
070204.0052 Apolima Strait 042 7.4 11:18 11:35 Line 76 Skip 3 lines
070204.0053 Apolima Strait 237 7.6 11:36 11:53 Line 78 Skip 2 lines
070204.0054 Apolima Strait 040 9.5 11:54 12:11 Line 80
070204.0055 Apolima Strait 223 7.2 12:12 12:29 Line 82
070204.0056 Apolima Strait 024 7.6 12:31 12:49 Line 85 Skip 3 lines
070204.0057 Apolima Strait 229 7.0 12:51 13:10 Line 87
070204.0058 Apolima Strait 045 8.0 13:12 13:26 Line 89
070204.0059 Apolima Strait 209 7.3 13:28 13:36 Line 91 Stop for traffic
070204.0060 Apolima Strait 208 7.1 13:39 13:48 Line 91
070204.0061 Apolima Strait 054 7.5 17:50 14:08 Line 93
070204.0062 Apolima Strait 229 7.2 14:10 14:24 Line 95
070204.0063 Apolima Strait 160 7.3 14:26 14:39 Line 97
070204.0064 Apolima Strait 204 6.3 14:41 14:56 Line 99
070204.0065 Apolima Strait 043 7.6 14:57 15:10 Line 101

36 – Samoa: High-Resolution Bathymetry EU EDF-SOPAC Reducing Vulnerability of Pacific ACP States
EU-SOPAC Project Report 112 – Krüger and Kumar 2008
070204.0066 Apolima Strait 209 7.2 15:12 15:25 Line 103
070204.0067 Apolima Strait 044 8.5 15:27 15:38 Line 105
070204.0068 Apolima Strait 212 7.1 15:39 15:50 Line 106
070204.0069 Apolima Strait 034 8.3 15:52 16:01 Line 107
070204.0070 Apolima Strait 218 7.0 16:01 16:13 Line 108
070204.0071 Apolima Strait 043 8.4 16:13 16:22 Line 109
070204.0072 Apolima Strait 243 7.9 16:23 16:33 Line 110
070204.0073 Apolima Strait 055 7.7 16:34 16:42 Line 112
070204.0074 Apolima Strait 227 7.1 16:43 16:52 Line 113
070204.0075 Apolima Strait 040 7.6 16:52 17:02 Line 114
070204.0076 Apolima Strait n/a n/a 17:02 17:19 Line 115 Hiway to Salelolaga anchorage
MAG #2 Data
070204 Apolima Strait 07:30 17:00 MAGLOG Samoa Survey2
SOPAC EU EDF8 PROJECT / SAMOA 08-Feb-04
Area Azimuth Speed Start Stop COMMENTS
Salelolaga 134 6.4 07:09 07:22 Line 1 Depart Salelolaga for line area
Apolima Strait 045 6.6 07:22 07:33 Line 115 Start 150m line spacing
Apolima Strait 222 7.9 07:34 07:41 Line 116
Apolima Strait 045 6.0 07:42 07:51 Line 117
Apolima Strait 219 7.6 07:52 08:00 Line 118
Apolima Strait 045 6.8 08:00 08:08 Line 119
Apolima Strait 216 8.9 08:08 08:14 Line 120
Apolima Strait 043 7.2 08:15 08:22 Line 121
Apolima Strait 224 8.3 08:23 08:28 Line 122
Apolima Strait 047 6.8 08:30 08:35 Line 123
Apolima Strait 222 8.0 08:36 08:40 Line 124
Apolima Strait 112 7.3 08:43 09:53 Run line across to Upolu side of strait
Apolima Strait 229 7.9 10:00 10:22 Line 33 Running line on Upolu side
Apolima Strait 086 7.6 10:23 10:52 Line n/a
Apolima Strait 169 7.4 10:52 11:07 Line n/a
Apolima Strait 053 7.0 11:07 11:26 Line n/a
Apolima Strait 221 7.9 11:32 11:37 Line 18

Samoa: High-Resolution Bathymetry EU EDF-SOPAC Reducing Vulnerability of Pacific ACP States –37
EU-SOPAC Project Report 112 – Krüger and Kumar 2008
Apolima Strait 040 6.8 11:38 11:42 Line 19
Apolima Strait 275 8.2 11:43 12:02 Line 20
Apolima Strait 040 6.5 12:02 12:08 Line 21
Apolima Strait 043 7.7 12:10 12:18 Line 21
Apolima Strait 221 7.4 12:19 12:32 Line 22
Apolima Strait 041 7.2 12:32 12:47 Line 23
Apolima Strait 230 7.4 12:48 13:03 Line 24
Apolima Strait 047 7.4 13:05 13:21 Line 26 Run approx 25m stb of line
Apolima Strait 220 7.9 13:23 13:39 Line 27
Apolima Strait 044 7.2 13:40 13:59 Line 28
Apolima Strait 215 7.3 14:00 14:18 Line 29
Apolima Strait 043 7.0 14:19 14:39 Line 30
Apolima Strait 226 8.8 14:41 15:01 Line 31
Apolima Strait 045 7.1 15:03 15:20 Line 32 Bring in magnetometer
Apolima Strait 049 7.4 15:23 15:30 Line 25
N UPOLU 070 7.6 15:51 16:17 Gyrocompass "crashes"
N UPOLU 076 7.6 16:32 17:26 Gyrocompass is back on line
N UPOLU 088 7.0 06:14 18:21 Deep drop off to N Upolu L. L.
Apolima Strait 07:30 08:43 MAGLOG Samoa Survey2
Apolima Strait 11:30 15:20 MAGLOG Samoa Survey2
X 693758.06, Y 5477015.81 15:43 15:46 Cast CTD #2 in NE Apolima Strait
Annex #11F SOPAC EU EDF8 PROJECT / SAMOA 11-Feb-04
File: Area Azimuth Speed Start Stop COMMENTS
MBES data
110204.0112 5 Mile Reef 042 7.6 15:02 15:25 Line 40
110204.0113 5 Mile Reef 196 8.3 15:26 15:46 Line 38
110204.0114 5 Mile Reef 090 7.1 15:48 16:10 Line 36
110204.0115 5 Mile Reef 183 8.4 16:10 16:32 Line 34

38 – Samoa: High-Resolution Bathymetry EU EDF-SOPAC Reducing Vulnerability of Pacific ACP States
EU-SOPAC Project Report 112 – Krüger and Kumar 2008
110204.0116 5 Mile Reef 011 7.8 16:33 16:53 Line 32
110204.0117 5 Mile Reef 193 8.3 16:54 17:13 Line 30
110204.0118 5 Mile Reef 028 7.6 17:14 17:34 Line 28
110204.0119 5 Mile Reef 197 7.5 17:35 17:54 Line 26
110204.0120 5 Mile Reef Line 24 Do Not Use This Line
110204.0121 5 Mile Reef 011 7.3 17:54 18:13 Line 24
110204.0122 5 Mile Reef 188 7.7 18:14 n/a Line 22
MAG #5 Data
110204 5 Mile Reef 14:57 18:30 MAGLOG Samoa Survey2
SOPAC EU EDF8 PROJECT / SAMOA 12-Feb-04
Area Azimuth Speed Start Stop COMMENTS
In transit to 5 Mile Reef 288 7.9 07:02 07:19 Line 1 MBES mapping to line 1
5 Mile Reef 183 7.8 07:20 07:34 Line 3 Side Scan sensor light blinking
5 Mile Reef 021 7.6 07:35 07:49 Line 5
5 Mile Reef 188 7.6 07:50 08:04 Line 7
5 Mile Reef 012 7.8 08:06 08:21 Line 9
5 Mile Reef 185 7.4 08:22 08:38 Line 11
5 Mile Reef 019 7.3 08:39 08:56 Line 13
5 Mile Reef 184 7.5 09:02 09:15 Line 15
5 Mile Reef 024 7.4 09:16 09:35 Line 17
5 Mile Reef 184 7.2 09:36 09:55 Line 19 Side Scan on
5 Mile Reef 018 7.5 09:57 10:15 Line 20 Side Scan off at end of line
5 Mile Reef 261 7.2 10:17 10:27 Line 2
5 Mile Reef 181 7.6 10:27 10:41 Map over drop off to define reef area
5 Mile Reef 023 7.9 10:42 10:53 n/a
5 Mile Reef 218 7.6 10:53 10:57 n/a
5 Mile Reef 331 8.1 10:58 11:04 n/a
5 Mile Reef 200 6.9 11:05 11:15 n/a
5 Mile Reef 013 7.7 11:26 11:32 Line 2
5 Mile Reef 216 8.2 11:33 11:37 Line 2 Fill in gaps and Line 2
5 Mile Reef 033 7.9 11:37 11:44 Line 4
5 Mile Reef 022 7.4 11:45 11:49 Line 6

Samoa: High-Resolution Bathymetry EU EDF-SOPAC Reducing Vulnerability of Pacific ACP States –39
EU-SOPAC Project Report 112 – Krüger and Kumar 2008
5 Mile Reef 178 6.7 11:50 11:55 Line 8
5 Mile Reef 171 7.7 11:56 12:03 Line 10
5 Mile Reef 181 7.7 12:04 12:08 Line 12
5 Mile Reef 012 7.6 12:09 12:15 Line 14
5 Mile Reef 197 7.5 12:16 12:24 Line 16 Problem w helmsman video cable
5 Mile Reef 020 7.4 12:25 12:29 Line 18
5 Mile Reef 199 7.4 12:32 13:34 Line 0
5 Mile Reef 010 7.5 12:37 12:45 Line 23
5 Mile Reef 188 8.3 12:46 12:55 Line 25
5 Mile Reef 017 7.5 12:56 13:05 Line 27 Fill in shallow areas
5 Mile Reef 185 8.0 13:06 13:15 Line 29
5 Mile Reef 013 8.1 13:16 13:27 Line 31
5 Mile Reef 193 7.1 13:28 13:38 Line 33
5 Mile Reef 021 7.6 13:39 13:57 Line 35
5 Mile Reef 194 8.6 14:02 14:13 Line 37
5 Mile Reef 077 7.4 14:14 14:22 Line 38
5 Mile Reef 275 8.2 14:23 14:31 Line 37 Follow reef to find shallow areas
5 Mile Reef 300 7.9 14:32 14:35
5 Mile Reef 358 7.6 14:35 14:45
5 Mile Reef 121 7.9 14:45 14:54
5 Mile Reef 027 7.6 15:01 15:25 Line 41 Restart Line 5
5 Mile Reef 193 7.6 15:28 15:49 Line 43
5 Mile Reef 012 7.2 15:50 16:15 Line 45 Problem w helmsman video cable
5 Mile Reef 06:50 10:13 MAGLOG Samoa Survey2
5 Mile Reef 15:25 16:15 MAGLOG Samoa Survey2
Annex #14F SOPAC EU EDF8 PROJECT / SAMOA 14-Feb-04
File: Area Azimuth Speed Start Stop COMMENTS
MBES data
140204.0167 5 Mile Reef 020 7.9 07:10 07:32 Line 47
140204.0168 5 Mile Reef 174 7.5 07:32 07:56 Line 49

40 – Samoa: High-Resolution Bathymetry EU EDF-SOPAC Reducing Vulnerability of Pacific ACP States
EU-SOPAC Project Report 112 – Krüger and Kumar 2008
140204.0169 5 Mile Reef 028 7.8 07:58 08:19 Line 51 Sighted floating drum
140204.0170 5 Mile Reef 194 8.3 08:20 08:43 Line 53
140204.0171 5 Mile Reef 015 8.1 08:45 09:06 Line 55
140204.0172 5 Mile Reef 189 7.9 09:07 09:28 Line 57
140204.0173 5 Mile Reef 018 7.8 09:30 09:51 Line 59
140204.0174 5 Mile Reef 192 8.2 09:52 10:12 Line 61
140204.0175 5 Mile Reef 018 7.6 10:14 10:35 Line 63
140204.0176 5 Mile Reef 189 8.0 10:36 10:56 Line 65
140204.0177 5 Mile Reef 018 8.0 10:57 11:19 Line 67
140204.0178 5 Mile Reef 197 8.3 11:20 11:40 Line 69
140204.0179 5 Mile Reef 018 7.7 11:42 n/a Line 71
140204.0180 5 Mile Reef 198 7.7 n/a 12:24
140204.0181 5 Mile Reef 021 7.6 12:30 12:32 Fill in gaps in data
140204.0182 5 Mile Reef 213 7.9 12:33 12:38 Fill in gaps in data
140204.0183 5 Mile Reef Do not use this line
140204.0184 5 Mile Reef 034 7.0 12:40 12:43
140204.0185 5 Mile Reef 200 7.7 12:45 12:50 Fill in gaps in data
140204.0186 5 Mile Reef 195 7.5 12:51 12:56 Fill in gaps in data
140204.0187 5 Mile Reef 016 7.5 12:59 13:01 Fill in gaps in data
140204.0188 5 Mile Reef 022 7.6 13:08 13:10 Fill in gaps in data
140204.0189 5 Mile Reef 198 7.4 13:11 13:14 Fill in gaps in data
140204.0190 5 Mile Reef 010 7.1 13:14 13:17 Fill in gaps in data
140204.0191 5 Mile Reef 207 7.1 13:18 13:20 Fill in gaps in data
140204.0192 5 Mile Reef 010 6.8 13:21 13:22 Fill in gaps in data
140204.0193 5 Mile Reef 187 6.7 13:23 13:27 Fill in gaps in data
140204.0194 5 Mile Reef 187 8.2 13:31 13:35 Fill in gaps in data
140204.0195 5 Mile Reef 012 7.0 13:36 13:40 Fill in gaps in data
140204.0196 5 Mile Reef 195 7.2 13:40 13:45 Fill in gaps in data
140204.0197 5 Mile Reef 068 6.4 13:45 13:51 Fill in gaps in data
140204.0198 5 Mile Reef 190 7.3 13:52 13:54 Fill in gaps in data
140204.0199 N of Apia 277 8.1 14:31 14:40 Fill in area W of 5 Mile Reef
140204.0200 N of Apia 173 8.5 14:41 14:51 Fill in area SW of 5 Mile Reef
140204.0201 N of Apia 359 8.0 14:51 14:58 Fill in area SW of 5 Mile Reef
140204.0202 N of Apia 144 7.2 14:58 15:07 Fill in area SW of 5 Mile Reef
140204.0203 N of Apia 171 7.2 15:09 15:37 Fill in area SW of 5 Mile Reef

Samoa: High-Resolution Bathymetry EU EDF-SOPAC Reducing Vulnerability of Pacific ACP States –41
EU-SOPAC Project Report 112 – Krüger and Kumar 2008
140204.0204 N of Apia 309 7.8 15:38 16:00 Fill in area SW of 5 Mile Reef
140204.0205 N of Apia 115 6.8 16:00 16:24 Fill in area SW of 5 Mile Reef
140204.0206 N of Apia 338 8.0 16:24 16:41 Fill in area SW of 5 Mile Reef
140204.0207 N of Apia 147 6.8 16:43 17:03 Fill in area SW of 5 Mile Reef
140204.0208 N of Apia 026 7.4 17:03 17:16 Fill in area SW of 5 Mile Reef
140204.0209 N of Apia 106 6.8 17:16 17:38 Fill in area SW of 5 Mile Reef
MAG #8 Data
140204 5 Mile Reef 07:05 12:23 MAGLOG Samoa Survey2
MAG #9 Data
140204 N of Apia 14:40 17:38 MAGLOG Samoa Survey2
Annex #15F SOPAC EU EDF8 PROJECT / SAMOA 15-Feb-04
File: Area Azimuth Speed Start Stop COMMENTS
MBES data
150204.0210 Apia 278 8.4 07:11 08:05 NW of Apia
150204.0211 N Upolu 252 8.0 08:05 08:23 NW of Apia
150204.0212 N Upolu 070 6.8 08:23 08:37 N of Malua lighthouse
150204.0213 N Upolu 033 7.7 08:37 10:18 N of Mulifanua
150204.0214 N Apolima 317 8.3 10:18 11:47 E of Cape Tuasivi, Savaii
150204.0215 N Apolima 089 7.8 11:47 12:42 E of Cape Tuasivi, Savaii
150204.0216 N Apolima 037 6.9 13:01 14:28 E of Cape Tuasivi, Savaii
150204.0217 N Upolu 127 8.0 14:29 15:00 N of Mulifanua
150204.0218 N Upolu 065 7.4 15:01 17:32 N of Mulifanua
150204.0219 N Upolu 180 8.4 17:33 18:12 Head for Apia harbour
CTD #3 data
E687309, N5489064 12:43 12:56 E of Cape Tuasivi @ Z=800m
Annex #16F SOPAC EU EDF8 PROJECT / SAMOA 16-Feb-04
File: Area Azimuth Speed Start Stop COMMENTS
MBES data
160204.0220 N Upolu 032 8.1 07:35 07:50 E of 5 Mile Reef
160204.0221 N Upolu 034 7.6 07:50 09:32

42 – Samoa: High-Resolution Bathymetry EU EDF-SOPAC Reducing Vulnerability of Pacific ACP States
EU-SOPAC Project Report 112 – Krüger and Kumar 2008
160204.0222 N E Upolu 177 8.3 09:32 11:21 N of Solosolo Village
160204.0223 E Upolu 093 8.4 11:22 12:21 S E of Nu'utele Island
160204.0224 S E Upolu 143 8.9 12:21 13:39 17km from Falealili
160204.0225 S E Upolu 298 7.4 14:08 16:36 Heading for Falealili
160204.0226 S Upolu 351 8.2 16:36 n/a Map road into Falealili
Annex #17F SOPAC EU EDF8 PROJECT / SAMOA 17-Feb-04
File: Area Azimuth Speed Start Stop COMMENTS
MBES data
170204.0227 S Upolu 224 6.0 06:47 08:00
170204.0228 S E Upolu 094 8.5 08:00 08:24
170204.0229 S E Upolu 349 8.0 08:41 09:21
170204.0230 S E Upolu 335 8.1 09:22 09:39
170204.0231 S E Upolu 079 8.5 09:39 10:37
170204.0232 S E Upolu 315 8.2 10:37 11:10
170204.0233 S E Upolu 126 8.5 11:10 11:27
170204.0234 S E Upolu 288 8.8 11:27 12:56
170204.0235 N E upolu 240 8.4 12:56 13:56
170204.0236 N E upolu 304 7.6 14:21 16:07
170204.0237 N upolu 008 7.4 16:27 18:22
Grab Sample
SAM-170204-1 X 733319.64, Y 544734.43 06:21 Falealili harbour
CTD #4 data
X 733319.64, Y 544734.43 06:31 06:32 Falealili harbour in 15m
CTD #5 data
X 755030, Y 5443291 08:23 08:36 S Upolu in 900m
CTD #6 data
X 769931, Y 5455010 13:57 14:15 Aleipata, Upolu at 1000m
CTD #7 data
X 753550, Y 5469190 16:08 16:15 N Upolu

Samoa: High-Resolution Bathymetry EU EDF-SOPAC Reducing Vulnerability of Pacific ACP States –43
EU-SOPAC Project Report 112 – Krüger and Kumar 2008
MAG #10 data
170204 S E Upolu 09:00 13:53 MAGLOG Samoa Survey3
MAG #11 data
170204 off coast of Aleipata, Upolu 14:18 15:00 MAGLOG Samoa Survey3
Annex #19F SOPAC EU EDF8 PROJECT / SAMOA 19-Feb-04
File: Area Azimuth Speed Start Stop COMMENTS
MBES data
190204.0238 Apia 033 7.7 07:14 07:55 E of 5 Mile Reef
190204.0239 N Upolu 010 7.4 07:55 09:20 Heading west to N Apolima Strait
190204.0240 N Apolima 273 7.4 09:43 10:41 Deep water area of N Apolima Strait
190204.0241 N Apolima 350 7.2 11:01 12:34 Deep water area of N Apolima Strait
190204.0242 N Apolima 034 7.8 12:34 13:26 Deep water area of N Apolima Strait
190204.0243 N Apolima 126 6.2 13:52 14:56 Deep water area of N Apolima Strait
190204.0244 N Apolima 121 7.0 14:56 16:34 Heading east to Apia
MAG #12 Data
190204 N Apolima Strait 12:45 13:25 MAGLOG Samoa Survey3
MAG #13 Data
190204 N Apolima Strait 13:45 16:40 MAGLOG Samoa Survey3
CTD #8 Data
X 689158, Y 5503833 13:30 13:42 Cast CTD #8 in NW Apolima Strait
Annex #20F SOPAC EU EDF8 PROJECT / SAMOA 20-Feb-04
File: Area Azimuth Speed Start Stop COMMENTS
MBES data
200204.0245 N Apolima 038 8.1 08:37 11:09 Deep water area of N Apolima Strait
200204.0246 N Apolima 129 6.6 11:09 13:05 Deep water area of N Apolima Strait
200204.0247 N Apolima 265 6.7 13:11 14:50 Deep water area of N Apolima Strait
200204.0248 N Apolima 203 6.1 14:53 15:57 Deep water area of N Apolima Strait
200204.0249 N Apolima 185 6.0 15:57 17:22 The vessel is in transit to Apia

44 – Samoa: High-Resolution Bathymetry EU EDF-SOPAC Reducing Vulnerability of Pacific ACP States
EU-SOPAC Project Report 112 – Krüger and Kumar 2008
MAG #14 Data
200204 N Apolima Strait 08:40 17:22 MAGLOG Samoa Survey3
Annex #21F SOPAC EU EDF8 PROJECT / SAMOA 21-Feb-04
File: Area Azimuth Speed Start Stop COMMENTS
MBES data
210204.0250 Apia 320 8.2 13:00 13:41 In transit to S Apolima Strait
210204.0251 Apolima Strait Do Not Use This File
210204.0252 Apolima Strait 294 8.0 13:45 15:03 N Upolu
210204.0253 Apolima Strait 235 7.9 15:03 15:34 Mid channel, Apolima Strait
210204.0254 Apolima Strait 101 7.1 15:34 16:01 Mid channel, Apolima Strait
210204.0255 Apolima Strait 069 7.0 16:02 17:00 Near Salelolaga
MAG #15 Data
210204 Apia to Salelolaga 13:00 16:48 MAGLOG Samoa Survey3
Annex #22F SOPAC EU EDF8 PROJECT / SAMOA 22-Feb-04
File: Area Azimuth Speed Start Stop COMMENTS
MBES data
220204.0256 Apolima Strait 139 7.8 06:56 07:32 Depart Salelolaga harbour
220204.0257 Apolima Strait 235 7.3 07:32 07:59 In transit to S Apolima
220204.0258 S Apolima Strait 321 7.3 09:05 10:34 225°, 18km off Apolima Isl
220204.0259 S Apolima Strait 140 7.1 10:34 11:04 220°, 23.8 km off Manono Isl
220204.0260 S Apolima Strait 147 7.5 11:04 11:30
220204.0261 S Apolima Strait 292 8.1 11:31 11:43
220204.0262 S Apolima Strait 153 7.6 11:43 13:04 13.5 km off SW Upolu coast
220204.0263 S Upolu 080 7.3 13:04 16:26 7.5km SE off Safata harbour
220204.0264 S Upolu 318 7.6 16:28 17:07 196°, 4km off Falealili harbour
220204.0265 S Upolu 276 7.8 17:07 17:55 178°, 5.5km off Safata harbour
220204.0266 S Upolu 286 7.9 17:55 18:40 150°,20.6km off Manono Island
220204.0267 S Upolu 273 7.9 18:40 19:28 179°,13.8km off Manono Island
220204.0268 S Apolima Strait 315 8.3 19:28 20:46 163°, 7.7km off Salelolaga
220204.0269 Apolima Strait 337 7.5 20:46 2136 Heading for Salelolaga
Annex #23F SOPAC EU EDF8 PROJECT / SAMOA 23-Feb-04

Samoa: High-Resolution Bathymetry EU EDF-SOPAC Reducing Vulnerability of Pacific ACP States –45
EU-SOPAC Project Report 112 – Krüger and Kumar 2008
File: Area Azimuth Speed Start Stop COMMENTS
MBES data
230204.0270 Apolima Strait 159 8.1 07:15 08:01 Depart Salelolaga harbour
230204.0271 S Apolima Strait 102 7.6 08:22 08:25 In transit to S Apolima
230204.0272 S Apolima Strait 120 6.9 09:52 10:46 196°, 11.5km off Tafua,Savaii
230204.0273 S Apolima Strait 173 6.6 11:03 11:51 198°, 13km off Tafua
230204.0274 S Apolima Strait 052 7.3 11:52 13:04 225°, 7.9km off Tafua
Gyrocompass "Crash"
230204.0275 Apolima Strait 016 7.1 13:39 14:20 Heading for Salelolaga harbour
230204.0276 Apolima Strait 016 7.6 14:20 15:05 Heading for Salelolaga harbour
MAG #16 Data
230204 S Apolima Strait 11:02 MAGLOG Samoa Survey3
CTD #9 Data
X 672295, Y 5460275 10:45 11:00 Cast CTD #9 in S Apolima Strait
Annex #24F SOPAC EU EDF8 PROJECT / SAMOA 24-Feb-04
File: Area Azimuth Speed Start Stop COMMENTS
MBES data
240204.0277 Apolima Strait 100 7.0 11:00 11:10 Depart Salelolaga harbour
240204.0278 Apolima Strait 101 7.3 11:19 11:28 Head for Mulifanua
240204.0279 Apolima Strait 351 4.7 13:46 14:40 N Aplolima Strait
240204.0280 Apolima Strait 238 6.7 14:40 16:00 head for Salelolaga
ADCP #2 Data
240204 Salelolaga 10:45 Retrieve ADCP #2 on 24 Feb 04
040204 X 678113.08, Y 5478717.99 08:52 Deployed on 04 Feb 04
ADCP #1 Data
240204 Mulifanua 13:00 Retrieve ADCP #1 on 24 Feb 04
040204 X 694796.41, Y 5473553.38 11:21 Deployed on 04 Feb 04
MAG #17 Data

46 – Samoa: High-Resolution Bathymetry EU EDF-SOPAC Reducing Vulnerability of Pacific ACP States
EU-SOPAC Project Report 112 – Krüger and Kumar 2008
240204 Apolima Strait 11:02 16:00 MAGLOG Samoa Survey3
Grab Sample
SAM-240204-3 X 694796.41, Y 5473553.38 Mulifanua
Annex #25F SOPAC EU EDF8 PROJECT / SAMOA 25-Feb-04
File: Area Azimuth Speed Start Stop COMMENTS
MBES data
250204.0281 Apolima Strait 133 8.3 09:53 10:32 Depart Salelolaga harbour
250204.0282 Apolima Strait 140 8.5 10:32 11:42 In transit to S Apolima
250204.0283 S Apolima Strait 148 8.0 11:42 12:14 220°, 15.8km from Apolima Is.
250204.0284 S Apolima Strait 045 7.7 12:14 12:21 191°, 22.6km from Apolima Is.
250204.0285 S Apolima Strait 089 6.6 12:21 12:25
250204.0286 S Apolima Strait 270 8.1 12:25 12:27
250204.0287 S Apolima Strait 092 6.8 12:28 12:36 186°, 24.5km from Apolima Is.
250204.0288 S Apolima Strait 270 8.2 12:36 12:44
250204.0289 S Apolima Strait 075 7.9 12:44 12:57
250204.0290 S Apolima Strait 272 8.0 12:57 13:08
250204.0291 S Apolima Strait 090 7.4 13:08 13:22 184°, 23.1km from Apolima Is.
250204.0292 S Apolima Strait 272 8.2 13:22 13:34
250204.0293 S Apolima Strait 089 7.4 13:34 13:51 184°, 22.6km from Apolima Is.
250204.0294 S Apolima Strait 267 8.0 13:51 14:07
250204.0295 S Apolima Strait 091 7.3 14:07 14:27 184°, 22.5km from Apolima Is.
250204.0296 S Apolima Strait 270 8.0 14:27 14:45
250204.0297 S Apolima Strait 086 7.6 14:45 15:08 180°, 22km from Apolima Is.
250204.0298 S Apolima Strait 268 8.3 15:08 15:23
250204.0299 S Apolima Strait 072 8.8 15:23 15:43 183°, 21.6km from Apolima Is.
250204.0300 S Apolima Strait 274 7.7 15:43 15:52
250204.0301 S Apolima Strait 068 7.5 15:52 16:01 180°, 20.8km from Apolima Is.
250204.0302 S Apolima Strait 270 7.6 16:01 16:07
250204.0303 S Apolima Strait 006 6.0 16:07 17:27 207°, 4.7km from Apolima Is.
250204.0304 Apolima Strait 010 7.0 17:27 18:18 154°, 4.7km from Salelolaga.
Annex #26F SOPAC EU EDF8 PROJECT / SAMOA 26-Feb-04
File: Area Azimuth Speed Start Stop COMMENTS

Samoa: High-Resolution Bathymetry EU EDF-SOPAC Reducing Vulnerability of Pacific ACP States –47
EU-SOPAC Project Report 112 – Krüger and Kumar 2008
MBES data
260204.0305 Apolima Strait 084 8.5 07:17 08:27 Depart Salelolaga harbour
260204.0306 Apolima Strait 082 7.9 08:27 09:33 341°, 7.5km NE of Malua
260204.0307 N Apolima Strait 180 8.0 11:14 11:23 337°, 7.2km NW of Apia
Annex #27F SOPAC EU EDF8 PROJECT / SAMOA 27-Feb-04
File: Area Azimuth Speed Start Stop COMMENTS
MBES data
270204.0308 Apia 038 7.0 12:11 12:21 South of 5-Mile Reef
270204.0309 Apia 113 6.3 12:21 12:31 032°, 4.3km from Apia
270204.0310 Apia 071 6.8 12:31 12:42
270204.0311 DO NOT USE THIS LINE
270204.0312 Apia 168 7.4 12:43 12:50
270204.0313 Apia 061 6.6 12:50 12:58
270204.0314 Apia 105 6.6 12:58 13:06
270204.0315 Apia 088 7.0 13:06 13:15 034°, 5.5km from Apia
270204.0316 Apia 105 6.9 13:15 13:21
270204.0317 Apia 073 6.9 13:21 13:27
270204.0318 Apia 166 7.3 13:27 13:36
270204.0319 Apia 087 6.9 13:46 14:16 042°, 10.1km from Apia
Apia Gyrocompass "crash"
270204.0320 Apia 087 6.8 14:16 14:18 040°, 4.5km from Apia
270204.0321 Apia 196 7.6 14:58 15:09
Annex #28F SOPAC EU EDF8 PROJECT / SAMOA 28-Feb-04
File: Area Azimuth Speed Start Stop COMMENTS
MBES data
280204.0322 Apia 041 7.3 06:56 07:09 044°, 3.5km from Apia
280204.0323 Apia 077 6.9 07:09 07:48 004°, 11.4km from Apia
280204.0324 N Upolu 089 6.9 07:48 08:29 035°, 10km from Cape Utumau'u
280204.0325 N Upolu Gyrocompass "Crash"
280204.0326 N Upolu 100 7.2 09:03 09:49 033°,5.1km from Fagaloa Bay
280204.0327 Fagaloa 222 7.4 09:49 10:31 Fagaloa Bay
280204.0328 Fagaloa 030 6.0 10:31 10:51 Fagaloa Bay
280204.0329 Fagaloa 198 7.1 10:51 11:08 Fagaloa Bay

48 – Samoa: High-Resolution Bathymetry EU EDF-SOPAC Reducing Vulnerability of Pacific ACP States
EU-SOPAC Project Report 112 – Krüger and Kumar 2008
280204.0330 Fagaloa 050 7.2 11:08 11:35 Fagaloa Bay
280204.0331 E Upolu 102 7.2 11:35 12:53 332°, 3.7km from Fanuatapu I.
280204.0332 E Upolu 226 7.9 12:53 13:34 228°, 3.7km from Fanuatapu I.
280204.0333 S Upolu 233 7.7 13:36 15:05
280204.0334 S Upolu 270 7.8 15:05 17:39
280204.0335 S Upolu 258 7.6 17:39 18:38
280204.0336 Apolima 337 6.6 18:38 19:44
280204.0337 Apolima n/a 7.6 19:44 20:30 158°, 5.4km from Salelolaga
Annex #29F SOPAC EU EDF8 PROJECT / SAMOA 29-Feb-04
File: Area Azimuth Speed Start Stop COMMENTS
MBES data
290204.0338 Apolima 040 8.4 06:56 07:44 173°, 3.8km from Cape Tuasivi
290204.0339 N Savai'i 341 7.9 07:44 09:23 320°, 9.3km from Lesolo Point
290204.0340 N Savai'i 300 7.3 09:23 10:56 070°, 20km from Asau Harbour
290204.0341 N Savai'i 266 7.8 10:56 12:42 Approach to Asau Harbour
290204.0342 N Savai'i 262 8.1 12:42 13:02 Pass by Asau Harbour
290204.0343 N Savai'i 327 7.5 13:02 13:53 280°, 4.7km from Asau
290204.0344 W Savai'i 272 6.4 14:13 15:00 200°, 3.6km from Falealupo
290204.0345 S Savai'i 154 6.0 15:00 16:21 320°, 21.6km from Sala'ilua
290204.0346 S Savai'i 154 7.5 16:21 18:28 200°, 2km from Cape Asuisui
290204.0347 S Savai'i 140 6.0 18:28 20:07 220°, 8km from Satufia
290204.0348 S Savai'i 099 6.8 20:07 21:17 223km, 8.6km from Salelolaga
290204.0349 Apolima 073 7.9 21:25 22:12 Approaching Salelolaga Harbour
MAG #18 Data
290204 Cape Tuasivi 08:02 12:20 Maglog Samoa-survey3
MAG #19 Data
290204 Asau 13:05 13:50 Maglog Samoa-survey3
MAG #20 Data
290204 280°, 4.7km from Asau 14:13 21:21 Maglog Samoa-survey3
CTD #10 Data

Samoa: High-Resolution Bathymetry EU EDF-SOPAC Reducing Vulnerability of Pacific ACP States –49
EU-SOPAC Project Report 112 – Krüger and Kumar 2008
290204 X 618572, Y 5509362 13:55 14:10 Cast CTD #10 off Cape Puava
Annex #01M SOPAC EU EDF8 PROJECT / SAMOA 01-Mar-04
File: Area Azimuth Speed Start Stop COMMENTS
MBES data
010304.0350 Apolima 130 8.5 10:52 11:21 In transit to S Apolima Strait
010304.0351 Apolima 185 9.0 11:26 12:28 196°, 7.3km from Apolima Island
010304.0352 Apolima 285 8.0 12:28 13:12 186°, 18.4km from Apolima Island
010304.0353 Apolima 278 7.2 13:13 13:28 195°, 13.3km from Apolima Island
010304.0354 Apolima 145 8.9 13:28 13:45
010304.0355 Apolima 197 8.7 13:45 14:15
010304.0356 Apolima 052 7.8 16:13 16:55 183°, 18.3km from Apolima Island
010304.0357 Apolima 349 7.0 16:55 17:48 176°, 11.6km from Apolima Island
010304.0358 Apolima 010 6.9 17:53 18:46 226°, 3km from Apolima Island
Annex #02M SOPAC EU EDF8 PROJECT / SAMOA 02-Mar-04
File: Area Azimuth Speed Start Stop COMMENTS
MBES data
020304.0361 Apolima 047 7.8 10:45 11:29 Depart Salelolaga/ circumnavigate Savaii
020304.0362 N Savaii 352 8.5 11:35 13:27 119°, 14.3km from Matautu Bay
020304.0363 N Savaii 324 8.4 13:27 14:45 270°, 7km from Matautu Bay
020304.0364 N Savaii 145 8.0 14:45 14:51
020304.0365 N Savaii 270 8.5 16:23 17:29 261°, 19km from Matautu Bay
020304.0366 N Savaii 139 7.9 17:29 20:06 308°, 3.6km from Asau
020304.0367 S Savaii 204 8.3 20:06 20:25 274°, 2.4km from Falealupo
020304.0368 S Savaii 162 6.5 20:25 21:40 175°, 10.4km from Falealupo
020304.0369 S Savaii 143 7.8 21:40 22:40 154°, 18.4km from Falealupo
020304.0370 S Savaii 135 7.6 22:40 23:40 253°, 3.8km from Salailua Bay
020304.0371 S Savaii 125 7.9 23:40 00:40 206°, 3.9km from Cape Suisui
020304.0372 S Savaii 090 8.2 00:40 01:30 100°, 12.7km from Cape Suisui
020304.0373 SW Apolima 070 8.3 01:35 01:40 264°, 16.8km from Apolima Island
020304.0374 S Apolima 060 8.7 01:45 02:06 Heading for Salelolaga Harbour
Annex #03M SOPAC EU EDF8 PROJECT / SAMOA 03-Mar-04
File: Area Azimuth Speed Start Stop COMMENTS

50 – Samoa: High-Resolution Bathymetry EU EDF-SOPAC Reducing Vulnerability of Pacific ACP States
EU-SOPAC Project Report 112 – Krüger and Kumar 2008
MBES data
030304.0375 Apolima 088 7.6 11:08 12:13 In transit to Apia
030304.0376 Apolima 082 7.4 12:13 13:31 329°, 7.9km from Malua, N Upolu
Annex #05M SOPAC EU EDF8 PROJECT / SAMOA 05-Feb-04
File: Area Azimuth Speed Start Stop COMMENTS
ADCP #3 Data
50304 X 725394.18, Y 5472096.16 08:00 Retreived ADCP #3 on 5 March 2004
Apia 15:25 Deploy ADCP #3 on 5 February 2004


