doris&zenith&tropospheric delays available&from&the&ign...
TRANSCRIPT

DORIS Zenith Tropospheric Delays available from the IGN Analysis
Center
Pascal Willis, Olivier Bock, Yoaz Bar-‐Sever, Kamil Teke

SUMMARY
• Overview of DORIS tropospheric results • SpaKal/temporal interpolaKon issues
• Some results
• Conclusions

Recent studies at IGN Reference sta+ons period comparisons results
Snajdrova et al., J Geod., 2006
VLBI / CONT 3
CONT05 2 weeks
VLBI GPS ECMWV WVR
ZTD
Bock et al., Adv. Space Res., 2010
GPS 30
1 year (2007)
GPS ZTD
Teke et al., J. Geod., 2011
VLBI / CONT 3
CONT08 2 weeks
VLBI GPS ECMWV WVR
ZTD gradients
Willis et al., IAG Symp., 2012
GPS 30
1 year (2007)
GPS gradients
Willis et al., IAG Symp., in press
GPS 30
1 year (2010
GPS ZTD gradients
Willis et al., Adv. Space Res., submi_ed
GAVB 1
3 years GPS ECMWF
ZTD gradients

SpaKal/temporal interpolaKon
• Temporal : need to interpolate GPS (or other) and to compare at DORIS data points (related to satellite passes)
• SpaKal : need to correct for dry and wet delays (from antenna reference point to antenna reference point)
NB: especially important for VLBI (2-‐3 km away)

CorrecKng with tropospheric Ke
258 260 262 264 266 268 270 2720.42
0.4
0.38
0.36
0.34
0.32
0.3KOKEE (VLBI) KOLB (DORIS)
DOY 2011
Trop
osph
ere
ties
in m
m
Hydrostatic ties Total (hyd.+wet) ties
258 260 262 264 266 268 270 27231
32
33
34
35
36
37
38
39
40
41HARTRAO (VLBI) HBMB (DORIS)
DOY 2011Tr
opos
pher
e tie
s in
mm
Hydrostatic tiesTotal (hyd.+wet) ties
Kokee Park Hartebeestoech
From Teke et al., in prep.
Need to correct as reference points are different for hydrostaKc + wet

Examples of CONT11 results
15 16 17 18 19 20 21 22 23 24 25 26 27 28 29 30
2120
2130
2140
2150
2160
2170
2180
2190
September 2011
zeni
th to
tal d
elay
s in
mm
BADARY BADB
VLBI VieVSNWM ECMWFDORIS IGN
15 16 17 18 19 20 21 22 23 24 25 26 27 28 29 30
2300
2310
2320
2330
2340
2350
2360
2370
2380
September 2011
zeni
th to
tal d
elay
s in
mm
NYALES20 NYA1 SPJB
VLBI VieVSGPS CODENWM ECMWFDORIS IGN
15 16 17 18 19 20 21 22 23 24 25 26 27 28 29 30
2060
2080
2100
2120
2140
2160
2180
2200
September 2011
zeni
th to
tal d
elay
s in
mm
KOKEE KOKB KOLB
VLBI VieVSGPS CODENWM ECMWFDORIS IGN
15 16 17 18 19 20 21 22 23 24 25 26 27 28 29 301980
2000
2020
2040
2060
2080
2100
2120
September 2011
zeni
th to
tal d
elay
s in
mm
HARTRAO HRAO HBMB
VLBI VieVSGPS CODENWM ECMWFDORIS IGN
FromTeke et al., in prep.

CONT11 results
0 1 2 3 4 5 615
10
5
0
5
10
15
20
Har
tebe
etsh
oek
HBM
B
Koke
eKO
LB
Bada
ryBA
DB
Ny
Ales
und
SPJB
MEA
N(E
CM
WF
DO
RIS
)
mm
0 1 2 3 4 54
2
0
2
4
6
8
10
12
HRAO
HBM
B
KOKB
KOLB
NYA
1SP
JB
MEA
N(GPS
DORIS)
mm
0 1 2 3 4 5 66
4
2
0
2
4
6
8
10
12
14
HAR
TRAO
HBM
B
KOKE
EKO
LB
BADAR
YBA
DB NYA
LES20SP
JB
MEA
N(VLBIDORIS)
mm
DORIS vs. ECMWF DORIS vs. VLBI DORIS vs. GPS
NB: light grey = standard deviaKon of differences, dark grey = mean bias

ZTD vs. number of DORIS satellites
Bock et al., in prep

Comparisons at GAVB (ECMWF)

ZTD comparisons at GAVD (with GPS)
Zoom
From Willis et al., submi_ed
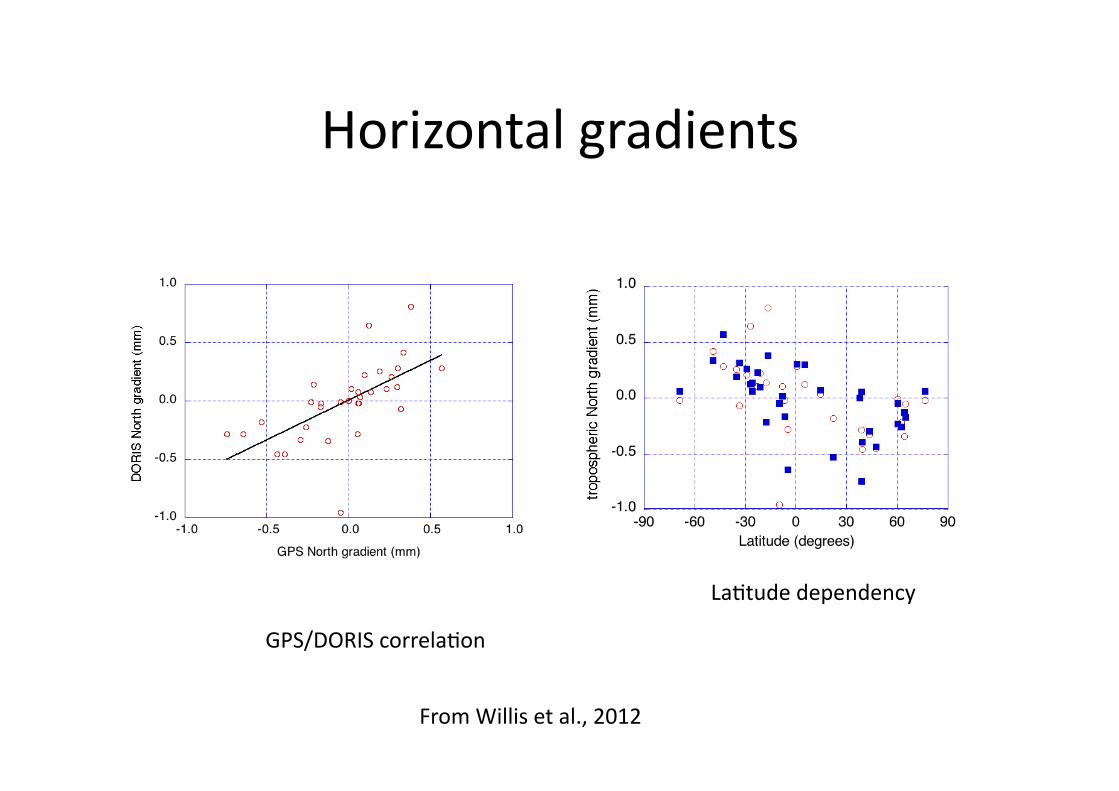
Horizontal gradients
LaKtude dependency
GPS/DORIS correlaKon
From Willis et al., 2012

Tropospheric North gradients / CONT11
15 16 17 18 19 20 21 22 23 24 25 26 27 28 29 30
2
1.5
1
0.5
0
0.5
1
1.5
2
2.5
September 2011
tropo
sphe
re n
orth
gra
dien
ts in
mm
KOKEE KOKB KOLB
VLBI VieVSGPS CODENWM ECMWFDORIS IGN
From Teke et al., in prep.
15 16 17 18 19 20 21 22 23 24 25 26 27 28 29 30
1.5
1
0.5
0
0.5
September 2011
tropo
sphe
re n
orth
gra
dien
ts in
mm
NYALES20 NYA1 SPJB
VLBI VieVSGPS CODENWM ECMWFDORIS IGN

Conclusions
• ZTD : mulKple comparisons were done – VLBI, GPS, ECMWF – Short Kme periods (CONT-‐type comparisons) – Long Kme periods (staKon-‐specific)
• Horizontal gradients – GPS intercomparisons + recent CONT results
Possible use for climatological studies (long-‐term, post-‐processing mode)