doug eichten, dei president craig oliver, dei director of research
DESCRIPTION
Plans to Win During The Great Recession And After: Best practices in analyzing fundraising efficiency and effectiveness. Doug Eichten, DEI President Craig Oliver, DEI Director of Research. DEI’s Benchmarks for Public Radio Fundraising. - PowerPoint PPT PresentationTRANSCRIPT

Plans to Win During The Great Recession And After: Best practices in analyzing fundraising
efficiency and effectiveness
Doug Eichten, DEI PresidentCraig Oliver, DEI Director of Research
DEI’s Benchmarks for Public Radio Fundraising
How do evaluate your station’s fundraising performance?
How do you estimate your station’s potential?
Benchmarks is a management tool.
“Without it, there is no discipline to the fundraising process. It allows me and my staff to demonstrate to others outside the station, such as major donor prospects, that the station is operating efficiently.”
Dave Edwards, General Manager, WUWM Milwaukee
Why benchmarks?
Stations increasingly depend on audience-sensitive revenue.
Decline in federal funding Increased programming costs Positioning station as important community institution

Benchmarks
• 84 DEI member stations participated (to date) in both 2008 and 2009.
• In 2009 this represents:– Approximately 40% of all public radio listening– 1.1 million members– Nearly 17-thousand underwriting clients– 261 million gross revenue – 191 million net revenue
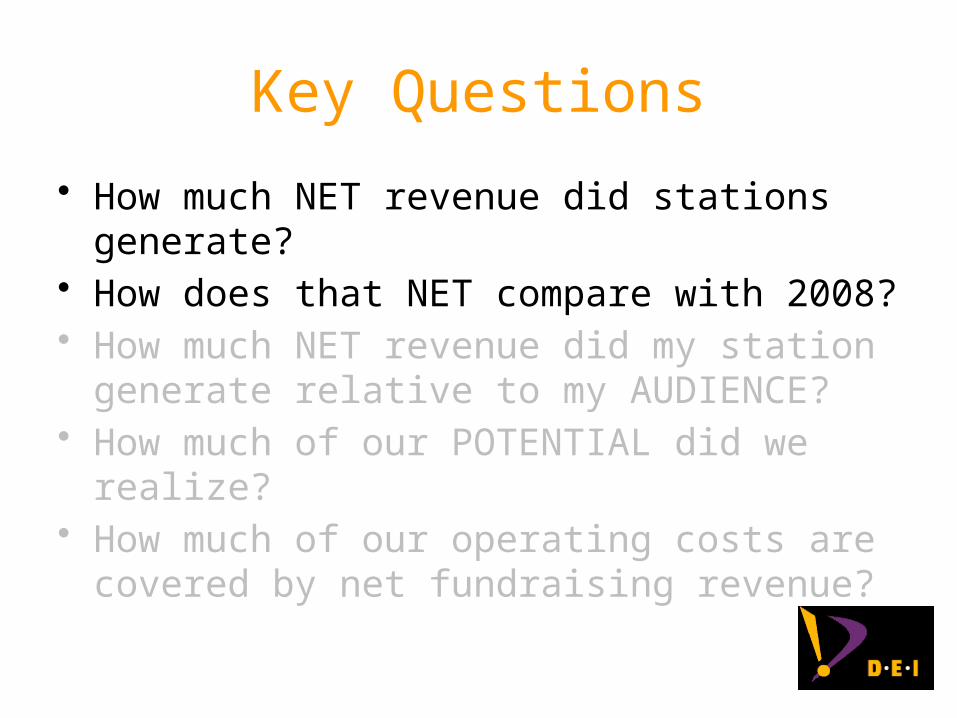
Key Questions
• How much NET revenue did stations generate?• How does that NET compare with prior years? • How much NET revenue did my station generate
relative to my AUDIENCE?• How much of our POTENTIAL did we realize?• How much of our operating costs are covered by
net fundraising revenue?
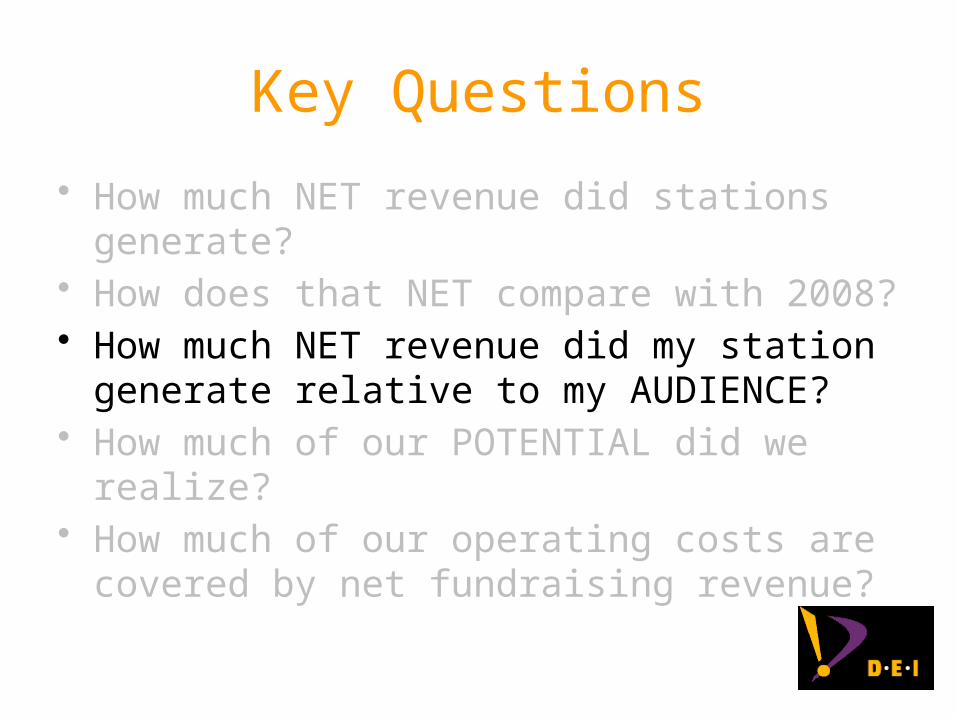
Key Questions
• How much NET revenue did stations generate?• How does that NET compare with 2008? • How much NET revenue did my station generate
relative to my AUDIENCE?• How much of our POTENTIAL did we realize?• How much of our operating costs are covered by
net fundraising revenue?

Only Membership Revenue Grew
Total Membership Underwriting Major Giving0
50
100
150
200
250
Net Revenue (millions)
20082009
Key Questions
• How much NET revenue did stations generate?• How does that NET compare with 2008? • How much NET revenue did my station generate
relative to my AUDIENCE?• How much of our POTENTIAL did we realize?• How much of our operating costs are covered by
net fundraising revenue?

Audience = Listener Hours
• A station’s Average Quarter Hour (AQH) is average listening.
• Listener Hours are total listening
– 1 listener listening for 5 hours = 5 listener hours.
– 5 listeners listening for 1 hour = 5 listener hours.
– Benchmarks Listener Hours are Annual.
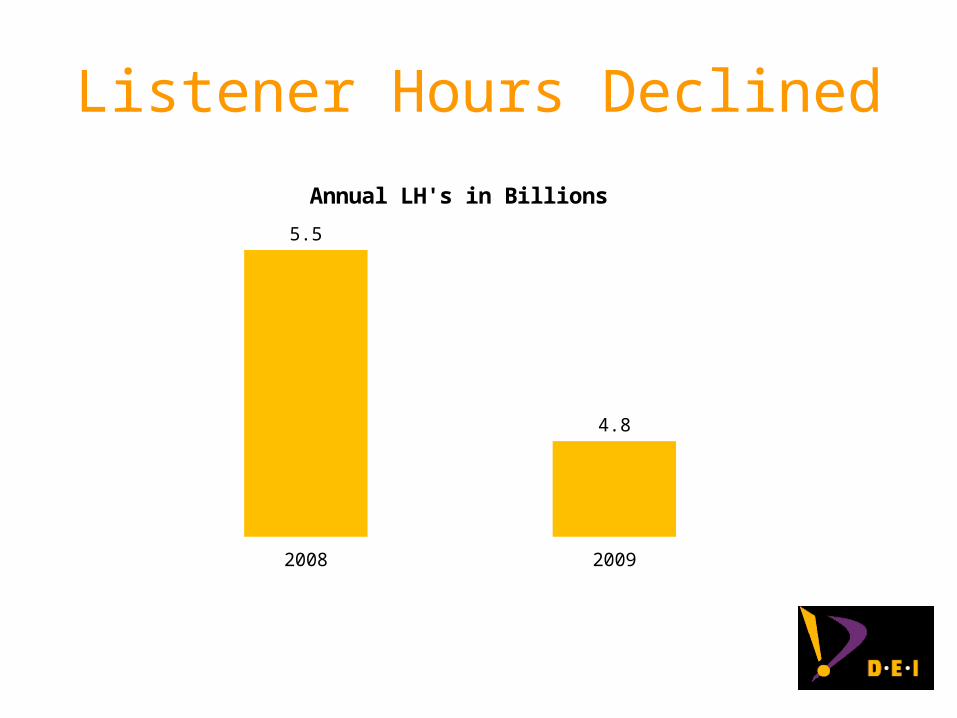
Listener Hours Declined
2008 2009
5.5
4.8
Annual LH's in Billions
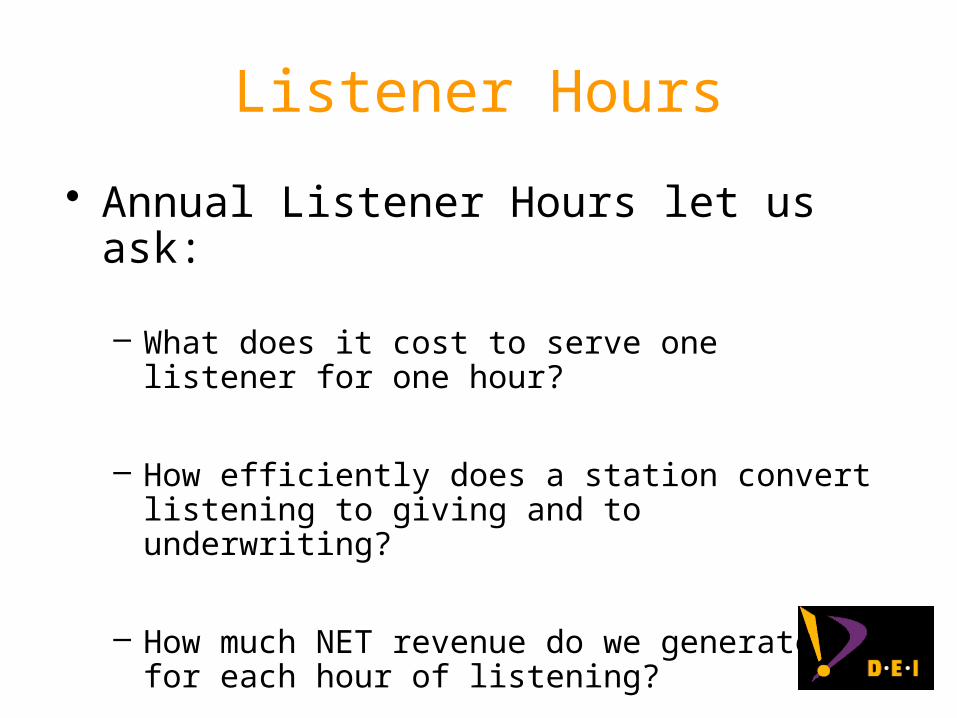
Listener Hours
• Annual Listener Hours let us ask:
– What does it cost to serve one listener for one hour?
– How efficiently does a station convert listening to giving and to underwriting?
– How much NET revenue do we generate for each hour of listening?
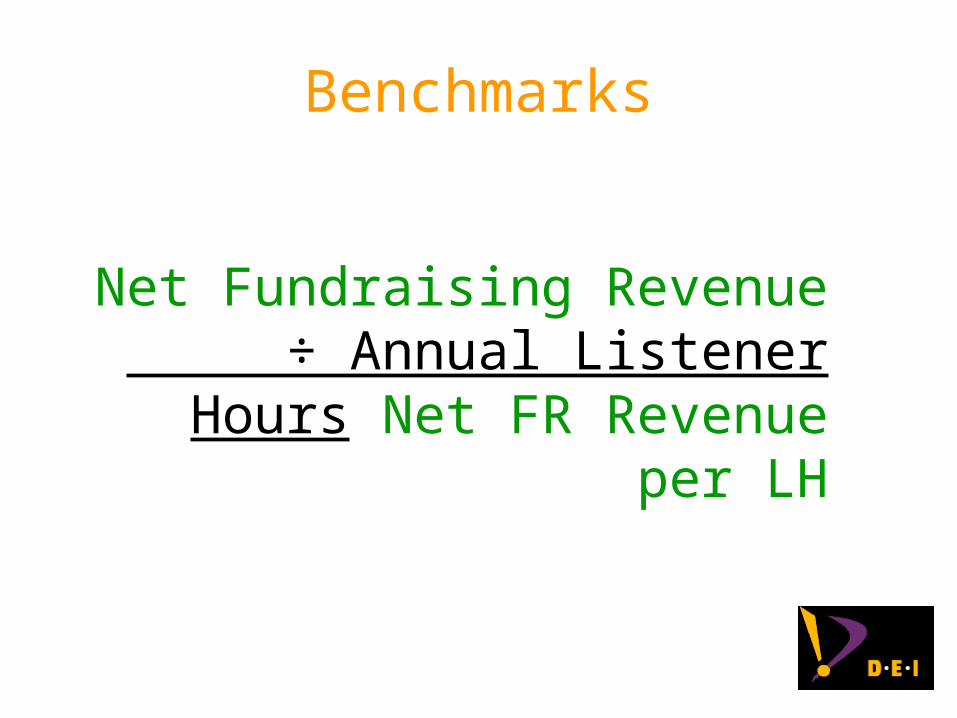
Benchmarks
Net Fundraising Revenue ÷ Annual Listener Hours
Net FR Revenue per LH
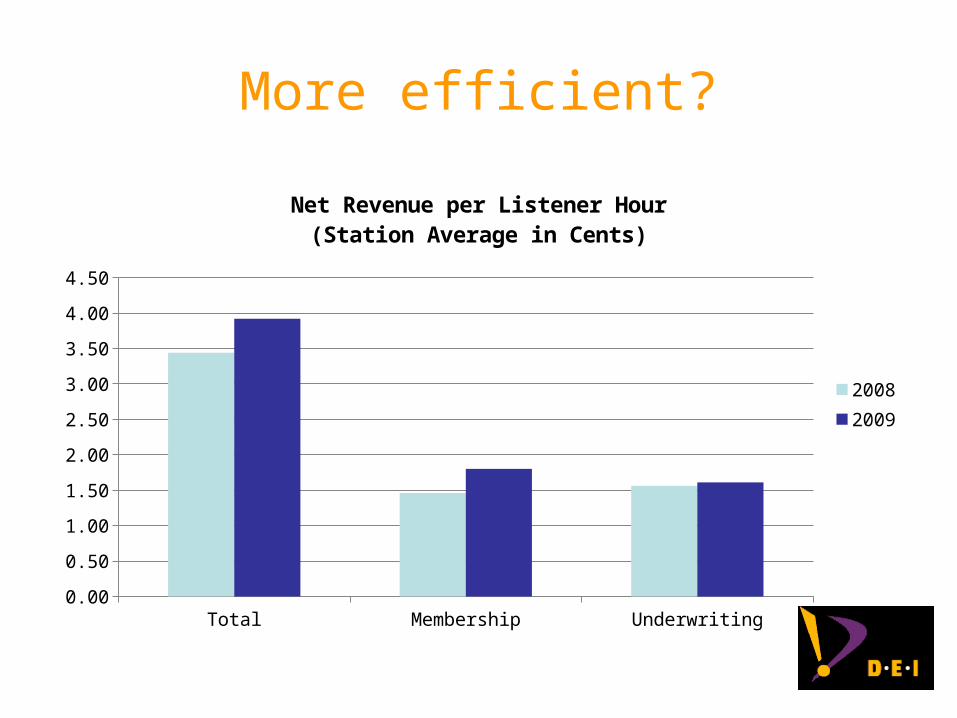
More efficient?
Total Membership Underwriting0.00
0.50
1.00
1.50
2.00
2.50
3.00
3.50
4.00
4.50
Net Revenue per Listener Hour(Station Average in Cents)
20082009
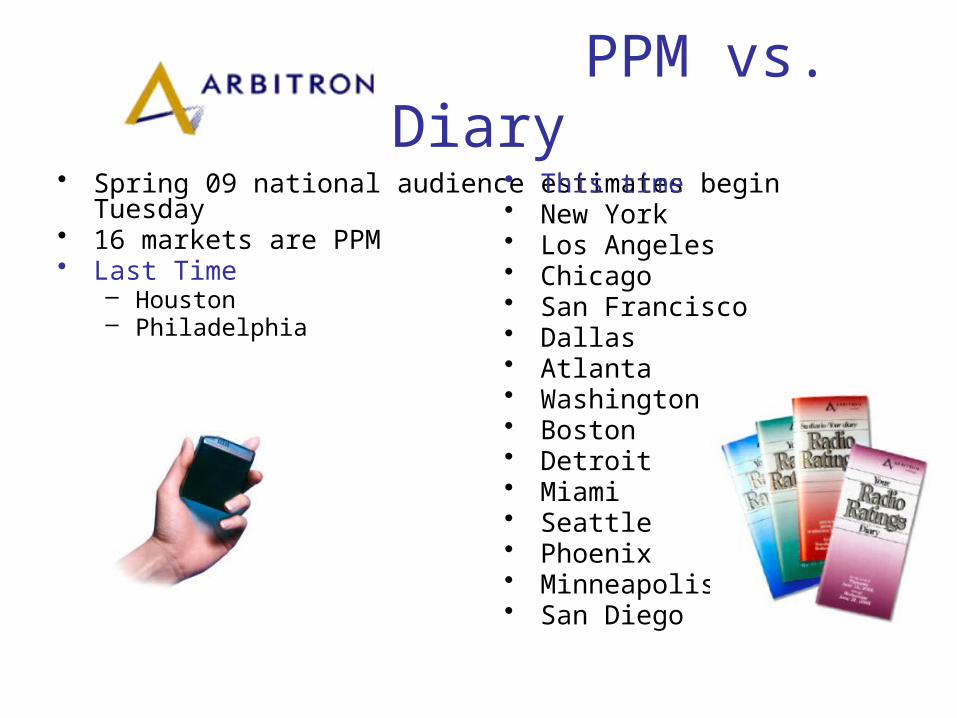
PPM vs. Diary• Spring 09 national audience estimates begin Tuesday• 16 markets are PPM• Last Time
– Houston– Philadelphia
• This time• New York• Los Angeles• Chicago• San Francisco• Dallas• Atlanta• Washington• Boston• Detroit• Miami• Seattle• Phoenix• Minneapolis• San Diego
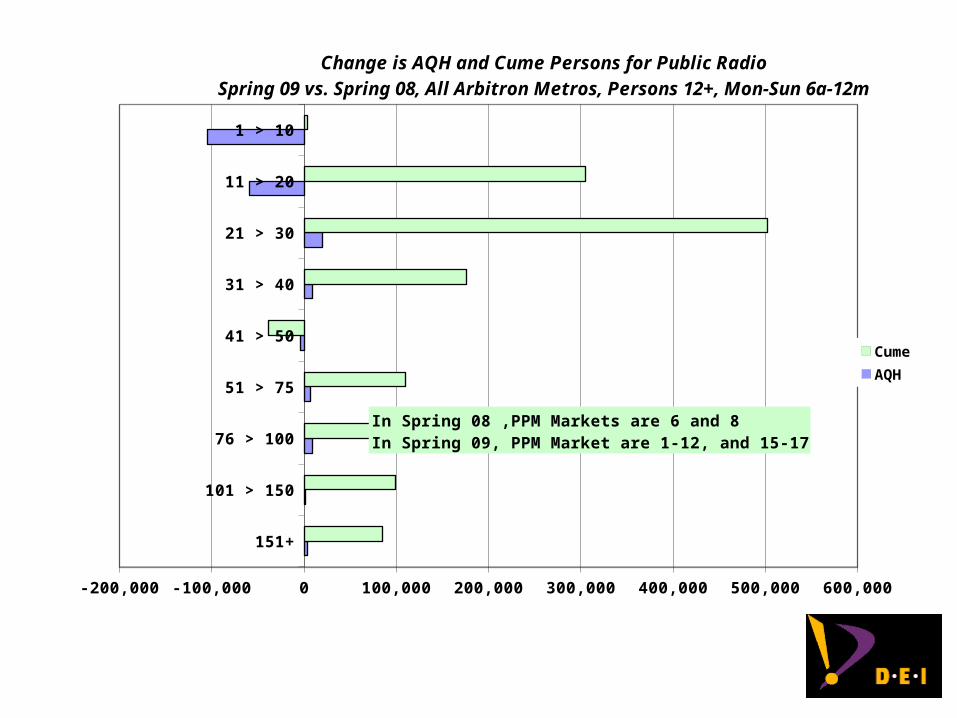
151+
101 > 150
76 > 100
51 > 75
41 > 50
31 > 40
21 > 30
11 > 20
1 > 10
-200,000 -100,000 0 100,000 200,000 300,000 400,000 500,000 600,000
Change is AQH and Cume Persons for Public RadioSpring 09 vs. Spring 08, All Arbitron Metros, Persons 12+, Mon-Sun 6a-12m
Cume
AQH
In Spring 08 ,PPM Markets are 6 and 8In Spring 09, PPM Market are 1-12, and 15-17
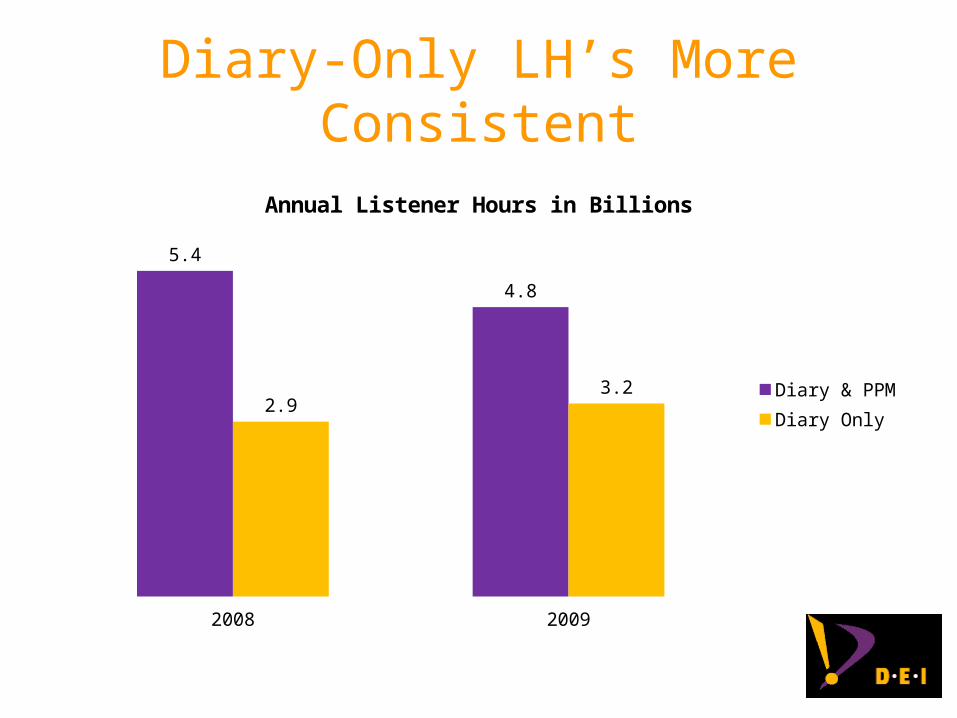
Diary-Only LH’s More Consistent
2008 2009
5.4
4.8
2.93.2
Annual Listener Hours in Billions
Diary & PPMDiary Only

Efficiency
Total Membership Underwriting0.0
0.5
1.0
1.5
2.0
2.5
3.0
3.5
Net Revenue per Listener Hour - Diary Only(Station Average in Cents)
20082009
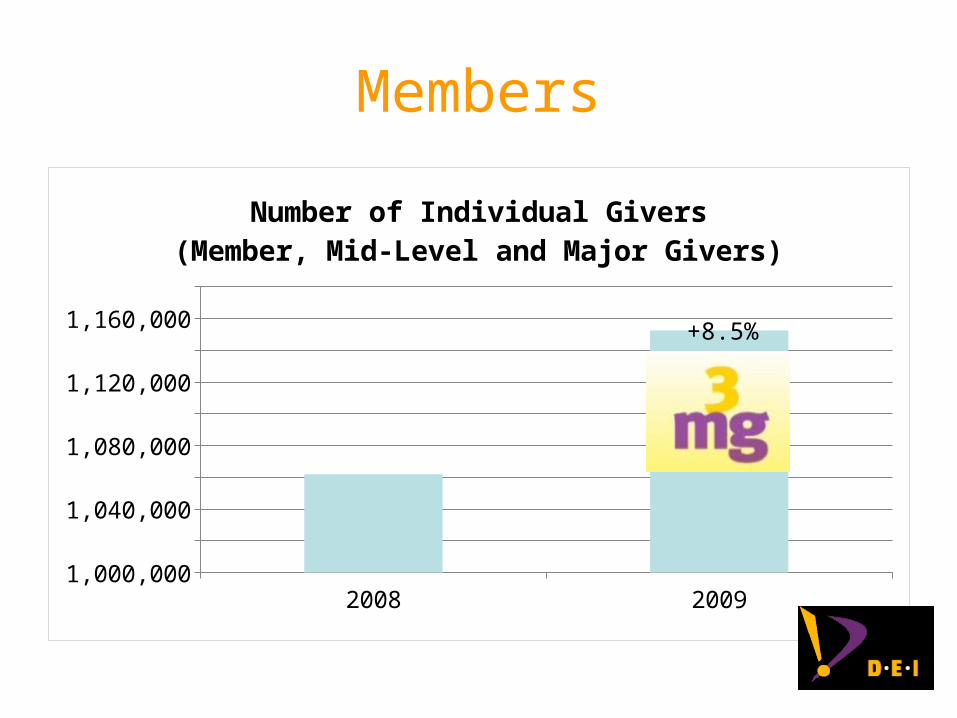
Members
2008 20091,000,000
1,020,000
1,040,000
1,060,000
1,080,000
1,100,000
1,120,000
1,140,000
1,160,000
1,180,000
Number of Individual Givers(Member, Mid-Level and Major Givers)
+8.5%
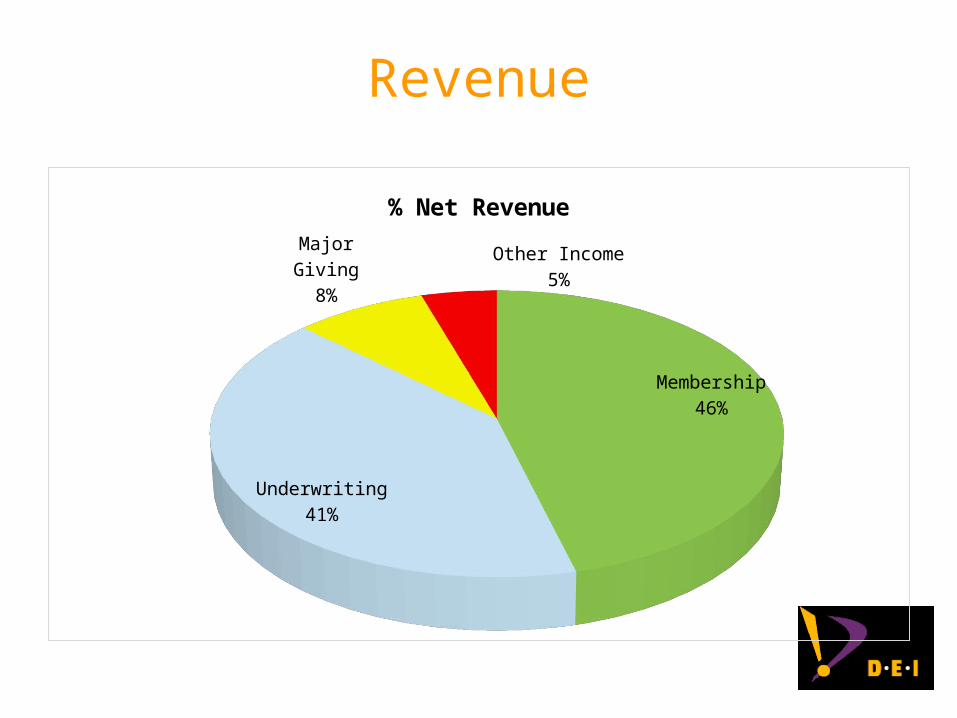
Revenue
Membership46%
Underwriting41%
Major Giv-ing8%
Other Income5%
% Net Revenue
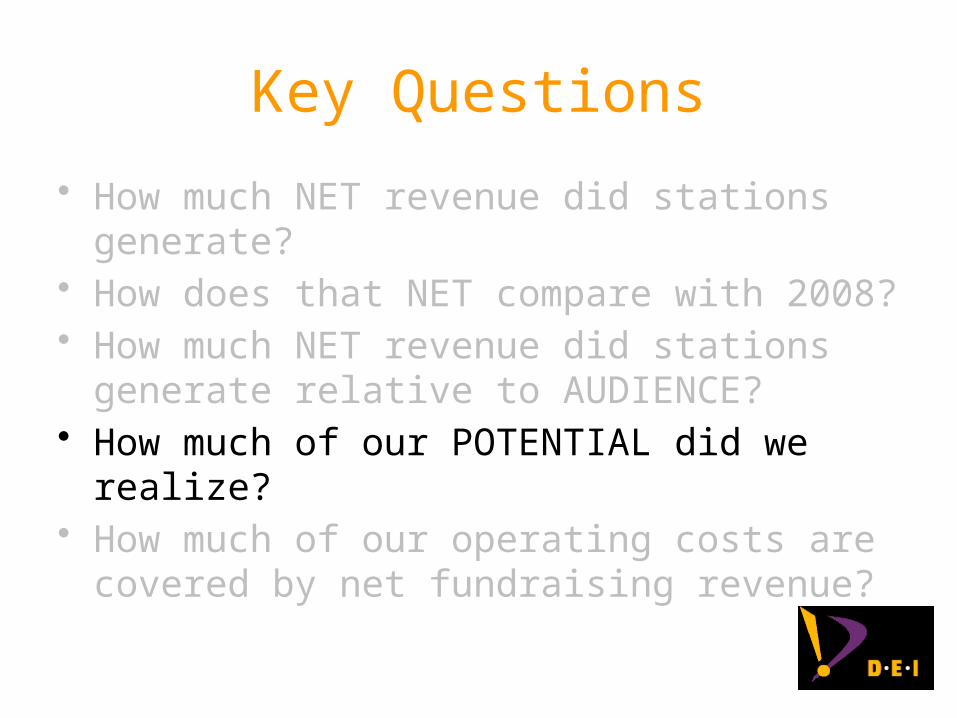
Key Questions
• How much NET revenue did stations generate?• How does that NET compare with 2008? • How much NET revenue did stations generate
relative to AUDIENCE?• How much of our POTENTIAL did we realize?• How much of our operating costs are covered by
net fundraising revenue?

Potential
Stations judge themselves against:
– The Median– 90th Percentile – Potential or goal?
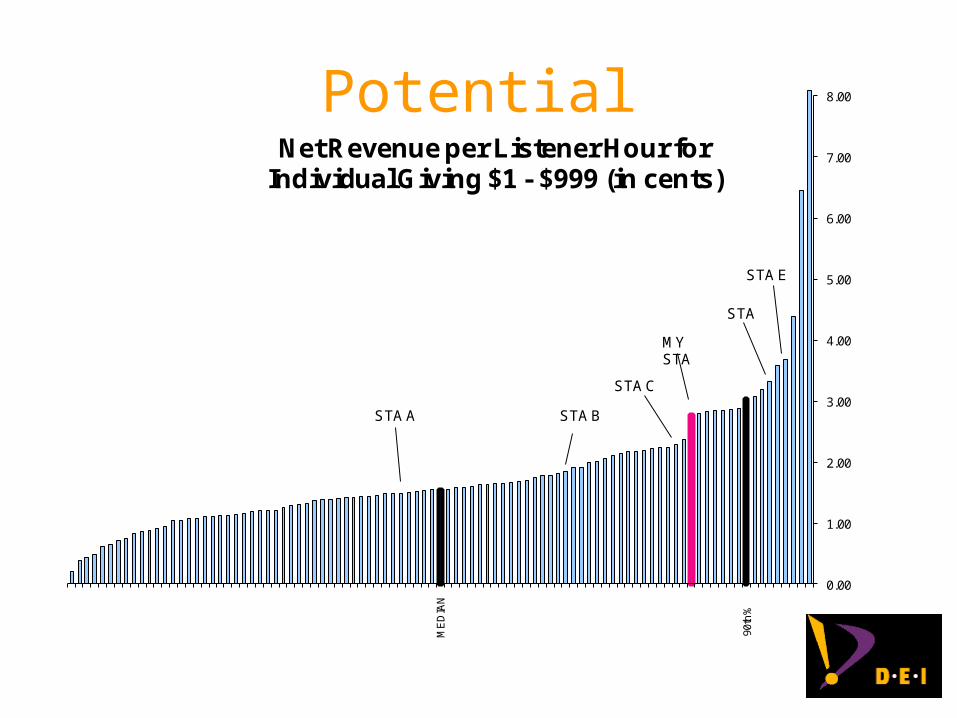
Potential
0.00
1.00
2.00
3.00
4.00
5.00
6.00
7.00
8.00
90th
%
ME
DIA
N
Net Revenue per Listener Hour for Individual Giving $1 - $999 (in cents)
MY STA
STA B
STA C
STA
STA E
STA A

Membership Potential
Membership
2009 Net RevenueNet @ 2.4 cents per/LH (90th %)
$87,783,457$116,864078
Potential $29,080,621
Nearly $30m in revenue is “left on the table.”
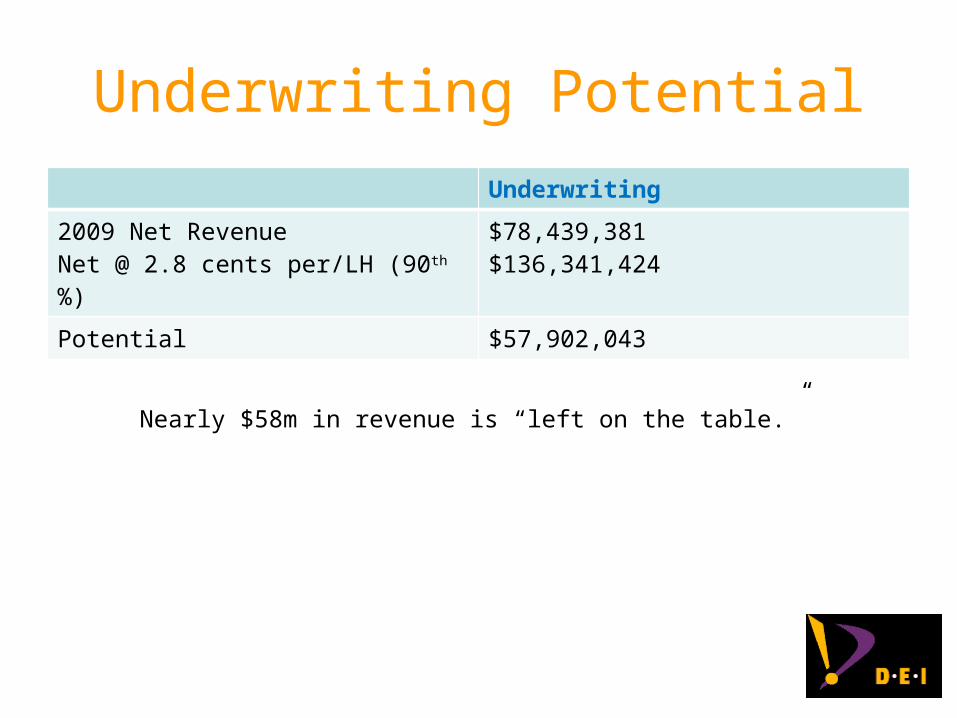
Underwriting Potential
Underwriting
2009 Net RevenueNet @ 2.8 cents per/LH (90th %)
$78,439,381$136,341,424
Potential $57,902,043
Nearly $58m in revenue is “left on the table.”
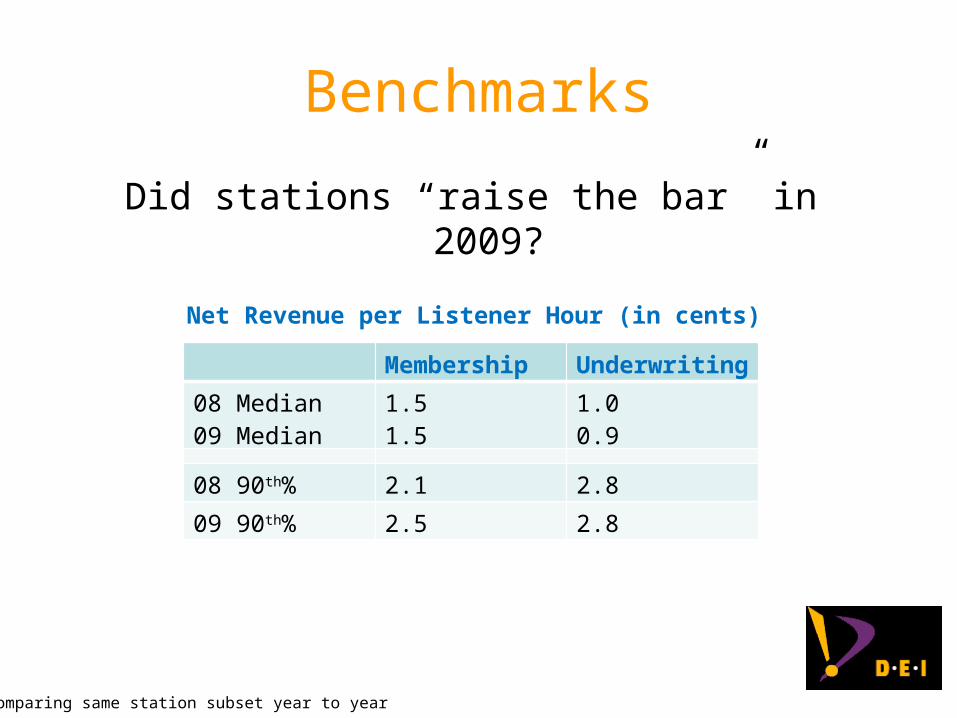
Benchmarks
Did stations “raise the bar” in 2009?
comparing same station subset year to year
Membership Underwriting
08 Median09 Median
1.51.5
1.00.9
08 90th% 2.1 2.8
09 90th% 2.5 2.8
Net Revenue per Listener Hour (in cents)
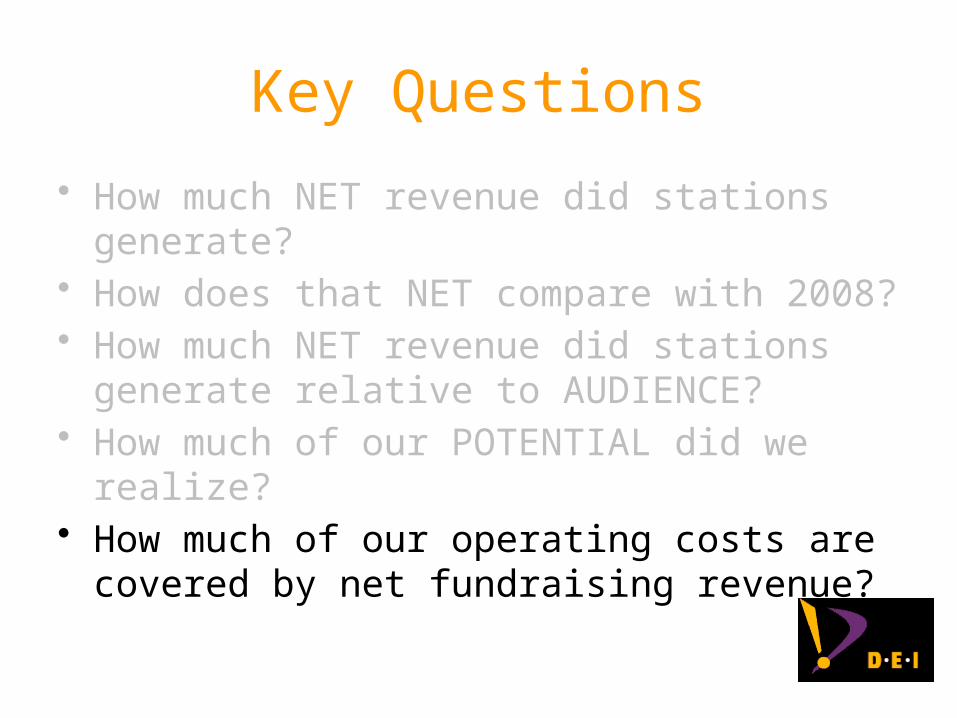
Key Questions
• How much NET revenue did stations generate?• How does that NET compare with 2008? • How much NET revenue did stations generate
relative to AUDIENCE?• How much of our POTENTIAL did we realize?• How much of our operating costs are covered by
net fundraising revenue?
Benchmarks
• Community Financial Support Index (CFSI)
– Are operating costs, after the cost of fundraising, covered by listener-generated NET revenue?
– An index of 100 means the station is fully covering its costs through fundraising.
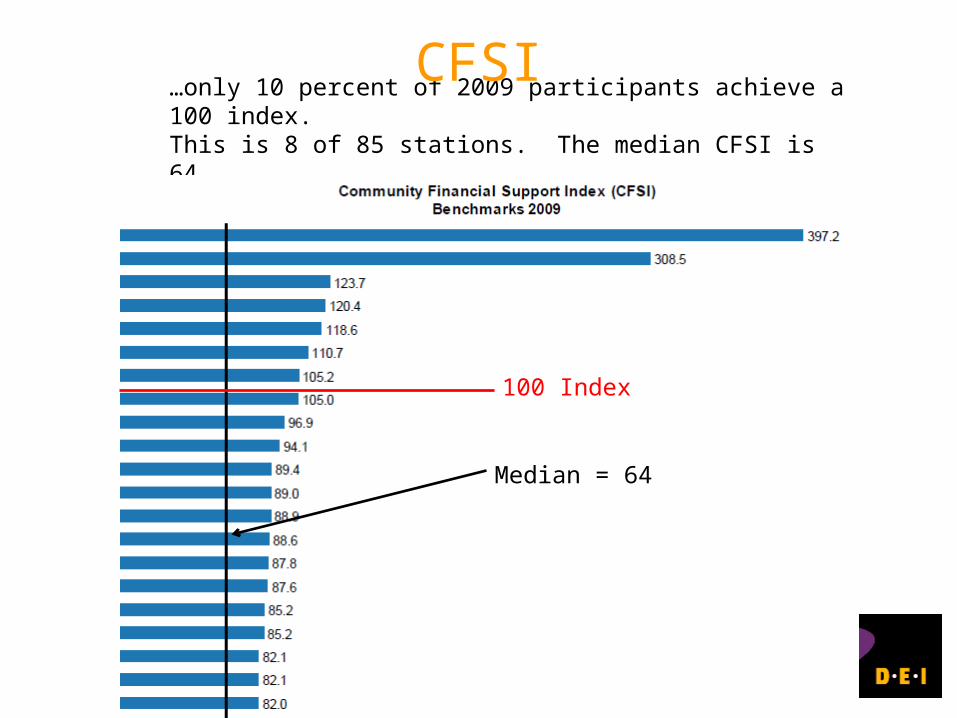
…only 10 percent of 2009 participants achieve a 100 index. This is 8 of 85 stations. The median CFSI is 64.
CFSI
100 Index
Median = 64
• The more a station relies on net fundraising revenue to pay for operations, the more control it.has over its own future
• Conversely, the more a station relies on subsidies to pay for its operations, the less control the station has over its future.
Benchmarks
• These preliminary findings are consistent with early 09 DEI member survey– Membership revenue up or flat.– More members– Underwriting down or flat, especially in large
markets.
Benchmarks
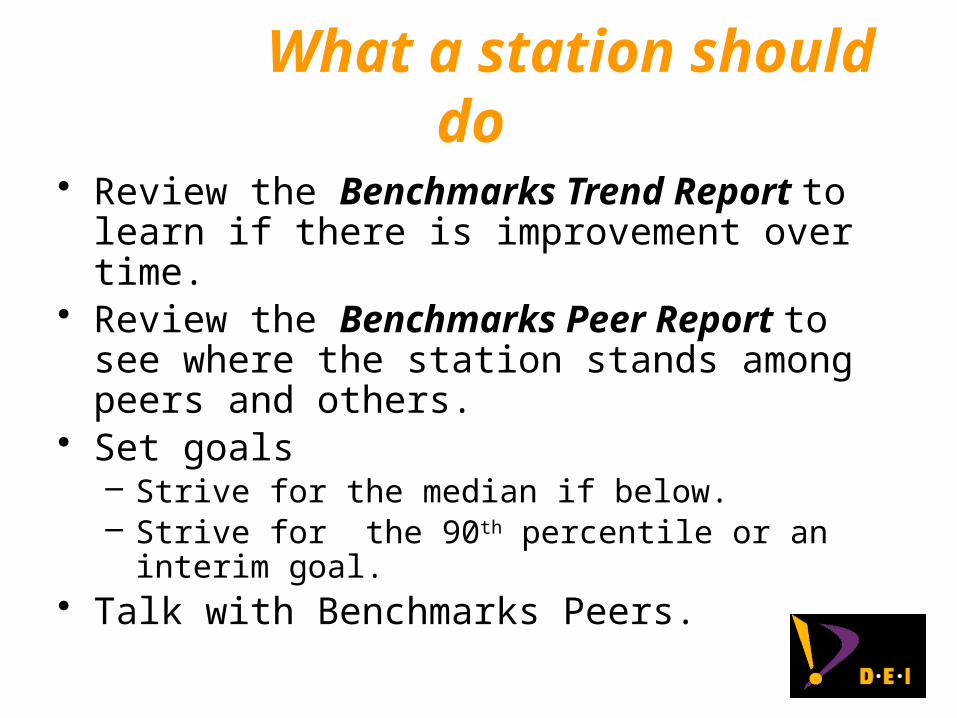
What a station should do
• Review the Benchmarks Trend Report to learn if there is improvement over time.
• Review the Benchmarks Peer Report to see where the station stands among peers and others.
• Set goals– Strive for the median if below.– Strive for the 90th percentile or an interim goal.
• Talk with Benchmarks Peers.
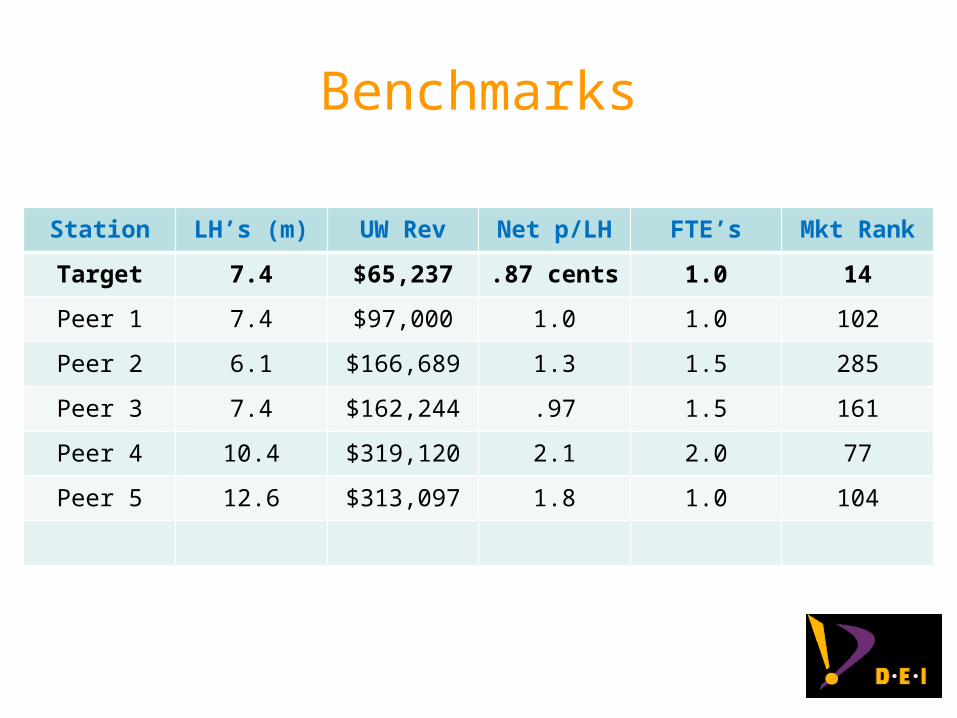
Station LH’s (m) UW Rev Net p/LH FTE’s Mkt Rank
Target 7.4 $65,237 .87 cents 1.0 14
Peer 1 7.4 $97,000 1.0 1.0 102
Peer 2 6.1 $166,689 1.3 1.5 285
Peer 3 7.4 $162,244 .97 1.5 161
Peer 4 10.4 $319,120 2.1 2.0 77
Peer 5 12.6 $313,097 1.8 1.0 104
Benchmarks
DEI Benchmarks
• Doug Eichten, President– [email protected]
• Craig Oliver, Director of Research– [email protected]
• Jay Clayton, Individual Giving Coordinator– [email protected]