download the acea economic and market report · passenger car sales across the european continent...
TRANSCRIPT

Economic and Market Report
EU Automotive Industry Quarter 4 2017
March 2018

ACEA Economic and Market Report: Quarter 4 2017 – March 2018 1
CONTENTS EU economic outlook ..................................................................................................................... 2
Passenger cars ................................................................................................................................ 4
Registrations .............................................................................................................................. 4
World ...................................................................................................................................... 4
The European Union ............................................................................................................... 6
Passenger car registrations by fuel type .............................................................................. 8
Production ................................................................................................................................. 10
World ..................................................................................................................................... 10
The European Union .............................................................................................................. 13
Trade ......................................................................................................................................... 14
Imports .................................................................................................................................. 15
Exports .................................................................................................................................. 16
Commercial vehicles...................................................................................................................... 17
Registrations in the EU .............................................................................................................. 17
New light commercial vehicles (LCV) up to 3.5 tonnes ....................................................... 19
New medium and heavy commercial vehicles (MHCV) over 3.5 tonnes ..............................20
New medium and heavy buses and coaches (MHBC) over 3.5 tonnes ................................. 21
Global production outlook .........................................................................................................22
Trade .........................................................................................................................................24
Imports .................................................................................................................................. 25
Exports ................................................................................................................................. 26

ACEA Economic and Market Report: Quarter 4 2017 – March 2018 2
EU ECONOMIC OUTLOOK
In 2017, the EU economy performed significantly better than expected at the beginning of the year;
the result of improved labour market conditions and stronger domestic demand. The EU’s GDP
grew by 2.4% last year, marking the highest growth rate in 10 years. For its Winter Forecast, the
European Commission also revised its projections upwards: EU GDP is now estimated to grow by
2.3% in 2018 and 2.0% in 2019. Nevertheless, the Brexit negotiations and a global trend towards
more protectionist trade policy are still posing a serious threat to this growth.
Figure 1: EU GDP growth forecast (in %)
SOURCE: WINTER 2018 ECONOMIC FORECAST, EUROPEAN COMMISSION

ACEA Economic and Market Report: Quarter 4 2017 – March 2018 3
Table 1: European Economic Forecast - Winter 2018
EU FORECAST 2017 2018 2019
GDP GROWTH (%, YOY) 2.4 2.3 2.0
INFLATION (%, YOY) 1.7 1.9 1.8
UNEMPLOYMENT (%) 7.8 7.3 7.0
SOURCE: EUROPEAN COMMISSION, DG ECFIN
Despite increasing energy prices, inflation in the European Union is forecast to rise only modestly in
the next few years. According to the Commission’s latest estimates, the HICP1 inflation indicator
reached 1.7% in 2017. Looking ahead, inflation is expected to increase slightly to 1.9% in 2018 and
then reduce to 1.8% in 2019.
Thanks to the improving EU labour market, unemployment is expected to continue to decrease in
the years to come, reaching the lowest level since early 2009. The EU unemployment rate is
projected to decline from 7.8% last year to 7.0% in 2019, as strong domestic demand and moderate
wage growth will continue to sustain job creation.
1 Harmonised Index of Consumer Prices

ACEA Economic and Market Report: Quarter 4 2017 – March 2018 4
PASSENGER CARS
REGISTRATIONS
WORLD
Passenger car sales across the European continent increased by 3.8% in 2017, totalling 18 million
units. After a strong first half of the year, EU registrations slowed during the third and the fourth
quarter of 2017, mainly due to the stagnant performance of Western European markets. With 15.1
million passenger cars sold in 2017, European Union results were 3.4% higher than the previous year.
Representing 19% of the global car market, the European Union came second, only after China.
Throughout 2017, Russian car demand showed signs of recovery, thanks to more stable energy
markets, improved oil prices and better economic conditions – resulting in a growth rate of 12.3%
and counting almost 1.5 million new cars registered in total. Ukraine mirrored this positive trend,
showing a substantial increase in car sales (+24.8%) in 2017. The Turkish market ended the year with
a negative result (-3.6%), although far better than the -9.6% recorded in the first semester of 2017.
In 2017, Japanese car registrations were 6.4% higher than in the preceding year, with domestic
demand improving after the government decided to delay a hike in consumption tax to October
2019. South Korean car sales, however, were slightly down (-3.1%) compared to 2016.
In the United States, passenger car volumes went down 3.3% in 2017. About 14 million cars were
sold in total, still representing 17.4% of the global market and the United States ranking third after
China and the European Union.
Brazilian car sales improved noticeably (+10.5%) in 2017, with consumers having easier access to
credit for automotive purchases (lending constraints held back Brazilian vehicle demand in the
recent past). As a result, total passenger car demand in South America increased by 13.0% when
compared to 2016, totalling 3.5 million new cars sold.
China finished the year positively, with passenger car demand going up 4.3% in 2017 and accounting
for roughly 30% of global car sales. Looking at other emerging markets, demand for passenger cars
in India grew consistently throughout 2017, with sales being 10.0% higher than the year before.
Globally, some 80 million passenger cars were sold in 2017 or 3.2% more than in 2016.

ACEA Economic and Market Report: Quarter 4 2017 – March 2018 5
Table 2: World new passenger car registrations
20172 2016 % change 17/16 % share 2017
EUROPE 18,075,171 17,409,995 +3.8 22.6
EU3 15,137,732 14,641,415 +3.4 19.0
EFTA 493,955 490,363 +0.7 0.6
RUSSIA 1,474,576 1,312,950 +12.3 1.8
TURKEY 729,531 756,938 -3.6 0.9
UKRAINE 79,244 63,492 +24.8 0.1
OTHERS-EUROPE4 160,133 144,837 +10.6 0.2
NORTH AMERICA5 16,825,892 17,275,354 -2.6 21.1
of which the US 13,925,270 14,394,986 -3.3 17.4
SOUTH AMERICA 3,520,091 3,114,327 +13.0 4.4
of which Brazil 1,863,171 1,686,585 +10.5 2.3
ASIA 37,260,491 35,578,051 +4.7 46.6
CHINA 24,040,133 23,057,049 +4.3 30.1
JAPAN 4,386,472 4,123,299 +6.4 5.5
INDIA 3,321,095 3,020,371 +10.0 4.2
SOUTH KOREA 1,479,066 1,527,105 -3.1 1.9
OTHERS-ASIA6 4,033,725 3,850,227 +4.8 5.0
MIDDLE EAST/AFRICA 4,200,340 4,025,478 +4.3 5.3
WORLD 79,881,985 77,403,205 +3.2 100.0
SOURCE: IHS MARKIT, ACEA
2 Provisional figures
3 Data for Malta not available
4 Includes Belarus, Bosnia-Herzegovina, Kazakhstan, Macedonia, Serbia and Uzbekistan
5 Based on production type
6 Includes Hong Kong, Taiwan and all the other South Asian countries, excluding India

ACEA Economic and Market Report: Quarter 4 2017 – March 2018 6
THE EUROPEAN UNION
Overall in 2017, EU demand for cars grew (+3.4%) for the fourth consecutive year, reaching more
than 15 million new passenger cars registered for the first time since 2007. Growth was positive in
October and November (up 5.9% in both months) but slowed down in December
(-4.9%) – due in part to one less working day than December 2016.
Among the five big markets, Italy (+7.9%) and Spain (+7.7%) recorded the strongest gains, followed
by France (+4.7%) and Germany (+2.7%). By contrast, last year demand for cars in the United
Kingdom declined (‐5.7%) for the first time in six years.
Noteworthy is the strong performance of the new EU member states, where registrations went up
by 12.8% during the year.
Table 3: Top 5 – New passenger car registrations in the EU
2017 2016 % change 17/16
GERMANY 3,441,262 3,351,607 +2.7
UNITED KINGDOM 2,540,617 2,692,786 -5.7
FRANCE 2,110,748 2,015,177 +4.7
ITALY 1,970,497 1,825,892 +7.9
SPAIN 1,234,931 1,147,009 +7.7
EU7 15,137,732 14,641,415 +3.4
SOURCE: ACEA
7 Data for Malta not available

ACEA Economic and Market Report: Quarter 4 2017 – March 2018 7
Figure 2: New passenger car registrations in the EU | 12-month trend
SOURCE: ACEA

ACEA Economic and Market Report: Quarter 4 2017 – March 2018 8
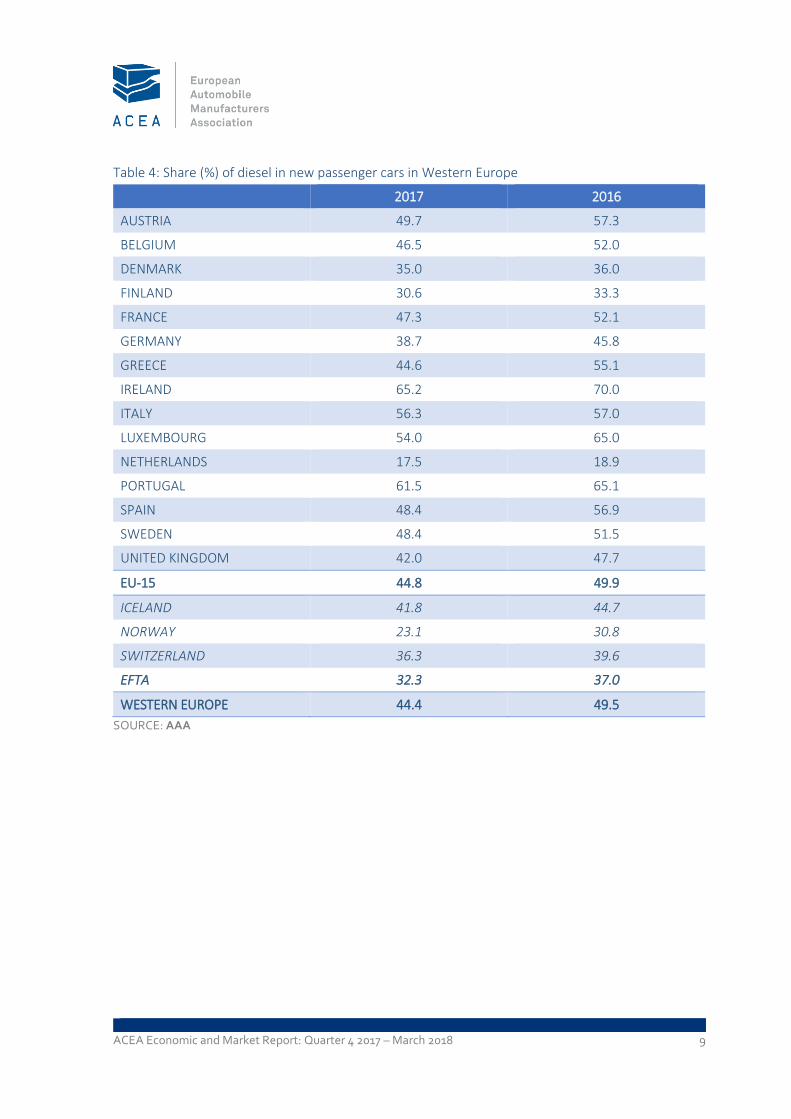
Passenger car registrations by fuel type
Overall in 2017, about 45% of all new passenger cars registered in Western Europe ran on diesel;
around five percentage points lower than in the preceding year. In the EU-15, diesel’s market share
fell from 49.9% to 44.8% of total passenger car registrations. However, this drop was largely offset
by an increase in petrol car sales.
Petrol vehicles are now the most sold car type in the EU-15, accounting for almost half of new
passenger car sales. Alternatively-powered cars accounted for 5.8% of the market in 2017, while
electrically‐chargeable vehicles (ECVs) made up for only 1.5% of all cars sold across the EU last year.
Throughout the year, diesel’s market share contracted in all Western European countries, especially
in Luxembourg and Greece (losing more than ten percentage points in both markets). However, the
share of diesel cars did remain stable in Italy and Denmark, with drops of around one percentage
point. Ireland remains the country with the highest diesel market share (65.2%) in Western Europe,
followed by Portugal (61.5%) and Italy (56.3%).
Figure 3: New passenger car in the EU-15 by fuel type, % share | 2017
SOURCE: ACEA, AAA
Petrol49.4%
Diesel44.8%
Electrically-chargeable vehicles
1.5%
Hybrid electric vehicles
2.9%
Other alternative fuels1.4%
Other5.8%
ACEA Economic and Market Report: Quarter 4 2017 – March 2018 9
Table 4: Share (%) of diesel in new passenger cars in Western Europe
2017 2016
AUSTRIA 49.7 57.3
BELGIUM 46.5 52.0
DENMARK 35.0 36.0
FINLAND 30.6 33.3
FRANCE 47.3 52.1
GERMANY 38.7 45.8
GREECE 44.6 55.1
IRELAND 65.2 70.0
ITALY 56.3 57.0
LUXEMBOURG 54.0 65.0
NETHERLANDS 17.5 18.9
PORTUGAL 61.5 65.1
SPAIN 48.4 56.9
SWEDEN 48.4 51.5
UNITED KINGDOM 42.0 47.7
EU-15 44.8 49.9
ICELAND 41.8 44.7
NORWAY 23.1 30.8
SWITZERLAND 36.3 39.6
EFTA 32.3 37.0
WESTERN EUROPE 44.4 49.5
SOURCE: AAA

ACEA Economic and Market Report: Quarter 4 2017 – March 2018 10
PRODUCTION
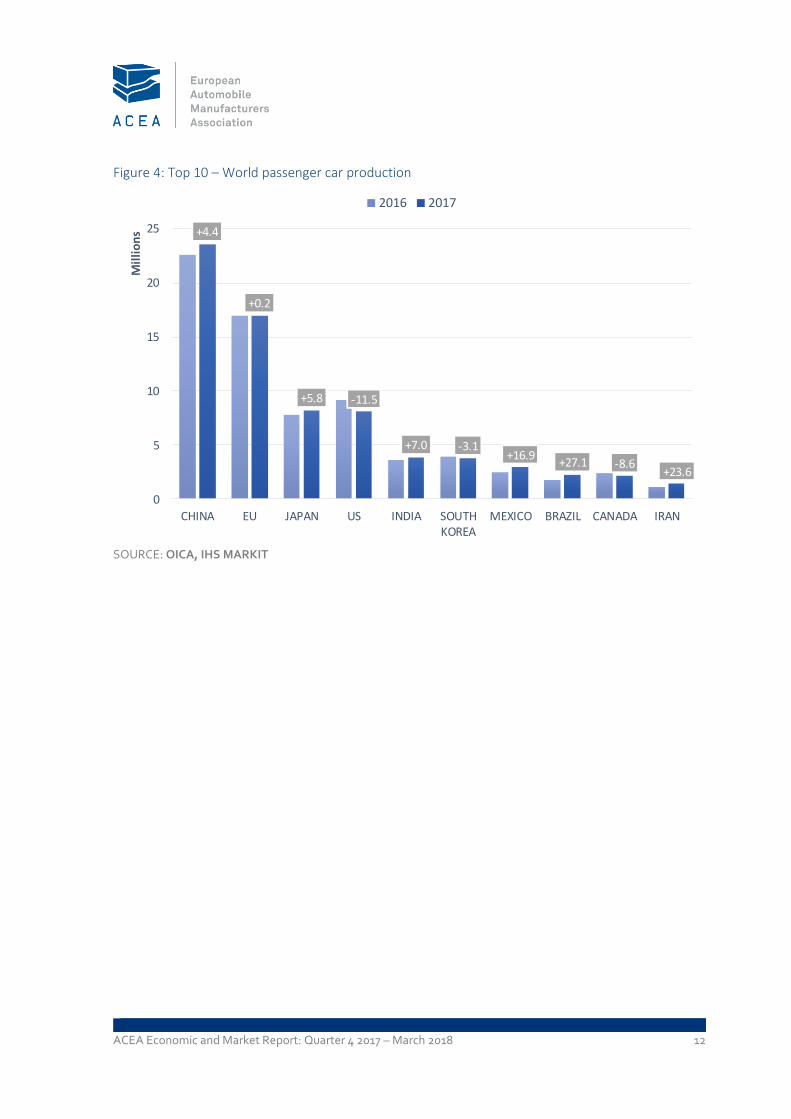
WORLD
European passenger car production totalled 19.6 million units in 2017, up 2.6% compared to the
previous year. Growth was largely driven by the recovery of production in Eastern European
countries and Ukraine in particular (+107.4%), where car production has more than doubled. Output
also increased markedly in Turkey and Russia, going up 21.4% and 19.9% respectively.
By contrast, US output declined substantially (‐11.5%) in 2017, as domestic demand for passenger
cars continued to slow down last year. Total car production in the United States amounted to 8
million units in 2017, more than one million less than in the preceding year.
Passenger car production in South America recovered significantly in the last quarter of 2017,
ending the year 20.4% higher than 2016 with more than 2.6 million units built in total. Brazil’s
increasing domestic demand was the main driver of this trend, with Brazilian production posting a
double-digit increase (+27.1%) and accounting for nearly 2.3 million cars – almost half a million more
than in 2016.
Chinese production grew only moderately (+4.4%) in 2017, reaching a total of 23.6 million cars.
Growth slowed considerably in the second half of the year, mainly due to taxation measures that
entered into force at the end of 2017. Nevertheless, China maintained its leading position among
global passenger car producers, accounting for 29% of all cars produced around the world last year.
Japanese output increased by 5.8% in 2017 to reach 8.2 million passenger cars – the result of strong
exports and recovering domestic sales. Contrariwise, production declined by 3.1% in South Korea,
with 3.8 million units built in total.
Indian output growth remained strong (+7.0%) throughout 2017, with 3.9 million passenger cars
being produced. Production in Thailand, however, contracted slightly – although less strong than
during the first semester of the year. Indonesian car production recovered during the last quarter of
the year, ending 2017 with output 1.8% higher than in 2016.
In the Middle East, production trends improved considerably in 2017 (+15.9%), mostly thanks to the
Iranian industry’s positive momentum (+23.6%).
More than 80 million passenger cars were produced around the world in 2017, or 2.6% more than in
2016.

ACEA Economic and Market Report: Quarter 4 2017 – March 2018 11
Table 5: World passenger car production
20178 2016 % change 17/16 % share 2017
EUROPE 19,609,568 19,114,101 +2.6 24.4
EU 16,957,230 16,925,471 +0.2 21.1
RUSSIA 1,338,878 1,116,922 +19.9 1.7
TURKEY 1,089,869 897,586 +21.4 1.4
UKRAINE 7,306 3,523 +107.4 0.01
OTHERS-EUROPE9 216,285 170,599 +26.8 0.3
NORTH AMERICA 13,183,872 14,010,299 -5.9 16.4
of which the US 8,081,623 9,127,015 -11.5 10.1
SOUTH AMERICA 2,631,573 2,185,461 +20.4 3.3
of which Brazil 2,277,604 1,791,764 +27.1 2.8
ASIA 42,652,783 41,141,290 +3.7 53.2
CHINA 23,554,031 22,555,454 +4.4 29.4
JAPAN 8,212,033 7,762,054 +5.8 10.2
INDIA 3,886,293 3,631,096 +7.0 4.8
SOUTH KOREA 3,783,030 3,905,767 -3.1 4.7
INDONESIA 998,668 980,879 +1.8 1.2
THAILAND 986,501 999,117 -1.3 1.2
OTHERS-ASIA10 1,232,227 1,306,923 -5.7 1.5
MIDDLE EAST/AFRICA 2,142,618 1,847,942 +15.9 2.7
of which IRAN 1,408,398 1,139,463 +23.6 1.8
WORLD 80,220,414 77,839,234 +2.6 100.0
SOURCE: OICA, IHS MARKIT
8 Provisional figures
9 Includes Belarus, Kazakhstan, Serbia and Uzbekistan
10 Includes Taiwan, Australia, Malaysia, Pakistan, Philippines and Vietnam
ACEA Economic and Market Report: Quarter 4 2017 – March 2018 12
Figure 4: Top 10 – World passenger car production
SOURCE: OICA, IHS MARKIT
+4.4
+0.2
+5.8 -11.5
+7.0 -3.1+16.9
+27.1 -8.6+23.6
0
5
10
15
20
25
CHINA EU JAPAN US INDIA SOUTHKOREA
MEXICO BRAZIL CANADA IRAN
Mil
lio
ns
2016 2017

ACEA Economic and Market Report: Quarter 4 2017 – March 2018 13
THE EUROPEAN UNION
With around 17 million passenger cars built in the EU last year, pre-crisis levels from 2007 were
exceeded for the first time. The European Union maintained its position as the world’s second
largest producer of passenger cars, accounting for more than 21% of global car production in 2017.
Among the main producing countries in Western Europe, output grew in France (+6.9%) and Italy
(+4.2%), while car production contracted in the United Kingdom (-3.0%), Spain (-2.7%) and
Germany (-1.8%).
Results were diverse in Central Europe, with car output falling in Hungary (-10.0%) and Poland
(-7.2%) but increasing in the Czech Republic (+5.2%). Romania recovered from the decline observed
during the first three quarters of 2017 (-9.0%), ending the year with a modest increase (+1.6%).
Table 6: Top 10 – Passenger car producers in the EU
201711 2016 % change 17/16
GERMANY 5,645,581 5,746,808 -1.8
SPAIN 2,291,492 2,354,117 -2.7
FRANCE 1,674,717 1,565,951 +6.9
UNITED KINGDOM 1,671,166 1,722,698 -3.0
CZECH REPUBLIC 1,413,881 1,344,182 +5.2
SLOVAKIA 949,365 1,040,000 -8.7
ITALY 742,642 712,971 +4.2
POLAND 514,700 554,600 -7.2
HUNGARY 472,107 524,478 -10.0
ROMANIA 364,654 358,861 +1.6
EU 16,957,230 16,925,471 +0.2
SOURCE: OICA, IHS MARKIT
11 Provisional figures

ACEA Economic and Market Report: Quarter 4 2017 – March 2018 14
TRADE
In 2017, EU car exports increased both in value (+2.3%) and in volume terms (+3.7%) compared to
the preceding year. More than 5.6 million passenger cars were exported by the European Union last
year, worth €127.7 billion in total.
Imports of passenger cars also increased in 2017, counting 3 million units in total. Imports went up
by 7.0% compared to 2016, resulting in a trade surplus of roughly €87.6 billion (+1.0%).
Table 7: EU passenger car trade
Trade in value (€m) 2017 2016 % change 17/16
IMPORTS 40,105 38,042 +5.4
EXPORTS 127,712 124,805 +2.3
TRADE BALANCE 87,607 86,763 +1.0
Trade in volume (units) 2017 2016 % change 17/16
IMPORTS 3,053,085 2,853,591 +7.0
EXPORTS 5,629,121 5,429,007 +3.7
SOURCE: EUROSTAT

ACEA Economic and Market Report: Quarter 4 2017 – March 2018 15
IMPORTS
EU passenger car imports from South Korea and Turkey grew strongly throughout 2017, both in
value (respectively +16.0% and +16.0%) and volume terms (+14.4% and +12.9%), although growth
was less strong than during the first part of the year.
However, car imports from Japan and the United States declined considerably during the same
period; down 17.6% and 14.8% compared to 2016. In total, the European Union imported more than
3 million passenger cars in 2017, with a total worth of more than €40 billion.
Table 8: Origin of most passenger car imports
Trade in value (€m) 2017 2016 % change 17/16
WORLD 40,105 38,042 +5.4
JAPAN 7,535 9,142 -17.6
TURKEY 7,441 6,414 +16.0
UNITED STATES 6,157 7,230 -14.8
SOUTH KOREA 5,579 4,812 +16.0
MEXICO 4,674 2,212 + 111.3
SOURCE: EUROSTAT
Table 9: Origin of most passenger car imports
Trade in volume (units) 2017 2016 % change 17/16
WORLD 3,053,085 2,853,591 +7.0
TURKEY 729,658 646,119 +12.9
JAPAN 536,068 577,704 -7.2
SOUTH KOREA 460,896 402,935 +14.4
MOROCCO 240,907 196,738 +22.5
UNITED STATES 233,778 254,806 -8.3
SOURCE: EUROSTAT
ACEA Economic and Market Report: Quarter 4 2017 – March 2018 16
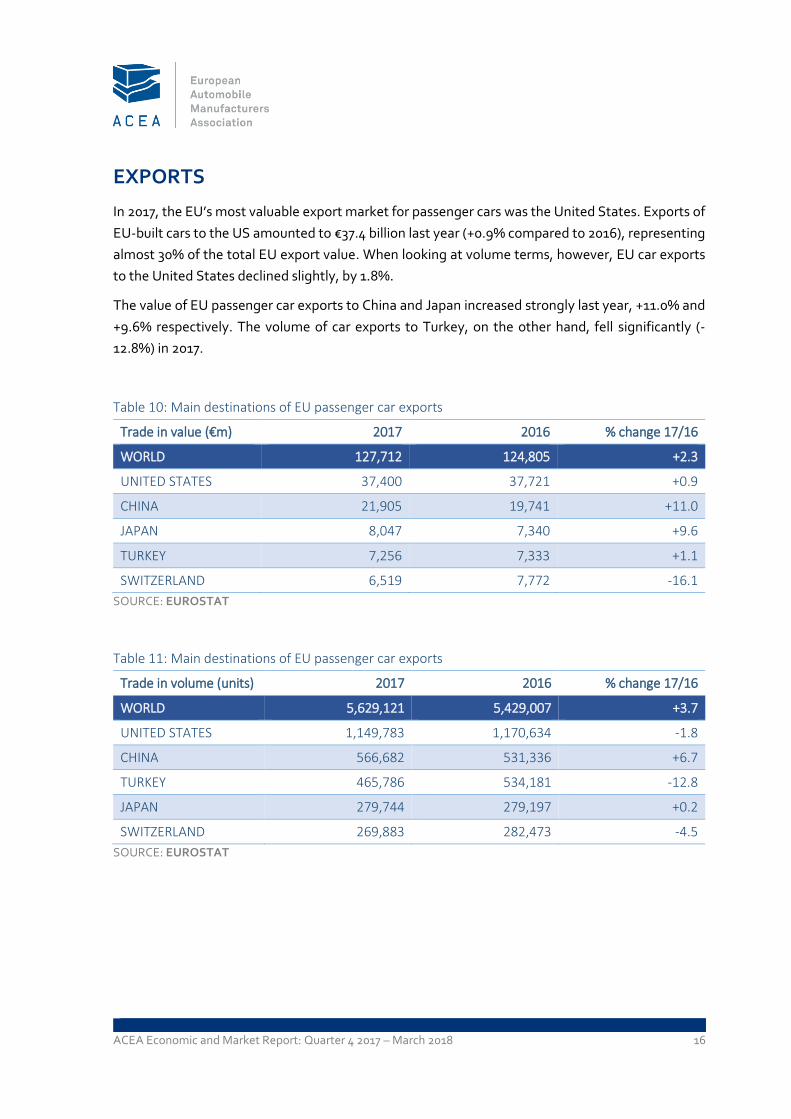
EXPORTS
In 2017, the EU’s most valuable export market for passenger cars was the United States. Exports of
EU-built cars to the US amounted to €37.4 billion last year (+0.9% compared to 2016), representing
almost 30% of the total EU export value. When looking at volume terms, however, EU car exports
to the United States declined slightly, by 1.8%.
The value of EU passenger car exports to China and Japan increased strongly last year, +11.0% and
+9.6% respectively. The volume of car exports to Turkey, on the other hand, fell significantly (-
12.8%) in 2017.
Table 10: Main destinations of EU passenger car exports
Trade in value (€m) 2017 2016 % change 17/16
WORLD 127,712 124,805 +2.3
UNITED STATES 37,400 37,721 +0.9
CHINA 21,905 19,741 +11.0
JAPAN 8,047 7,340 +9.6
TURKEY 7,256 7,333 +1.1
SWITZERLAND 6,519 7,772 -16.1
SOURCE: EUROSTAT
Table 11: Main destinations of EU passenger car exports
Trade in volume (units) 2017 2016 % change 17/16
WORLD 5,629,121 5,429,007 +3.7
UNITED STATES 1,149,783 1,170,634 -1.8
CHINA 566,682 531,336 +6.7
TURKEY 465,786 534,181 -12.8
JAPAN 279,744 279,197 +0.2
SWITZERLAND 269,883 282,473 -4.5
SOURCE: EUROSTAT
ACEA Economic and Market Report: Quarter 4 2017 – March 2018 17
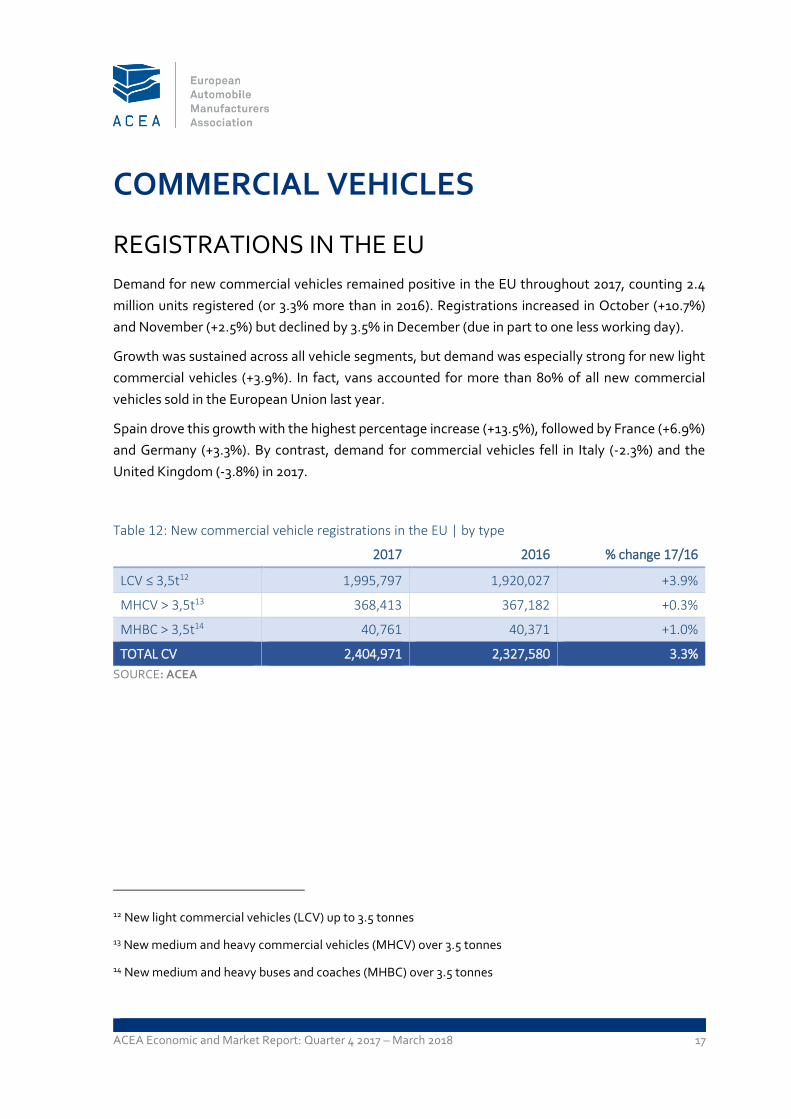
COMMERCIAL VEHICLES
REGISTRATIONS IN THE EU
Demand for new commercial vehicles remained positive in the EU throughout 2017, counting 2.4
million units registered (or 3.3% more than in 2016). Registrations increased in October (+10.7%)
and November (+2.5%) but declined by 3.5% in December (due in part to one less working day).
Growth was sustained across all vehicle segments, but demand was especially strong for new light
commercial vehicles (+3.9%). In fact, vans accounted for more than 80% of all new commercial
vehicles sold in the European Union last year.
Spain drove this growth with the highest percentage increase (+13.5%), followed by France (+6.9%)
and Germany (+3.3%). By contrast, demand for commercial vehicles fell in Italy (‐2.3%) and the
United Kingdom (‐3.8%) in 2017.
Table 12: New commercial vehicle registrations in the EU | by type
2017 2016 % change 17/16
LCV ≤ 3,5t12 1,995,797 1,920,027 +3.9%
MHCV > 3,5t13 368,413 367,182 +0.3%
MHBC > 3,5t14 40,761 40,371 +1.0%
TOTAL CV 2,404,971 2,327,580 3.3%
SOURCE: ACEA
12 New light commercial vehicles (LCV) up to 3.5 tonnes
13 New medium and heavy commercial vehicles (MHCV) over 3.5 tonnes
14 New medium and heavy buses and coaches (MHBC) over 3.5 tonnes

ACEA Economic and Market Report: Quarter 4 2017 – March 2018 18
Figure 5: New commercial vehicle registrations in the five big EU markets
SOURCE: ACEA
FRANCE UNITED KINGDOM GERMANY SPAIN ITALY
2016 463,295 438,382 357,260 200,338 226,383
2017 495,052 421,935 369,146 227,303 221,263
+6.9%
-3.8%
+3.3%
+13.5% -2.3%
0
100,000
200,000
300,000
400,000
500,000
600,000

ACEA Economic and Market Report: Quarter 4 2017 – March 2018 19
New light commercial vehicles (LCV) up to 3.5 tonnes
Some 2 million new vans were registered across the EU last year, or 3.9% more than in 2016. Results
fluctuated during the fourth quarter of 2017, with EU demand for light commercial vehicles
increasing strongly in October (+12.7%) but falling again in December (-3.0%).
Looking at the five major LCV markets, Spain (+15.5%), France (+7.1%) and Germany (+4.9%) saw
the strongest growth, while demand for new vans declined in the United Kingdom (‐3.6%) and Italy
(‐3.4%).
Figure 6: New light commercial vehicle registrations in the five big EU markets
SOURCE: ACEA
FRANCE UNITED KINGDOM GERMANY SPAIN ITALY
2016 408,546 375,687 258,021 172,334 200,271
2017 437,415 362,149 270,694 199,101 193,533
+7.1%
-3.6%
+4.9%
+15.5% -3.4%
0
50,000
100,000
150,000
200,000
250,000
300,000
350,000
400,000
450,000
500,000

ACEA Economic and Market Report: Quarter 4 2017 – March 2018 20
New medium and heavy commercial vehicles (MHCV) over 3.5 tonnes15
368,413 new trucks were registered across the European Union in 2017. Results were more or less
the same (+0.3%) as in 2016, mainly due to a slowdown in demand for new trucks in the second half
of last year.
Among the five big EU markets, France (+6.5%) and Italy (+4.5%) performed well in 2017, but truck
registrations fell in the United Kingdom (‐3.3%) and Germany (‐0.9%) throughout the year.
Figure 7: New medium and heavy commercial vehicle registrations in the five big EU markets
SOURCE: ACEA
15 Excluding buses & coaches
GERMANY UNITED KINGDOM FRANCE SPAIN ITALY
2016 92,556 53,916 48,156 24,705 23,321
2017 91,755 52,120 51,308 24,675 24,373
-0.9%
-3.3% +6.5%
-0.1% +4.5%
0
10,000
20,000
30,000
40,000
50,000
60,000
70,000
80,000
90,000
100,000

ACEA Economic and Market Report: Quarter 4 2017 – March 2018 21
New medium and heavy buses and coaches (MHBC) over 3.5 tonnes
In 2017, the EU market for new buses and coaches increased slightly (+1.0%) – 40,761 new vehicles
were registered throughout the year.
The United Kingdom and France saw demand fall by, respectively, ‐12.7% and ‐4.0% last year.
However, bus and coach registrations did increase substantially in both Italy (+20.3%) and Spain
(+6.9%) in 2017.
Figure 8: Top 5 – New medium and heavy bus and coach registrations in the EU | by country
SOURCE: ACEA
UNITED KINGDOM GERMANY FRANCE SPAIN ITALY
2016 8,779 6,683 6,593 3,299 2,791
2017 7,666 6,697 6,329 3,527 3,357
-12.7%
+0.2%-4.0%
+6.9% +20.3%
0
1,000
2,000
3,000
4,000
5,000
6,000
7,000
8,000
9,000
10,000

ACEA Economic and Market Report: Quarter 4 2017 – March 2018 22
GLOBAL PRODUCTION
European16 commercial vehicle output grew by 2.9% in 2017, totalling more than 3.5 million units
produced. Production growth was largely sustained by the improved situation in the CIS countries,
such as Russia and Ukraine. Conversely, commercial vehicle output in Western Europe slowed down
in 2017, with production contracting in most of the major EU markets last year (ie Germany, the
United Kingdom, Spain and Italy).
Chinese17 commercial vehicle production ended 2017 with modest growth (+0.3%), some 5.7 million
units were built in total. The various vehicle segments performed differently, with demand for vans
slowing down but truck production increasing at the same time.
Production in North America followed an upward trajectory in 2017, supported by increasing
demand across all commercial vehicle segments. Last year, North American commercial vehicle
production totalled more than 4.4 million units, up 4.1% compared to 2016.
Japanese and Korean commercial vehicle output were largely in line with 2016 results, some 1.6
million units were built there last year.
Commercial vehicle production in South America grew significantly in 2017 (+18.0%), mostly driven
by Brazil’s recovery – total output amounted to almost 0.8 million units.
Output in the Middle East and Africa decreased last year, affected by declining demand for
commercial vehicles in Egypt and South Africa. The region produced around 0.4 million commercial
vehicles, or 5.9% less than in the preceding year.
In 2017, South Asia’s commercial vehicle production grew by 3.1%, due to strong output in the
Philippines and Thailand.
16 Includes Turkey and CIS countries
17 Includes Hong Kong and Taiwan

ACEA Economic and Market Report: Quarter 4 2017 – March 2018 23
Figure 9: World commercial vehicle production18 | by region
SOURCE: IHS MARKIT
18 2017 data provisional
+0.3
+4.1
+2.9
+3.1
+1.1
+18.0-5.9
0
1
2
3
4
5
6
Greater China North America Europe South Asia Japan/Korea South America MiddleEast/Africa
Mill
ion
s
2016 2017
ACEA Economic and Market Report: Quarter 4 2017 – March 2018 24
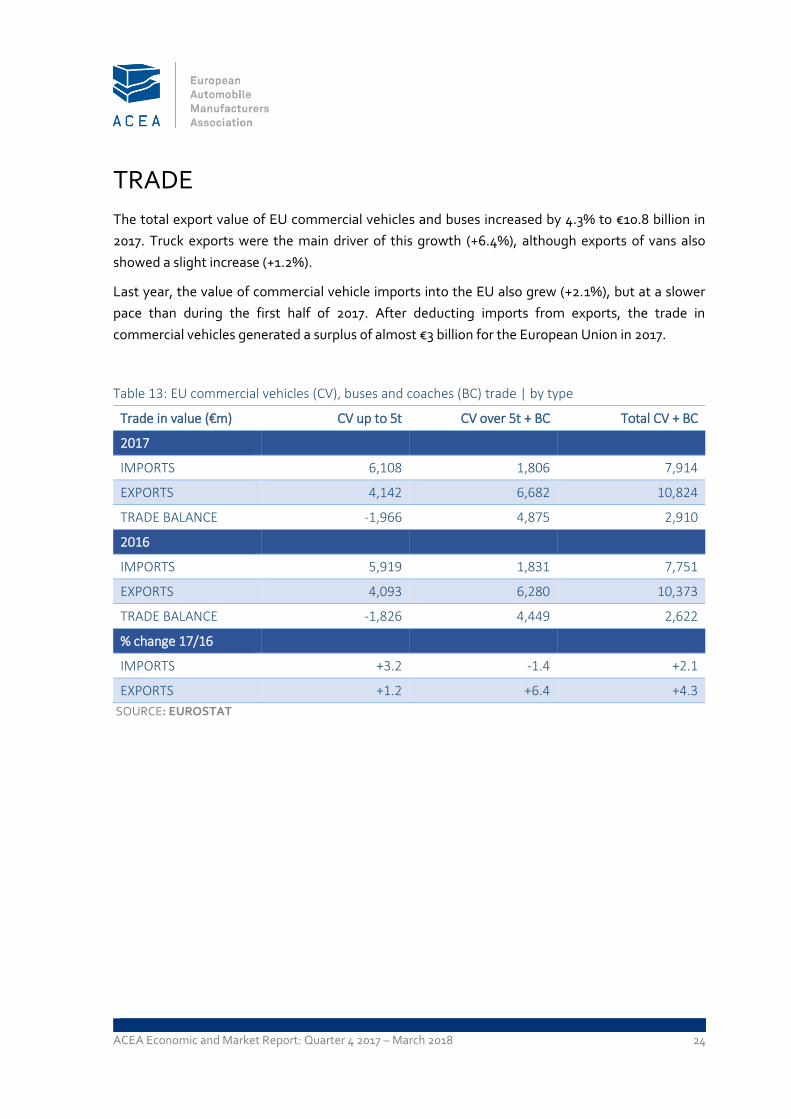
TRADE
The total export value of EU commercial vehicles and buses increased by 4.3% to €10.8 billion in
2017. Truck exports were the main driver of this growth (+6.4%), although exports of vans also
showed a slight increase (+1.2%).
Last year, the value of commercial vehicle imports into the EU also grew (+2.1%), but at a slower
pace than during the first half of 2017. After deducting imports from exports, the trade in
commercial vehicles generated a surplus of almost €3 billion for the European Union in 2017.
Table 13: EU commercial vehicles (CV), buses and coaches (BC) trade | by type
Trade in value (€m) CV up to 5t CV over 5t + BC Total CV + BC
2017
IMPORTS 6,108 1,806 7,914
EXPORTS 4,142 6,682 10,824
TRADE BALANCE -1,966 4,875 2,910
2016
IMPORTS 5,919 1,831 7,751
EXPORTS 4,093 6,280 10,373
TRADE BALANCE -1,826 4,449 2,622
% change 17/16
IMPORTS +3.2 -1.4 +2.1
EXPORTS +1.2 +6.4 +4.3
SOURCE: EUROSTAT

ACEA Economic and Market Report: Quarter 4 2017 – March 2018 25
IMPORTS
EU commercial vehicle imports from Turkey declined by 5.7% in 2017. Nevertheless, Turkey still
accounted for more than half of total EU imports last year, making it the main exporter of
commercial vehicles to the EU. China came second with 91,773 units exported to the European
Union in 2017, up 18.9% compared to 2016.
Imports from the United States increased markedly in 2017 (+81.3%), despite starting the year
slowly. At the same time, EU imports from India, Macedonia and Taiwan grew considerably as well.
In total, the EU imported 587,890 commercial vehicles (including buses and coaches) in 2017, or 7.7%
more than in the preceding year.
Table 14: Top 10 – Origin of EU commercial vehicle and bus imports
Trade in volume (units) 2017 2016 % change 17/16
WORLD 587,890 545,930 +7.7
TURKEY 322,564 342,219 -5.7
CHINA 91,773 77,175 +18.9
THAILAND 42,263 40,677 +3.9
SOUTH AFRICA 31,895 26,378 +20.9
MOROCCO 23,700 21,230 +11.6
INDIA 20,771 2,573 +707.3
UNITED STATES 16,651 9,182 +81.3
MACEDONIA 7,622 604 +1161.9
SWITZERLAND 7,418 6,750 +9.9
TAIWAN 6,916 1,063 +550.6
SOURCE: EUROSTAT

ACEA Economic and Market Report: Quarter 4 2017 – March 2018 26
EXPORTS
EU commercial vehicle exports saw a considerable decline in 2017, as exports to Hong Kong (-95.3%)
and the United States (-54.1%) fell significantly throughout the year.
Exports to Turkey, on the other hand, recovered during the last quarter of 2017 (+14.4% when
compared with 2016). Commercial vehicle exports to Russia (+26.0%) and Ukraine (+8.6%) also
showed substantial growth, and so did exports to Australia (+12.1%) and Mexico (+6.6%).
Total EU exports of commercial vehicles amounted to 501,048 units least year, or 39.7% less than in
2016.
Table 15: Top 10 – Destinations of EU commercial vehicle and bus exports
Trade in volume (units) 2017 2016 % change 17/16
WORLD 501,048 830,869 -39.7
TURKEY 58,475 51,086 +14.4
NORWAY 34,294 34,938 -1.8
SWITZERLAND 28,658 32,874 -12.8
UKRAINE 24,097 22,198 +8.6
AUSTRALIA 20,430 18,226 +12.1
UNITED STATES 13,953 30,383 -54.1
SERBIA 13,866 14,306 -3.1
RUSSIA 13,773 10,933 +26.0
HONG KONG 13,410 285,772 -95.3
MEXICO 12,778 13,674 +6.6
SOURCE: EUROSTAT

ABOUT ACEA
• ACEA represents the 15 Europe-based car, van, truck and bus manufacturers:
BMW Group, DAF Trucks, Daimler, Fiat Chrysler Automobiles, Ford of Europe,
Honda Motor Europe, Hyundai Motor Europe, Iveco, Jaguar Land Rover, PSA
Group, Renault Group, Toyota Motor Europe, Volkswagen Group, Volvo Cars,
and Volvo Group.
• More information can be found on www.acea.be or @ACEA_eu.
ABOUT THE EU AUTOMOBILE INDUSTRY
• 12.6 million people – or 5.7% of the EU employed population – work in the sector.
• The 3.3 million jobs in automotive manufacturing represent almost 11% of EU
manufacturing employment.
• Motor vehicles account for almost €396 billion in tax contributions in the EU15.
• The sector is also a key driver of knowledge and innovation, representing Europe's
largest private contributor to R&D, with more than €50 billion invested annually.
• The automobile industry generates a trade surplus of about €90 billion for the EU.
European Automobile Manufacturers' Association (ACEA) Avenue des Nerviens 85 | B-1040 Brussels | www.acea.be T +32 2 732 55 50 | F +32 738 73 10 | [email protected] | @ACEA_eu