^ 33 P^ 33 = o
, ,
< ^ ^ co,
^ 33 co ,. I
e >g,~
^
- 0
5
O^
h^
,<a
<. 5
>^
^=
- ^, = = ^,
^ e< ^,
e e Q, ,
co,
= -.
^, = ^.
05
I I
>..
95
co,
^ ?> ^.
33 -.
^.
e =
e'> ^ = ^,,
= C'>
.,,.
^ ^.^
e = ^ e^
e'>
e^ ^ ^ ^ ^ ^
^,
-. ^ ^ =.
>^
^, ^.^
= =
CD
^ ^ ^ FF
.
^ = -..
=.^
^ >.
P^
P^-..
^ ^,
FF
-^.
^ = -^ CD
C, a
Q-.
^, = ^.^
- = . e'>^ = = -,.
^ e< C, ^
^ -.
= ^,
^
-
,
-^ -^ o ^ ^ o - 11^,
(.> ^ ^ ^ ^\
e ^ ^ ^
^ = ^.^
^.
^,
^
. - \.
^be e ^b
,
~..\
^ < - I'~
\
. ,^

TABLEOFCONTENTS
I. Bac round ................................................................................................................................. 2
2. Summary ofactivities. .................................................................................................................... 3
3. Description ofActivities. ................................................................................................................ 4
3.1 Fieldtriols. .....
3.2 Demonstration. ...
In-country Semin@r. .................................................................................................................. 53.3
4. Conclusion and Follow-on Activities ............................................................................----------------8
,- \
ANNEX I - List of Participants
ANNEX2 -Agenda of the In-country Seminar
ANNEX 3 - Questions and answers at open forums
ANNEX 4 - Highlights of the presentation by Dr. Rikimaru
ANNEX5 - Highlights of thenRS casestmdy in India
ANNEX 6 - Highlights of the FCD-Mapperdemonstration
ANNEX 7 -Itinerary of the Mission and ListofJOFCATeam Members and11RS Associates
I

I. Background
In'O Project FD 60199 Rev. I (F) 'is currently in the process of enhancing
the capabilities of a semi-expert system that was developed under a previous InO
project' for analysis of satellite imagery data. This system (FCD Mapper Version I)was the outcome of technology development, field studies and multi-country
consultation on the use of satellite imagery data to assess the status of forest resources
and monitor change over time in forest conditions. Reliable information on these
parameters provides a basis for planning and decision-making in forest management.
FCD-Mapper Version I makes it possible through remote sensing (RS)
technology to assess forest status and change at the macro-level with a high degree of
accuracy. This facilitates decision-making on the prioritization and/or selection of
forest management and silvicultural options. However, practitioners and a panel of RS
experts have noted certain limitations in the system. For instance, experience in the
use of FCD-Mapper Version I suggested the need to reduce the negative impacts of
topographic shadow and other "noise" factors that hinder analysis and assessment.
Consequently, laboratory experiments have been practiced to increase accuracy and
provide additional information through formulation of new algorithms and procedures
that respond to physical and biological factors that influence the data obtained from
optical sensors, such as topographic shadow and seasonal leaf-fall in deciduous
forests.
\ -.
The activities described in this report are part of the on-going enhancement
process to address the above-mentioned limitations and challenges. These activities
will CUIminate in the production of an enhanced semi expert system (FCD-Mapper
version 2) that improves accuracy and provides a significantly higher degree of
precision in maps illustrating forest coverage situation and in tables that quantify the
number of hectares in each forest canopy density class (e. g. FCD of 10%, 40%, 80%,
etc. ).
1660ptjmum Utilization of RADARSAT-SAR Data in Conjunction withEnhanced FCD Model to Monitor Change in the Status of Forest Resources"
' InO Project FD 13197 Rev. I(F)"Dissemination of New us Methodology throngha Semi-expert System"
2

2. Summaryof activities
Implementation of InO Project FD 60199 Rev. I(F)is an iterative process of
work in RS laboratories to develop new algorithms and procedures for data analysis,
field application trials to test the accuracy of these new developments, adjustment
and/or improvement of the new developments based on the field trials and
consultation with RS experts from participating countries to fine tune the system in
response to country-specific needs, requirements and conditions. Thus far in project
implementation, new developments at the RS laboratory level have been tested in
evergreen tropical forests, followed by appropriate adjustment and fine-tuning of the
system. This report describes the activities carried out in moist and dry deciduous
forests of India during December 2002 following the process just summarized. The
agenda of activities was as follows:
Briefing of system operation of FCD-Mapper Version 2 for11RS engineers.
Dec. 10-11 Field trials in moist deciduous forests to test new algorithmsand procedures, and consultation with RS experts of the Indianinstitute for Remote Sensing (11RS).
Demonstration of system operations for 11RS faculty andofficers of the Indian Forest Service.
In-country Seminar with participants from 11RS, the seniormanagement and field staff of the Indian Forest Service, theInternational Institute for Geo-Information Science and Earth
Observation (ITC, Netherlands), representatives of non-government organizations (NGOs), and forest researchagencies.
Field trials in dry deciduous forests.
Compilation of results from the field trials.
Consultations with 11RS management and scientists andconsolidation of data.
As part of the demonstration on Dec. 12 and the in-country seminar on Dec.
13, open forums were conducted during which participants asked questions seeking
clarification and/or to express their opinions and suggestions. The JOFCA team
responded with answers and explanations as appropriate. The list of participants at the
demonstration and the international workshop is presented in Annex I. The agenda of
the international workshop is in Annex 2. Questions and answers at the open forums
are summarized in Annex 3. Members of the 10FCA team and their 11RS colleagues
that implemented project activities are listed in Annex 7.
Dec. 9
Dec. 12
*. I
Dec. 13
Dec. 14
Dec. 15
Dec. 16
3

3. Description of Activities
3.1 Fieldtrials
The field trial(field test) procedure applied in Project FD 60199 Rev. I (F)
consists of the following steps:
(a) acquisition of satellite imagery data covering the area(s) where field testswill be conducted;
(b) preparation of FCD mapsshowing the results of analysis using the FCDMappersoftware;
(c) identification of reference points and determination of geographiccoordinates using GPS equipment to ensure accurate geo-referencing;
(d) examination of field conditions by experienced foresters to assesswhether the FCD maps accurately portray the forest status;
(6) noting of any discrepancies between FCD maps and field examinationsto identify potential items for improvement of the system;
(f) compilation offield test data; and
(g) consultations with in-country RS experts.
The procedures outlined above were followed during three (3) days of field
tests (Dec. 10'', 11'' and 14''). Forest status and conditions were noted and results
were documented covering six (6) locations. Experienced foresters estimated (i)
height of the top layer canopy density, (ii) total canopy density of the top layer, (in)
total canopy density including middle-storey vegetation and (iv) degree of slope. They
also took note of dominant and co-dominant species, and any unique features of the
site (e. g. intrusion by settlers, grazing in the forests, etc. ). Data obtained during the
field tests was compiled and consolidated for use in subsequent enhancement of the
system that will be carried out at the RS laboratory levelin Japan.
I
.
3.2 Demonstration
To familiarize 11RS faculty and potential users of the FCD-Mapper Version 2,
a step-by step demonstration of the system was presented at the 11RS conference room.
The demonstration began with a summary of basic concepts for formulation of the
FCD Mapper.
4

Thereafter, JOFCA team members' operated the FCD-Mapper Version I to
conduct analysis of LANDSAT-TM data covering areas located in Dehradun, India.
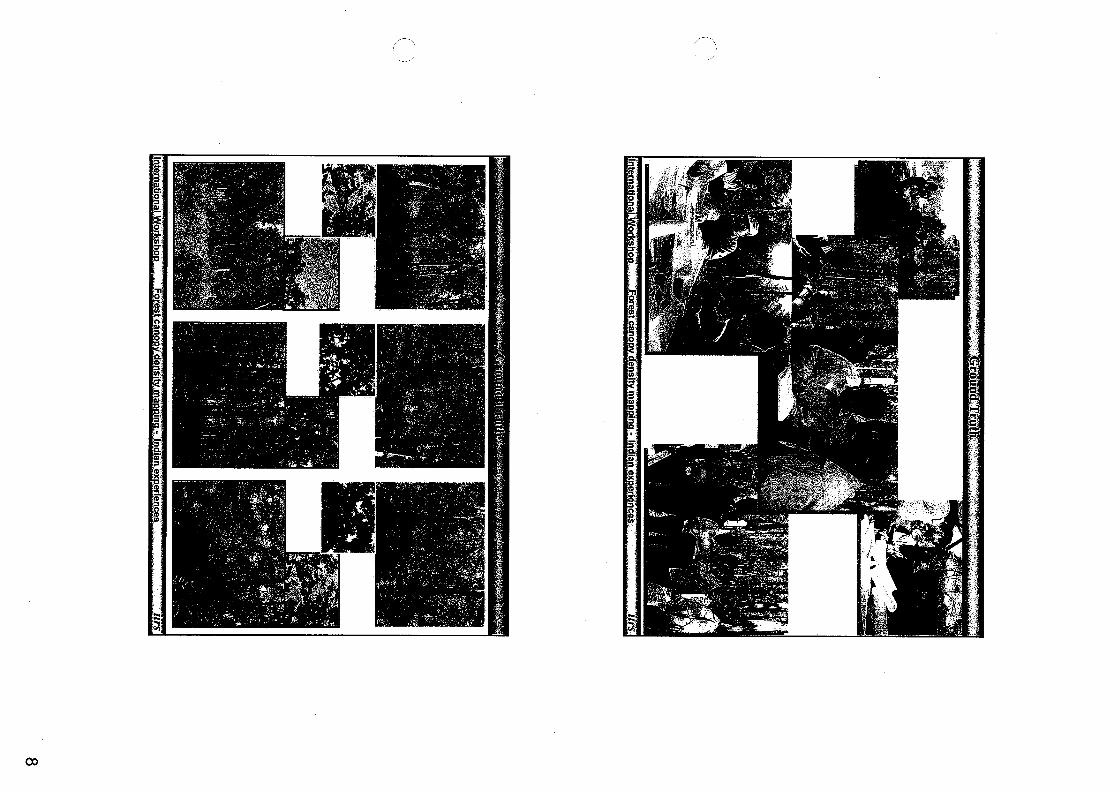
Two sets of satellite data were used: December 9, 1999 and October 14, 2002.
Demonstration enabled participants to systematically view system operations
and the maps showing results of the analysis. As the demonstration moved through
the various procedures and methods in the system, 10FCA team members described
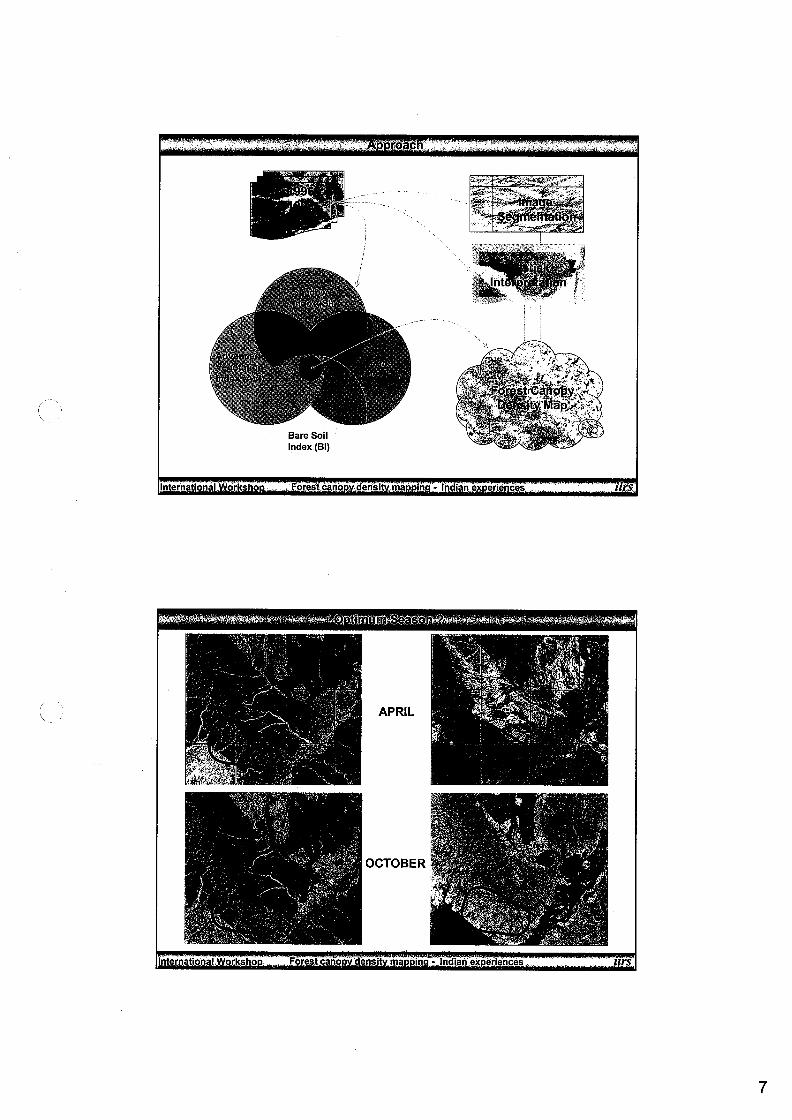
the several indices used in the analysis: Thermal Index (Tl), Bare Soil Index (Bl),
Shadow index (SI), Scaled shadow index (SSl), Vegetation Index (Vl) and Advanced
Vegetation Index (AVI). They also explained how the system combines data from
several indices in the analysis.
After completing the demonstration of FCD-Mapper Version I, the 10FCA
team then explained the features of new improvements that will be incorporated in
FCD-Mapper Version 2 and the reasons for inclusion of the same. These new
developments include the following:
I. Automatic geo-referencing capability along with automatic conversion
of data from the standard TIFF format to the format used in FCD
Mapper;
2. A Multi-Vegetation Modelthatimproves on calculation of the VD of
Version I, clustering the target area into different groups according to its
conditions, and;
3. Improved procedures to reduce the negative impacts of topographic
shadow and other "noise" on the analysis.
As mentioned earlier, the demonstration agenda also provided time for
participants to ask questions and offer comments during in an "open forum" setting.
,.\
in-country Seminar
The in-country seminar opened with a welcome address by Dr. P. S. Roy, Dean
of the 11RS. He traced the historical background of the project, based on his
experience as a member of the multi-country group of RS experts involved in
development of the FCD Mapper. Making particular reference to India, Dr. Roy
echoed the concern of indian forestry officers over the quality of forests.
3.3
' Dr. AtsushiRikimaru, Mr. HiToyukiChiba, Mr. Minoru Nakajima, and Mr. Makoto Haneda.'1dentified asthe ^;SI^^^_^!!p (ECG), these RS experts from several Asia/Pacific countriesperiodically reviewed progress in development of the FCD Mapper, provided significantinputs in
5
Dr. Roy underscored the need for a reliable toolthat can be used to conduct
frequent, up-to-date and prompt evaluation of forest quality and changes in the forest
status. He identified the FCD Mapper capability to provide this information as a major
advantage of the system. Dr. Roy urged all participants to take full advantage of this
new tool and to participate in future enhancement of the system after they have
utilized the FCD Mapper in their work.
Mr. Susumu Miyatake, 10FCA team leader for Project FD 60199 Rev. I (F)
then presented Introductory Remarks during which he described the relationship and
interaction between 11RS and 10FCA over the last ten (10) years in development of
the FCD Mapper. Among others, he recalled 11RS cooperation with 10FCA in
conducting a training course for participants from thirteen (13) countries in 1999. Mr.
Miyatake stressed the challenges facing all concerned with sustainable forest
management and conservation, and the need for reliable information on which to base
forest management and rehabilitation decisions. Reiterating key points raised earlier
by Dr. Roy, Mr. Miyatake asked participants to seriously consider how they can best
apply FCD Mapper and whatinitiatives they mighttake to improve the system in the
years ahead.
,-
Mr. M. M. Harbola, the Principal Chief Conservator of Forests for Uttaranchal
State Forest Department followed Mr. Miyatake's message with an Inaugural Address.
Mr. Harbola remarked that the participants came from several sectors including
government forestry officers, the academe, research institutions, RS scientists, NGOs
and the media. He commented that this was a positive indication of broad-based
concern over forestry issues.
Mr. Harbola pointed out the urgent need for temporal analysis of forest
conditions to monitor change and identify threats to forest conservation. He stressed
the problems of forest depletion and degradation, accompanied by the loss of species.
In this context he urged participants to take note of the distinct advantages offered by
the FCD Mapper to conduct frequent and accurate assessment of forest status. Mr.
Harbola commented that RS technology now makes it possible to monitor forest
conditions with greater facility and at considerable cost savings when compared with
.
system development and helped ensure that the system responded to the needs of theirrespectivecountries
6

conventional systems used in the past. He concluded by extending his best wishes for
a successful and productive workshop.
Following the messages summarized above, Dr. Atsushi Rikimaru, who is
JOFCA's lead scientist in RS technology development, repeated his explanation of
FCD conceptsthat were presented during the previous day. On this occasion however,
the information was provided to a much wider audience. Additionally, ,Dr. Rikimaru
described results of a case study previously conducted in Malaysia. He described how
outputs of the study were used to develop new algorithms and procedures that are now
being incorporated in FCD-Mapper Version 2. Dr. Rikimaru also discussed a case
study conducted in Japan that demonstrated how reforestation data compiled by
forestry departments can be utilized effectiveIy in the assessment of man-made forests.
In the open forum that followed, Dr. Rikimaru and Mr. Miyatake responded to
questions and concerns offered by the participants.
A summary of questions and answers is presented in Annex 3. Highlights of
Dr. Rikimaru's presentation are in Annex 4.
I
After a lunch break, the workshop resumed at 1400 hours with presentation by
Mr. MB Chandrashekhar of results from a case study conducted by 11RS using FCD-
Mapper Version 1. ' The study covered areas within the general area of Dehradun and
was conducted in several forest types. Mr. Chandrashekhar reported that 11RS
experience validated reliability of the FCD Mapper in almost all respects. However,
he pointed out certain limitations that need to be overcome. It was noted that the
limitations he identified were precisely the topics currently being addressed in the
development of FCD-Mapper Version 2. Highlights of Mr. Chandrashekhar's
presentation are in Annex 5.
Following the India case study, 10FCA team members demonstrated use of
the FCD Mapper, beginning first with Version I and then the new developments
underway to produce Version 2. This demonstration was essentially a repetition of the
Dec. 12 demonstration for 11RS faculty. However, explanations were provided in
greater detail given the more diverse audience, some of whom were not familiar with
RS technology. Furthermore, the 10FCA team paused more frequently to point out
the details illustrated in FCD maps at each stage of the analysis, as information from
7

new indices and combinations of indices were incorporated in the process. All open
forum followed the demonstration.
During the closing ceremonies, certificates of participation were distributed
and messages were delivered by Professor Karl Harmsen, Director of the Center for
Space Science Technology and Education for Asia/Pacific (CSSTE-AP), Dr. Roy and
Mr. Miyatake.
Professor Harmsen expressed thanks to the 11RS and 10FCA for organizing
and conducting the workshop. He further commented that it was encouraging to note
the attendance of participants from several sectors. Professor Harmsen pointed out
that JOFCA-11RS collaboration was an example of the benefits that can be derived
from development of contacts and participation in international networks. Specifically,
he cited the efforts of Dr. Roy in this regard during development of the FCD-Mapper.
Professor Harmsen urged participants to make use of RS technology in the pursuit of
sustainable forest management and to consider how they may make inputs on further
development of the FCD Mapper.
On behalf of 11RS Dr. Roy thanked all guests and participants for their
attendance. He commented that development of the FCD-Mapper has been interesting
and rewarding for allindividuals and institutions involved in the process. He noted
that with the FCD-Mapper it has now become possible to expedite accurate mapping
of most land use conditions. Reiterating his earlier remarks, Dr. Roy encouraged the
participants to take full advantage of the capabilities inherentin the FCD-Mapper.
Mr. Miyatake also thanked all who participated in the workshop and made
special mention of the cooperation and assistance provided by 11RS. He said he
looked forward to opportunities for additional cooperation in the future. Mr. Miyatake
also encouraged participants to work though and with the 11RS on formulation of
proposals related to utilization of the FCD-Mapper that can be presented to ITTO or
other donors for support.
I
Conclusion and Follow-on Activities
Data from the field tests discussed earlier are now being compiled and will be
used in laboratory exercises and computer software development in Japan to finalize
4.
"Forest Canopy Density Mapping- Indian Experiences" by Mr. M. B. Chandrashekar, Mr. SameerSaran, Mr. PLN Raju and Dr. P. S. Roy
8
FCD-Mapper Version 2. Concurrently, 10FCA has begun preparation for the final
project workshop tentatively scheduled to be held in Jakarta, Indonesia in March 2003.
(-
\ .
9

ANNEX I - List of participants
List of artici ants for Trainin on 12.12.2002
INTERNATIONALWORKSHOPONFORESTCANOPYDENSITY(FCD)ASSESSMENTUSn\IGSATELLITEREMOTESENSING
.FCDMAFPERSEMIEXPERTSYSTEM.
S. No.
I
Name
2
ShriD. P. Singh
3
Sh. Pannalal
4
Sin. Manoj Aggarwal
5
Mr. Yo
6
Mr. Vimod Binatia
7
8
Desi nation
ShriK. K. Das
esh Sin in
Asst. Director
Dr. P. K. 10shi
9
Mr. Vinod. S.
Scientist
10
Mr. S. K. Singh
11
Scientist
Ms. Neeta Hooda
12
DCF
Shri N. I^. Bhatia
De artmemt
DCF
I
13
\
Forest Survey of India,Dehradun
Mr. MB
Chandrashekhar
14
Scientist
15
Wildlife Institute of India,Dehradum
Scientist
Dr. IJ. Sin h
16
Forest RangeOfficer
Dr. D. N. Paint
17
Wildlife Institute of India,Dehradun
Ms. Nun
Sr. Tech. Asst.
Dr. SamamaSin
18
Silva , FEUDehradum
Mr. Ariaz M. A.
19
Resource Survey &Mama ememt(Fin)
CF
DPA
orPrasad
Mr. S. D. Sin h, IFS
11RS, Dehradun
List of artici ants for Worksho on 13.12.2002
Mr. SureshBabu
11RS, Dehradun
RF
Kerala Forest Department,Kerala
INTERNATIONALWORKSHOPONFORESTCANOPYDENSITY(FCD)ASSESSMENTUSINGSATELLITEREMOTESENSD. IG
.FCDMAPPERSEMIEXPERTSYSTEM.
h
Scientist
Forest Survey of India,Dehradun
66
RF
ICERE, Dehradum
Scientist
S. No.
Forest Survey of India,Dehradum
Forest RangeOfficer
I
11RS Dehradun
Name
DFO
2
Sh. Jayaraj
11RS, Dehradum66
Dr. V. B. Mathur
66
66
Kerala Forest Department,Kerala
Dehrad. un
CEMDE
Desi nation
Conservator
Of Forests
Scientist
De artment
Shiwaliks Forest, Dept. ofI. ^ttaramchal
Wildlife Institute of India,Dehradun

3
4
Sh. Painmalal
5
Sh. Mainoj Aggarwal
6
Sh. Rajesh Thapa
7
Sh. Qinar Qureshi
Mr. Suresh Babu
8
I
Scientist
9
Dr. KuldeepKumar
Scientist
10
Sin. C. K. Shahi
System Manager
11
Dr. B. S. Barphal
Reader
12
Dr. Yogesh Singh
Researcher
13
Wildlife Institute of India,Dehradum
Mr. Vinod Bhatia
14
Wildlife Institute of India,Dehradun
Mr. Ariaz M. A.
Conservator
Of Forests
Wildlife Institute of India,Dehradun
15
Mr. Vimod S.
Div. Forest Officer
16
Wildlife Institute of India,Dehradun
17
Mr. Rakesh Sham
ChiefConservator
Of Forests
Mr. R. C. Sharma
Centrefor Environmental
Management of DegradedECos stem, Univ. of Delhi
18
\
Div. Forest Officer
ShriG. P. Singh
19
Div. Forest Officer
ShriRamesh Chandra
Punjab Forest Dept. ,Chaindi arh
20
21
Forest RangeOfficer
Ka in Kurilar joshi
Punjab Forest Dept.Ialandhar
Shri S. M. 10shi
22
Forest RangeOfficer
Sinn Dharmemder
Sinarma
Forest Dept. , Carhwal,ruttaramchal
23
Cons. of Forests
Dr. S. D. Sin h
Forest Research Institute,Dehradun
24
Div. Forest Officer
Mr. S. K. Singh
Sub. Divisional
Officer
Resource Survey &Mama ement(Fin)
25
ShriN. K. Bhatia
Div. Forest Officer
Kerala Forest Department,Kerala
26
ShriD. P. Singh
Div. Forest Officer
Kerala Forest Department,Kerala
27
Div. Forest Officer
Mr. Vivek Saxema, IFS
Dy. Con. of Forests
Forest De t. , Nanital
28
ShriJ. B. Lall
Toms Forest De t. , Furola
29
D . Con. of Forests
Larusdown Forest Dept. ,Lainsdown
30
Sr. Tech. Asst.
Sh. Harmam Sin in
Ms. Neeta Hooda
Larusdown Forest Dept. ,Larusdown
Data ProcessingAsst.
ShriH. K. Sin h
Forest De t. , ruttarkashi
Asst. Director
Forest De t. Mussoorie
Fulljab Forest Dept. ,Chaindi arh
Dy. Con. of Forests
littaranchalForest De t.
Asst. General
Maria er
Forest Survey of India,Dehradum
President
Forest Survey of India,Dehradun
Cons. Of Forests
Div. Forest Officer
Forest Survey of India,Dehradun
Working Plan Division,Ambala Cit
AFC, Dehradun
Science, Dehrad. urnICERE, DehradunTehriDam ruttarkashi

31
32
33
Sh. S. Ashutosh
34
Sh. lBhiiwan Chandra
35
Sh. Naremder Sin h
36
Sh. S. K. Datta
37
Mr. Susumu Mi aimke
38
Dr. AtsushiRikimru
39
Mr. Minoru Naka'jina
40
Mr. MakotoHaneda
41
Mr. P. C. Du
42
Mr. Hiro ukiChiba
,
43
\
D . Director
Prof. KarlHarmsen
44
Div. Forest officer
Dr. P. S. Ro
45
D . Director
Dr. D. N. Panth
am
46
Cons. Of Forests
Dr. Samam Sin h
47
Forestr Ex erts
Dr. IJ. Sin h
48
RS Ex ert
ShriK. K. Das
Software Ex ert
Dr. lP. K. Joshi
49
Software Expert
Mr. M. B.
Chandrashekhar
50
Forest Ex ert
FSl, Dehradun
51
Forest
Ms. Nu o0r IPrasad
Kalsi
Director
Sin. P. L. N. Ra'un
Ra'a National Park
Dean
Sin. Sameer Saran
Workim Plain, Namital
List of Organisation for Workshop on 13.12.2002
Scientist
JOECA, Ia an
Ex ert
Scientist
JOECA, Ja an
S. No.
Scientist
JOECA, ja an
I
Sciemtist
10FCA, Ja
2
Scientist
\
10FCA, Ia
De artment
3
Research Scholar
10FCA, Ia
Shiwaliks Forest, De t. of ruttaranchal
CSSTE-AP, Dehradun
Wildlife Institute of India, Dehradum
4
Research Scholar
MRS, Dehradun
Center for Environmental Management Degraded Ecosystems, Urniv. ofDelhi
5
an
Inchar e, GID
11RS, Dehradun
6
am
Scientist
11RS, Dehrad. un
Pun'ab Forest De t. , Chaindi arh
7
an
11RS, Dehradum
Pun
8
11RS, Dehradun
Forest De t. , Carhwal
9
'ab Forest De t. Janandhar
11RS, Dehradun
Forest Research Institute, Dehradum
10
11RS, Dehradun
Resource Surve & Maria ement(Fin), Dehradum
11
Kerala Forest De artment, Kerala
12
11RS, Dehradum
Forest De t. , Nanital
13
11RS, Dehradum
Toms Forest De t. , Furola
14
11RS, Dehradum
Forest Surve of India, Dehradun
15
Larusdowm Forest De t. , Larusdown
16
Forest De t. , littarkashi
17
Forest De t. Mussoorie
18
Forest De
19
Workim Plan Division, Armbala Cit
20
AFC, DehradunScience, Dehradum
t. , ruttaranchal
ICFRE, Dehradum

I'
.-\
N t, .
19
^.
be
Q, ,
^ - ^ (;, I ^ fo =.^
^ 33 e,
=
N re
: e ^ ^: = ^ = Z 33 = -.
re -
^ a,
a, Z aa Q = ^ ^ as ^ ^,^ ^ ,, =..
., 33 ^.
b^
^ CD
co ^ CD
-. ^; ^ C
D =.^
a,
a. ^
=
^;
CD = ^.
^ 33 = -.
^.
^ ^ ^.
=

ANNEX 2 - Agenda of the in-country Seninar
11.1TERNATIONALWORKSHOPONFORESTCANOPYDENSITY(FCD)ASSESSMENTUSINGSATELLITEREMOTESENSING
-FCDMAPPERSEMIEXPERTSYST:BM.
Jointly organizedby
Indian Institute of Remote Sensing (NRSA), Dehradun, Indiaand
Japan Overseas Forest ConsultantAssociation (JOECA), Japan
Date : 13.12.2002
I
09:00 - 10:00 hrs Registration
10:00 - 10-20 hrsWelcomeAddress and Opening RemarksDr. P. S. Roy, Dean of Indian Institute of Remote Sensing (11RS)
10:20 - 10:40 hrslntroductory RemarksMr. Susum" Miyatake, Leader of ITTO Project FD 60199 Rev. I(F)
10:40 - 11:00 hrslnauguralAddressMr. M. M. Harbola, FCCF, UttaranchalState Forest Department, Government ofUttaranchal
11:00-11:30hrs TeaBreak
11.1:30+.!3:00hrs TeenjjiicalSessibi!1:1 ;.' ; , . ,...,\<.,
Analysis of Landsat TM data to monitor change in the status offorestresources
Dr. AtsushiRikimaru, Remote Sensing Expert, ITTO Project FD 60199 Rev. I(F)
. Basic concept of Forest Canopy Density Mapping Model
. Upgraded features of the FCD Model
. Casestudies
Application of Radarsat SAR data analysis to monitor change in the statusofforest resources by Dr. AtsushiRikimaru
. analyzing Radarsat SAR data to classify the forest conditions
. CasestudyofTerengganu, Malaysia
12:30 - 13:00 hrsQuestions/Answers
Technical Pro
11:30 - 12:00 hrs
.,,,
am
,
,. ,
12:00 - 12:30 hrs
13:00 - 14:00 hrsLunch
114:00 -\!5:00 bysTeChiii6itSesSi6iin '-;; """'*:':' -.;:*I
14:00 - 14:30 hrsForest canopy density mapping- Indian experiencesMr. MB Chandrashekhar, Mr. Sameer Saran, Mr. PLN Raju & Dr. P. S. Roy
Demonstration of operating the FCD-Mapper ver. 2(beta version)Mr. Minoru Nakajima/I'll. Makoto Haneda, Computer Software
14:30 - 15:30 hrs
P. T. 0.
" I':\\ .\
I* .

Experts, ITTO Project FD 60199 Re, . I (F)
15:30- 15:55 hrs Closing Ceremonyamd Distribution of certificates
Prof. Kan Harmsen, Director, CSSTE-APDr. P. S. Roy, Dean, Indian Institute of Remote SensingMr. Susumu Miyatake, Forest Expert, 10FCA
15:55 - 16:10 hrs Sum up session and vote of thanks
Mr. Patrick C. Dugan, Senior Forestry Expert, JOFCA
16:10-16:30 hrs Tea
\
I
\ .

ANNEX 3 - Questions andAiiswers at open forums
Q. 1sthe FCD Mapper applicable using data from the indian satellite?
A. Yes. However, some of the data provided by LANDSAT-TM is not availablefrom the Indian satellite. Thus, the analysis will not be as thorough.
Q. You indicated that it is possible to tenthe age of forests using the FCDMapper. What criteria did you use?
A. Perhaps the presentation was not sufficiently clear on this point. The casestudy referred to in Japan was on man-made forests. Since there were accuraterecords available on the planting date, this data was used. FCD Mapper wasused to identify values related to age that can be assessed from satellitesensors. Age was already known. The analysis examined correlation of ageand results of the analysis.
Q. When operating the FCD Mapper it is difficult to setthe threshold. A slightchange in the threshold can create problems. Is there any reliable way to setthe threshold?
A. Setting the threshold is a decision that has to be made by the operator.Consequently, some knowledge of field conditions is necessary. The systemcannot provide a foolproofmethodology for setting the threshold.
Q. How can you test mapping accuracy? How accurate is mapping using the FCDMapper?
A. The most reliable way to test accuracy is through conduct offield correlationtests or trials. This is the process that has been followed in projectimplementation. Based on these tests, correlation ranges from 0.83 to 0.93. Byway of comment, it should be noted that field work is not always accurate andRS analysis at present still has some degree of error. Both approaches shouldbe used, and adjustments made accordingly as needed.
Q. How the FCD-Mapper can be used for agro-forestry systems like HaryanaState where the popular trees are grown in rows along the bunds/roads in thefield?
A. It is difficult to assess the status of ago-forestry; it is especially so for treesplanted in single row due to spatial resolution limitations of Landsat TM dataused by FCD analysis. If the FCD-Mapper is developed to support high-resolution data, it can help monitoring the forest status in such conditions.
Q. How the predictive analysis was done for changing pattern of forest in thisstudy?

A. Detection of change in the status of forests and non-forests was taken intoconsideration using regression analysis based on the trend of the forest andnon-forest status in 1996, 1999 and 2002.
There is high correlation coefficient between dielectric constant and texture invegetation. How you can differentiate vegetation types.
Microwave remote sensing is sensitive to moisture content due to its dielectricproperties; therefore, it is possible to differentiate vegetation types due todifferent moisture content.
Q.
A.
I

annex 5. Highlights of the 11RS case study in India
$9^^Is^ $^new ^I^us^^V ^^^I^I;^^^^I:^^^^I^^;I^^I $,^^^I^^^^;^Is
..
.
SpeakerChandrashekhar, M. B.
Authors
Chandrashekhar, M. B. , Sameer Saran, P. L. N. Raj", and P. S. Roy
Indian Institute of Remote Sensing (NRSA), Dehradun
.
*at
Int atio al or sho
,
I
Foes cano densi ina in .Indianex eriences
9'31;.",**\...,."!,$*"*\:;unitl'G^
,, rS
DepletionRes
Bound@ry ShiftingTncreosed Tinpac*
International Worksho
NONEOREST
Forest c h de i a In ridian ex eirie ces 11rS

Relevant Tools &information
.
Remote Sensing& GIS (R&D)
. ,
Research
Priorities
Inter ationalWorksho
ManagementQuestions
* SrA!N
:.
a"'^^^;@^!^^^^
J
Fore tca o
G
11
I .!.,. . ..
Information Needs
Spatial/Nori-Spatial
ensi ina in -I dianex eriences
et. S^.@.
*
a,,Q
.
.
..
ResearchQuestions
* ,Forest:' ^^ ^ ,, in3, I'm"geme ^Co ""' ~v a,O ^
^ *"'* 6'",, o1!1.0^^.
* p,', a, , ,,>
9.
^
*
I
^^
,, rS
. . .~
Intern tional or sho
\9^
^^..
* ,.. es"Its
*
*
="
EQ,61
* . .
OS.
^.^^.@ 0.
,, 0, ,aa COG'*
. ...
ores
VCI""tic
Fore t cano
,
^9, .,,
^a,
^..
^
ensi ina in -Indianex eriences
q
^"
,
.
11rS
?
70
60co@
" 50^co
o 40.g= 30oo
co 20
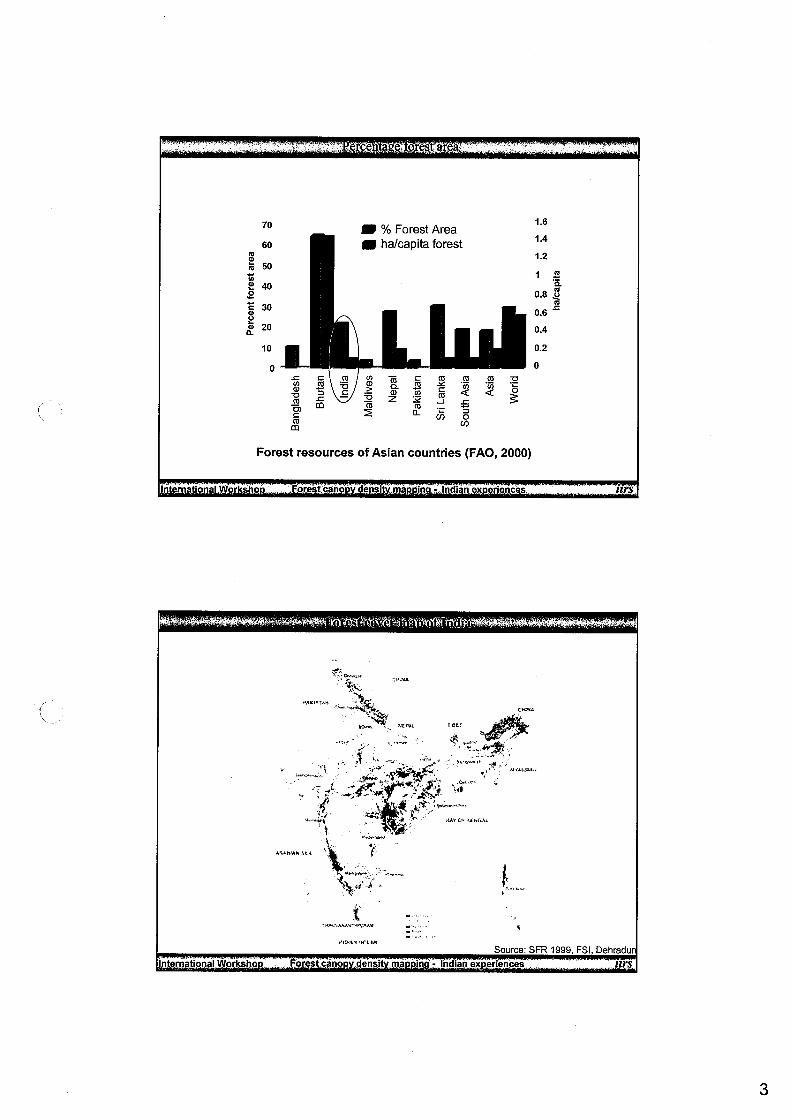
GTcen e^ orest ea
. % Forest Area
. ha/capita forest
10
o
InternationalW rk
Ccoco^CG
co ~CoCco o $9~ ^ >
coC.~ ^ z :^C
CD Coa=Co
CD
Forest resources of Asian countries (FAO, 2000)
, .6
,4
, .2
I coa
\
^
o tcano
C
co
... ,... .
CG*<=co.
CoD_
0.8 o
Co
co<.=
0.6
04
0.2
o
.
e SI
co
.
in=
Co D,-coo<
^
=o
CD
,
ina in - Indanex eri rices
^
. . .
P, ".,*h J
'~"'*'^. .'h. ,,
.,.., .*,*. 1.1. '
, -~*
, 3 .-- ---",-,...."4. ..., ,.~? ~
" ' -*4^r !"'. tit^. *j *!.- ->' ,,;^::~*..*..\ ..,
, ..,,, ,
J.
.*'.*,,. L ~
..
,...".
,, rS
". ,.
Internation IWorksho
""LnA" I, ,
...., , * . .,'.. .. .
',,..'."U*' .,,.."
orestcano densi ina in -Indianex eriences
1'10. .hat'",
. . .
. ..
. ,
..
,mm,
,
Source: SFR 1999. FSl, Dehradu
,
,, rs
3

Survey of Tndi@ Topographical maps
National Forest cover moppingby NRSA
\
Not!ono1 '., eggtot!o11 r, loppingby FS::
nt"
Forest Resource Mapping usingAeriol Photographs by FST
Forest 570ck mops
Forest a Non-Forest
1:1000000 scale. Closed Forest. Open Degraded Forest. Mangrove
1250,000 ScaleClosed Fares+Open Forest
. Mangrove
1:50,000 ScaleDetailed Forest Types& Density
Prepared for working PIOnI^15000/125000 Scale(approx )
Cover type DensityEconomic Aspects presentwith 3% densityQualitative siteTimber. Quality
Prepared for Management Tnforma*ion Under World Bank Aided ProjectsSystem on 160,000/1:25 000 Scale States are also making effort *oUsing Satellite Remote Sensing for Organise*his dotoForest Types & Density
' I"- '. 0"es .
Forest Resource Maps byState Forest Departments
I tern tionalWo sho
, .
Old and very broad
First attempt to createarea database nationallyusing satelliteremote sensing
BiennialIy
,
\ ^
Forestcano densi ina in .
,, ....
Every 10 years availabilityonly for reserve forestareas
Prepared every ten yearsusing conventional methodsSuch maps do riot exist ininaJOF argos
Indian ex erle ces
, ,
.
. ..
11rs
. ..
I ter a ionalWor sho
. 30
.
,
. ..
,
A .'.\., I'.. V ' .
. ..
Forestca o d
.
.
. ..
ens' ina in -I
.
ridian er ences I, rs
4

In forest measure of density are number of trees per unit area (tree density), area oftrunk per unit area (basal area); percent area occupied by a canopy in an area (canopyclosure). These are interrelated but relationship by age (majority) and forest types; and
Forest Stratification :
A contihuous vertical distribution of woody foilarsurfaces.
Forest CanopyStrati, 7cation :A continuous horizontal distribution of woody foffarsurfaces.
Forest Canopy : Complex structure that is significantfor environmentalinteractions, regeneration, growth, and biotic habitat.
An important parameter in Forest resourcesmanagement & planning: viz. ,
^. Afforestation and Reforestation
^. RehabMtation of encroached andloggedareas^. Regeneration or Gap filling^ Wildlife habitatmanagement^. Planned timber extraction
^. Sustainable management
.. . . . .., .. .
International orksho
. . ,. .
,.
\
Forest cano densi ina in -India ex erenc6s
, .*,,.
'Crown Cover' (cc):refers to the canopy closure ortree densitywithin the forest cover, i. e. within a pixel or uniform polygons
'Forest Cover' (it):refers to the percentage offorest area within a polygon
.. *.* . , . , t. .".. ,
."-"*"
\ 44, **If,
, ...
,, rS
am re >80%by it 61. 80, %OfC 41- 60%colt 21- 40%e) fc < 20'%
,.'.' . * .'.'--
Inter at'onalWo ks o
80.90V" co
Continuous, closed, high density
- Dense forest- Continuous forest cover
- Fragmeiited forest cover- Mosaic- Non-forest
,.., .,,.. . ..,
Forest cano de s' a
30-409'n CG
Continuous, open
- Indian ex er ences I, S
5

.
$ Assessment of Forest Canopy Density of the test site
<9 Comparison of differentforest density stratification methods
$ Validation of FCD Mapper
$ Forest canopy change detection
<9. Forest canopy dynamics
e IVeS' ..
Itenaiona o sho
. , , ....
orest
.., ,
o d
\,
nsi ina in - Indianex erences
,. ,- *--Ihdia
^
.. s,
I, rS
Inter ationalWorksh
."., , .
Uttaranchdl
For s ca o dens
Doon Valley
in - Indian ex eriences ,, rs
6
@ac I
Internal10a orksho
.**.
63
,a, :
.*
dig. *,:4d, ray. *'"^. "
,
-
Bare Soil
Index (Bl)
^
;4 L:;!\**.' '
nt
..... A "' '
.I
Fo estca
I
densi
*, a*,;:,.
*,,
. .
.~ *' -.
. ,,. ... -L
-:$r-. v, ,,^j *to .I^^, y;,:,";
a
4
I - I dia ex erinces
,,,,,.,';'If .lain*.\$^;;
, --. In,
+:., t^
*
APRIL
11rS
Inter at10 al or sho
A
*~
OCTOBER
' *
Foest in
*
n ina in - India ex eri es ,, rS
7
=,*@,=
^.o=
^
"=O_
I~\
,Io
o
^
a
=o
o=in
a"
":t's
"
.
a
"=
CD~>e
@,
to=a@"
,-\*
~.~
a;
Co
^".=
^
o
"
*j
,
~*
.^
..
o"CDco^
a
=o
ao="
=in
=
^
a"=
@X
o
"=
"co
,$;*;e,~.
J.
{*
..~
*\
*
*
e=
~=
*'.
F'
,
,
,:
*

, .,. .,
90 9'0
on
Ocular Estimation in the Field
*
70% 60%
Digital Photo linage Segmentation Estimation in the Lab
,
<
88 9, ,"
I tern '
. . .
,,
,
nalWor s
*
,^
\
*
,
48
70%
,.
Forestc no
'" ' .,, . , .. """""' '
*I;31
* ,4
a
I
,^.,
,
ensi
50 VC
63%
I - I dianex erie ces _
.,
I
+
j$.
Digital Data Sets:
Landsat 5 TM (, 6 September 1996)Landsat 7 ETM+ 04 September 1999)Landsat 7 ETM+ (22 October 2002)
Software Used:
ERDAS Imagine 8.5FCD Mapper1.15E-cognition 2.1
55 %
\
.
I, rS
" .- ,.
International Works o
,, ,.. . I"I
Forest co o ensi a in -Idia ex n rices 11rS
9

OL
s, ,, S a 91.9 X6 q I su p. 0. alsoJo
a^.
. ,*:"{.. .
*}^;*f-:*.^
^;,,
if
Us, I'
\
000'9Z:,
IP o. 1 Jayuj
" As;?.:.:.;\. j\- r
'-;If?:, *I. ,,,.:, ~
$23.;@,'**\.
s, ,,
. .
A
A .
.
*I
S U61. X e. pu . un eru Isua
000'00Z:L_,:!,!,,*.:-:;^
OU I 9.0,
,,. .' *
.. ,.
us o re . uJa
, $:^*;;000'9Z:,
...... . ..:,. .. ^., 00 -0033 S
- ----.-..-.~~-".,.~
,, I. . BS.
000'00Z:,
~,
..., .....,. .
. ., .,. ,.

^@,
a,
o
^o-ae.co
o
I
,Io
@
^
=
.
=
o
~
o
co
.,
.,
aCoCD^.,
coGPa
:,
^-
,
,
^
^~
a;
^
^
q
=
13=
^
o="
*
"
.
oaco~
a
=o
,IC,.
=a,^
ao=co
="
a
,
Z
.
,*.'
h
"
@X
@
@
a"co
**. ..,
I
.
,.
,.
\
^
1.3Qo
QoQ
. .
\\
^~
"=
"
a;
,
<\
, .
*r '^
, ,
~^Q
a
co.
I

,, .
*
14Sep, 999
, .. ..
\
1.1. .. ..:,. :
. .:.*I. ,. .
##,;*'-i#*:;.
I raina
FCD Map
,,*
r o
^g
o st
N
I
o
a
ensi ina in .-
~
220ct2002
>
'a' ex
a.
er n s 11rS
Internai n I orks o
FCD Map
Fores and
?,
N
ensi
@
a in - dianex riences 11rs
12

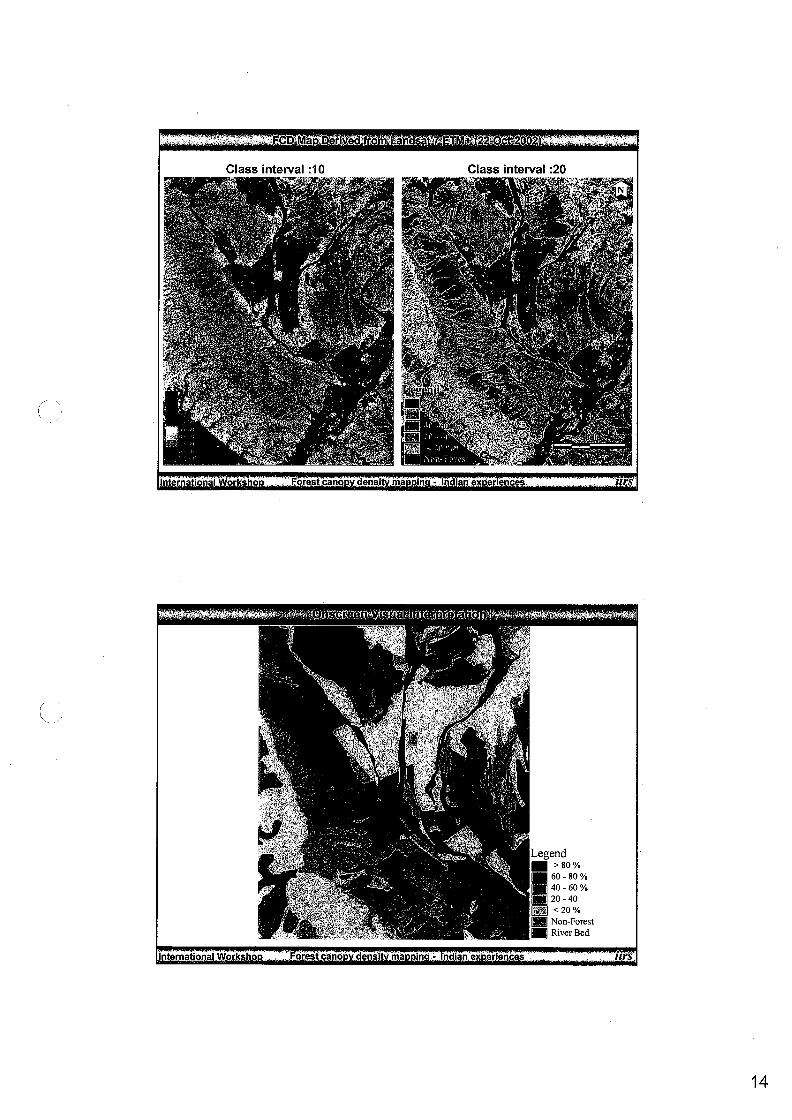
Class interval:, O
FD
*
Derive , 0 '.'a dsa *TM '6Se 96"' "
*
*
.,
6
*
Class interval:20
Inter ti aW rsho
*
,
I
^.
*
,
,=
,
*.
\,
orestc no
N
e
.
.
.558
93
*.
\
,
e SI
b
,,
.,
^
Class interval:10
\
a in - Indianex e 'ences
. . .
.. It
\ .^*,;*;.$?.$**
D
,*
a'
. a -
11rS
Class interval:20
riternatio a
^
\
orksh
$.
. .*'I'
^ .
Fores ca o
.
.
N
g
..
ensi ina in - ridia ex eri
a;^
ce 11rS
13
. ~^
Class interval:, O
.CD. a D
I
*
\
\
IP~ ,
ve
I
, .
44!
st, *-, .*C'~'O
Class interval:20
I en ion I oksho
, ..
, ,\
',*., J:t*-;^:4*:.: ..
, ,**I" ,+,
g\
V
,
v, -\"#
*#
t,I If
,^*'
F res cano
,
^
1.1
N
.gag
,\
^*$^!$;!in:$"" '*:., ,^;;;;*,
"* *,,
ensi a I .I
A
n ex erie ces
\*,
t-*tit
;
I"'.
..., ~
, *. t, 1'11*, , e, .;,
-?*;*;*':*,* .. ?,*V. ,*-
**\<*:*{;;*:,* '!'\ ,t*,-,.. ..;,, ,.'*,
., }4\- ,*it, , -*I*:*!,4\ I-,!.;I- ,~. it, "/,-";,'.!: .,.,.:. ....,,.\ .; *
. ..**;,.,'*" ,,,
in
*I,
,, rs
. ;*t*/; I, *,.,.... . t. ,,. ..* . .
il"$ *'-';
International W
a
j!
.,
41
,,,.
\*.
,-.., 4
I
;'
so
I:*
F 'rest cano
t,
t
e ina
Legend^ >Boy^ 60 -80 9, '11. 40 -60 VI^I 20 - 40I^I <209.I^I Non-Forest^ River Bed
da x eriences ,, rS
14

,.
,. , L ./. .,.,. ....
-:,*' _ '* *,<-11*;;$ I.'. I"' *. I, ,.;'...; I. ;',!,;*' "
* -;-*. '?:":;;:;If. : ..;e= . .-*:\,.. 4;?'t* .',.. ,1. ,;.':;:.'.,;,.- ' -;e' .... .:*-'*,. ,*.. ;*,;'>:,\,,;*,...:.,! '.: '!,:1';!*%. j ;,'. * I*.,:* ,;\ ..,- '-,'ig:- *..'! .,;'.--,.,'*..
,,, .*,.,,,;in;;,,,.,*,^ -#: -. ,,';,,,..,' 4""*;;**%'* !':^.' ,' ,,,', 4. .. *'.*,"' "' " " "'
e .re e e
Y. . ..\"
". ,
.*
*-' '* &., Ll ',,
.,- ':;^
e
Scale
^22 o
,,^I*.
o.
I ter atio al
, , I { a*'<*..:<"'*i\ .--', I~ I. .\"' '..,,, '-.
""' ;$'.^;ISI^::>,*"' "' ' "" ' ' "" ""*"* ' 11/1' '.'., *.,' .*,
., ,,,, .*..# ,* ,", -..-
e 1/1', Are. ,'" ,. .*"*
r o
I
oestcano d n
.. , . ,
12 '
10 .
Conventional method
,996 1999 2002
"=a
a-
Legend^ >80%^ 60-80%^40-60%I^ 20-40I^ <20%I^I Non-ForestI^I River Bed^ Water Body
= 6-
I -Indiane erl
in
4.
2-
O,
c6s
Forest
,2-
Non-Forest
,0-
I, rS
-a-"Ea
e56-"
FCD Mapper1996 ,999 2002
nat'on I or
^
Total
,,
,.
2-
o
o
,,
Forest
res o .densi
Nori. Forest
I;
dian x e' nc s
Total
N
,.
,,rs
15

=^
="^
o
in
^
a, '
o
I\
,Io
aco
a
=o
ZZ=22 AAAAANNNNN"^"""61,000 vvvvv '
^ ^^ ^; S ^- b-^ b- 5,561,616, "^ " " "S = S ^ ^ '
to=co
'"bib"'"bib""bj^"'N*.""'N, . conN e
.N. =. COIN Ne. "=NQ, ","..,..~=.=."I
=
.
=
^@.
@
a@co
U==as a"~., aNU. ==N. ON 5N=NIP. .a. "
~,=. as "^Ne, a. .=,"..=,. a", e. g. "~'=. as "^Ne, a. .=,"..=,. a", e'''"I\I
,
.
I\
,
~^
a;
^
co
=^@
"^
o="
,
,I,,,
^~
co=o
IDeG
,",,
^
*
.aN
.e,,
o
@co
*,".,. ..
."' ^ <*
*L
=o
.aN
; e': .*,,
-"f :'^it^,.-
="
\
^ii^.r>
,
.?
="
':.;'>;,, -; $4 <^;^,.:;^-*..*, \.*"*B, '
,,... ,,.. ,
,.',, ,...,, L.
, ..:;$;;.,,,,, ,.,..~,- .~
I '-;;:?^;^".* \.
<
*.
*
V
a
~ ""**,*... .. ..
^!$*,.,. ;, .Qi-! '3 .
.
, L~
a
4
^.
^
^@.
o=a
"
.-
, e*; *4"' .,, A
~ "
'. ~,,*,* ..
, ,.~ ^.. .t. $ .,."
' '~"**.. K. '
;, ~ ", r/-*;.',""::$:' ', 3, ..
. ,$,.,* -. '-;,*$;-$, "'\> . . '*,^*:,, '$:;;^g*- 1.13, -_ * , ;-.^^I, ,,,,:;^,, z,
,*
>,\^
^^
sly- \
,
.
*,*'t. *^,
..
-.
",
I
~
\
5.3'
,
ois"
IQ
o=
CD
"
.
,

3, , ,$\.-,:a. ,~ ^
\
a . *. 4"'*;^,.
^;:- *-..;>,;,*\ ..,,$...,* "
.-it. ;!J *, .\..';^;';',;^;*;!f - ..,:^ ,.;:? ';,- "",,- *, ,
. - -,-\.-.,,*,-
$1*-#*;.^-".
, . . I S-
**
^
a
.:. ,. ~*..{;,..' ." "'34,. @
it. ,... 4 I, tie",, 0"
, ....... ~
..,;,,!;*: !=%, ^ 2 to ,1'1'*:t. ,. " . t ^ 2 to,. ,,.. . ^ 2105*".;* !:' Iai2t0 6;' '*,",. ^ 310 I
i .. i. . ***.' 3104
*;.\^!$14*^,.,;:, >807.2 61.80%3 41-60%4 2140%5 <20%6 Nori. Forest
IQ
na'o I
*
,
k ho
~+
110 2^^ 110 3^I to 4
, to 5,
"
.\
,
I ,
, ..", .... , ..
',,,.. f- ..,, ,;,\,@.' ."' ..' I . .
,...... ,.., ,
ores c n
\
*I
g
*
,
,,
d n i
^ 3 to 5a to 6
^ 4to I^ 4t0 2^ 410 a3'6: 4105
4 to 6
.V
Pi, : ,y
^ 510 I^ 5102^ 5t0 3^ 5104
^ etc,^ 6102^ 610 3^
I - nl exer'ecs
1999\
*
5 to e
,,.~
B to 4
6 to 5Nori-Forest
.. , ,
$<
,.
11rS
.
t, ._}.*
Intern ionalWor sho
20.0,
.
orest cano dn i -I lanex rie ces I, rS
17

A "
o anson e
,\ !:,
,
I
\
,
^.
,996
.I*,.^*~"FF
4^:
n
. .,. ,
........
\.\4
.
, a
n
,
,
^!,.
II
$<
,..
,999
I terna to alW ks
,996
.' OPP"* I"
.:\:' <*^aa. .
, .-.-..
.\
,~
*
o
,
b
I
Forestc no dens' ina n -In an ex erences
2002
,
1999
.11^. Pi,
.
,
A
."~,
by<net
\*
g.
a. ?
4,
so
2002
*:;.*$!,
..;..>'.*;. 4, *:* .,*s6 mehtdti'
'If^J,
e. een a o s
I
.,
,
Region-growTechniques
\
#^
11rS
*;
OS
tor tio IW rksho
ISODATA
Clustering
a^
,
Us Cluster
Cumulative (SpectralBiophysical and
Thermal)
e"SIFore t can
\*.,
./
U
hr
a n
I
\,
FCD MapperIndia e arie ces
;.
*,:, ,443<
^<
d'
,, rs
18

=^CD,
".*
o=in
^
-Io-I
Z
~^co
o
a*a
8<
.:
*a
a
*
N N
61
a
=
I~\
,Io
^
1:3 ,b
.
o-I
-I
^
a
o
:*
V
g*
Z
un
=
*
"
a;
a
=
.
a
a
in.
a
a
a.
a*
a@=co
a
^
..^
g
.
^
^
,,
.
a
61a==a
.=
=
a
a
*
.
a
.
'sco
^
,P
a
.
~
Q
.
"
o-I
-
.
=
=
M.
^:*
a
V
.
.
a*
=
^
n
=
=
,i
a
"
.
PI
*
^
.
E
.
in.
a,.
Is,
*
:
*
"
=
a,=
*
,
a
^^
a
.
a
*
"
a
^
^
a
.,
,
*
*
"
*
.
a.e==a
-=
,
.
S
a
a*
^
a
"
a
Z.
E"
.
^
ea
,a
:*
a
.
,
@,
o=a@co
^
::
",
.
"
a
^
V
a32
=
.
^an
a
a*
.
"
a
^@
,a
^
"
,
SI
.
a
^N
^
:
.
U"
a
a
in.
i*,
^e
"
~
~I
.
^a
a,
B
-Iaa
~
.
co
"
,
.
*
"
a
a
^
13
.
*
*
.
"
in
~
~.
a8
..
=-
a a'
Z.
^.aa
g*
@a
*
a
is
"
a
N
*
~
@
a
a,
I\
^
12
a
a
"
B
.
is
is
ais
^
a
-=
"-
e.
IQ.
=
"
aa
is
to
a1:1
aU
a
51
.
is
co
I*
^~
N"
a
=
xi
^
^
*
aa
"
^
in
~
.
^
.
NU
<0
a
U
M.
*
*.
.
=
S'
^-
aa
a
U
.
^
1319
19
in
,=a,^
o="
>=
"
Q
in
on
.
=
.
"
82
Za
~,^
coco
,a
1313
o
"
a-
co ^^:<;$^;,,,;,'\-, .',* , ,.**t-."<-/'-\.,' I \; .. *;:*/*^;g, ^,**.*' ..', k'*, ., -. I-- :
\ {. *^-,'.&;,*,, 1'',"'I. .'f-/ , _,*...;;:
"' ""': ^">"-*; ~';- -- -w, *,,;.**- 4:";I. . ,-,::, r. .-, -.., Ib, .^ ~. .' ' a.',;* ~1.4. ?-,;;:;- ,'.\j. 4-.,-; .,.. , , ,.. ,,,
' " ',"'C'*"""" "'* "' F"~' \**""'.. .,., ,$ A ' *. 14.9, ,. r. .<\ *, v. <. .,.{;.
' a. .,,.-*. ;.'-.:-.,*.-'\ -I'. I _=,, t; ', .,..~-- ,. , !;;;:"-,;;!!it. *\ '- \-I , '.",:;*$-\ 'Co ' " "*':',*"L. :I',:/"\""*' *" ',"\\ *''.. ,.*,**\1.3. .,*,_,---.-*..,~ e ../e' '. :^^;.-t;\;':*:.,*, 1', 111t-- '- 44. <
.., ,.*{.,.~*,, .,.
. .' '.'.. r-,..~,',','<, . $" . ..\*,,: ~
,.*\;;-;;,'*..'" .h, ?,.^;.*;4"k. ,.* .-.:!.. .-: , :?#-**.. _,:,.- a. a a. .
.t. . ....-....* ,'.., - - .-' . ,.. . .'
in
a
N
.
."
.:a
a
"
~
^
5191
".
"
a
a=
a-
".
".
a
in
81
a
SI
aco
a'
o*co=o
is
~N
N
N
^
"
8
""=. -aa
un
un
^
I,
a
NU
-I
a
.in
a
a>=
in
91
Q
a
=-
Co~,01o
aa
o
=
61
,Io.@co^
.
"a
"
a;91
's>a
^=ale
,be
^. ^a-
".
Q
a91
co8118
a,=o
"
01
".
=
,.
".
12
"
~I
U
ato=co
>=
coo
I\,^
.
e
^"
^^aa" *,
=
.
e
ain=
^
coGPGo
o.
a,
o
O.=01
co
o
a,=
in
.,,.,, ,. .. ,.\;-...'. ,;q. ^;,^:-;*4, **,.,.-,;..,-eq, -} . . , .. .,,, ~*-t-,.<. 5- =,&!;^^^
@
^un
a
a
I,."
N
Iein
"..
e
o co
o
a
o01
^
e"
an"
"
a
,
a
gco
a
^
@@
^N
^
eN
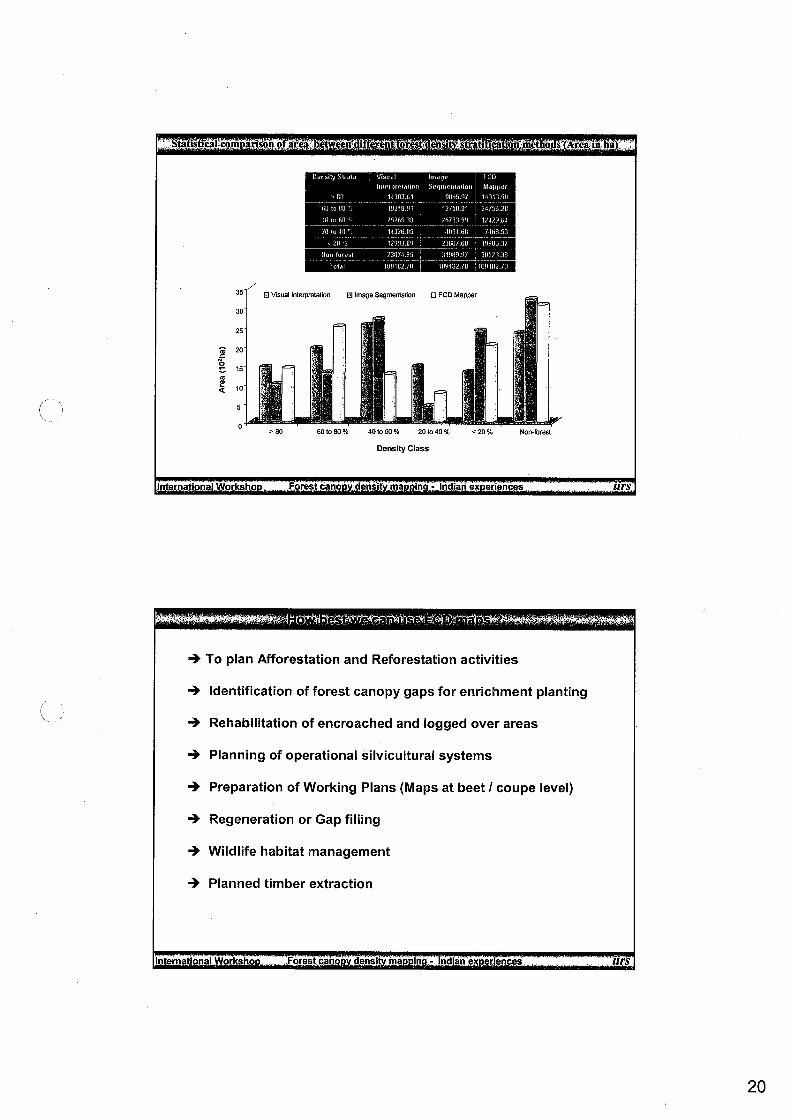
tat, sti, al'coin' ar Son of area. be
\
. it
35,/,
30
co. eros, 'st t, re , name o s'Area-jin a'
. Visual Internretati
25
co="
QF 15
in
20
^ 10
in linage Segment
Internation
5
o> 80
orksho
. FCDMapp
60/080%
Forest c n
40,060% 20,040%
Density Class
densl
+ To plan Afforestation and Reforestation activities
^. Identification offorest canopy gaps for enrichment planting
.^. Rehabilitation of encroached and logged over areas
+ Planning of operational silvicultural systems
^. Preparation of Working Plans (Maps at beet/ coupe level)
+ Regeneration or Gap filling
^. Wildlife habitat management
.>. Planned timber extraction
, .
a In -I dia e eiences
<20%
I .
Norrfores,
. *:
,, rS
.
Internal'o a
... .. ,...... .
r
. ... ,
o
'. ,* ,
Forest ca densi ina i' -Indiane erences ,, rS
20

^. Can be used as a base line data for scientific work
.I> Detection of disease affected areas
^. Change detection in forest and nori-forest
^. Predictive analysis of change in forest canopy density
International Works o Forest can
., .. . , ... ,.,..,, . .
dens'
Advantages of FCD Mapper
, NO RS & GIS expert required to rum the model. Takes less time to generate the density maps as compared to other
conventional methods 0:7), Generate density class with very small class interval(, 0)
a in - Indianex eriences
. ~. . ... ,,.,..
Limitations
* Season and Sensorspecific* Loss of projection information (Ver. 1.5)* Limited data import/export options* Need some idea aboutthe ground condition to define threshold* Difficultto extractinformation in complete shadow area
. . . .,,. *, - ,.'-.. .. ,
11rS
riternationalWorks o
:. '..',;..' ,.. L
Forestc no densl ina in -India ex eriences ,, rS
21

* In comparison with other methodology, FCD Mapper shown good resultswith respect to class interval, time taken for analysis and mapping accuracy
* Cluster analysis of forest canopy density map derived from FCD Mapperand Conventional methods have shown similar trend with respect to percent area offorest and non-forest.
* Gregarious occurrence of bushy vegetation like Lantana poses problem indelineation of forest canopy density as their reflectance is similar to that ofthe forest
.\
^ .
S .
\.~
riternat'o alWorks
t
,.
Forest cano
... ... .
,
ensi
., t ; . ...
I express my utmostregards and sincere thanks toDr. P. S. Roy, Dean, 11RS for Providing this opportunityand his constant moral support and scientific guidance.
My special thanks are due to Shri P. L. N. Raju and ShriSameer Saran for their benevolent guidance andconstant encouragement to complete the projectsuccessfully
in - In 'an ex erience
*,
*..',. . " , I. '.. '.: "
ITTO IJOFCA Team for providing digitalLandsat 7 ETM+ data sets and FCD Mapper,., 5 to concede the present study
,, rS
ternation IWor sh
~ .. ... ., ., . .... .",
Fores ca o densi a in - IndianaX eri rices I, rS
22
I\ ,-\
toco
CD
=
o=
^="=o
,Io
co
8o
a@=co
="
=
=a
"=
oX
co
^,@=
toco
=a,
~..
=
' '!11'~ ,,,,^
=\
^
,

I~' ..^ .
eF.
^.,CD
F=IC>
.
^>.''d^I^I^d<CD:,,r^I~\
^,CDFF99
<CDF^co-.
o
^dCD
oF. ,FF
o^
^.,CD
^o^CDer.^,P^e, .-.
oI=Ior. r,
o
CD1.399FF-.
^
^
^a^ao^dr. ,o
CDe^er.
^d^O>o~~.
c, OC, O
I^dCD<I-,
^..^CD><
O\
.
:=.
00:=.,b^-.
OQ=..,-co
o-r,FF
=..CD
>rjC>^
93^^
CD-,
Q. .CD
=I
^o=coFF-,93-.-.
o=

Table of Contents
I Aboutthisreport
2 Demonstration of operating the FCD-MAPPBR. ............................................ I
ystem ow """"""""""""""""""""""""""""""""""" I
inporting ...................................................................... 2
2.3 AnalysisbyFCD-MAPPERVer. I ................................................................................. 3
2.4 AnalysisbyFCD-MAPPERVer. 2. ................................................................................ 5
3 Problems of FCD-MAPPER(betaversion)
..............................................................
\
................................................. 8
,

About this report
This report describes demonstration of operating the FCD. Mapper ver. 2 given at the seminar for ITTO
project FD 60/99 Rev. I (F) that was held at Indian Institute of Remote Sensing located in Dehradun,
India. This report also addresses problems necessary to be solved to complete development of the beta
version of the FCD. Mapper ver. 2.
2 Demonstration of operating the FCD-MAFFER
The contents of the demonstration of o eration the FCD-MAFFER
2.1 System flow
I. Systemflowoutlines
^
.
^^
2.
^^
^
^
System flow details of the Pass I
.
3. System flow details of the Pass 2
^^
^
.
^
^
^^
^
I

2.2 Importing
4. Conversion of the TIFF format data to FCD system format
The contents of the demonstration of o eration the FCD-MAPPER
."^
\
*
IJ;\!\*-.r. h; ,
.*\*,' .V;**:,,,. **;*a
5. Operation for geometric correction
I
TIFF format
;^!;. ., a--. tv*,*:'.,.*.. E. g. !,::egg;,~".
*&^^'"~P,
^,.
"I'm^
..
Dragging one set of data over the other set
\
^ ^,,"""a, ,~,
~
,
6. Sub. setting image
;.*.:;**' ->::*:-!.....,.., . .,*
,%.:. J::,,,.<.\,,:..,..
,'-, .,,*
.,, .J. ,L* .. ,.
,.,
$1*
-~,~,......
I
i. ..
;$;*\
:!^51^=I':^!I
FCD system format
->
"...,. .
,
B" .-~ -,--~
=;=; Is=:: S 8 ,~ by "^,.
.,.". ~~
t^t;\*
",~- .".,, mm ~
..,..". ."- ..". ..~..
^$:;;;-.*,!.';-^
^
Subset linage
$3\341**V:^'^a^
~ . ,.-. ...,
it
I
.-- ..... .
&. it$
Setting of GCP
^
*$ it**;I. * 1'<\I. ,.,', .*,*
2

2.3 Analysis by FCD-MAPPER Ver. I
I. Noisereduction
...,.." ,~. .-...
;. ,*,,*e*;:*:.
tar. -'*I*;\;;.\.'.~* ,...,".:".. j .
, . * . ..*.. *.., .
, ..:., *. V""'"J* *
.,,,,~P*-.*.~
' 4, ...t,
The contents of the demonstration of o eration the FCD-MAPPER
Masking for water-body
r,
I
~\
2.
..
*
Normalization
* *::**'::*!:*!
;:'$;*$-'j*;!*\AM
, ,.,,, .,*.,.-.,", \
-..,,-,-. .
-~,
*
~,
,
Masking for cloud areas
,
d
3.
.
Normalized image
J
IN. *,,",,, QIN"aFL
Synthesizing the index data
,- a
. ,
*
,,;^-*-*-,;,:^
;**nam&"*39", s^.*,*^.
,
,,
I$3e:,.
%."
%. .
I
*t**.,,; at,,........ .,, .....,.".. *.,.;.,*..*J*. *,
Masking for cloud shadow areas
.f. ,
AVI
it, ,*
1<'5f:\'*;;;**;\, A. :. I, ,\*-..;,.
. . .,.... . ....". -...,,*.- ,-J",,,. , .. . ,
". .~f' \.
I'D. ,,,"', '10. ,..,.'.*.:,;.' ,
b . ., U. ' ~l"b "LSD . a
4
.*.*,
+
","""~.."~tv*;?, rin-,..'.'..,\.:r~ , .. ,.' ...*. -.
.--.. -.
. . ,
U. '25ripZ
E;, t. ' "",'. ; ",,..,. I* .I;* . "'
. ~ ,....
, .ant . ,... .... '*.~"". ,'.
' in'...: ;.
. .*123, B , .
Computing the Vlfrom AVI, NDVl, and ANVl
S. I. CG An uz rin. .r'", Z COE'V,
^^LJ
,*
NDVl
^a'
^,.
J~
~
*."
. ,
#. ,,*
4'
,
I';;e; "
ANVl
.-.
I
Vl
? ,
3
.::.:\^.
. .
Bl
A\4/6^
\
$63*
*

5.
The contents of the demonstration of o eration the FCD-MAFFER
Computation of the VD
;,",.,,,,,,."*,\"."*',' " '
II'd';,;; ";.\*I. .~'~
''nt*,' ,,,':'*!;';,!\^.\***$;::. 3,1<1q, $'"*!*$*,*. *I~ $4*** air, ini, "Self; *
," *,
If
d
I R**,*' ' I^35.63, a
,
~ A*,""a @33", A, *** t
**. I:> *- a. .*$*E*. . . ........ -,... .... ,.. ~
Setting the Vegetation area
'49, *
gala:$4^32a. *aR", b**. ars*!*:*S!*$,,***,,
a.
,",
ian;;,;^:I^.,";* .. - . ,.., ,
. ;**:"** Gaga"g* ';
SI
,. t
at
I
,, 4 *,'
\$1- ;$#t-it*t*-*, fit;!;,,:1"*":'.'r*:$*\I** ; ':. *.,
, 13.61',"
,.
I, a, ," Rung, ;,^;"* IIW. *L8 a@*,\"g"'*;*an Bet*.;**, ti, *
.; ",, at"*.,
. ... J\..~.,.".*~,..,'"..'
gaga;?\,
Setting the bare soil area
, . ,.,,'.. 'I, .:., '~' '~* '.;. I, '
.".',^\, ..,.'-"' <1'.*,
i. t{;-;*!'11:9!--&,;41n';;. hath1'11*.,," *.","I :,," *...~..~,. ...,". .
:**.;;, jib"* ."*,;At-,.,*.". 'itt, ,',!, .I*";, "*SLt, *,,*.!,I~ Waaaa. ,,. I a~""* ^;;$!
'. 3"In:*:aji;^!;
6. Development of the SSl
Tl
.
EU
VD
,
Setting O% level of VD
*
'I. ,*:';. ~., .-'-;., '.,. .' In .:; ,I' "*"".,;';;,,!,%"',! ;, ;, 4 I"'....;. I. ^*.; \!,,,;!.
;:;*{'it;*,.," 21.41;*It's$;;^$Fi'-:;:
. ,,,,:!*;,.,"' ", 31 .,,, .... **,,, ,. it:, ,t~ *,.-a "
. 'in*t\ ..\:!*:,; I'iai' *.., a ;;:. If, ,":.*a. ,; E, '~' *t, '*!;!
11^^'-^^;
""",
Selecting the classes that are considered to contain forest cover
,, ah~';,,
","
^
. . ..
., ..
am ."" ..
mm". .'.'.."",.. ...~. ,".,.-.
~ ....,-.
Setting 100% level of VD
", I. *:IJ
... ,
Setting O% level of SSl
IF a. r -. _, _,.:I:!^=I~ mm - ..,. " .~..,,~.
,..... . ...
... .. ..
^IE... L!*- " ,21,
a
Setting 100% level of SSl
t -.. --
;.. ~.. - ",. .. "."..~..
4
*.. *t,
SSl
*

7. Development of FCD map
The contents of the demonstration of o eration the FCD-MAPPER
2.4 Analysis by FCD-MAPPER Ver. 2
I. Noise reduction forthe cloud area and cloud shadow area
FCD map
Original data
2. Noise reduction forthe slope shadow
I
,.
,*a*,,..~,.".
,,"
^
"
"
S
Selecting different-dated data
"
~-F^34*.*:*tf;:!;I:^Eiji^:::a
Original data
I' ! ^..
\:,
'^A%*'I::^:;;,'. a!jab*:iai;i@"a. ,* ,.,*
Noise-reduced data
Noise-reduced data
".
Setting the number of TSlfilters
A
a *^.~
,
I
. ~ ,~""+*\* .,,." ,
: .,.,,..,, . -,*. ,.- .
- !>.*4, ?,;*\:!*. I
. ...,.. ,.,.....*. .
. ~ ..,.., ,,,. ..
>.*.. ._.~.,...,..
t
42^;"
^..
" "'e. .' , ' ^!.',:- ,;" $4'- <4-. .'- *;-<,,- .,^,"z. -" ^, ^;I. .b';
I -' .' ' % .'..--,' ,
.,*./. -. I.. r. ,, ., ., g... , ,"? ... . ...:..,,
..~,. .,
..,, ,
Selecting the slope shadow area
5
,,
. ,, ".
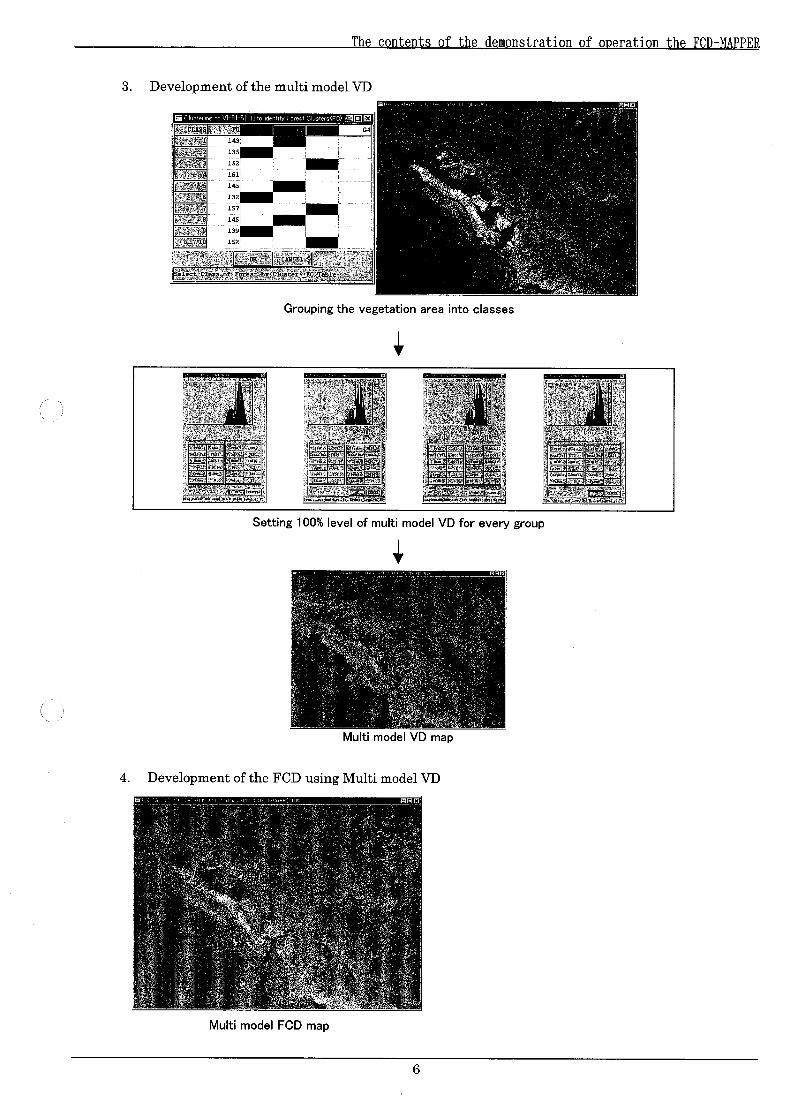
3. Development of the multimodelVD
a\{C^;$5 a^:It, t
I*t$*: *.!a$\4\!\.^, .i~,~fiat:;*$ 1451*;?&&!$ 132^;%it*;7 Ls7i3:15;:;f:a L4S,it*%*'$L39 ,
L43
L3s ILS2 ^
The contents of the demonstration of o eration the FCD-MAPPER
3:<;@i
I':"'.':'?:: t;;t ; "'; "t, aji, t*\' I\CutCE'L , t ""'*,'*':.,,,lief, 6, *C*69^jd, licee, e:, by;61u, :<, t, =, g?req!,'*:It:**I
LS2
.X
G
I I
^
.
I .*,,*..,..;:*\; 44;,;,
I--!$**;*-;:*$-;;$$1$*',{'!
I^j~ ,"......*.~.",
Grouping the vegetation area into classes
..;!>:;-.;;34%*; *
' ,",',,*,,,' firs. a, .
;by%^
Setting 100% level of multi model VD for every group
.
4.
tic^83'?^
Development of the FCD using MultimodelVD
in$;$43}t .,$;;\;,..-,-tit?*\^;fj;'%;, ...,-*-,!?\\;;,~:,
Sai
Multi model VD map
4
Multi model FCD map
,..*#
6
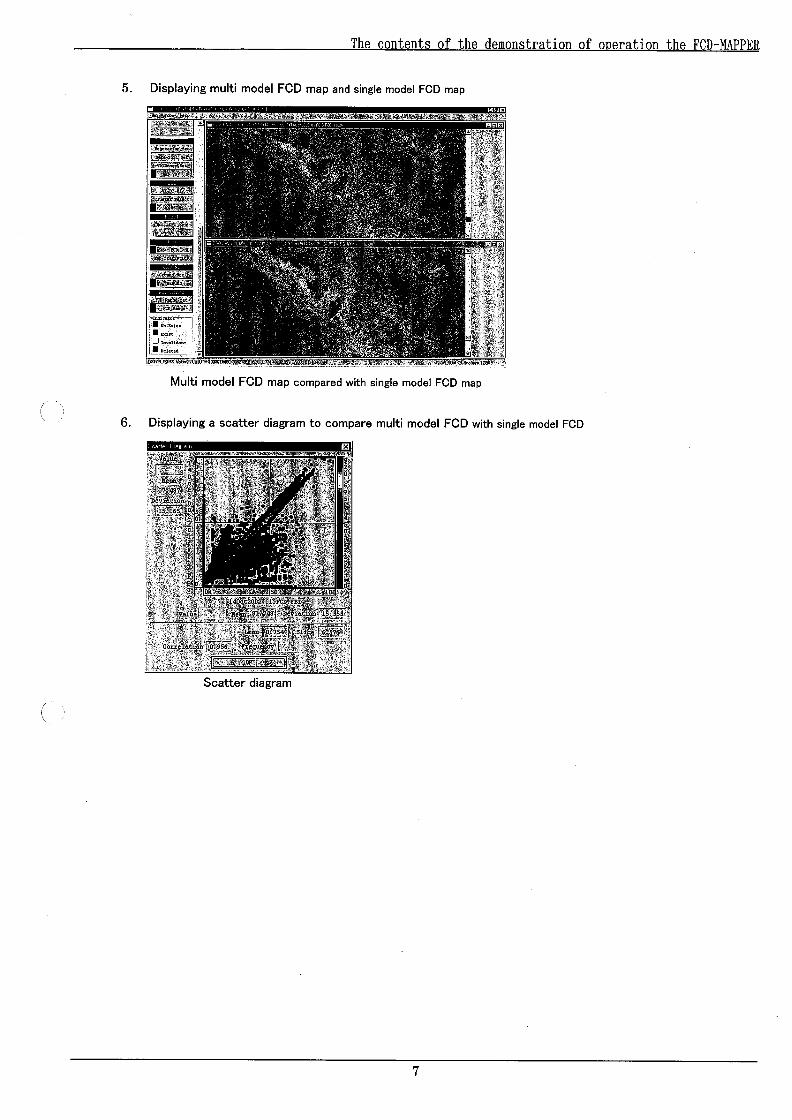
5. Displaying multi model FCD map and single model FCD map
*q, ' ,,*,*.^,;"by41, *!,,!*, I"*, a, **;**:***t, t*,*'*.*L';,,*a\*,^*$' of*"**^*'*****",
I'M9&:a, ;
,.. .," ...
53,831,437,gagaisa,
*&:.*4:9a
****,," , I*, T*., ,, L, $9\\^, Igv,
,
,~.. .
,,;*\*t, ,, art ;
E%b"*\36,635'aa, ,
,I'd, ' "',. b;5,563'""X, : :.
.",~., ,
"",.".--- ,
^"--- 11
The contents of the demonstration of o eration the FCD-}IAPPER
."_ ., a. . ."gill, IU"nam, ,@"21_ _ @11"
6.
Multi model FCD map compared with single model FCD map
Displaying a scatter diagram to compare multi model FCD with single model FCD
:, P. . ..,., 11. :
I ;^. it'*<;;44I;, -I - *, I
:66,186i*' '11.1;^^^\&':1*..*.,*;!;11, ,,*,,,,;, .*,*,',' F.
I-: .. ,"-I. *.,\TIt. *.. ,.!: .,\ i'~ .,.,....
-, A ,...* -,
,,.!:*:'*
;:,. I Airif:I. .;: *
***1:1';. I,i, l'*'"'*"
11
4:4- ,,,
.,,,***.,*'..
at^i\,"
t:'*
..
*
,*;*
..
.
",*,",.,*,"", "",~""***
t:;,-;1:4*\' Iff!nil;;;-I;;-!;e; $#*':tjif;tit*i!!\' tnnt\
. "",, fi'"', ... '.,\t. ,," *
UV, ", kg 5*at. ***:340
Vin$^,:,,.^sin$^;$?;;:
Qin
k
,.
- -*..
; ;it\,. -,.
,
,:-.;,.':,-! it. *:. I!.**.,;--,'.-,*Lean;16n^:!Aguee;^;;I"' t"C6rt6j. ,;,.%a' Ib'9561"; 'he ' .. i'!" ," 11',!"""" :- "" ';I".:.- h'-..,. :, .; ^?^;34^^14, -\*,;I;:'- ."";:!::
^
"I
a, :,"^@^;;r
. . .
2
., it55n'
Scatter diagram
7

3 Problems of FCD-MAPPER var. 2 (beta version)I. To display a sign to inform that automatic support for recognition of pixels with high correlation,
computation of Affine Coefficient, etc. is not working appropriateIy while selecting the GOP for
geo. correction.
2. To separate the haze. reduction processing.
3. To adjust the level of shadow area based on the forest area designated by SST while reducing the
effect of topographic shadow.
4. To display information on in/Bl/SIITl as wellas SSlfor indicating the groups of multimodel.
5. To modify file. selection procedure for exporting data similar to that for scatter diagram.
6. To set passwords access a function to revise the expert. sheet.
7. To revise the expert'sbeetto comply with the FCD. Mapper Ver. 2.
The contents of the demonstration of o eration the FCD-MAFFER
8

annex 7. Itinerary of the Mission and List of 10FCATeam Members and 11RSAssociates
Itinerary of JOECA mission for application test and in. country seminarin India
Date
Dec. 8 '02
2 Dec. 9 '02
Team Leader, Asst. Team Leade
3
Sun
Dec. 10 '02
Depart Tokyo and arrive in Delhi
4
Mon
,. -
Dec. 11 '02
\
Move to Dehradun, visit 11RS to discuss seminar programme anddemonstrate FCD Mapper ver. 2
5
Tue
Dec. 12 '02
Conduct field test to verify the FCD values. Visit Sal forest onsteep slope area to check shadow effect.
6
Wed
Dec. 13 '02
Conduct field test at Sal forest and moist deciduous forest in the
study area.
RS Expert, Software Engineers
Thu
7
Demonstrate operation system of the FCD-Mapper beta versionat 11RS.
Dec. 14 '02
Fri
8
Organize an in-country seminarjointly with the 11RS at theauditorium room.
Dec. 15 '02
Sat
9
Discuss AP test among the teaVisit Sal forest and drydeciduous forest, cordinateGPS points.
Dec. 16 '02
10
Sun
Dec. 17 '02
Prepare proceedings of the
Senior Forestry Expt.
11
seminar.
Mon
Dec. 18 '02
Compile field data and reportsat 11RS. Depart Dehradun.
12
Tue
Dec. 19 '02
Leave Delhi
13
Wed
Same as left
Depart Manila andarrive in Delhi
Dec. 20 '02
Leave for Delhi
Arrive in Manila.
Thu
Move to Dehradun
andjoin JOFCA team
Disseminate new RS
technology in DENR.
Leave for Narita
Fri
same as team leader
Arrive in Tokyo.
Arrive in Tokyo
Arrive in
Tokyo
same as team leader
same as left
same as team leader
same as team leader
same as team leader
same as team leader
same as team leader
same as team leader

List of 10FCA Team Members and 11RS Associates
Mr. SusumuMiyatake ProjectTeamLeaderMr. HiroyukiChiba AssistantProjectTeamLeaderDr. Atsushi Rikimaru Remote Sensing SpecialistMr. MinoruNakajima ComputersoftwareSpecialistMr. Makoto Haneda Computer ProgrammerMr. PatrickC. Dugan SeniorForestryExpertDr. P. S. Roy Dean, 11RSMr. P. L. N. Raju Member, Extension Core Group (ECG), 11RSMr. M. B. Chandrasekar Research Scientist, 11RS
Research Scientist, 11RSMr. Sameer Saran
,,


