
© Institute for Fiscal Studies
Disease and cure in the UK: The fiscal impact of the crisis and the policy response
Slides prepared by Carl Emmerson for SOLACE
November 2010
http://www.ifs.org.uk/projects/346

Conclusions
• Permanent hit to public finances from financial crisis estimated at £86 billion a year (in today’s terms)
• Response is a £98 billion fiscal tightening by 2015–16, comprising a £24 billion tax rise and a £74 billion spending cut (in today’s terms)– OBR estimates 60% chance of hitting fiscal mandate on current policies
• Overall post crisis tax and benefit reforms regressive across most of the income distribution, although very focussed on richest 2%– cuts to welfare payments for working-age individuals
• Four years from next April will be the tightest sustained squeeze to public service spending since April 1976 to March 1980– total DELs cut by 11% in real terms
– overseas aid budget increased sharply
– in England: NHS and schools relatively protected; largest cuts to: Communities and Local Government, DEFRA and BIS
• Would be sensible to review plans in 2012
© Institute for Fiscal Studies

Disease
• Outlook for the public finances dramatically weakened since Budget 2008
• Much of deterioration expected to be impervious to economic recovery– ‘structural’ rather than ‘cyclical’ increase in borrowing
• Forecasting borrowing difficult– estimates of the size of the structural hole have changed over time
– latest (June 2010) forecasts are slightly worse than the forecast made before the general election (March 2010)
© Institute for Fiscal Studies

© Institute for Fiscal Studies
2008
–09
2009
–10
2010
–11
2011
–12
2012
–13
2013
–14
2014
–15
2015
–16
2016
–17
2017
–18
0
2
4
6
8
10
12Extra cyclicalExtra structuralBudget 2008
Per
cent
age
of n
atio
nal i
ncom
e
Permanent
damage =
5.8% of GDP
(£86bn)
Note: Author’s calculations comparing HM Treasury June 2010 Budget with HM Treasury March 2010 Budget.
Disease: size of the problem

© Institute for Fiscal Studies
Disease: change over time
PBR 2008 Budget 2009 PBR 2009 Budget March 2010
Budget June 2010
0
1
2
3
4
5
6
7
8£47bn £94bn £86bn £78bn £86bn
Pe
rce
nta
ge
of
na
tion
al i
nco
me
Sources: HM Treasury; IFS calculations.
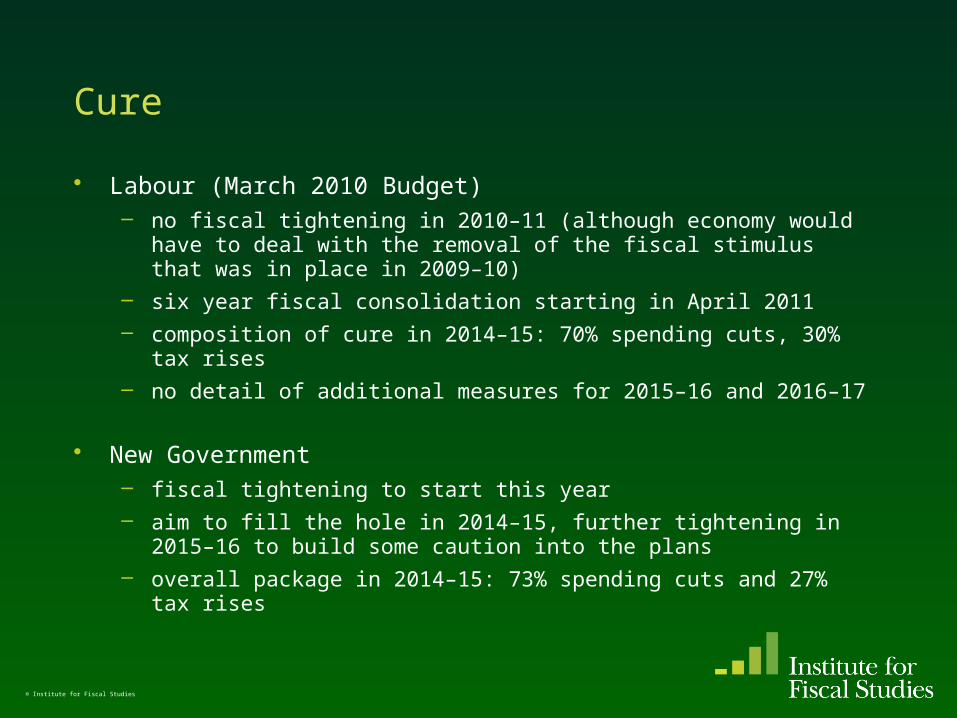
Cure
• Labour (March 2010 Budget)– no fiscal tightening in 2010–11 (although economy would have to deal with
the removal of the fiscal stimulus that was in place in 2009–10)
– six year fiscal consolidation starting in April 2011
– composition of cure in 2014–15: 70% spending cuts, 30% tax rises
– no detail of additional measures for 2015–16 and 2016–17
• New Government– fiscal tightening to start this year
– aim to fill the hole in 2014–15, further tightening in 2015–16 to build some caution into the plans
– overall package in 2014–15: 73% spending cuts and 27% tax rises
© Institute for Fiscal Studies

© Institute for Fiscal Studies
Fiscal tightening: Labour’s plans
20
08
–0
9
20
09
–1
0
20
10
–1
1
20
11
–1
2
20
12
–1
3
20
13
–1
4
20
14
–1
5
20
15
–1
6
20
16
–1
7-2
-1
0
1
2
3
4
5
6
7
8UnknownTax increasesOther spending cutsInvestment cutsBenefit cuts
Pe
rce
nta
ge
of
na
tion
al i
nco
me
Sources: HM Treasury; IFS calculations.
70%
30%
© Institute for Fiscal Studies
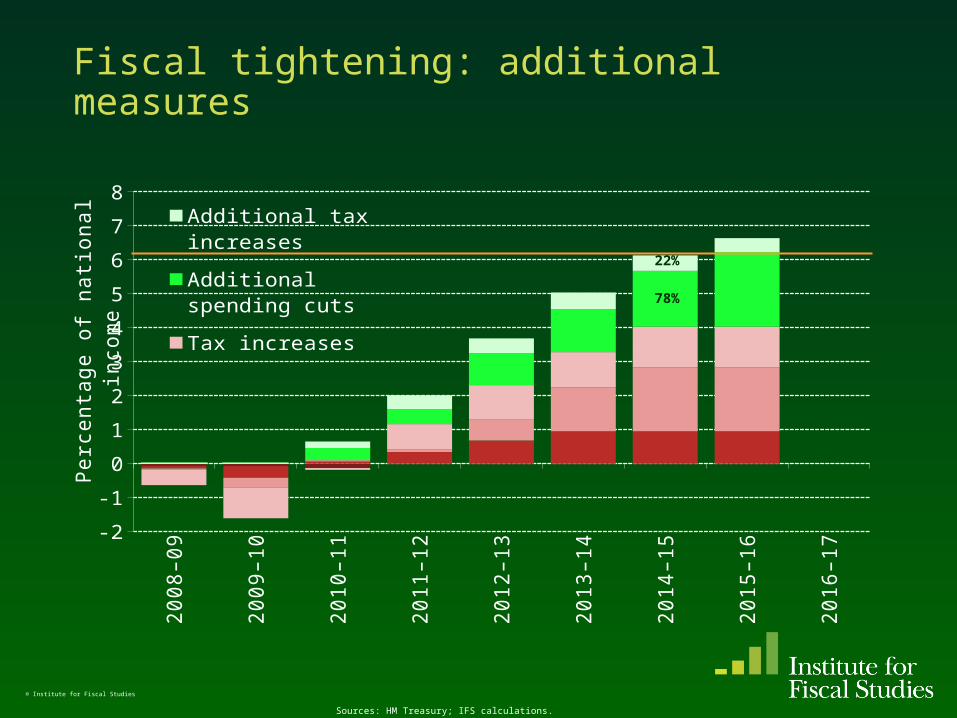
Fiscal tightening: additional measures
20
08
–0
9
20
09
–1
0
20
10
–1
1
20
11
–1
2
20
12
–1
3
20
13
–1
4
20
14
–1
5
20
15
–1
6
20
16
–1
7-2
-1
0
1
2
3
4
5
6
7
8Additional tax increases
Additional spending cuts
Tax increases
Other spending cuts
Investment cuts
Benefit cuts
Pe
rce
nta
ge
of
na
tion
al i
nco
me
Sources: HM Treasury; IFS calculations.
22%
78%

© Institute for Fiscal Studies
Fiscal tightening: coalition plan
20
08
–0
9
20
09
–1
0
20
10
–1
1
20
11
–1
2
20
12
–1
3
20
13
–1
4
20
14
–1
5
20
15
–1
6
20
16
–1
7-2
-1
0
1
2
3
4
5
6
7
8
Tax increasesOther spending cutsInvestment cutsBenefit cuts
Pe
rce
nta
ge
of
na
tion
al i
nco
me
Sources: HM Treasury; IFS calculations.
27%
73%

Differences in cure (2014–15)
• Overall tightening: new Government to tighten by more
• Composition of tightening– mix between tax and spending very similar to March 2010 Budget plan
– sharper fall in borrowing leads to greater reduction in debt interest spending
– similar £bn cut to investment spending (both very deep)
– significant welfare cuts announced since election (not known whether Labour would have done this)
– bigger £bn tax rises, and deeper £bn cut to non-investment spending, than implied by the March 2010 Budget plan
© Institute for Fiscal Studies

Composition of the tightening in 2014–15
© Institute for Fiscal Studies
£ billion (nominal) March 2010 Budget
October 2010 Spending Review
Tax 21.5 29.8Spending 50.9 80.5
Investment spending 17.2 17.0Current spending 33.7 63.5Of which:
Debt interest 7 10Benefits –0.3 17.7Public services 27.0 35.7
Total tightening (£bn) 72.4 110.3% Spending 70 73% Tax 30 27

Latest forecasts
• Measures forecast to offset increase in underlying borrowing seen Budget 2008– deficit to return to pre-crisis levels in 2015–16
• Measures also to return debt to a sustainable path– but constant borrowing beyond 2015–16 would see not debt return to pre-
crisis levels until late 2020s
– if no further tax rises / spending cuts to offset costs of ageing population then debt still sustainable, but may not return to below 40% of national income
• Significant uncertainty remains– if latest forecasts are as accurate as previous ones then 60% chance of
meeting the Government’s fiscal mandate on current policies
– 40% chance that further tax rises or deeper spending cuts required
© Institute for Fiscal Studies

Cure: borrowing back to pre-crisis levels
© Institute for Fiscal Studies
20
07
–0
8
20
08
–0
9
20
09
–1
0
20
10
–1
1
20
11
–1
2
20
12
–1
3
20
13
–1
4
20
14
–1
5
20
15
–1
6
20
16
–1
7
20
17
–1
8
0
2
4
6
8
10
12 Budget 2008Budget June 2010 – no policy changeBudget June 2010
Pe
rce
nta
ge
of
na
tion
al i
nco
me
Sources: Author’s calculations using all Budgets and Pre-Budget Reports since March 2008 (all available at http://www.hm-
treasury.gov.uk/).

Cure: debt sustainable but not back to pre-crisis levels for a generation
© Institute for Fiscal Studies
19
74
–7
5
19
77
–7
8
19
80
–8
1
19
83
–8
4
19
86
–8
7
19
89
–9
0
19
92
–9
3
19
95
–9
6
19
98
–9
9
20
01
–0
2
20
04
–0
5
20
07
–0
8
20
10
–1
1
20
13
–1
4
20
16
–1
7
20
19
–2
0
20
22
–2
3
20
25
–2
6
20
28
–2
9
20
31
–3
2
20
34
–3
5
20
37
–3
8
20
40
–4
1
0
40
80
120
160
200
Budget 2008
Budget June 2010 – no policy action
Budget June 2010
Budget June 2010 – including impact of demographic pressures
Pe
rce
nta
ge
of
na
tion
al i
nco
me
Source: Author’s calculations based on the March 2008 and June 2010 Budget.
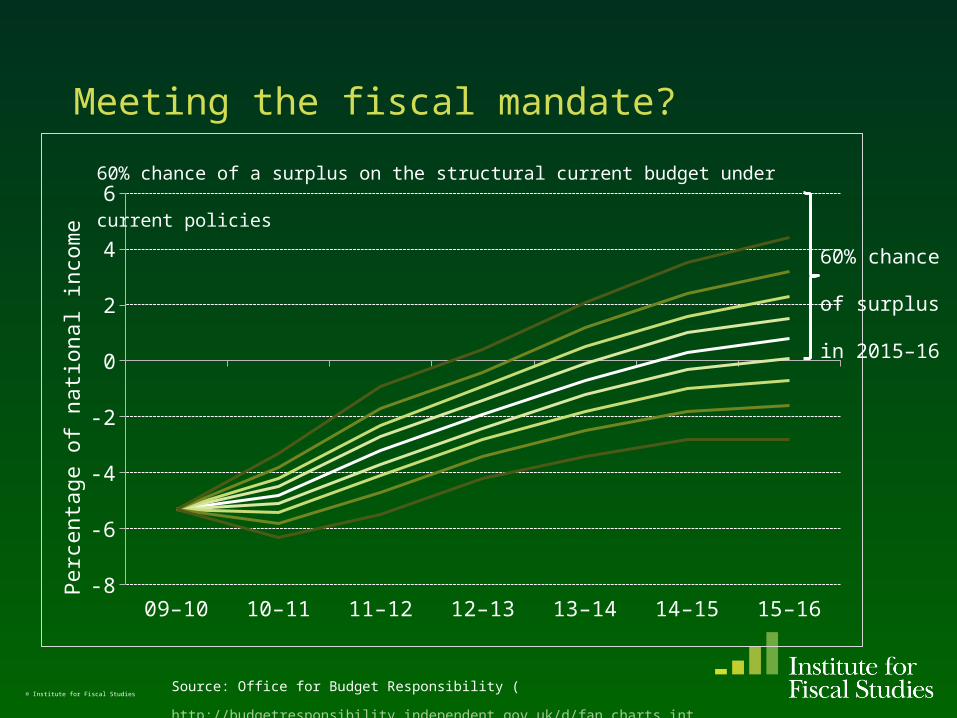
Meeting the fiscal mandate?
© Institute for Fiscal Studies
09–10 10–11 11–12 12–13 13–14 14–15 15–16-8
-6
-4
-2
0
2
4
6
Pe
rce
nta
ge
of
na
tion
al i
nco
me
60% chance of a surplus on the structural current budget under current policies
Source: Office for Budget Responsibility (
http://budgetresponsibility.independent.gov.uk/d/fan_charts_intervals.xls).
60% chance
of surplus
in 2015–16

Tax & spend
• Crisis depressed tax revenues and increased public spending as a share of national income– tax revenues: lower financial sector profits, lower house and equity prices
– public spending: public service spending set in cash terms for three years in 2007 and economy turned out much smaller than expected
• As a share of national income increase in spending greater than the fall in revenues– provides possible rationale for more of the policy response being on
spending than on tax
– aim to return spending to slightly below, and revenues to slightly above, pre-crisis levels
© Institute for Fiscal Studies
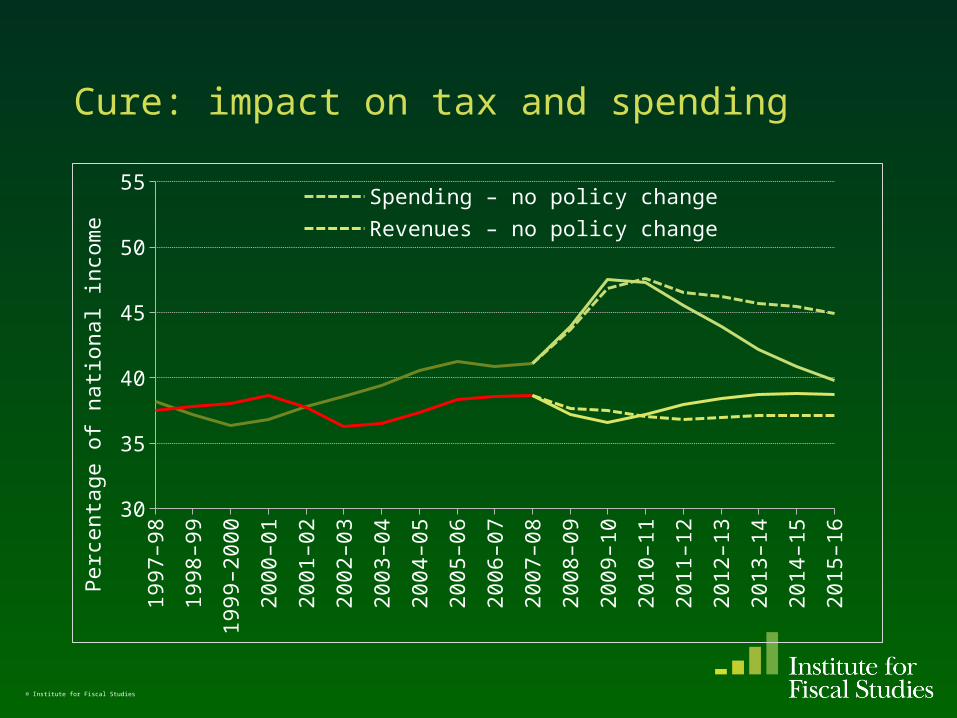
Cure: impact on tax and spending
© Institute for Fiscal Studies
19
97
–9
8
19
98
–9
9
19
99
–2
00
0
20
00
–0
1
20
01
–0
2
20
02
–0
3
20
03
–0
4
20
04
–0
5
20
05
–0
6
20
06
–0
7
20
07
–0
8
20
08
–0
9
20
09
–1
0
20
10
–1
1
20
11
–1
2
20
12
–1
3
20
13
–1
4
20
14
–1
5
20
15
–1
6
30
35
40
45
50
55Spending – no policy change
Revenues – no policy change
Pe
rce
nta
ge
of
na
tion
al i
nco
me

Impact of tax rises and welfare cuts
• Measures reduce net incomes across the income distribution
• Impact regressive across most of the income distribution– with notable exception of the richest the losses are larger among low income
groups than among higher income groups
• Throughout the income distribution pensioners lose, on average, less than families with children
© Institute for Fiscal Studies

Cure: all in this together?
© Institute for Fiscal Studies
Impact of tax & benefit reforms to be in place by 2014–15, by income
Poorest
2 3 4 5 6 7 8 9 Richest
-£4,000
-£3,500
-£3,000
-£2,500
-£2,000
-£1,500
-£1,000
-£500
£0
-8%
-7%
-6%
-5%
-4%
-3%
-2%
-1%
0%
October 2010 Spending ReviewJune 2010 BudgetAnnounced by previous governmentTotal as a % of income (right axis)
Income decile group
Ch
an
ge
in n
et
inco
me

Cure: all in this together?
© Institute for Fiscal Studies
Impact of tax & benefit reforms to be in place by 2014–15, by family type
Poorest
2 3 4 5 6 7 8 9 Richest
-8%
-7%
-6%
-5%
-4%
-3%
-2%
-1%
0%
Families with childrenPensionersOthers
Income decile group
Ch
an
ge
in n
et
inco
me
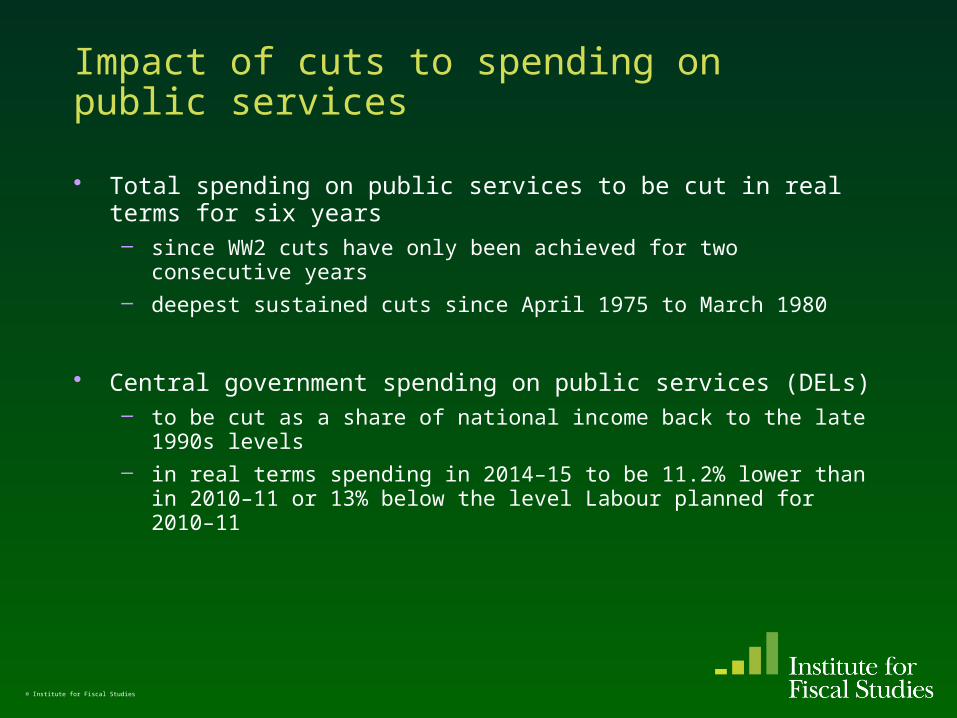
Impact of cuts to spending on public services
• Total spending on public services to be cut in real terms for six years– since WW2 cuts have only been achieved for two consecutive years
– deepest sustained cuts since April 1975 to March 1980
• Central government spending on public services (DELs)– to be cut as a share of national income back to the late 1990s levels
– in real terms spending in 2014–15 to be 11.2% lower than in 2010–11 or 13% below the level Labour planned for 2010–11
© Institute for Fiscal Studies

Cure: public service spending set for a squeeze
© Institute for Fiscal Studies
19
50
–5
1
19
55
–5
6
19
60
–6
1
19
65
–6
6
19
70
–7
1
19
75
–7
6
19
80
–8
1
19
85
–8
6
19
90
–9
1
19
95
–9
6
20
00
–0
1
20
05
–0
6
20
10
–1
1
20
15
–1
6
-10
-5
0
5
10
15
Labour ConLib Historic 6 year moving average
An
nu
al p
erc
en
tag
e r
ea
l in
cre
ase
Note: Figure shows total public spending less spending on welfare benefits and debt
interest.

DELs: The grand old Duke of York?
© Institute for Fiscal Studies
19
98
–9
9
19
99
–2
00
0
20
00
–0
1
20
01
–0
2
20
02
–0
3
20
03
–0
4
20
04
–0
5
20
05
–0
6
20
06
–0
7
20
07
–0
8
20
08
–0
9
20
09
–1
0
20
10
–1
1
20
11
–1
2
20
12
–1
3
20
13
–1
4
20
14
–1
5
10
15
20
25
30October 2010 Spending Review
March 2010 Budget
Pe
rce
nta
ge
of
na
tion
al i
nco
me
Note: Figure shows Departmental Expenditure Limits (DELs) as a share of national income under current policies.

DELs: deep cuts coming
© Institute for Fiscal Studies
2010–11 2011–12 2012–13 2013–14 2014–1580
85
90
95
100
105March 2010 Budget
October 2010 Spending Review
Ind
ex:
La
bo
ur
20
10
–1
1 =
10
0
–11%
–10%
– 13%

Sharing the pain
• Two winners?– spending on international aid and energy & climate change
• Relative protection for NHS and schools?– tightest settlement for NHS spending since early 1950s
– schools spending per pupil to fall in all but most deprived schools
• Several losers?– Home office, Justice, Local Government and Department for Business,
Innovation and Skills all face cuts of around one-quarter
– latter primarily comes from deep cuts to taxpayer support for higher education teaching
• One big loser?– DCLG communities budget to be cut by two-thirds, with capital budgets cut
by three-quarters: public investment in new social housing the big loser
© Institute for Fiscal Studies

‘Winners’
Average DEL cut
Education
Defence
NHS (England)
Work and pensions
Energy and climate change
International development
-20 -10 0 10 20 30 40
-11.2
-10.8
-7.3
0.3
1.4
16.2
34.2
Real budget increase 2011–12 to 2014–15
© Institute for Fiscal Studies
Note: Figures show real change in total (resource + capital) DEL

‘Losers’
CLG Communities
Environment, food and rural affairs
Business, innovation and skills
CLG Local government
Justice
Home office
Culture, media and sport
Transport
Average DEL cut
-80 -70 -60 -50 -40 -30 -20 -10 0
-67.6
-30.9
-28.5
-26.8
-25.3
-25.2
-21.1
-14.6
-11.2
Real budget increase 2011–12 to 2014–15
© Institute for Fiscal Studies
Note: Figures show real change in total (resource + capital) DEL

© Institute for Fiscal Studies
English schools spending
• DfE to receive total real-terms cut in DEL of 10.8%
• Schools spending including pupil premium to grow by 0.1% per year in real-terms (or 0.4% in total)– but total pupil numbers to increase by average of 0.7% per year
– total schools spending per pupil to be cut in real-terms by 0.6% per year (total of 2¼%)
• Assuming flat-rate pupil premium of £2,400 (stated total cost £2.5 billion) and underlying funding per pupil frozen in cash-terms– 60% of primary school pupils in schools where real funding falls
– 87% of secondary school pupils in schools where real funding falls
– 43% of pupils in (less deprived) schools would see cuts of 5% or more
– 1 in 8 pupils in (very deprived) schools would see increase of 5% or more
Note: Assumes all schools experience the same growth in pupil numbers.

Record breakers?
• Real increase over next 4 years– total spending: tightest since World War II
– spending on public services: tightest since April 1975 to March 1980
– NHS: tightest since April 1951 to March 1956
– (ODA: greatest since Jan 2002 to Dec 2006)
© Institute for Fiscal Studies

Conclusions
• Permanent hit to public finances from financial crisis estimated at £86 billion a year (in today’s terms)
• Response is a £98 billion fiscal tightening by 2015–16, comprising a £24 billion tax rise and a £74 billion spending cut (in today’s terms)– OBR estimates 60% chance of hitting fiscal mandate on current policies
• Overall post crisis tax and benefit reforms regressive across most of the income distribution, although very focussed on richest 2%– cuts to welfare payments for working-age individuals
• Four years from next April will be the tightest sustained squeeze to public service spending since April 1976 to March 1980– total DELs cut by 11% in real terms
– overseas aid budget increased sharply
– in England: NHS and schools relatively protected; largest cuts to: Communities and Local Government, DEFRA and BIS
• Would be sensible to review plans in 2012
© Institute for Fiscal Studies
© Institute for Fiscal Studies
Disease and cure in the UK: The fiscal impact of the crisis and the policy response
Slides prepared by Carl Emmerson for SOLACE
November 2010
http://www.ifs.org.uk/projects/346


