Download - 1st Technical Meeting - WP2

Project SLOPE1
WP 2 ndash Forest information collection and analysis
SLOPE WP 2 ndash Task 21
Andrea Masini PhD
Remote sensing and multispectral analysis
Remote Sensing DepartmentFlyby Srl
Task 21 participants
bull CNR
bull Coastway
bull Flyby Srl (Task Leader)
bull TreeMetrics
Task 21 general description
1 Define a methodology to obtain a description of the scenarios using available remote sensing data (From satellite UAV and on ground instrumentation)
2 Define how to realize a more complete forest inventory
AIMs
Flyby Define the approachto monitor tree growth and health in mountainous environment (Eg using different vegetation indexes)
CoastWayTreemetricsDefine the approach to monitor the forest using UAV and on ground sensors
CNRFlybyDefine the approach to fuse heterogeneous information (derived by satellites or other instrumentations)
All task participantsDesign of the architecture for the forest database
Participants Role
GANTT
012014 022014 032014 042014 052014 062014 072014 082014 092014 102014
START of Task 21 activities
1deg Draft deliverable D201 to the partner for contributions
Expected contributions from partners
2deg Draft deliverable D201
DeliverableD201 ready
Before the task start Satellite data acquired on a test area agreed with the task partners
Working on a case study
IRELAND
Rapideye Data available for SLOPE Partners
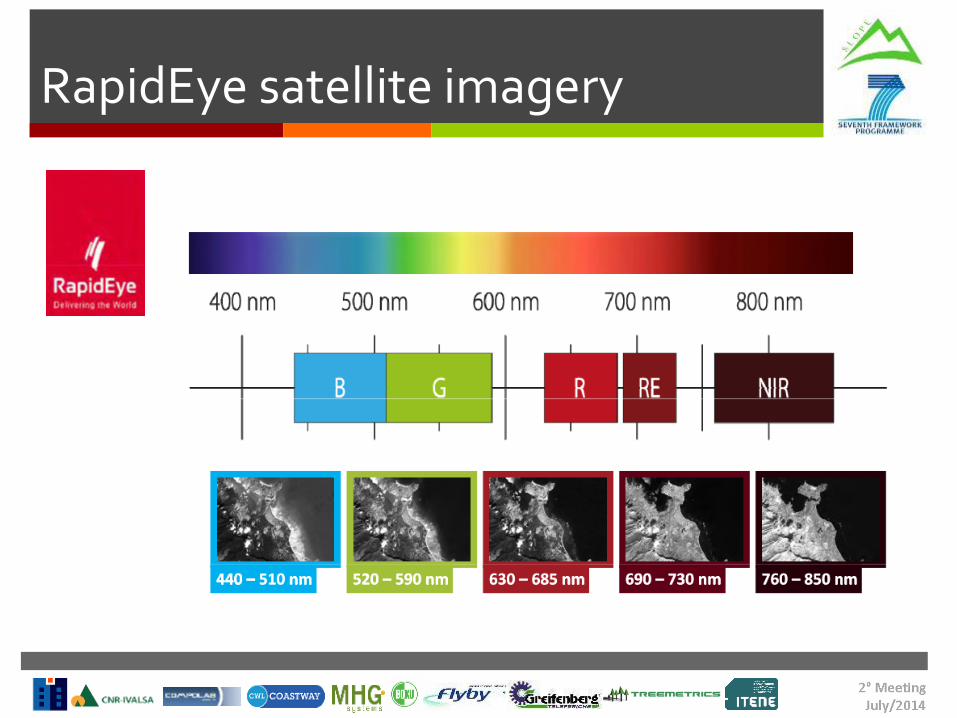
RapidEye satellite imagery
Task 21 expected output
bull Deliverable D201 (month 8 ndash August 2014)
Report on remote sensing data collected on the
methodologies and the algorithm to extract needed
information and on the generated output
1deg DRAFT D201 index
1 General view on remote sensing2 Remote sensing for forests study3 Geological mapping and DEM extraction4 The satellite sensors considered in SLOPE5 The UAV platform considered and its sensors6 On ground remote sensing sensor considered7 METHODOLOGY8 Preliminary results analysis Ireland test case
Chapter 1 General view on remote sensing
2deg Meeting J l 2014
1 General view on remote sensing11 The electromagnetic spectrum12 Sensors
121 Passive sensors122 Active sensors123 Earth Observation satellites
Chapter 2
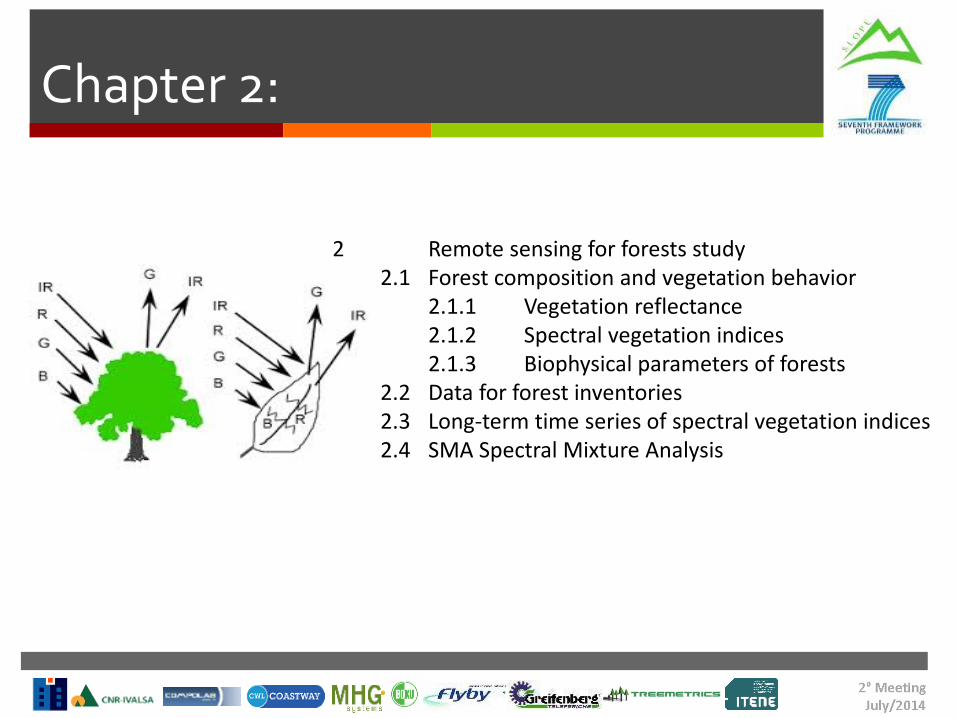
2 Remote sensing for forests study21 Forest composition and vegetation behavior
211 Vegetation reflectance212 Spectral vegetation indices213 Biophysical parameters of forests
22 Data for forest inventories23 Long-term time series of spectral vegetation indices24 SMA Spectral Mixture Analysis
Other chapters are under costruction
METHODOLOGY
Define the type of information
Define how to integrate all available information
Define how to deliver information
Andrea Masini PhDCTOFlyby srlCorso Ferrucci 779 10138 Torino ItalyVia Puini 97 57128 Livorno ItalywwwflybyitTel (+39) 0586-505016Fax (+39) 0586-502770Mobile phone (+39) 393-9976370
Thanks
Identification of Forest plantation on Google Earth
Flight Plan uploaded to Auto Pilot in accordance with
CAA IAA European Aviation Authority Regulations
Data Acquisition and Processing
Data Acquisition and Processing
Data Acquisition and Processing
DEM DTM DCM Crown Sizes Animated views
Cross section created through the combined forest data
Software Used
bull Faro Scane FLS Files
bull Leica Cyclone PTS Files
bull Cloud Compare LAS PTS Files
bull Post Flight Terra 3D
Data Acquisition and Processing
DEM DTM DCM Crown Sizes Animated views
Faro Scene (fls) Emotion 2
Cyclone (pts) Postflight Terra 3d
CloudCompare(LASZ Files)
Data Acquisition amp Processing
Cross section through forest created using point tools software
Lidar Data combined with Aerial point cloud using Cloud Compare
Example of Data to Follow
Example of Survey Control Markers located on site
Coastway ndash UAV and Payloads
96cm wingspan- less than 07kg take-off weight- 16MP camera electronically integrated and controlled- Lithium polymer battery- 50 minutes of flight time- 36-57kmh (10-16ms) cruise speed- Up to 45kmh (12ms) wind resistance- Up to 3km radio link- Covers up to 15-10km2- Linear landing- Image resolution of 3-30cmpixel (depending on flight altitude)
UAV
Transport Case
Payloads
S110 NIR StandardExample applications biomass indication growth monitoring cropdiscrimination leaf area indexingThis customised 12 MP camera is electronically integrated withinthe eBeersquos autopilot The S110 NIR acquires image data in the nearinfrared (NIR) band the region where high plant reflectance occursIts exposure parameters can be set manually and its RAW files arefully supported by the eBee Agrsquos software
The multiSPEC 4C is a cutting-edge sensor unit developed byAirinovrsquos agronomy specialists and customised for the eBee Ag Itcontains four separate 12 megapixel sensors that are electronicallyintegrated within the eBeersquos autopilot These sensors acquire dataacross four highly precise bands plus each sensor features a globalshutter for sharp undistorted images
S110 RGB OptionalExample applications real colour 2D and 3D visual renderingchlorophyll indication drainage evaluationThis customised 12 MP camera is electronically integrated withinthe eBeersquos autopilot The S110 RGB acquires regular image datain the visible spectrum plus its exposure parameters can be setmanually and its RAW files are fully supported by the eBee Agrsquossoftware
If you do one flight with a RGB camera and then another flight with a NIRGB (NearInfrared-Green-Blue) camera you can load both datasets in the software and label them differently (eg RGB and NIRGB) in the initial screen The software will do the initial calibration using geometric information of both datasets and your results will be two orthomosaics matching the band configuration of the original datasets one with an RGB bandset and one with NIRGB bandset To compute a vegetation index you would typically need to combine with a third party software the first band of the NIRGB mosaic together with the two last bands of the RGB mosaic
Development by UAV manufacturer forAgricultural Mapping
Survey-grade aerial mapping
Collect aerial photography to produce orthomosaics amp 3D models with absolute accuracy down to 3 cm - without Ground Control Points The eBee RTK features a built-in L1L2 GNSS receiver This allows it to receive correction data from most leading brands of base station Its 16 MP camera can shoot imagery at a resolution of down to 15 cmpixel These images can then be transformed into orthomosaics amp 3D models with absolute accuracy of down to 3 cm 5 cm ndash without the need for GCPs
Questions
Overall Progress of WP 2
bullEquipment Purchased
bullFlight Manual drafted and passed by the IAA amp CAA
bullStaff Trained and licences updated to allow flights outside of Ireland amp UK (no combined regulation in Europe yet)
bullOn board GPS tested against ground targets results +- 100mm
bullCombined tests carried out with Treemetrics at Gortahile Forest using Laser Scanning amp Aerial imagery
bullFlights carried out with different payloads RGB amp NIR Cameras Multi Spectral available for Trento
bullTest site results will be uploaded to Slope dropbox we need to agree who needs the data and format
bullTest sites identified in Trento and Austria
bullWritten to ENAC ndash Italian Aviation Authority requesting permission to fly
WP2 Tasks Completed Planning Recommendations
bull Trial in Ireland not listed but was critical to provide staff with training and familiarity with equipment
bull Both data collection SMErsquos built a rapour and task force capable of the WP requirements
bull Methodology is now in place and should run smoothly I estimate T12 is 50 complete
bull Planning to carry out tests in Trento last week of July 2014
bull Recommendations
bull Agreement from the forest owners
bull Permission from ENAC is critical
bull Testing on the GPS amp GPRS Service at the test sites is critical
bull Agreement on the data sets file types and deliverables critical prior to commencing
Planning -Test Site Trento

SLOPE WP 2 ndash Task 21
Andrea Masini PhD
Remote sensing and multispectral analysis
Remote Sensing DepartmentFlyby Srl
Task 21 participants
bull CNR
bull Coastway
bull Flyby Srl (Task Leader)
bull TreeMetrics
Task 21 general description
1 Define a methodology to obtain a description of the scenarios using available remote sensing data (From satellite UAV and on ground instrumentation)
2 Define how to realize a more complete forest inventory
AIMs
Flyby Define the approachto monitor tree growth and health in mountainous environment (Eg using different vegetation indexes)
CoastWayTreemetricsDefine the approach to monitor the forest using UAV and on ground sensors
CNRFlybyDefine the approach to fuse heterogeneous information (derived by satellites or other instrumentations)
All task participantsDesign of the architecture for the forest database
Participants Role
GANTT
012014 022014 032014 042014 052014 062014 072014 082014 092014 102014
START of Task 21 activities
1deg Draft deliverable D201 to the partner for contributions
Expected contributions from partners
2deg Draft deliverable D201
DeliverableD201 ready
Before the task start Satellite data acquired on a test area agreed with the task partners
Working on a case study
IRELAND
Rapideye Data available for SLOPE Partners
RapidEye satellite imagery
Task 21 expected output
bull Deliverable D201 (month 8 ndash August 2014)
Report on remote sensing data collected on the
methodologies and the algorithm to extract needed
information and on the generated output
1deg DRAFT D201 index
1 General view on remote sensing2 Remote sensing for forests study3 Geological mapping and DEM extraction4 The satellite sensors considered in SLOPE5 The UAV platform considered and its sensors6 On ground remote sensing sensor considered7 METHODOLOGY8 Preliminary results analysis Ireland test case
Chapter 1 General view on remote sensing
2deg Meeting J l 2014
1 General view on remote sensing11 The electromagnetic spectrum12 Sensors
121 Passive sensors122 Active sensors123 Earth Observation satellites
Chapter 2
2 Remote sensing for forests study21 Forest composition and vegetation behavior
211 Vegetation reflectance212 Spectral vegetation indices213 Biophysical parameters of forests
22 Data for forest inventories23 Long-term time series of spectral vegetation indices24 SMA Spectral Mixture Analysis
Other chapters are under costruction
METHODOLOGY
Define the type of information
Define how to integrate all available information
Define how to deliver information
Andrea Masini PhDCTOFlyby srlCorso Ferrucci 779 10138 Torino ItalyVia Puini 97 57128 Livorno ItalywwwflybyitTel (+39) 0586-505016Fax (+39) 0586-502770Mobile phone (+39) 393-9976370
Thanks
Identification of Forest plantation on Google Earth
Flight Plan uploaded to Auto Pilot in accordance with
CAA IAA European Aviation Authority Regulations
Data Acquisition and Processing
Data Acquisition and Processing
Data Acquisition and Processing
DEM DTM DCM Crown Sizes Animated views
Cross section created through the combined forest data
Software Used
bull Faro Scane FLS Files
bull Leica Cyclone PTS Files
bull Cloud Compare LAS PTS Files
bull Post Flight Terra 3D
Data Acquisition and Processing
DEM DTM DCM Crown Sizes Animated views
Faro Scene (fls) Emotion 2
Cyclone (pts) Postflight Terra 3d
CloudCompare(LASZ Files)
Data Acquisition amp Processing
Cross section through forest created using point tools software
Lidar Data combined with Aerial point cloud using Cloud Compare
Example of Data to Follow
Example of Survey Control Markers located on site
Coastway ndash UAV and Payloads
96cm wingspan- less than 07kg take-off weight- 16MP camera electronically integrated and controlled- Lithium polymer battery- 50 minutes of flight time- 36-57kmh (10-16ms) cruise speed- Up to 45kmh (12ms) wind resistance- Up to 3km radio link- Covers up to 15-10km2- Linear landing- Image resolution of 3-30cmpixel (depending on flight altitude)
UAV
Transport Case
Payloads
S110 NIR StandardExample applications biomass indication growth monitoring cropdiscrimination leaf area indexingThis customised 12 MP camera is electronically integrated withinthe eBeersquos autopilot The S110 NIR acquires image data in the nearinfrared (NIR) band the region where high plant reflectance occursIts exposure parameters can be set manually and its RAW files arefully supported by the eBee Agrsquos software
The multiSPEC 4C is a cutting-edge sensor unit developed byAirinovrsquos agronomy specialists and customised for the eBee Ag Itcontains four separate 12 megapixel sensors that are electronicallyintegrated within the eBeersquos autopilot These sensors acquire dataacross four highly precise bands plus each sensor features a globalshutter for sharp undistorted images
S110 RGB OptionalExample applications real colour 2D and 3D visual renderingchlorophyll indication drainage evaluationThis customised 12 MP camera is electronically integrated withinthe eBeersquos autopilot The S110 RGB acquires regular image datain the visible spectrum plus its exposure parameters can be setmanually and its RAW files are fully supported by the eBee Agrsquossoftware
If you do one flight with a RGB camera and then another flight with a NIRGB (NearInfrared-Green-Blue) camera you can load both datasets in the software and label them differently (eg RGB and NIRGB) in the initial screen The software will do the initial calibration using geometric information of both datasets and your results will be two orthomosaics matching the band configuration of the original datasets one with an RGB bandset and one with NIRGB bandset To compute a vegetation index you would typically need to combine with a third party software the first band of the NIRGB mosaic together with the two last bands of the RGB mosaic
Development by UAV manufacturer forAgricultural Mapping
Survey-grade aerial mapping
Collect aerial photography to produce orthomosaics amp 3D models with absolute accuracy down to 3 cm - without Ground Control Points The eBee RTK features a built-in L1L2 GNSS receiver This allows it to receive correction data from most leading brands of base station Its 16 MP camera can shoot imagery at a resolution of down to 15 cmpixel These images can then be transformed into orthomosaics amp 3D models with absolute accuracy of down to 3 cm 5 cm ndash without the need for GCPs
Questions
Overall Progress of WP 2
bullEquipment Purchased
bullFlight Manual drafted and passed by the IAA amp CAA
bullStaff Trained and licences updated to allow flights outside of Ireland amp UK (no combined regulation in Europe yet)
bullOn board GPS tested against ground targets results +- 100mm
bullCombined tests carried out with Treemetrics at Gortahile Forest using Laser Scanning amp Aerial imagery
bullFlights carried out with different payloads RGB amp NIR Cameras Multi Spectral available for Trento
bullTest site results will be uploaded to Slope dropbox we need to agree who needs the data and format
bullTest sites identified in Trento and Austria
bullWritten to ENAC ndash Italian Aviation Authority requesting permission to fly
WP2 Tasks Completed Planning Recommendations
bull Trial in Ireland not listed but was critical to provide staff with training and familiarity with equipment
bull Both data collection SMErsquos built a rapour and task force capable of the WP requirements
bull Methodology is now in place and should run smoothly I estimate T12 is 50 complete
bull Planning to carry out tests in Trento last week of July 2014
bull Recommendations
bull Agreement from the forest owners
bull Permission from ENAC is critical
bull Testing on the GPS amp GPRS Service at the test sites is critical
bull Agreement on the data sets file types and deliverables critical prior to commencing
Planning -Test Site Trento

Data Acquisition and Processing
Data Acquisition and Processing
Data Acquisition and Processing
DEM DTM DCM Crown Sizes Animated views
Cross section created through the combined forest data
Software Used
bull Faro Scane FLS Files
bull Leica Cyclone PTS Files
bull Cloud Compare LAS PTS Files
bull Post Flight Terra 3D
Data Acquisition and Processing
DEM DTM DCM Crown Sizes Animated views
Faro Scene (fls) Emotion 2
Cyclone (pts) Postflight Terra 3d
CloudCompare(LASZ Files)
Data Acquisition amp Processing
Cross section through forest created using point tools software
Lidar Data combined with Aerial point cloud using Cloud Compare
Example of Data to Follow
Example of Survey Control Markers located on site
Coastway ndash UAV and Payloads
96cm wingspan- less than 07kg take-off weight- 16MP camera electronically integrated and controlled- Lithium polymer battery- 50 minutes of flight time- 36-57kmh (10-16ms) cruise speed- Up to 45kmh (12ms) wind resistance- Up to 3km radio link- Covers up to 15-10km2- Linear landing- Image resolution of 3-30cmpixel (depending on flight altitude)
UAV
Transport Case
Payloads
S110 NIR StandardExample applications biomass indication growth monitoring cropdiscrimination leaf area indexingThis customised 12 MP camera is electronically integrated withinthe eBeersquos autopilot The S110 NIR acquires image data in the nearinfrared (NIR) band the region where high plant reflectance occursIts exposure parameters can be set manually and its RAW files arefully supported by the eBee Agrsquos software
The multiSPEC 4C is a cutting-edge sensor unit developed byAirinovrsquos agronomy specialists and customised for the eBee Ag Itcontains four separate 12 megapixel sensors that are electronicallyintegrated within the eBeersquos autopilot These sensors acquire dataacross four highly precise bands plus each sensor features a globalshutter for sharp undistorted images
S110 RGB OptionalExample applications real colour 2D and 3D visual renderingchlorophyll indication drainage evaluationThis customised 12 MP camera is electronically integrated withinthe eBeersquos autopilot The S110 RGB acquires regular image datain the visible spectrum plus its exposure parameters can be setmanually and its RAW files are fully supported by the eBee Agrsquossoftware
If you do one flight with a RGB camera and then another flight with a NIRGB (NearInfrared-Green-Blue) camera you can load both datasets in the software and label them differently (eg RGB and NIRGB) in the initial screen The software will do the initial calibration using geometric information of both datasets and your results will be two orthomosaics matching the band configuration of the original datasets one with an RGB bandset and one with NIRGB bandset To compute a vegetation index you would typically need to combine with a third party software the first band of the NIRGB mosaic together with the two last bands of the RGB mosaic
Development by UAV manufacturer forAgricultural Mapping
Survey-grade aerial mapping
Collect aerial photography to produce orthomosaics amp 3D models with absolute accuracy down to 3 cm - without Ground Control Points The eBee RTK features a built-in L1L2 GNSS receiver This allows it to receive correction data from most leading brands of base station Its 16 MP camera can shoot imagery at a resolution of down to 15 cmpixel These images can then be transformed into orthomosaics amp 3D models with absolute accuracy of down to 3 cm 5 cm ndash without the need for GCPs
Questions
Overall Progress of WP 2
bullEquipment Purchased
bullFlight Manual drafted and passed by the IAA amp CAA
bullStaff Trained and licences updated to allow flights outside of Ireland amp UK (no combined regulation in Europe yet)
bullOn board GPS tested against ground targets results +- 100mm
bullCombined tests carried out with Treemetrics at Gortahile Forest using Laser Scanning amp Aerial imagery
bullFlights carried out with different payloads RGB amp NIR Cameras Multi Spectral available for Trento
bullTest site results will be uploaded to Slope dropbox we need to agree who needs the data and format
bullTest sites identified in Trento and Austria
bullWritten to ENAC ndash Italian Aviation Authority requesting permission to fly
WP2 Tasks Completed Planning Recommendations
bull Trial in Ireland not listed but was critical to provide staff with training and familiarity with equipment
bull Both data collection SMErsquos built a rapour and task force capable of the WP requirements
bull Methodology is now in place and should run smoothly I estimate T12 is 50 complete
bull Planning to carry out tests in Trento last week of July 2014
bull Recommendations
bull Agreement from the forest owners
bull Permission from ENAC is critical
bull Testing on the GPS amp GPRS Service at the test sites is critical
bull Agreement on the data sets file types and deliverables critical prior to commencing
Planning -Test Site Trento
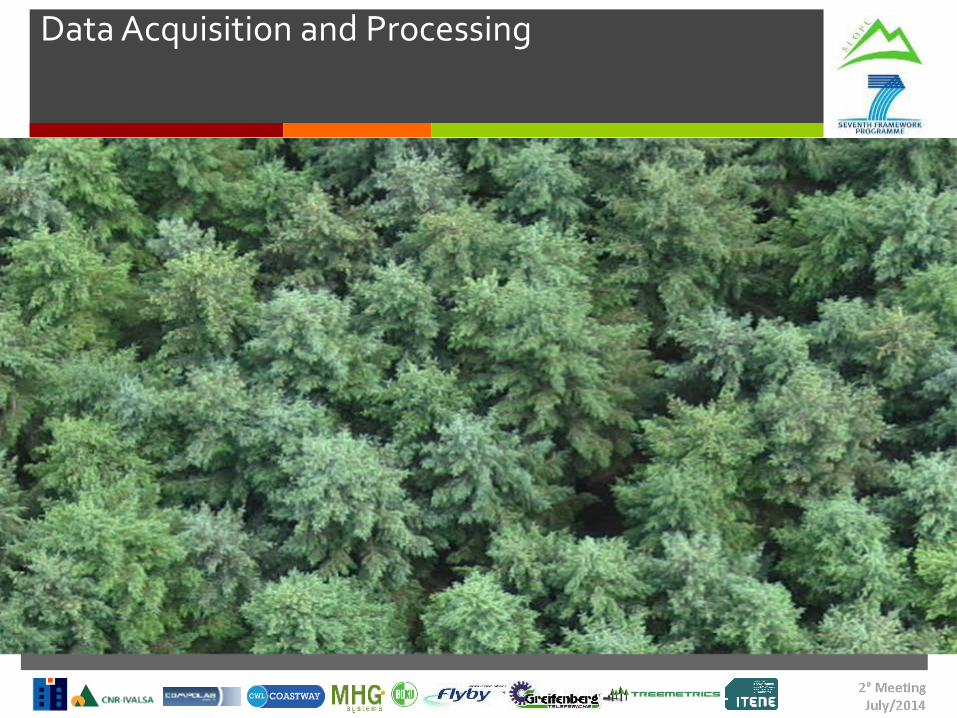
Data Acquisition and Processing
Data Acquisition and Processing
DEM DTM DCM Crown Sizes Animated views
Cross section created through the combined forest data
Software Used
bull Faro Scane FLS Files
bull Leica Cyclone PTS Files
bull Cloud Compare LAS PTS Files
bull Post Flight Terra 3D
Data Acquisition and Processing
DEM DTM DCM Crown Sizes Animated views
Faro Scene (fls) Emotion 2
Cyclone (pts) Postflight Terra 3d
CloudCompare(LASZ Files)
Data Acquisition amp Processing
Cross section through forest created using point tools software
Lidar Data combined with Aerial point cloud using Cloud Compare
Example of Data to Follow
Example of Survey Control Markers located on site
Coastway ndash UAV and Payloads
96cm wingspan- less than 07kg take-off weight- 16MP camera electronically integrated and controlled- Lithium polymer battery- 50 minutes of flight time- 36-57kmh (10-16ms) cruise speed- Up to 45kmh (12ms) wind resistance- Up to 3km radio link- Covers up to 15-10km2- Linear landing- Image resolution of 3-30cmpixel (depending on flight altitude)
UAV
Transport Case
Payloads
S110 NIR StandardExample applications biomass indication growth monitoring cropdiscrimination leaf area indexingThis customised 12 MP camera is electronically integrated withinthe eBeersquos autopilot The S110 NIR acquires image data in the nearinfrared (NIR) band the region where high plant reflectance occursIts exposure parameters can be set manually and its RAW files arefully supported by the eBee Agrsquos software
The multiSPEC 4C is a cutting-edge sensor unit developed byAirinovrsquos agronomy specialists and customised for the eBee Ag Itcontains four separate 12 megapixel sensors that are electronicallyintegrated within the eBeersquos autopilot These sensors acquire dataacross four highly precise bands plus each sensor features a globalshutter for sharp undistorted images
S110 RGB OptionalExample applications real colour 2D and 3D visual renderingchlorophyll indication drainage evaluationThis customised 12 MP camera is electronically integrated withinthe eBeersquos autopilot The S110 RGB acquires regular image datain the visible spectrum plus its exposure parameters can be setmanually and its RAW files are fully supported by the eBee Agrsquossoftware
If you do one flight with a RGB camera and then another flight with a NIRGB (NearInfrared-Green-Blue) camera you can load both datasets in the software and label them differently (eg RGB and NIRGB) in the initial screen The software will do the initial calibration using geometric information of both datasets and your results will be two orthomosaics matching the band configuration of the original datasets one with an RGB bandset and one with NIRGB bandset To compute a vegetation index you would typically need to combine with a third party software the first band of the NIRGB mosaic together with the two last bands of the RGB mosaic
Development by UAV manufacturer forAgricultural Mapping
Survey-grade aerial mapping
Collect aerial photography to produce orthomosaics amp 3D models with absolute accuracy down to 3 cm - without Ground Control Points The eBee RTK features a built-in L1L2 GNSS receiver This allows it to receive correction data from most leading brands of base station Its 16 MP camera can shoot imagery at a resolution of down to 15 cmpixel These images can then be transformed into orthomosaics amp 3D models with absolute accuracy of down to 3 cm 5 cm ndash without the need for GCPs
Questions
Overall Progress of WP 2
bullEquipment Purchased
bullFlight Manual drafted and passed by the IAA amp CAA
bullStaff Trained and licences updated to allow flights outside of Ireland amp UK (no combined regulation in Europe yet)
bullOn board GPS tested against ground targets results +- 100mm
bullCombined tests carried out with Treemetrics at Gortahile Forest using Laser Scanning amp Aerial imagery
bullFlights carried out with different payloads RGB amp NIR Cameras Multi Spectral available for Trento
bullTest site results will be uploaded to Slope dropbox we need to agree who needs the data and format
bullTest sites identified in Trento and Austria
bullWritten to ENAC ndash Italian Aviation Authority requesting permission to fly
WP2 Tasks Completed Planning Recommendations
bull Trial in Ireland not listed but was critical to provide staff with training and familiarity with equipment
bull Both data collection SMErsquos built a rapour and task force capable of the WP requirements
bull Methodology is now in place and should run smoothly I estimate T12 is 50 complete
bull Planning to carry out tests in Trento last week of July 2014
bull Recommendations
bull Agreement from the forest owners
bull Permission from ENAC is critical
bull Testing on the GPS amp GPRS Service at the test sites is critical
bull Agreement on the data sets file types and deliverables critical prior to commencing
Planning -Test Site Trento

Data Acquisition and Processing
DEM DTM DCM Crown Sizes Animated views
Faro Scene (fls) Emotion 2
Cyclone (pts) Postflight Terra 3d
CloudCompare(LASZ Files)
Data Acquisition amp Processing
Cross section through forest created using point tools software
Lidar Data combined with Aerial point cloud using Cloud Compare
Example of Data to Follow
Example of Survey Control Markers located on site
Coastway ndash UAV and Payloads
96cm wingspan- less than 07kg take-off weight- 16MP camera electronically integrated and controlled- Lithium polymer battery- 50 minutes of flight time- 36-57kmh (10-16ms) cruise speed- Up to 45kmh (12ms) wind resistance- Up to 3km radio link- Covers up to 15-10km2- Linear landing- Image resolution of 3-30cmpixel (depending on flight altitude)
UAV
Transport Case
Payloads
S110 NIR StandardExample applications biomass indication growth monitoring cropdiscrimination leaf area indexingThis customised 12 MP camera is electronically integrated withinthe eBeersquos autopilot The S110 NIR acquires image data in the nearinfrared (NIR) band the region where high plant reflectance occursIts exposure parameters can be set manually and its RAW files arefully supported by the eBee Agrsquos software
The multiSPEC 4C is a cutting-edge sensor unit developed byAirinovrsquos agronomy specialists and customised for the eBee Ag Itcontains four separate 12 megapixel sensors that are electronicallyintegrated within the eBeersquos autopilot These sensors acquire dataacross four highly precise bands plus each sensor features a globalshutter for sharp undistorted images
S110 RGB OptionalExample applications real colour 2D and 3D visual renderingchlorophyll indication drainage evaluationThis customised 12 MP camera is electronically integrated withinthe eBeersquos autopilot The S110 RGB acquires regular image datain the visible spectrum plus its exposure parameters can be setmanually and its RAW files are fully supported by the eBee Agrsquossoftware
If you do one flight with a RGB camera and then another flight with a NIRGB (NearInfrared-Green-Blue) camera you can load both datasets in the software and label them differently (eg RGB and NIRGB) in the initial screen The software will do the initial calibration using geometric information of both datasets and your results will be two orthomosaics matching the band configuration of the original datasets one with an RGB bandset and one with NIRGB bandset To compute a vegetation index you would typically need to combine with a third party software the first band of the NIRGB mosaic together with the two last bands of the RGB mosaic
Development by UAV manufacturer forAgricultural Mapping
Survey-grade aerial mapping
Collect aerial photography to produce orthomosaics amp 3D models with absolute accuracy down to 3 cm - without Ground Control Points The eBee RTK features a built-in L1L2 GNSS receiver This allows it to receive correction data from most leading brands of base station Its 16 MP camera can shoot imagery at a resolution of down to 15 cmpixel These images can then be transformed into orthomosaics amp 3D models with absolute accuracy of down to 3 cm 5 cm ndash without the need for GCPs
Questions
Overall Progress of WP 2
bullEquipment Purchased
bullFlight Manual drafted and passed by the IAA amp CAA
bullStaff Trained and licences updated to allow flights outside of Ireland amp UK (no combined regulation in Europe yet)
bullOn board GPS tested against ground targets results +- 100mm
bullCombined tests carried out with Treemetrics at Gortahile Forest using Laser Scanning amp Aerial imagery
bullFlights carried out with different payloads RGB amp NIR Cameras Multi Spectral available for Trento
bullTest site results will be uploaded to Slope dropbox we need to agree who needs the data and format
bullTest sites identified in Trento and Austria
bullWritten to ENAC ndash Italian Aviation Authority requesting permission to fly
WP2 Tasks Completed Planning Recommendations
bull Trial in Ireland not listed but was critical to provide staff with training and familiarity with equipment
bull Both data collection SMErsquos built a rapour and task force capable of the WP requirements
bull Methodology is now in place and should run smoothly I estimate T12 is 50 complete
bull Planning to carry out tests in Trento last week of July 2014
bull Recommendations
bull Agreement from the forest owners
bull Permission from ENAC is critical
bull Testing on the GPS amp GPRS Service at the test sites is critical
bull Agreement on the data sets file types and deliverables critical prior to commencing
Planning -Test Site Trento
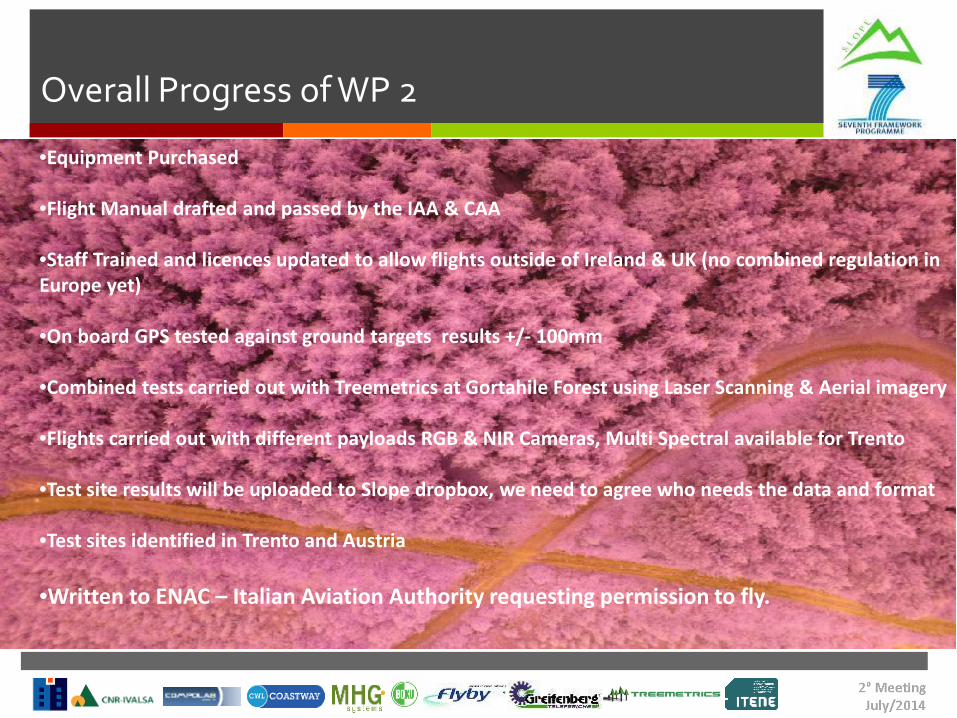

Planning -Test Site Trento

Test Site Flight Plan - Trento
Trento Test Site UAV Launch and Landing Sites
Presentation of Tasks Completed ndash Integration WP22
Separation of Point Cloud to aid creation of DEM by classifying ground data from canopy data
Presentation of Tasks Completed ndash Integration WP22
Separate the DTM from the Point data enables modelling of the trees
Tasks Completed ndash Data collection
A combination of the InfraredRGB and Lidar point cloud data enables the creation of a 3D model of the Forest
Ongoing Tasks
On going refinement of Methodology of data collection
Communications with Slope Partners
Communications with European Aviation Authorities
Logistics flight planning and team on the ground
Refinement of canopy and forest modelling
Dissemination of data amp reporting on achievements
Developing semi automated system viewing trends in the industry
Viewing the market place and uses for the Slope product
TreeMetrics
ldquoPROVIDE MORE END PRODUCT FROM LESS TREESrdquo
The Products
14cm
7cm
14cm
7cm
14cm
7cm
14cm
7cm
14cm
7cm
14cm
7cm
14cm
7cm
14cm
7cm
14cm
16cm
7cm7cmPulp
7cmPulpPulp M3
Large Sawlog M3
Small Sawlog M3
bull Taper Variationbull Straightnessbull Branchingbull Rot etc
The Products General Values
14cm
7cm
14cm
7cm
14cm
7cm
14cm
7cm
14cm
7cm
14cm
7cm
14cm
7cm
14cm
7cm
14cm
16cm
7cm7cmPulp
7cmPulpPulp = euro20 per M3
Large Sawlog = euro60 per M3
Small Sawlog = euro40 per M3
The Problem - ldquoThe Collision of Interestsrdquo
14cm
7cm
14cm
7cm
14cm
7cm
14cm
7cm
14cm
7cm
14cm
7cm
14cm
7cm
14cm
7cm
14cm
16cm
7cm7cmPulp
7cmPulpPulp M3
Large Sawlog M3
Small Sawlog M3
Maximise Value
14cm
7cm
14cm
7cm
14cm
7cm
14cm
7cm
14cm
7cm
14cm
7cm
14cm
7cm
14cm
7cm
14cm
16cm
7cm7cmPulp
7cmPulpPulp M3
Large Sawlog M3
Small Sawlog M3
Maximise Value Sawlog Lengths
14cm
7cm
14cm
7cm
14cm
7cm
14cm
7cm
14cm
7cm
14cm
7cm
14cm
7cm
14cm
7cm
14cm
16cm
7cm7cmPulp
7cmPulpPulp M3
Large Sawlog M3
Small Sawlog M3
37mOption 1
Maximise Value Sawlog Lengths
14cm
7cm
14cm
7cm
14cm
7cm
14cm
7cm
14cm
7cm
14cm
7cm
14cm
7cm
14cm
7cm
14cm
16cm
7cm7cmPulp
7cmPulpPulp M3
Large Sawlog M3
Small Sawlog M3
37mOption 1
Maximise Value Sawlog Lengths
14cm
7cm
14cm
7cm
14cm
7cm
14cm
7cm
14cm
7cm
14cm
7cm
14cm
7cm
14cm
7cm
14cm
16cm
7cm7cmPulp
7cmPulpPulp M3
Large Sawlog M3
Small Sawlog M3
43mOption 2
Maximise Value Sawlog Lengths
14cm
7cm
14cm
7cm
14cm
7cm
14cm
7cm
14cm
7cm
14cm
7cm
14cm
7cm
14cm
7cm
14cm
16cm
7cm7cmPulp
7cmPulpPulp M3
Large Sawlog M3
Small Sawlog M3
43mOption 2
Maximise Value Sawlog Lengths
14cm
7cm
14cm
7cm
14cm
7cm
14cm
7cm
14cm
7cm
14cm
7cm
14cm
7cm
14cm
7cm
14cm
16cm
7cm7cmPulp
7cmPulpPulp M3
Large Sawlog M3
Small Sawlog M3
49mOption 3
Maximise Value Sawlog Lengths
14cm
7cm
14cm
7cm
14cm
7cm
14cm
7cm
14cm
7cm
14cm
7cm
14cm
7cm
14cm
7cm
14cm
16cm
7cm7cmPulp
7cmPulpPulp M3
Large Sawlog M3
Small Sawlog M3
49mOption 3
Harvester Optimisation
Log Quality Straightness (Sweep) Taper Branching Rot
Our Offering
Forest Mapper - First In The World ndash Online Forest Mapping amp Analysis - Data Management System
Forest Mapper Automated net area calculation stratification and Location for ground sample plots to be collected
Sample Plots
Net Area
Stratification
(Inventory Planning)
Supporting different field data collection tools GPS Calipers Vertex
Terrestrial Laser Scanning Forest Measurement System(AutoStem Forest)
Automated 3D Forest Measurement System
Trusted and Independent Data
Output From Field Survey
bull XYZ Position of each treebull Measurement Informationbull Speciesbull Other information
ndash Defectsndash etc
Forest Valuation Online Data
Current Forest Value
Mobile Field Survey App ndash Report Sharing -Interconnectivity
Latest Development
bull Online Market Placebull 15000 forest ownersbull Irish Farmers Association
Task 24 - 3D Modelling for harvesting planning
bull Objectives
bull Scheduling
bull Participants and roles
bull Overview and timeline
Outlook
Objectives
Task 24 Goal To generate and make accessible a detailedinteractive 3D model of the forest environment
The WPrsquos purpose is to develop methodologies and tools to fully describe terrain and stand characteristics in order to evaluate the accessibility for and efficiency of harvestingtechnologies in mountain forests
Scheduling
Start Month 7End Month 15Deliverable Harvest simulation tool based on 3D forest modelTotal MM 20Task leader GRAPHITECHParticipants CNR KESLA COAST BOKU GRE FLY TRE
Participants role
GRAPHITECH(10) Task Leader It has in charge the development of tool for representing the virtual 3D environment of the mountain forest as well as the of the virtual system on mobile and machine-mounted displays Finally it will be involved into the developmet of the solution for interactive cableway positioning
CNR(1) Definition of the ldquotechnology layersrdquo (ie harvest parameters) and methodologies to coordinate tree marking with the subsequent harvesting operations
KESLA(1) Acting as final user in order to simulate the behaivor of own machine into the virtual system
COAST(2) Provide the input model for the virtual system combining the information of task 21 22 and 23
Participants role
BOKU(2) it will be involved into definition of the ldquotechnology layersrdquo (ie harvestparameters) then on the developmet of the solution for interactive cablewaypositioning
GRE(1) Acting as final user in order to simulate the behaivor of own machine into the virtual system
FLY(1) Provide the input model for the virtual system combining the information of task 21 22 and 23
TRE(2) Development of the Forest WarehouseTM for mountain forestry and support the deployment of the virtual system
Functions
bull Forestry measurements estimationsThe platform will allow the combination of accurate tree profile information with up to date remote sensing data
bull Interactive system for cableway positioning simulation
bull Definition of the ldquotechnology layersrdquo (ie harvest parameters)Technological layers show technical limitations of machines and
equipment on different forest areas
bull Deployment of the virtual system on mobile and machine-mounted displays
Two levels of abstraction
1St Level 2D map accessingof forest and logisticinformation inlcudingCadastral Volume of timber accessibility
Where available the systemallow access to the SLOPE information system
Two levels of abstraction
2nd Level 3D map accessingof forest tree by tree featuresallowing interaction and simulation of cable cranepositioning
Timeline
Defining the first version of the 3D forest model Partner involved (TRE COAST FLY)
Interface to access to the FIS database including OGC services both for 2D and 3D (Task 51+BOKU)
Cable Crane simulation tool (GRE)
Final version
Platform Core
Using the remote data (Satellite UAVs orthophotos and digital surface model) combinedwith on field information (TLS) each single tree feature will be segmented including itsdeducted geometric properties
Task 21
Task 22
Task 23
3D forest modelVirtual 3D
environment
Platform CoreCanopy surface model Laser scanner point cloud Aerial amp satellite images
3D Modelling for harvesting planning
What Technologiy for 3D forest modelling
Realistic rendering Parametric model Point cloud visualization
3D Visualization Technologies
Approachesbull Desktop Visualization Platform
with Mobile Portingbull Web-Client Visualization
Platform
Desktop Platformbull Open-Source Library for 3d
visualization (OpenInventor Vtk Openscenegraph)
bull 3d Engine ( UdK IrrichlichtEngine Unity 3d)
Technologies
Web Client bull WebGL implementation of
OpenGL ES 20 for web programmable in JavaScript
bull Java Applet based on OpensourceGlobe Nasa World wind Cesioum
Actions
- Parallel session on WP2 tomorrow
- bi-weekly Skypewebex session
- Dedicated folder on consortium dropbox to share documentation
- Ftp area to exchange large testing datasets
Thank you for your attention
DR FEDERICO PRANDI
Federicoprandigraphitechit
Fondazione GraphitechVia Alla Cascata 56C38123 Trento (ITALY)
Phone +39 0461283394Fax +39 0461283398
Project SLOPE79
T 25 ndash Road and Logistic planning
Mikkeli 2nd-4th July 2014
1 Task objectives80
Task objectives
Build and validate and Optimization model to decide on optimal logistic network in a given forest area This means to calculate locations for buffer areas mills and processing plants routes and flows between nodes according to a forecast demand
Build and validate a Model to estimate traffic on individual sections for road maintenance and construction purposes in this forest area according to a forecasted demand
Grumes in Trento has been chosen as forest area for testing the models
To be developed from M8 (August 14) to M13 (January 15)
Includes development of ldquoD205 Road and logistic simulation modulerdquo
Due to Month 13
Partners involved
ITENE (leader) GRAPHITECH CNR BOKU FLY
2 Approaches for sites location and flow allocation decisions
81
The goal is to determine an optimal (minimum cost) forest logistic network to respond future demands
The approach should determine Location of facilities (normally from a set of posible sites) Size and capacity of facilities (storage areas and processing sites) Volume to harvest in every landing and stand area Volume of timber to transport from landings to facilities (it gives a first
estimation of road traffic for road planning) Routes to connect nodes
2 Approaches for sites location and flow allocation decisions
82
The model should consider inputs like
Forecast of future demand of timber Geographic characteristics of the area (Map distances slopes available
areas sizes coordinates hellip) Actual roads from forest to mills (forest accessibility) Map type hellip Amount and quality of available timber Possible location of millsbiomass areas and distance to the forest
(coordinates size) Dimension of the logs needed Individual costs related to transport infrastructures costs and others like
clearing meadows or watersides artificial anchors locking public roads
2 Approaches for sites location and flow allocation decisions
83
StandCable ways
forestlanes
2 Approaches for sites location and flow allocation decisions
84
minorroad
mainroad
land
land
land
stand
stand
stand
2 Approaches for sites location and flow allocation decisions
85
Solution flow
Possible flow
lands in forest storage and facilities (saw mills biomass)
2 Approaches for sites location and flow allocation decisions
86
Location of a single facility by center-of-gravity method Output XY coordinates for the facility Optimization based only on distances Binary model (source-sink) Useful for a first estimation of a facility location
to be supplied from specific lands
2 Approaches for sites location and flow allocation decisions
87
Location of selected number of facilities by the exact center-of-gravity method Output XY coordinates of a selected number
of facilities Optimization based only on distances Binary model (source-sink) Useful for a first estimation of 2 or more
facility locations to be supplied from specific lands
2 Approaches for sites location and flow allocation decisions
88
P-median multiple facility location Output selected facilities from a list of
candidate sites receiving flows from other sites Optimization based on transport costs and fix
costs but lack of capacity constrains and other inventory costs
Binary model (source-sink) Useful for a first estimation of 2 or more facility
locations to be supplied from specific lands
2 Approaches for sites location and flow allocation decisions
89
Mixed integer linear programming problem Output selected facilities and optimal flows
between nodes Optimization based on transport costs and fix
costs capacity constrains and inventory costs Three stages model More appropriate approach for a network with
more than 2 node types
lands in forest storage and facilities(saw mills biomass)
2 Approaches for sites location and flow allocation decisions
90
Dynamic linear programming Consider changing demand Output
Selected facilities Size an capacity of facilities (storage and processing sites) Volume of harvest in every landing and stand aacuterea Volume to transport
Timber from landings to facilities Product from facilities to demand sites
Decision to expand production capacity in a specific period in the planning horizon
Minimize total costs for timber supply and transport investment and operational costs product transport cost to demand sites fixed cost for capacity expansion
- 200 400 600 800
1000 1200
1 2 3 4 5 6 7
Period Demand Volume
lands in forest storage and facilities(saw mills biomass)
2 Approaches for sites location and flow allocation decisions
91
Previous Work
Facilities Location Models An Application for the Forest Production and Logistics
JUAN TRONCOSO T 1 RODRIGO GARRIDO H 2 XIMENA IBACACHE J 3
July 2002
1 Departamento de Ciencias Forestales Pontificia Universidad Catoacutelica de Chile Casilla 305 Correo 22 Santiago Chile E-mail jtroncotpuccl
2 Departamento de Ingenieriacutea de Transporte Pontificia Universidad Catoacutelica de Chile3 Escuela de Ingenieriacutea Forestal Universidad Mayor
2 Approaches for sites location and flow allocation decisions
92
INPUTS Demands of product per each period and type of quality from demand site
DATA COLLECTION FOR THE MODEL Positions of stands lands storage areas processing sites (saw paper mills and
biomass heating and power plants) demand sites Volume available to harvest in every stand per quality of timber and destination (saw
mill or energy) Position for stand respect existing roads Slope or grade of difficulty to access Capacity of ground to support specific machinery Size and availability of skyline deployment sites Capacity and location of storage areas and buffers and processing sites Characteristics of processing sites and conversion facilities Distances between different nodes
2 Approaches for sites location and flow allocation decisions
93
COST FACTORS supply and transport operational costs final product transport cost to demand sites fixed cost for capacity expansion during the planning horizon investment associated to construction of a new site
OUTPUT Selected facilities Size an capacity of facilities (storage and processing sites) Volume of harvest in every landing and stand aacuterea Volume to transport
Timber from landings to facilities
Product from facilities to demand sites
Decision to expand production capacity in a specific period in the planning horizon
3 Approaches to estimate traffic in existing roads
94
Once the different sites and locations have been selected and flows between sites have been determined for each future period
A Logistics Resource Planning Model will be used to determine the volume to harvest in every period in every land processing and transport means and a more precise estimation of traffic in every individual sections of road in terms of number of trip per vehicles type (size weight) in each period
This traffic estimation will allow to define plans for road maintenance and construction in the forest area taking into account the capability of roads to accept trucks and cranes of different weights and sizes
3 Approaches to estimate traffic in existing roads
95
Similarities to DRP method
Land 1
SITE Saw PlantX
City 1
Product demandHarvest orders
Land 2 City 2
3 Approaches to estimate traffic in existing roads
96
SITE Saw Plant X Minumum Batch (harvest) (m3period) 500 Lead time (number of periods) 1 Safety stock (m3) 200
Period 1 2 3 4 5 6 7 Demand Volume (m3) 400 500 600 1000 500 600 1000 Available Stock (m3) 700 300 300 200 200 200 100 100 Harvest recepcion (m3) - 500 500 1000 500 500 1000 Harvest order launch (m3) 500 500 1000 500 500 1000
Land 1 To harvest (m3) 500 500 1000 Available m3 in land 1 2000 1500 1000 -Size of vehicle (m3) 10 Number of vehicle trips size 10m3 50 50 100
land 2 To harvest (m3) - - - 500 500 1000 -Available m3 in land 1 3000 2500 2000 1000 1000 Size of vehicle (m3) 10 Number of vehicle trips size 10m3 50 50 100 -
97
4 Work done so far
1st virtual meeting (webex conference)ndash 16062014
Attendants Daniele and Giulio (GRAPHITEC) Gianni (CNR) Marco (FLYBY) Martin (BOKU) Patricia Emilio and Loli (ITENE)
Agenda Task 25 objectives description of subtasks and partner roles Decision on forest area as test scenario (Grumes Trento has been decided as test
forest area) Next steps and dates
98
4 Work done so far
Discussion tomorrow in the T25 technical session
Collect general info of Grumes forest area Map with locations and roads available characteristics facilities actors (owners) hellip
Review planning models used in the literature Identify and organize detailed Grumes forest data collection for
models
5 Work plan99
Choose a test scenario Done (Grumes Trento)
Collect general info of Grumes forest area Map with locations and roads available characteristics facilities owners willing to show interest give data demand scenario hellip (GRAPHITEC amp CNR) DEADLINE 15 JULY 2014
Review network opt models (BOKU) and traffic estimation models (CNR) used in the literature (CNR BOKUITENE) Conclusion Report DEADLINE 15 AUGUST 2014
Formulatedesign a Network optimization model for logistics site location and flow allocation decisions (BOKU) DEADLINE 30 SEPTEMBER 2014
Formulatedesign model to estimate traffic in existing roads (CNR) DEADLINE 30 SEPTEMBER 2014
Collect detailed Grumes forest data for models Costs model elements etc (ITENE GRAPHITEC CNR FLYBY) DEADLINE 31ST OCTOBER 2014
Data Elements integration with the global forest model (ITENE) DEADLINE 31ST OCTOBER 2014
Program the Optimization model to allocate landings with the mills and plants and traffic calculation on individual sections (BOKU) DEADLINE 14TH NOVEMBER 2014
Program the model for road planning based on the amount of timber to be transported and identification of traffic on existing forest infrastructure (BOKU) DEADLINE 28TH NOVEMBER 2014
Validate models and run a scenario simulation with demand data (BOKU) DEADLINE 19TH DECEMBER 2014
6 Contact info100
Emilio Gonzalez egonzalezitenecom
Patricia Bellver pbellveritenecom
- Project SLOPE
- SLOPE WP 2 ndash Task 21
- Task 21 participants
- Task 21 general description
- GANTT
- Working on a case study
- RapidEye satellite imagery
- Task 21 expected output
- 1deg DRAFT D201 index
- Chapter 1 General view on remote sensing
- Chapter 2
- Other chapters are under costruction
- METHODOLOGY
- Slide Number 14
- Identification of Forest plantation on Google Earth
- Flight Plan uploaded to Auto Pilot in accordance with CAA IAA European Aviation Authority Regulations
- Data Acquisition and Processing
- Data Acquisition and Processing
- Data Acquisition and Processing DEM DTM DCM Crown Sizes Animated views
- Data Acquisition and Processing DEM DTM DCM Crown Sizes Animated views
- Data Acquisition amp Processing
- Example of Data to Follow
- Coastway ndash UAV and Payloads
- UAV
- Transport Case
- Payloads
- Slide Number 27
- Development by UAV manufacturer forAgricultural Mapping
- Questions
- Overall Progress of WP 2
- WP2 Tasks Completed Planning Recommendations
- Planning -Test Site Trento
- Test Site Flight Plan - Trento
- Trento Test Site UAV Launch and Landing Sites
- Presentation of Tasks Completed ndash Integration WP22
- Presentation of Tasks Completed ndash Integration WP22
- Tasks Completed ndash Data collection
- Ongoing Tasks
- TreeMetricsldquoPROVIDE MORE END PRODUCT FROM LESS TREESrdquo
- The Products
- The Products General Values
- The Problem - ldquoThe Collision of Interestsrdquo
- Maximise Value
- Maximise Value Sawlog Lengths
- Maximise Value Sawlog Lengths
- Maximise Value Sawlog Lengths
- Maximise Value Sawlog Lengths
- Maximise Value Sawlog Lengths
- Maximise Value Sawlog Lengths
- Harvester Optimisation
- Log Quality Straightness (Sweep) Taper Branching Rot
- Our Offering
- Slide Number 53
- Slide Number 54
- Slide Number 55
- Terrestrial Laser Scanning Forest Measurement System (AutoStem Forest)
- Slide Number 57
- Output From Field Survey
- Forest Valuation Online Data
- Current Forest Value
- Slide Number 61
- Latest Development
- Slide Number 63
- Outlook
- Objectives
- Scheduling
- Participants role
- Participants role
- Functions
- Two levels of abstraction
- Two levels of abstraction
- Timeline
- Platform Core
- Platform Core
- 3D Modelling for harvesting planning
- 3D Visualization Technologies
- Actions
- Thank you for your attention
- Project SLOPE
- 1 Task objectives
- 2 Approaches for sites location and flow allocation decisions
- 2 Approaches for sites location and flow allocation decisions
- 2 Approaches for sites location and flow allocation decisions
- 2 Approaches for sites location and flow allocation decisions
- 2 Approaches for sites location and flow allocation decisions
- 2 Approaches for sites location and flow allocation decisions
- 2 Approaches for sites location and flow allocation decisions
- 2 Approaches for sites location and flow allocation decisions
- 2 Approaches for sites location and flow allocation decisions
- 2 Approaches for sites location and flow allocation decisions
- 2 Approaches for sites location and flow allocation decisions
- 2 Approaches for sites location and flow allocation decisions
- 2 Approaches for sites location and flow allocation decisions
- 3 Approaches to estimate traffic in existing roads
- 3 Approaches to estimate traffic in existing roads
- 3 Approaches to estimate traffic in existing roads
- 4 Work done so far
- 4 Work done so far
- 5 Work plan
- 6 Contact info
-
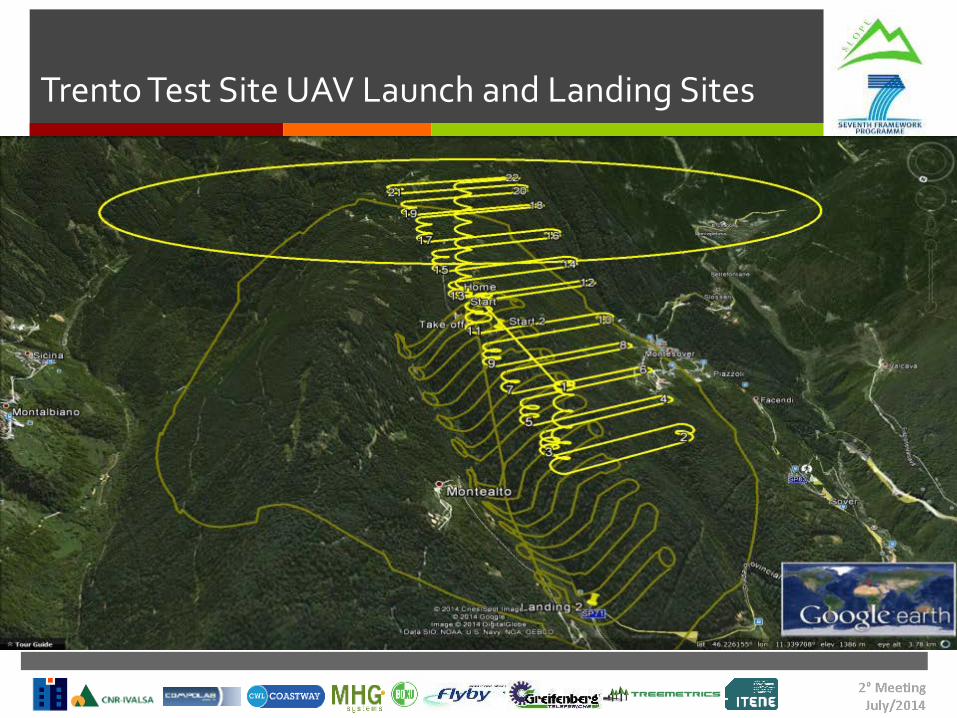

Presentation of Tasks Completed ndash Integration WP22
Separate the DTM from the Point data enables modelling of the trees
Tasks Completed ndash Data collection
A combination of the InfraredRGB and Lidar point cloud data enables the creation of a 3D model of the Forest
Ongoing Tasks
On going refinement of Methodology of data collection
Communications with Slope Partners
Communications with European Aviation Authorities
Logistics flight planning and team on the ground
Refinement of canopy and forest modelling
Dissemination of data amp reporting on achievements
Developing semi automated system viewing trends in the industry
Viewing the market place and uses for the Slope product
TreeMetrics
ldquoPROVIDE MORE END PRODUCT FROM LESS TREESrdquo
The Products
14cm
7cm
14cm
7cm
14cm
7cm
14cm
7cm
14cm
7cm
14cm
7cm
14cm
7cm
14cm
7cm
14cm
16cm
7cm7cmPulp
7cmPulpPulp M3
Large Sawlog M3
Small Sawlog M3
bull Taper Variationbull Straightnessbull Branchingbull Rot etc
The Products General Values
14cm
7cm
14cm
7cm
14cm
7cm
14cm
7cm
14cm
7cm
14cm
7cm
14cm
7cm
14cm
7cm
14cm
16cm
7cm7cmPulp
7cmPulpPulp = euro20 per M3
Large Sawlog = euro60 per M3
Small Sawlog = euro40 per M3
The Problem - ldquoThe Collision of Interestsrdquo
14cm
7cm
14cm
7cm
14cm
7cm
14cm
7cm
14cm
7cm
14cm
7cm
14cm
7cm
14cm
7cm
14cm
16cm
7cm7cmPulp
7cmPulpPulp M3
Large Sawlog M3
Small Sawlog M3
Maximise Value
14cm
7cm
14cm
7cm
14cm
7cm
14cm
7cm
14cm
7cm
14cm
7cm
14cm
7cm
14cm
7cm
14cm
16cm
7cm7cmPulp
7cmPulpPulp M3
Large Sawlog M3
Small Sawlog M3
Maximise Value Sawlog Lengths
14cm
7cm
14cm
7cm
14cm
7cm
14cm
7cm
14cm
7cm
14cm
7cm
14cm
7cm
14cm
7cm
14cm
16cm
7cm7cmPulp
7cmPulpPulp M3
Large Sawlog M3
Small Sawlog M3
37mOption 1
Maximise Value Sawlog Lengths
14cm
7cm
14cm
7cm
14cm
7cm
14cm
7cm
14cm
7cm
14cm
7cm
14cm
7cm
14cm
7cm
14cm
16cm
7cm7cmPulp
7cmPulpPulp M3
Large Sawlog M3
Small Sawlog M3
37mOption 1
Maximise Value Sawlog Lengths
14cm
7cm
14cm
7cm
14cm
7cm
14cm
7cm
14cm
7cm
14cm
7cm
14cm
7cm
14cm
7cm
14cm
16cm
7cm7cmPulp
7cmPulpPulp M3
Large Sawlog M3
Small Sawlog M3
43mOption 2
Maximise Value Sawlog Lengths
14cm
7cm
14cm
7cm
14cm
7cm
14cm
7cm
14cm
7cm
14cm
7cm
14cm
7cm
14cm
7cm
14cm
16cm
7cm7cmPulp
7cmPulpPulp M3
Large Sawlog M3
Small Sawlog M3
43mOption 2
Maximise Value Sawlog Lengths
14cm
7cm
14cm
7cm
14cm
7cm
14cm
7cm
14cm
7cm
14cm
7cm
14cm
7cm
14cm
7cm
14cm
16cm
7cm7cmPulp
7cmPulpPulp M3
Large Sawlog M3
Small Sawlog M3
49mOption 3
Maximise Value Sawlog Lengths
14cm
7cm
14cm
7cm
14cm
7cm
14cm
7cm
14cm
7cm
14cm
7cm
14cm
7cm
14cm
7cm
14cm
16cm
7cm7cmPulp
7cmPulpPulp M3
Large Sawlog M3
Small Sawlog M3
49mOption 3
Harvester Optimisation
Log Quality Straightness (Sweep) Taper Branching Rot
Our Offering
Forest Mapper - First In The World ndash Online Forest Mapping amp Analysis - Data Management System
Forest Mapper Automated net area calculation stratification and Location for ground sample plots to be collected
Sample Plots
Net Area
Stratification
(Inventory Planning)
Supporting different field data collection tools GPS Calipers Vertex
Terrestrial Laser Scanning Forest Measurement System(AutoStem Forest)
Automated 3D Forest Measurement System
Trusted and Independent Data
Output From Field Survey
bull XYZ Position of each treebull Measurement Informationbull Speciesbull Other information
ndash Defectsndash etc
Forest Valuation Online Data
Current Forest Value
Mobile Field Survey App ndash Report Sharing -Interconnectivity
Latest Development
bull Online Market Placebull 15000 forest ownersbull Irish Farmers Association
Task 24 - 3D Modelling for harvesting planning
bull Objectives
bull Scheduling
bull Participants and roles
bull Overview and timeline
Outlook
Objectives
Task 24 Goal To generate and make accessible a detailedinteractive 3D model of the forest environment
The WPrsquos purpose is to develop methodologies and tools to fully describe terrain and stand characteristics in order to evaluate the accessibility for and efficiency of harvestingtechnologies in mountain forests
Scheduling
Start Month 7End Month 15Deliverable Harvest simulation tool based on 3D forest modelTotal MM 20Task leader GRAPHITECHParticipants CNR KESLA COAST BOKU GRE FLY TRE
Participants role
GRAPHITECH(10) Task Leader It has in charge the development of tool for representing the virtual 3D environment of the mountain forest as well as the of the virtual system on mobile and machine-mounted displays Finally it will be involved into the developmet of the solution for interactive cableway positioning
CNR(1) Definition of the ldquotechnology layersrdquo (ie harvest parameters) and methodologies to coordinate tree marking with the subsequent harvesting operations
KESLA(1) Acting as final user in order to simulate the behaivor of own machine into the virtual system
COAST(2) Provide the input model for the virtual system combining the information of task 21 22 and 23
Participants role
BOKU(2) it will be involved into definition of the ldquotechnology layersrdquo (ie harvestparameters) then on the developmet of the solution for interactive cablewaypositioning
GRE(1) Acting as final user in order to simulate the behaivor of own machine into the virtual system
FLY(1) Provide the input model for the virtual system combining the information of task 21 22 and 23
TRE(2) Development of the Forest WarehouseTM for mountain forestry and support the deployment of the virtual system
Functions
bull Forestry measurements estimationsThe platform will allow the combination of accurate tree profile information with up to date remote sensing data
bull Interactive system for cableway positioning simulation
bull Definition of the ldquotechnology layersrdquo (ie harvest parameters)Technological layers show technical limitations of machines and
equipment on different forest areas
bull Deployment of the virtual system on mobile and machine-mounted displays
Two levels of abstraction
1St Level 2D map accessingof forest and logisticinformation inlcudingCadastral Volume of timber accessibility
Where available the systemallow access to the SLOPE information system
Two levels of abstraction
2nd Level 3D map accessingof forest tree by tree featuresallowing interaction and simulation of cable cranepositioning
Timeline
Defining the first version of the 3D forest model Partner involved (TRE COAST FLY)
Interface to access to the FIS database including OGC services both for 2D and 3D (Task 51+BOKU)
Cable Crane simulation tool (GRE)
Final version
Platform Core
Using the remote data (Satellite UAVs orthophotos and digital surface model) combinedwith on field information (TLS) each single tree feature will be segmented including itsdeducted geometric properties
Task 21
Task 22
Task 23
3D forest modelVirtual 3D
environment
Platform CoreCanopy surface model Laser scanner point cloud Aerial amp satellite images
3D Modelling for harvesting planning
What Technologiy for 3D forest modelling
Realistic rendering Parametric model Point cloud visualization
3D Visualization Technologies
Approachesbull Desktop Visualization Platform
with Mobile Portingbull Web-Client Visualization
Platform
Desktop Platformbull Open-Source Library for 3d
visualization (OpenInventor Vtk Openscenegraph)
bull 3d Engine ( UdK IrrichlichtEngine Unity 3d)
Technologies
Web Client bull WebGL implementation of
OpenGL ES 20 for web programmable in JavaScript
bull Java Applet based on OpensourceGlobe Nasa World wind Cesioum
Actions
- Parallel session on WP2 tomorrow
- bi-weekly Skypewebex session
- Dedicated folder on consortium dropbox to share documentation
- Ftp area to exchange large testing datasets
Thank you for your attention
DR FEDERICO PRANDI
Federicoprandigraphitechit
Fondazione GraphitechVia Alla Cascata 56C38123 Trento (ITALY)
Phone +39 0461283394Fax +39 0461283398
Project SLOPE79
T 25 ndash Road and Logistic planning
Mikkeli 2nd-4th July 2014
1 Task objectives80
Task objectives
Build and validate and Optimization model to decide on optimal logistic network in a given forest area This means to calculate locations for buffer areas mills and processing plants routes and flows between nodes according to a forecast demand
Build and validate a Model to estimate traffic on individual sections for road maintenance and construction purposes in this forest area according to a forecasted demand
Grumes in Trento has been chosen as forest area for testing the models
To be developed from M8 (August 14) to M13 (January 15)
Includes development of ldquoD205 Road and logistic simulation modulerdquo
Due to Month 13
Partners involved
ITENE (leader) GRAPHITECH CNR BOKU FLY
2 Approaches for sites location and flow allocation decisions
81
The goal is to determine an optimal (minimum cost) forest logistic network to respond future demands
The approach should determine Location of facilities (normally from a set of posible sites) Size and capacity of facilities (storage areas and processing sites) Volume to harvest in every landing and stand area Volume of timber to transport from landings to facilities (it gives a first
estimation of road traffic for road planning) Routes to connect nodes
2 Approaches for sites location and flow allocation decisions
82
The model should consider inputs like
Forecast of future demand of timber Geographic characteristics of the area (Map distances slopes available
areas sizes coordinates hellip) Actual roads from forest to mills (forest accessibility) Map type hellip Amount and quality of available timber Possible location of millsbiomass areas and distance to the forest
(coordinates size) Dimension of the logs needed Individual costs related to transport infrastructures costs and others like
clearing meadows or watersides artificial anchors locking public roads
2 Approaches for sites location and flow allocation decisions
83
StandCable ways
forestlanes
2 Approaches for sites location and flow allocation decisions
84
minorroad
mainroad
land
land
land
stand
stand
stand
2 Approaches for sites location and flow allocation decisions
85
Solution flow
Possible flow
lands in forest storage and facilities (saw mills biomass)
2 Approaches for sites location and flow allocation decisions
86
Location of a single facility by center-of-gravity method Output XY coordinates for the facility Optimization based only on distances Binary model (source-sink) Useful for a first estimation of a facility location
to be supplied from specific lands
2 Approaches for sites location and flow allocation decisions
87
Location of selected number of facilities by the exact center-of-gravity method Output XY coordinates of a selected number
of facilities Optimization based only on distances Binary model (source-sink) Useful for a first estimation of 2 or more
facility locations to be supplied from specific lands
2 Approaches for sites location and flow allocation decisions
88
P-median multiple facility location Output selected facilities from a list of
candidate sites receiving flows from other sites Optimization based on transport costs and fix
costs but lack of capacity constrains and other inventory costs
Binary model (source-sink) Useful for a first estimation of 2 or more facility
locations to be supplied from specific lands
2 Approaches for sites location and flow allocation decisions
89
Mixed integer linear programming problem Output selected facilities and optimal flows
between nodes Optimization based on transport costs and fix
costs capacity constrains and inventory costs Three stages model More appropriate approach for a network with
more than 2 node types
lands in forest storage and facilities(saw mills biomass)
2 Approaches for sites location and flow allocation decisions
90
Dynamic linear programming Consider changing demand Output
Selected facilities Size an capacity of facilities (storage and processing sites) Volume of harvest in every landing and stand aacuterea Volume to transport
Timber from landings to facilities Product from facilities to demand sites
Decision to expand production capacity in a specific period in the planning horizon
Minimize total costs for timber supply and transport investment and operational costs product transport cost to demand sites fixed cost for capacity expansion
- 200 400 600 800
1000 1200
1 2 3 4 5 6 7
Period Demand Volume
lands in forest storage and facilities(saw mills biomass)
2 Approaches for sites location and flow allocation decisions
91
Previous Work
Facilities Location Models An Application for the Forest Production and Logistics
JUAN TRONCOSO T 1 RODRIGO GARRIDO H 2 XIMENA IBACACHE J 3
July 2002
1 Departamento de Ciencias Forestales Pontificia Universidad Catoacutelica de Chile Casilla 305 Correo 22 Santiago Chile E-mail jtroncotpuccl
2 Departamento de Ingenieriacutea de Transporte Pontificia Universidad Catoacutelica de Chile3 Escuela de Ingenieriacutea Forestal Universidad Mayor
2 Approaches for sites location and flow allocation decisions
92
INPUTS Demands of product per each period and type of quality from demand site
DATA COLLECTION FOR THE MODEL Positions of stands lands storage areas processing sites (saw paper mills and
biomass heating and power plants) demand sites Volume available to harvest in every stand per quality of timber and destination (saw
mill or energy) Position for stand respect existing roads Slope or grade of difficulty to access Capacity of ground to support specific machinery Size and availability of skyline deployment sites Capacity and location of storage areas and buffers and processing sites Characteristics of processing sites and conversion facilities Distances between different nodes
2 Approaches for sites location and flow allocation decisions
93
COST FACTORS supply and transport operational costs final product transport cost to demand sites fixed cost for capacity expansion during the planning horizon investment associated to construction of a new site
OUTPUT Selected facilities Size an capacity of facilities (storage and processing sites) Volume of harvest in every landing and stand aacuterea Volume to transport
Timber from landings to facilities
Product from facilities to demand sites
Decision to expand production capacity in a specific period in the planning horizon
3 Approaches to estimate traffic in existing roads
94
Once the different sites and locations have been selected and flows between sites have been determined for each future period
A Logistics Resource Planning Model will be used to determine the volume to harvest in every period in every land processing and transport means and a more precise estimation of traffic in every individual sections of road in terms of number of trip per vehicles type (size weight) in each period
This traffic estimation will allow to define plans for road maintenance and construction in the forest area taking into account the capability of roads to accept trucks and cranes of different weights and sizes
3 Approaches to estimate traffic in existing roads
95
Similarities to DRP method
Land 1
SITE Saw PlantX
City 1
Product demandHarvest orders
Land 2 City 2
3 Approaches to estimate traffic in existing roads
96
SITE Saw Plant X Minumum Batch (harvest) (m3period) 500 Lead time (number of periods) 1 Safety stock (m3) 200
Period 1 2 3 4 5 6 7 Demand Volume (m3) 400 500 600 1000 500 600 1000 Available Stock (m3) 700 300 300 200 200 200 100 100 Harvest recepcion (m3) - 500 500 1000 500 500 1000 Harvest order launch (m3) 500 500 1000 500 500 1000
Land 1 To harvest (m3) 500 500 1000 Available m3 in land 1 2000 1500 1000 -Size of vehicle (m3) 10 Number of vehicle trips size 10m3 50 50 100
land 2 To harvest (m3) - - - 500 500 1000 -Available m3 in land 1 3000 2500 2000 1000 1000 Size of vehicle (m3) 10 Number of vehicle trips size 10m3 50 50 100 -
97
4 Work done so far
1st virtual meeting (webex conference)ndash 16062014
Attendants Daniele and Giulio (GRAPHITEC) Gianni (CNR) Marco (FLYBY) Martin (BOKU) Patricia Emilio and Loli (ITENE)
Agenda Task 25 objectives description of subtasks and partner roles Decision on forest area as test scenario (Grumes Trento has been decided as test
forest area) Next steps and dates
98
4 Work done so far
Discussion tomorrow in the T25 technical session
Collect general info of Grumes forest area Map with locations and roads available characteristics facilities actors (owners) hellip
Review planning models used in the literature Identify and organize detailed Grumes forest data collection for
models
5 Work plan99
Choose a test scenario Done (Grumes Trento)
Collect general info of Grumes forest area Map with locations and roads available characteristics facilities owners willing to show interest give data demand scenario hellip (GRAPHITEC amp CNR) DEADLINE 15 JULY 2014
Review network opt models (BOKU) and traffic estimation models (CNR) used in the literature (CNR BOKUITENE) Conclusion Report DEADLINE 15 AUGUST 2014
Formulatedesign a Network optimization model for logistics site location and flow allocation decisions (BOKU) DEADLINE 30 SEPTEMBER 2014
Formulatedesign model to estimate traffic in existing roads (CNR) DEADLINE 30 SEPTEMBER 2014
Collect detailed Grumes forest data for models Costs model elements etc (ITENE GRAPHITEC CNR FLYBY) DEADLINE 31ST OCTOBER 2014
Data Elements integration with the global forest model (ITENE) DEADLINE 31ST OCTOBER 2014
Program the Optimization model to allocate landings with the mills and plants and traffic calculation on individual sections (BOKU) DEADLINE 14TH NOVEMBER 2014
Program the model for road planning based on the amount of timber to be transported and identification of traffic on existing forest infrastructure (BOKU) DEADLINE 28TH NOVEMBER 2014
Validate models and run a scenario simulation with demand data (BOKU) DEADLINE 19TH DECEMBER 2014
6 Contact info100
Emilio Gonzalez egonzalezitenecom
Patricia Bellver pbellveritenecom
- Project SLOPE
- SLOPE WP 2 ndash Task 21
- Task 21 participants
- Task 21 general description
- GANTT
- Working on a case study
- RapidEye satellite imagery
- Task 21 expected output
- 1deg DRAFT D201 index
- Chapter 1 General view on remote sensing
- Chapter 2
- Other chapters are under costruction
- METHODOLOGY
- Slide Number 14
- Identification of Forest plantation on Google Earth
- Flight Plan uploaded to Auto Pilot in accordance with CAA IAA European Aviation Authority Regulations
- Data Acquisition and Processing
- Data Acquisition and Processing
- Data Acquisition and Processing DEM DTM DCM Crown Sizes Animated views
- Data Acquisition and Processing DEM DTM DCM Crown Sizes Animated views
- Data Acquisition amp Processing
- Example of Data to Follow
- Coastway ndash UAV and Payloads
- UAV
- Transport Case
- Payloads
- Slide Number 27
- Development by UAV manufacturer forAgricultural Mapping
- Questions
- Overall Progress of WP 2
- WP2 Tasks Completed Planning Recommendations
- Planning -Test Site Trento
- Test Site Flight Plan - Trento
- Trento Test Site UAV Launch and Landing Sites
- Presentation of Tasks Completed ndash Integration WP22
- Presentation of Tasks Completed ndash Integration WP22
- Tasks Completed ndash Data collection
- Ongoing Tasks
- TreeMetricsldquoPROVIDE MORE END PRODUCT FROM LESS TREESrdquo
- The Products
- The Products General Values
- The Problem - ldquoThe Collision of Interestsrdquo
- Maximise Value
- Maximise Value Sawlog Lengths
- Maximise Value Sawlog Lengths
- Maximise Value Sawlog Lengths
- Maximise Value Sawlog Lengths
- Maximise Value Sawlog Lengths
- Maximise Value Sawlog Lengths
- Harvester Optimisation
- Log Quality Straightness (Sweep) Taper Branching Rot
- Our Offering
- Slide Number 53
- Slide Number 54
- Slide Number 55
- Terrestrial Laser Scanning Forest Measurement System (AutoStem Forest)
- Slide Number 57
- Output From Field Survey
- Forest Valuation Online Data
- Current Forest Value
- Slide Number 61
- Latest Development
- Slide Number 63
- Outlook
- Objectives
- Scheduling
- Participants role
- Participants role
- Functions
- Two levels of abstraction
- Two levels of abstraction
- Timeline
- Platform Core
- Platform Core
- 3D Modelling for harvesting planning
- 3D Visualization Technologies
- Actions
- Thank you for your attention
- Project SLOPE
- 1 Task objectives
- 2 Approaches for sites location and flow allocation decisions
- 2 Approaches for sites location and flow allocation decisions
- 2 Approaches for sites location and flow allocation decisions
- 2 Approaches for sites location and flow allocation decisions
- 2 Approaches for sites location and flow allocation decisions
- 2 Approaches for sites location and flow allocation decisions
- 2 Approaches for sites location and flow allocation decisions
- 2 Approaches for sites location and flow allocation decisions
- 2 Approaches for sites location and flow allocation decisions
- 2 Approaches for sites location and flow allocation decisions
- 2 Approaches for sites location and flow allocation decisions
- 2 Approaches for sites location and flow allocation decisions
- 2 Approaches for sites location and flow allocation decisions
- 3 Approaches to estimate traffic in existing roads
- 3 Approaches to estimate traffic in existing roads
- 3 Approaches to estimate traffic in existing roads
- 4 Work done so far
- 4 Work done so far
- 5 Work plan
- 6 Contact info
-
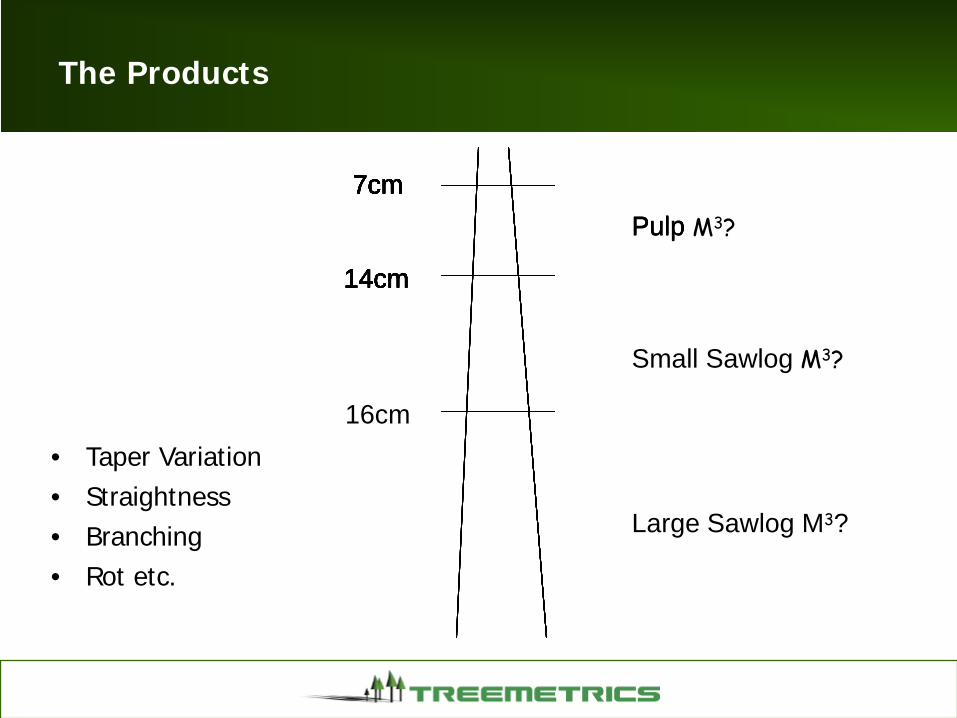

Maximise Value Sawlog Lengths
14cm
7cm
14cm
7cm
14cm
7cm
14cm
7cm
14cm
7cm
14cm
7cm
14cm
7cm
14cm
7cm
14cm
16cm
7cm7cmPulp
7cmPulpPulp M3
Large Sawlog M3
Small Sawlog M3
37mOption 1
Maximise Value Sawlog Lengths
14cm
7cm
14cm
7cm
14cm
7cm
14cm
7cm
14cm
7cm
14cm
7cm
14cm
7cm
14cm
7cm
14cm
16cm
7cm7cmPulp
7cmPulpPulp M3
Large Sawlog M3
Small Sawlog M3
37mOption 1
Maximise Value Sawlog Lengths
14cm
7cm
14cm
7cm
14cm
7cm
14cm
7cm
14cm
7cm
14cm
7cm
14cm
7cm
14cm
7cm
14cm
16cm
7cm7cmPulp
7cmPulpPulp M3
Large Sawlog M3
Small Sawlog M3
43mOption 2
Maximise Value Sawlog Lengths
14cm
7cm
14cm
7cm
14cm
7cm
14cm
7cm
14cm
7cm
14cm
7cm
14cm
7cm
14cm
7cm
14cm
16cm
7cm7cmPulp
7cmPulpPulp M3
Large Sawlog M3
Small Sawlog M3
43mOption 2
Maximise Value Sawlog Lengths
14cm
7cm
14cm
7cm
14cm
7cm
14cm
7cm
14cm
7cm
14cm
7cm
14cm
7cm
14cm
7cm
14cm
16cm
7cm7cmPulp
7cmPulpPulp M3
Large Sawlog M3
Small Sawlog M3
49mOption 3
Maximise Value Sawlog Lengths
14cm
7cm
14cm
7cm
14cm
7cm
14cm
7cm
14cm
7cm
14cm
7cm
14cm
7cm
14cm
7cm
14cm
16cm
7cm7cmPulp
7cmPulpPulp M3
Large Sawlog M3
Small Sawlog M3
49mOption 3
Harvester Optimisation
Log Quality Straightness (Sweep) Taper Branching Rot
Our Offering
Forest Mapper - First In The World ndash Online Forest Mapping amp Analysis - Data Management System
Forest Mapper Automated net area calculation stratification and Location for ground sample plots to be collected
Sample Plots
Net Area
Stratification
(Inventory Planning)
Supporting different field data collection tools GPS Calipers Vertex
Terrestrial Laser Scanning Forest Measurement System(AutoStem Forest)
Automated 3D Forest Measurement System
Trusted and Independent Data
Output From Field Survey
bull XYZ Position of each treebull Measurement Informationbull Speciesbull Other information
ndash Defectsndash etc
Forest Valuation Online Data
Current Forest Value
Mobile Field Survey App ndash Report Sharing -Interconnectivity
Latest Development
bull Online Market Placebull 15000 forest ownersbull Irish Farmers Association
Task 24 - 3D Modelling for harvesting planning
bull Objectives
bull Scheduling
bull Participants and roles
bull Overview and timeline
Outlook
Objectives
Task 24 Goal To generate and make accessible a detailedinteractive 3D model of the forest environment
The WPrsquos purpose is to develop methodologies and tools to fully describe terrain and stand characteristics in order to evaluate the accessibility for and efficiency of harvestingtechnologies in mountain forests
Scheduling
Start Month 7End Month 15Deliverable Harvest simulation tool based on 3D forest modelTotal MM 20Task leader GRAPHITECHParticipants CNR KESLA COAST BOKU GRE FLY TRE
Participants role
GRAPHITECH(10) Task Leader It has in charge the development of tool for representing the virtual 3D environment of the mountain forest as well as the of the virtual system on mobile and machine-mounted displays Finally it will be involved into the developmet of the solution for interactive cableway positioning
CNR(1) Definition of the ldquotechnology layersrdquo (ie harvest parameters) and methodologies to coordinate tree marking with the subsequent harvesting operations
KESLA(1) Acting as final user in order to simulate the behaivor of own machine into the virtual system
COAST(2) Provide the input model for the virtual system combining the information of task 21 22 and 23
Participants role
BOKU(2) it will be involved into definition of the ldquotechnology layersrdquo (ie harvestparameters) then on the developmet of the solution for interactive cablewaypositioning
GRE(1) Acting as final user in order to simulate the behaivor of own machine into the virtual system
FLY(1) Provide the input model for the virtual system combining the information of task 21 22 and 23
TRE(2) Development of the Forest WarehouseTM for mountain forestry and support the deployment of the virtual system
Functions
bull Forestry measurements estimationsThe platform will allow the combination of accurate tree profile information with up to date remote sensing data
bull Interactive system for cableway positioning simulation
bull Definition of the ldquotechnology layersrdquo (ie harvest parameters)Technological layers show technical limitations of machines and
equipment on different forest areas
bull Deployment of the virtual system on mobile and machine-mounted displays
Two levels of abstraction
1St Level 2D map accessingof forest and logisticinformation inlcudingCadastral Volume of timber accessibility
Where available the systemallow access to the SLOPE information system
Two levels of abstraction
2nd Level 3D map accessingof forest tree by tree featuresallowing interaction and simulation of cable cranepositioning
Timeline
Defining the first version of the 3D forest model Partner involved (TRE COAST FLY)
Interface to access to the FIS database including OGC services both for 2D and 3D (Task 51+BOKU)
Cable Crane simulation tool (GRE)
Final version
Platform Core
Using the remote data (Satellite UAVs orthophotos and digital surface model) combinedwith on field information (TLS) each single tree feature will be segmented including itsdeducted geometric properties
Task 21
Task 22
Task 23
3D forest modelVirtual 3D
environment
Platform CoreCanopy surface model Laser scanner point cloud Aerial amp satellite images
3D Modelling for harvesting planning
What Technologiy for 3D forest modelling
Realistic rendering Parametric model Point cloud visualization
3D Visualization Technologies
Approachesbull Desktop Visualization Platform
with Mobile Portingbull Web-Client Visualization
Platform
Desktop Platformbull Open-Source Library for 3d
visualization (OpenInventor Vtk Openscenegraph)
bull 3d Engine ( UdK IrrichlichtEngine Unity 3d)
Technologies
Web Client bull WebGL implementation of
OpenGL ES 20 for web programmable in JavaScript
bull Java Applet based on OpensourceGlobe Nasa World wind Cesioum
Actions
- Parallel session on WP2 tomorrow
- bi-weekly Skypewebex session
- Dedicated folder on consortium dropbox to share documentation
- Ftp area to exchange large testing datasets
Thank you for your attention
DR FEDERICO PRANDI
Federicoprandigraphitechit
Fondazione GraphitechVia Alla Cascata 56C38123 Trento (ITALY)
Phone +39 0461283394Fax +39 0461283398
Project SLOPE79
T 25 ndash Road and Logistic planning
Mikkeli 2nd-4th July 2014
1 Task objectives80
Task objectives
Build and validate and Optimization model to decide on optimal logistic network in a given forest area This means to calculate locations for buffer areas mills and processing plants routes and flows between nodes according to a forecast demand
Build and validate a Model to estimate traffic on individual sections for road maintenance and construction purposes in this forest area according to a forecasted demand
Grumes in Trento has been chosen as forest area for testing the models
To be developed from M8 (August 14) to M13 (January 15)
Includes development of ldquoD205 Road and logistic simulation modulerdquo
Due to Month 13
Partners involved
ITENE (leader) GRAPHITECH CNR BOKU FLY
2 Approaches for sites location and flow allocation decisions
81
The goal is to determine an optimal (minimum cost) forest logistic network to respond future demands
The approach should determine Location of facilities (normally from a set of posible sites) Size and capacity of facilities (storage areas and processing sites) Volume to harvest in every landing and stand area Volume of timber to transport from landings to facilities (it gives a first
estimation of road traffic for road planning) Routes to connect nodes
2 Approaches for sites location and flow allocation decisions
82
The model should consider inputs like
Forecast of future demand of timber Geographic characteristics of the area (Map distances slopes available
areas sizes coordinates hellip) Actual roads from forest to mills (forest accessibility) Map type hellip Amount and quality of available timber Possible location of millsbiomass areas and distance to the forest
(coordinates size) Dimension of the logs needed Individual costs related to transport infrastructures costs and others like
clearing meadows or watersides artificial anchors locking public roads
2 Approaches for sites location and flow allocation decisions
83
StandCable ways
forestlanes
2 Approaches for sites location and flow allocation decisions
84
minorroad
mainroad
land
land
land
stand
stand
stand
2 Approaches for sites location and flow allocation decisions
85
Solution flow
Possible flow
lands in forest storage and facilities (saw mills biomass)
2 Approaches for sites location and flow allocation decisions
86
Location of a single facility by center-of-gravity method Output XY coordinates for the facility Optimization based only on distances Binary model (source-sink) Useful for a first estimation of a facility location
to be supplied from specific lands
2 Approaches for sites location and flow allocation decisions
87
Location of selected number of facilities by the exact center-of-gravity method Output XY coordinates of a selected number
of facilities Optimization based only on distances Binary model (source-sink) Useful for a first estimation of 2 or more
facility locations to be supplied from specific lands
2 Approaches for sites location and flow allocation decisions
88
P-median multiple facility location Output selected facilities from a list of
candidate sites receiving flows from other sites Optimization based on transport costs and fix
costs but lack of capacity constrains and other inventory costs
Binary model (source-sink) Useful for a first estimation of 2 or more facility
locations to be supplied from specific lands
2 Approaches for sites location and flow allocation decisions
89
Mixed integer linear programming problem Output selected facilities and optimal flows
between nodes Optimization based on transport costs and fix
costs capacity constrains and inventory costs Three stages model More appropriate approach for a network with
more than 2 node types
lands in forest storage and facilities(saw mills biomass)
2 Approaches for sites location and flow allocation decisions
90
Dynamic linear programming Consider changing demand Output
Selected facilities Size an capacity of facilities (storage and processing sites) Volume of harvest in every landing and stand aacuterea Volume to transport
Timber from landings to facilities Product from facilities to demand sites
Decision to expand production capacity in a specific period in the planning horizon
Minimize total costs for timber supply and transport investment and operational costs product transport cost to demand sites fixed cost for capacity expansion
- 200 400 600 800
1000 1200
1 2 3 4 5 6 7
Period Demand Volume
lands in forest storage and facilities(saw mills biomass)
2 Approaches for sites location and flow allocation decisions
91
Previous Work
Facilities Location Models An Application for the Forest Production and Logistics
JUAN TRONCOSO T 1 RODRIGO GARRIDO H 2 XIMENA IBACACHE J 3
July 2002
1 Departamento de Ciencias Forestales Pontificia Universidad Catoacutelica de Chile Casilla 305 Correo 22 Santiago Chile E-mail jtroncotpuccl
2 Departamento de Ingenieriacutea de Transporte Pontificia Universidad Catoacutelica de Chile3 Escuela de Ingenieriacutea Forestal Universidad Mayor
2 Approaches for sites location and flow allocation decisions
92
INPUTS Demands of product per each period and type of quality from demand site
DATA COLLECTION FOR THE MODEL Positions of stands lands storage areas processing sites (saw paper mills and
biomass heating and power plants) demand sites Volume available to harvest in every stand per quality of timber and destination (saw
mill or energy) Position for stand respect existing roads Slope or grade of difficulty to access Capacity of ground to support specific machinery Size and availability of skyline deployment sites Capacity and location of storage areas and buffers and processing sites Characteristics of processing sites and conversion facilities Distances between different nodes
2 Approaches for sites location and flow allocation decisions
93
COST FACTORS supply and transport operational costs final product transport cost to demand sites fixed cost for capacity expansion during the planning horizon investment associated to construction of a new site
OUTPUT Selected facilities Size an capacity of facilities (storage and processing sites) Volume of harvest in every landing and stand aacuterea Volume to transport
Timber from landings to facilities
Product from facilities to demand sites
Decision to expand production capacity in a specific period in the planning horizon
3 Approaches to estimate traffic in existing roads
94
Once the different sites and locations have been selected and flows between sites have been determined for each future period
A Logistics Resource Planning Model will be used to determine the volume to harvest in every period in every land processing and transport means and a more precise estimation of traffic in every individual sections of road in terms of number of trip per vehicles type (size weight) in each period
This traffic estimation will allow to define plans for road maintenance and construction in the forest area taking into account the capability of roads to accept trucks and cranes of different weights and sizes
3 Approaches to estimate traffic in existing roads
95
Similarities to DRP method
Land 1
SITE Saw PlantX
City 1
Product demandHarvest orders
Land 2 City 2
3 Approaches to estimate traffic in existing roads
96
SITE Saw Plant X Minumum Batch (harvest) (m3period) 500 Lead time (number of periods) 1 Safety stock (m3) 200
Period 1 2 3 4 5 6 7 Demand Volume (m3) 400 500 600 1000 500 600 1000 Available Stock (m3) 700 300 300 200 200 200 100 100 Harvest recepcion (m3) - 500 500 1000 500 500 1000 Harvest order launch (m3) 500 500 1000 500 500 1000
Land 1 To harvest (m3) 500 500 1000 Available m3 in land 1 2000 1500 1000 -Size of vehicle (m3) 10 Number of vehicle trips size 10m3 50 50 100
land 2 To harvest (m3) - - - 500 500 1000 -Available m3 in land 1 3000 2500 2000 1000 1000 Size of vehicle (m3) 10 Number of vehicle trips size 10m3 50 50 100 -
97
4 Work done so far
1st virtual meeting (webex conference)ndash 16062014
Attendants Daniele and Giulio (GRAPHITEC) Gianni (CNR) Marco (FLYBY) Martin (BOKU) Patricia Emilio and Loli (ITENE)
Agenda Task 25 objectives description of subtasks and partner roles Decision on forest area as test scenario (Grumes Trento has been decided as test
forest area) Next steps and dates
98
4 Work done so far
Discussion tomorrow in the T25 technical session
Collect general info of Grumes forest area Map with locations and roads available characteristics facilities actors (owners) hellip
Review planning models used in the literature Identify and organize detailed Grumes forest data collection for
models
5 Work plan99
Choose a test scenario Done (Grumes Trento)
Collect general info of Grumes forest area Map with locations and roads available characteristics facilities owners willing to show interest give data demand scenario hellip (GRAPHITEC amp CNR) DEADLINE 15 JULY 2014
Review network opt models (BOKU) and traffic estimation models (CNR) used in the literature (CNR BOKUITENE) Conclusion Report DEADLINE 15 AUGUST 2014
Formulatedesign a Network optimization model for logistics site location and flow allocation decisions (BOKU) DEADLINE 30 SEPTEMBER 2014
Formulatedesign model to estimate traffic in existing roads (CNR) DEADLINE 30 SEPTEMBER 2014
Collect detailed Grumes forest data for models Costs model elements etc (ITENE GRAPHITEC CNR FLYBY) DEADLINE 31ST OCTOBER 2014
Data Elements integration with the global forest model (ITENE) DEADLINE 31ST OCTOBER 2014
Program the Optimization model to allocate landings with the mills and plants and traffic calculation on individual sections (BOKU) DEADLINE 14TH NOVEMBER 2014
Program the model for road planning based on the amount of timber to be transported and identification of traffic on existing forest infrastructure (BOKU) DEADLINE 28TH NOVEMBER 2014
Validate models and run a scenario simulation with demand data (BOKU) DEADLINE 19TH DECEMBER 2014
6 Contact info100
Emilio Gonzalez egonzalezitenecom
Patricia Bellver pbellveritenecom
- Project SLOPE
- SLOPE WP 2 ndash Task 21
- Task 21 participants
- Task 21 general description
- GANTT
- Working on a case study
- RapidEye satellite imagery
- Task 21 expected output
- 1deg DRAFT D201 index
- Chapter 1 General view on remote sensing
- Chapter 2
- Other chapters are under costruction
- METHODOLOGY
- Slide Number 14
- Identification of Forest plantation on Google Earth
- Flight Plan uploaded to Auto Pilot in accordance with CAA IAA European Aviation Authority Regulations
- Data Acquisition and Processing
- Data Acquisition and Processing
- Data Acquisition and Processing DEM DTM DCM Crown Sizes Animated views
- Data Acquisition and Processing DEM DTM DCM Crown Sizes Animated views
- Data Acquisition amp Processing
- Example of Data to Follow
- Coastway ndash UAV and Payloads
- UAV
- Transport Case
- Payloads
- Slide Number 27
- Development by UAV manufacturer forAgricultural Mapping
- Questions
- Overall Progress of WP 2
- WP2 Tasks Completed Planning Recommendations
- Planning -Test Site Trento
- Test Site Flight Plan - Trento
- Trento Test Site UAV Launch and Landing Sites
- Presentation of Tasks Completed ndash Integration WP22
- Presentation of Tasks Completed ndash Integration WP22
- Tasks Completed ndash Data collection
- Ongoing Tasks
- TreeMetricsldquoPROVIDE MORE END PRODUCT FROM LESS TREESrdquo
- The Products
- The Products General Values
- The Problem - ldquoThe Collision of Interestsrdquo
- Maximise Value
- Maximise Value Sawlog Lengths
- Maximise Value Sawlog Lengths
- Maximise Value Sawlog Lengths
- Maximise Value Sawlog Lengths
- Maximise Value Sawlog Lengths
- Maximise Value Sawlog Lengths
- Harvester Optimisation
- Log Quality Straightness (Sweep) Taper Branching Rot
- Our Offering
- Slide Number 53
- Slide Number 54
- Slide Number 55
- Terrestrial Laser Scanning Forest Measurement System (AutoStem Forest)
- Slide Number 57
- Output From Field Survey
- Forest Valuation Online Data
- Current Forest Value
- Slide Number 61
- Latest Development
- Slide Number 63
- Outlook
- Objectives
- Scheduling
- Participants role
- Participants role
- Functions
- Two levels of abstraction
- Two levels of abstraction
- Timeline
- Platform Core
- Platform Core
- 3D Modelling for harvesting planning
- 3D Visualization Technologies
- Actions
- Thank you for your attention
- Project SLOPE
- 1 Task objectives
- 2 Approaches for sites location and flow allocation decisions
- 2 Approaches for sites location and flow allocation decisions
- 2 Approaches for sites location and flow allocation decisions
- 2 Approaches for sites location and flow allocation decisions
- 2 Approaches for sites location and flow allocation decisions
- 2 Approaches for sites location and flow allocation decisions
- 2 Approaches for sites location and flow allocation decisions
- 2 Approaches for sites location and flow allocation decisions
- 2 Approaches for sites location and flow allocation decisions
- 2 Approaches for sites location and flow allocation decisions
- 2 Approaches for sites location and flow allocation decisions
- 2 Approaches for sites location and flow allocation decisions
- 2 Approaches for sites location and flow allocation decisions
- 3 Approaches to estimate traffic in existing roads
- 3 Approaches to estimate traffic in existing roads
- 3 Approaches to estimate traffic in existing roads
- 4 Work done so far
- 4 Work done so far
- 5 Work plan
- 6 Contact info
-
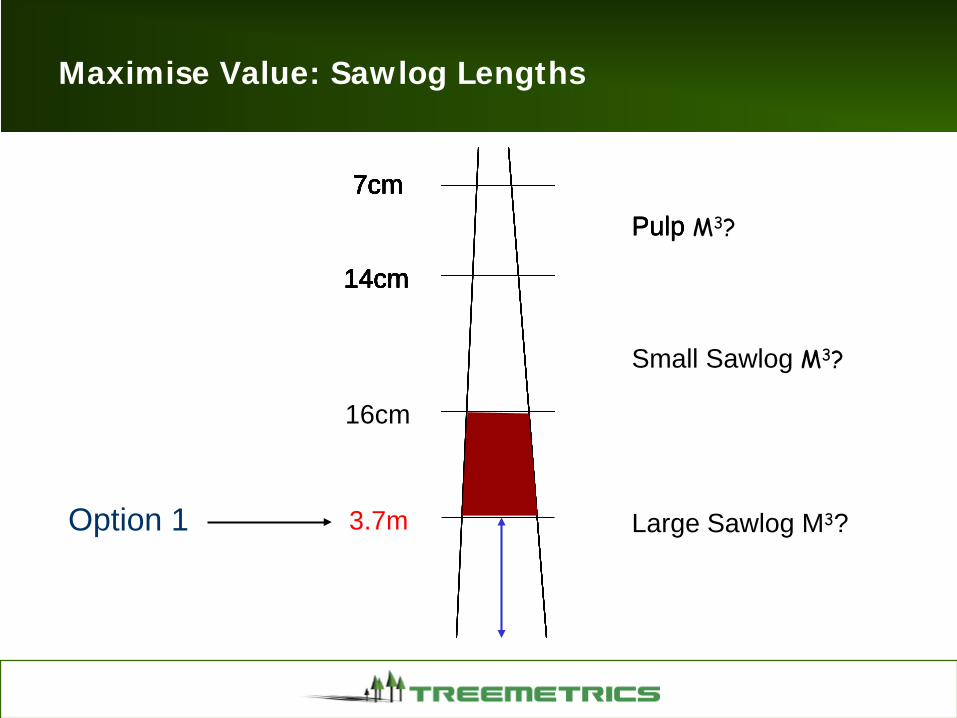
Maximise Value Sawlog Lengths
14cm
7cm
14cm
7cm
14cm
7cm
14cm
7cm
14cm
7cm
14cm
7cm
14cm
7cm
14cm
7cm
14cm
16cm
7cm7cmPulp
7cmPulpPulp M3
Large Sawlog M3
Small Sawlog M3
37mOption 1
Maximise Value Sawlog Lengths
14cm
7cm
14cm
7cm
14cm
7cm
14cm
7cm
14cm
7cm
14cm
7cm
14cm
7cm
14cm
7cm
14cm
16cm
7cm7cmPulp
7cmPulpPulp M3
Large Sawlog M3
Small Sawlog M3
43mOption 2
Maximise Value Sawlog Lengths
14cm
7cm
14cm
7cm
14cm
7cm
14cm
7cm
14cm
7cm
14cm
7cm
14cm
7cm
14cm
7cm
14cm
16cm
7cm7cmPulp
7cmPulpPulp M3
Large Sawlog M3
Small Sawlog M3
43mOption 2
Maximise Value Sawlog Lengths
14cm
7cm
14cm
7cm
14cm
7cm
14cm
7cm
14cm
7cm
14cm
7cm
14cm
7cm
14cm
7cm
14cm
16cm
7cm7cmPulp
7cmPulpPulp M3
Large Sawlog M3
Small Sawlog M3
49mOption 3
Maximise Value Sawlog Lengths
14cm
7cm
14cm
7cm
14cm
7cm
14cm
7cm
14cm
7cm
14cm
7cm
14cm
7cm
14cm
7cm
14cm
16cm
7cm7cmPulp
7cmPulpPulp M3
Large Sawlog M3
Small Sawlog M3
49mOption 3
Harvester Optimisation
Log Quality Straightness (Sweep) Taper Branching Rot
Our Offering
Forest Mapper - First In The World ndash Online Forest Mapping amp Analysis - Data Management System
Forest Mapper Automated net area calculation stratification and Location for ground sample plots to be collected
Sample Plots
Net Area
Stratification
(Inventory Planning)
Supporting different field data collection tools GPS Calipers Vertex
Terrestrial Laser Scanning Forest Measurement System(AutoStem Forest)
Automated 3D Forest Measurement System
Trusted and Independent Data
Output From Field Survey
bull XYZ Position of each treebull Measurement Informationbull Speciesbull Other information
ndash Defectsndash etc
Forest Valuation Online Data
Current Forest Value
Mobile Field Survey App ndash Report Sharing -Interconnectivity
Latest Development
bull Online Market Placebull 15000 forest ownersbull Irish Farmers Association
Task 24 - 3D Modelling for harvesting planning
bull Objectives
bull Scheduling
bull Participants and roles
bull Overview and timeline
Outlook
Objectives
Task 24 Goal To generate and make accessible a detailedinteractive 3D model of the forest environment
The WPrsquos purpose is to develop methodologies and tools to fully describe terrain and stand characteristics in order to evaluate the accessibility for and efficiency of harvestingtechnologies in mountain forests
Scheduling
Start Month 7End Month 15Deliverable Harvest simulation tool based on 3D forest modelTotal MM 20Task leader GRAPHITECHParticipants CNR KESLA COAST BOKU GRE FLY TRE
Participants role
GRAPHITECH(10) Task Leader It has in charge the development of tool for representing the virtual 3D environment of the mountain forest as well as the of the virtual system on mobile and machine-mounted displays Finally it will be involved into the developmet of the solution for interactive cableway positioning
CNR(1) Definition of the ldquotechnology layersrdquo (ie harvest parameters) and methodologies to coordinate tree marking with the subsequent harvesting operations
KESLA(1) Acting as final user in order to simulate the behaivor of own machine into the virtual system
COAST(2) Provide the input model for the virtual system combining the information of task 21 22 and 23
Participants role
BOKU(2) it will be involved into definition of the ldquotechnology layersrdquo (ie harvestparameters) then on the developmet of the solution for interactive cablewaypositioning
GRE(1) Acting as final user in order to simulate the behaivor of own machine into the virtual system
FLY(1) Provide the input model for the virtual system combining the information of task 21 22 and 23
TRE(2) Development of the Forest WarehouseTM for mountain forestry and support the deployment of the virtual system
Functions
bull Forestry measurements estimationsThe platform will allow the combination of accurate tree profile information with up to date remote sensing data
bull Interactive system for cableway positioning simulation
bull Definition of the ldquotechnology layersrdquo (ie harvest parameters)Technological layers show technical limitations of machines and
equipment on different forest areas
bull Deployment of the virtual system on mobile and machine-mounted displays
Two levels of abstraction
1St Level 2D map accessingof forest and logisticinformation inlcudingCadastral Volume of timber accessibility
Where available the systemallow access to the SLOPE information system
Two levels of abstraction
2nd Level 3D map accessingof forest tree by tree featuresallowing interaction and simulation of cable cranepositioning
Timeline
Defining the first version of the 3D forest model Partner involved (TRE COAST FLY)
Interface to access to the FIS database including OGC services both for 2D and 3D (Task 51+BOKU)
Cable Crane simulation tool (GRE)
Final version
Platform Core
Using the remote data (Satellite UAVs orthophotos and digital surface model) combinedwith on field information (TLS) each single tree feature will be segmented including itsdeducted geometric properties
Task 21
Task 22
Task 23
3D forest modelVirtual 3D
environment
Platform CoreCanopy surface model Laser scanner point cloud Aerial amp satellite images
3D Modelling for harvesting planning
What Technologiy for 3D forest modelling
Realistic rendering Parametric model Point cloud visualization
3D Visualization Technologies
Approachesbull Desktop Visualization Platform
with Mobile Portingbull Web-Client Visualization
Platform
Desktop Platformbull Open-Source Library for 3d
visualization (OpenInventor Vtk Openscenegraph)
bull 3d Engine ( UdK IrrichlichtEngine Unity 3d)
Technologies
Web Client bull WebGL implementation of
OpenGL ES 20 for web programmable in JavaScript
bull Java Applet based on OpensourceGlobe Nasa World wind Cesioum
Actions
- Parallel session on WP2 tomorrow
- bi-weekly Skypewebex session
- Dedicated folder on consortium dropbox to share documentation
- Ftp area to exchange large testing datasets
Thank you for your attention
DR FEDERICO PRANDI
Federicoprandigraphitechit
Fondazione GraphitechVia Alla Cascata 56C38123 Trento (ITALY)
Phone +39 0461283394Fax +39 0461283398
Project SLOPE79
T 25 ndash Road and Logistic planning
Mikkeli 2nd-4th July 2014
1 Task objectives80
Task objectives
Build and validate and Optimization model to decide on optimal logistic network in a given forest area This means to calculate locations for buffer areas mills and processing plants routes and flows between nodes according to a forecast demand
Build and validate a Model to estimate traffic on individual sections for road maintenance and construction purposes in this forest area according to a forecasted demand
Grumes in Trento has been chosen as forest area for testing the models
To be developed from M8 (August 14) to M13 (January 15)
Includes development of ldquoD205 Road and logistic simulation modulerdquo
Due to Month 13
Partners involved
ITENE (leader) GRAPHITECH CNR BOKU FLY
2 Approaches for sites location and flow allocation decisions
81
The goal is to determine an optimal (minimum cost) forest logistic network to respond future demands
The approach should determine Location of facilities (normally from a set of posible sites) Size and capacity of facilities (storage areas and processing sites) Volume to harvest in every landing and stand area Volume of timber to transport from landings to facilities (it gives a first
estimation of road traffic for road planning) Routes to connect nodes
2 Approaches for sites location and flow allocation decisions
82
The model should consider inputs like
Forecast of future demand of timber Geographic characteristics of the area (Map distances slopes available
areas sizes coordinates hellip) Actual roads from forest to mills (forest accessibility) Map type hellip Amount and quality of available timber Possible location of millsbiomass areas and distance to the forest
(coordinates size) Dimension of the logs needed Individual costs related to transport infrastructures costs and others like
clearing meadows or watersides artificial anchors locking public roads
2 Approaches for sites location and flow allocation decisions
83
StandCable ways
forestlanes
2 Approaches for sites location and flow allocation decisions
84
minorroad
mainroad
land
land
land
stand
stand
stand
2 Approaches for sites location and flow allocation decisions
85
Solution flow
Possible flow
lands in forest storage and facilities (saw mills biomass)
2 Approaches for sites location and flow allocation decisions
86
Location of a single facility by center-of-gravity method Output XY coordinates for the facility Optimization based only on distances Binary model (source-sink) Useful for a first estimation of a facility location
to be supplied from specific lands
2 Approaches for sites location and flow allocation decisions
87
Location of selected number of facilities by the exact center-of-gravity method Output XY coordinates of a selected number
of facilities Optimization based only on distances Binary model (source-sink) Useful for a first estimation of 2 or more
facility locations to be supplied from specific lands
2 Approaches for sites location and flow allocation decisions
88
P-median multiple facility location Output selected facilities from a list of
candidate sites receiving flows from other sites Optimization based on transport costs and fix
costs but lack of capacity constrains and other inventory costs
Binary model (source-sink) Useful for a first estimation of 2 or more facility
locations to be supplied from specific lands
2 Approaches for sites location and flow allocation decisions
89
Mixed integer linear programming problem Output selected facilities and optimal flows
between nodes Optimization based on transport costs and fix
costs capacity constrains and inventory costs Three stages model More appropriate approach for a network with
more than 2 node types
lands in forest storage and facilities(saw mills biomass)
2 Approaches for sites location and flow allocation decisions
90
Dynamic linear programming Consider changing demand Output
Selected facilities Size an capacity of facilities (storage and processing sites) Volume of harvest in every landing and stand aacuterea Volume to transport
Timber from landings to facilities Product from facilities to demand sites
Decision to expand production capacity in a specific period in the planning horizon
Minimize total costs for timber supply and transport investment and operational costs product transport cost to demand sites fixed cost for capacity expansion
- 200 400 600 800
1000 1200
1 2 3 4 5 6 7
Period Demand Volume
lands in forest storage and facilities(saw mills biomass)
2 Approaches for sites location and flow allocation decisions
91
Previous Work
Facilities Location Models An Application for the Forest Production and Logistics
JUAN TRONCOSO T 1 RODRIGO GARRIDO H 2 XIMENA IBACACHE J 3
July 2002
1 Departamento de Ciencias Forestales Pontificia Universidad Catoacutelica de Chile Casilla 305 Correo 22 Santiago Chile E-mail jtroncotpuccl
2 Departamento de Ingenieriacutea de Transporte Pontificia Universidad Catoacutelica de Chile3 Escuela de Ingenieriacutea Forestal Universidad Mayor
2 Approaches for sites location and flow allocation decisions
92
INPUTS Demands of product per each period and type of quality from demand site
DATA COLLECTION FOR THE MODEL Positions of stands lands storage areas processing sites (saw paper mills and
biomass heating and power plants) demand sites Volume available to harvest in every stand per quality of timber and destination (saw
mill or energy) Position for stand respect existing roads Slope or grade of difficulty to access Capacity of ground to support specific machinery Size and availability of skyline deployment sites Capacity and location of storage areas and buffers and processing sites Characteristics of processing sites and conversion facilities Distances between different nodes
2 Approaches for sites location and flow allocation decisions
93
COST FACTORS supply and transport operational costs final product transport cost to demand sites fixed cost for capacity expansion during the planning horizon investment associated to construction of a new site
OUTPUT Selected facilities Size an capacity of facilities (storage and processing sites) Volume of harvest in every landing and stand aacuterea Volume to transport
Timber from landings to facilities
Product from facilities to demand sites
Decision to expand production capacity in a specific period in the planning horizon
3 Approaches to estimate traffic in existing roads
94
Once the different sites and locations have been selected and flows between sites have been determined for each future period
A Logistics Resource Planning Model will be used to determine the volume to harvest in every period in every land processing and transport means and a more precise estimation of traffic in every individual sections of road in terms of number of trip per vehicles type (size weight) in each period
This traffic estimation will allow to define plans for road maintenance and construction in the forest area taking into account the capability of roads to accept trucks and cranes of different weights and sizes
3 Approaches to estimate traffic in existing roads
95
Similarities to DRP method
Land 1
SITE Saw PlantX
City 1
Product demandHarvest orders
Land 2 City 2
3 Approaches to estimate traffic in existing roads
96
SITE Saw Plant X Minumum Batch (harvest) (m3period) 500 Lead time (number of periods) 1 Safety stock (m3) 200
Period 1 2 3 4 5 6 7 Demand Volume (m3) 400 500 600 1000 500 600 1000 Available Stock (m3) 700 300 300 200 200 200 100 100 Harvest recepcion (m3) - 500 500 1000 500 500 1000 Harvest order launch (m3) 500 500 1000 500 500 1000
Land 1 To harvest (m3) 500 500 1000 Available m3 in land 1 2000 1500 1000 -Size of vehicle (m3) 10 Number of vehicle trips size 10m3 50 50 100
land 2 To harvest (m3) - - - 500 500 1000 -Available m3 in land 1 3000 2500 2000 1000 1000 Size of vehicle (m3) 10 Number of vehicle trips size 10m3 50 50 100 -
97
4 Work done so far
1st virtual meeting (webex conference)ndash 16062014
Attendants Daniele and Giulio (GRAPHITEC) Gianni (CNR) Marco (FLYBY) Martin (BOKU) Patricia Emilio and Loli (ITENE)
Agenda Task 25 objectives description of subtasks and partner roles Decision on forest area as test scenario (Grumes Trento has been decided as test
forest area) Next steps and dates
98
4 Work done so far
Discussion tomorrow in the T25 technical session
Collect general info of Grumes forest area Map with locations and roads available characteristics facilities actors (owners) hellip
Review planning models used in the literature Identify and organize detailed Grumes forest data collection for
models
5 Work plan99
Choose a test scenario Done (Grumes Trento)
Collect general info of Grumes forest area Map with locations and roads available characteristics facilities owners willing to show interest give data demand scenario hellip (GRAPHITEC amp CNR) DEADLINE 15 JULY 2014
Review network opt models (BOKU) and traffic estimation models (CNR) used in the literature (CNR BOKUITENE) Conclusion Report DEADLINE 15 AUGUST 2014
Formulatedesign a Network optimization model for logistics site location and flow allocation decisions (BOKU) DEADLINE 30 SEPTEMBER 2014
Formulatedesign model to estimate traffic in existing roads (CNR) DEADLINE 30 SEPTEMBER 2014
Collect detailed Grumes forest data for models Costs model elements etc (ITENE GRAPHITEC CNR FLYBY) DEADLINE 31ST OCTOBER 2014
Data Elements integration with the global forest model (ITENE) DEADLINE 31ST OCTOBER 2014
Program the Optimization model to allocate landings with the mills and plants and traffic calculation on individual sections (BOKU) DEADLINE 14TH NOVEMBER 2014
Program the model for road planning based on the amount of timber to be transported and identification of traffic on existing forest infrastructure (BOKU) DEADLINE 28TH NOVEMBER 2014
Validate models and run a scenario simulation with demand data (BOKU) DEADLINE 19TH DECEMBER 2014
6 Contact info100
Emilio Gonzalez egonzalezitenecom
Patricia Bellver pbellveritenecom
- Project SLOPE
- SLOPE WP 2 ndash Task 21
- Task 21 participants
- Task 21 general description
- GANTT
- Working on a case study
- RapidEye satellite imagery
- Task 21 expected output
- 1deg DRAFT D201 index
- Chapter 1 General view on remote sensing
- Chapter 2
- Other chapters are under costruction
- METHODOLOGY
- Slide Number 14
- Identification of Forest plantation on Google Earth
- Flight Plan uploaded to Auto Pilot in accordance with CAA IAA European Aviation Authority Regulations
- Data Acquisition and Processing
- Data Acquisition and Processing
- Data Acquisition and Processing DEM DTM DCM Crown Sizes Animated views
- Data Acquisition and Processing DEM DTM DCM Crown Sizes Animated views
- Data Acquisition amp Processing
- Example of Data to Follow
- Coastway ndash UAV and Payloads
- UAV
- Transport Case
- Payloads
- Slide Number 27
- Development by UAV manufacturer forAgricultural Mapping
- Questions
- Overall Progress of WP 2
- WP2 Tasks Completed Planning Recommendations
- Planning -Test Site Trento
- Test Site Flight Plan - Trento
- Trento Test Site UAV Launch and Landing Sites
- Presentation of Tasks Completed ndash Integration WP22
- Presentation of Tasks Completed ndash Integration WP22
- Tasks Completed ndash Data collection
- Ongoing Tasks
- TreeMetricsldquoPROVIDE MORE END PRODUCT FROM LESS TREESrdquo
- The Products
- The Products General Values
- The Problem - ldquoThe Collision of Interestsrdquo
- Maximise Value
- Maximise Value Sawlog Lengths
- Maximise Value Sawlog Lengths
- Maximise Value Sawlog Lengths
- Maximise Value Sawlog Lengths
- Maximise Value Sawlog Lengths
- Maximise Value Sawlog Lengths
- Harvester Optimisation
- Log Quality Straightness (Sweep) Taper Branching Rot
- Our Offering
- Slide Number 53
- Slide Number 54
- Slide Number 55
- Terrestrial Laser Scanning Forest Measurement System (AutoStem Forest)
- Slide Number 57
- Output From Field Survey
- Forest Valuation Online Data
- Current Forest Value
- Slide Number 61
- Latest Development
- Slide Number 63
- Outlook
- Objectives
- Scheduling
- Participants role
- Participants role
- Functions
- Two levels of abstraction
- Two levels of abstraction
- Timeline
- Platform Core
- Platform Core
- 3D Modelling for harvesting planning
- 3D Visualization Technologies
- Actions
- Thank you for your attention
- Project SLOPE
- 1 Task objectives
- 2 Approaches for sites location and flow allocation decisions
- 2 Approaches for sites location and flow allocation decisions
- 2 Approaches for sites location and flow allocation decisions
- 2 Approaches for sites location and flow allocation decisions
- 2 Approaches for sites location and flow allocation decisions
- 2 Approaches for sites location and flow allocation decisions
- 2 Approaches for sites location and flow allocation decisions
- 2 Approaches for sites location and flow allocation decisions
- 2 Approaches for sites location and flow allocation decisions
- 2 Approaches for sites location and flow allocation decisions
- 2 Approaches for sites location and flow allocation decisions
- 2 Approaches for sites location and flow allocation decisions
- 2 Approaches for sites location and flow allocation decisions
- 3 Approaches to estimate traffic in existing roads
- 3 Approaches to estimate traffic in existing roads
- 3 Approaches to estimate traffic in existing roads
- 4 Work done so far
- 4 Work done so far
- 5 Work plan
- 6 Contact info
-

Maximise Value Sawlog Lengths
14cm
7cm
14cm
7cm
14cm
7cm
14cm
7cm
14cm
7cm
14cm
7cm
14cm
7cm
14cm
7cm
14cm
16cm
7cm7cmPulp
7cmPulpPulp M3
Large Sawlog M3
Small Sawlog M3
43mOption 2
Maximise Value Sawlog Lengths
14cm
7cm
14cm
7cm
14cm
7cm
14cm
7cm
14cm
7cm
14cm
7cm
14cm
7cm
14cm
7cm
14cm
16cm
7cm7cmPulp
7cmPulpPulp M3
Large Sawlog M3
Small Sawlog M3
43mOption 2
Maximise Value Sawlog Lengths
14cm
7cm
14cm
7cm
14cm
7cm
14cm
7cm
14cm
7cm
14cm
7cm
14cm
7cm
14cm
7cm
14cm
16cm
7cm7cmPulp
7cmPulpPulp M3
Large Sawlog M3
Small Sawlog M3
49mOption 3
Maximise Value Sawlog Lengths
14cm
7cm
14cm
7cm
14cm
7cm
14cm
7cm
14cm
7cm
14cm
7cm
14cm
7cm
14cm
7cm
14cm
16cm
7cm7cmPulp
7cmPulpPulp M3
Large Sawlog M3
Small Sawlog M3
49mOption 3
Harvester Optimisation
Log Quality Straightness (Sweep) Taper Branching Rot
Our Offering
Forest Mapper - First In The World ndash Online Forest Mapping amp Analysis - Data Management System
Forest Mapper Automated net area calculation stratification and Location for ground sample plots to be collected
Sample Plots
Net Area
Stratification
(Inventory Planning)
Supporting different field data collection tools GPS Calipers Vertex
Terrestrial Laser Scanning Forest Measurement System(AutoStem Forest)
Automated 3D Forest Measurement System
Trusted and Independent Data
Output From Field Survey
bull XYZ Position of each treebull Measurement Informationbull Speciesbull Other information
ndash Defectsndash etc
Forest Valuation Online Data
Current Forest Value
Mobile Field Survey App ndash Report Sharing -Interconnectivity
Latest Development
bull Online Market Placebull 15000 forest ownersbull Irish Farmers Association
Task 24 - 3D Modelling for harvesting planning
bull Objectives
bull Scheduling
bull Participants and roles
bull Overview and timeline
Outlook
Objectives
Task 24 Goal To generate and make accessible a detailedinteractive 3D model of the forest environment
The WPrsquos purpose is to develop methodologies and tools to fully describe terrain and stand characteristics in order to evaluate the accessibility for and efficiency of harvestingtechnologies in mountain forests
Scheduling
Start Month 7End Month 15Deliverable Harvest simulation tool based on 3D forest modelTotal MM 20Task leader GRAPHITECHParticipants CNR KESLA COAST BOKU GRE FLY TRE
Participants role
GRAPHITECH(10) Task Leader It has in charge the development of tool for representing the virtual 3D environment of the mountain forest as well as the of the virtual system on mobile and machine-mounted displays Finally it will be involved into the developmet of the solution for interactive cableway positioning
CNR(1) Definition of the ldquotechnology layersrdquo (ie harvest parameters) and methodologies to coordinate tree marking with the subsequent harvesting operations
KESLA(1) Acting as final user in order to simulate the behaivor of own machine into the virtual system
COAST(2) Provide the input model for the virtual system combining the information of task 21 22 and 23
Participants role
BOKU(2) it will be involved into definition of the ldquotechnology layersrdquo (ie harvestparameters) then on the developmet of the solution for interactive cablewaypositioning
GRE(1) Acting as final user in order to simulate the behaivor of own machine into the virtual system
FLY(1) Provide the input model for the virtual system combining the information of task 21 22 and 23
TRE(2) Development of the Forest WarehouseTM for mountain forestry and support the deployment of the virtual system
Functions
bull Forestry measurements estimationsThe platform will allow the combination of accurate tree profile information with up to date remote sensing data
bull Interactive system for cableway positioning simulation
bull Definition of the ldquotechnology layersrdquo (ie harvest parameters)Technological layers show technical limitations of machines and
equipment on different forest areas
bull Deployment of the virtual system on mobile and machine-mounted displays
Two levels of abstraction
1St Level 2D map accessingof forest and logisticinformation inlcudingCadastral Volume of timber accessibility
Where available the systemallow access to the SLOPE information system
Two levels of abstraction
2nd Level 3D map accessingof forest tree by tree featuresallowing interaction and simulation of cable cranepositioning
Timeline
Defining the first version of the 3D forest model Partner involved (TRE COAST FLY)
Interface to access to the FIS database including OGC services both for 2D and 3D (Task 51+BOKU)
Cable Crane simulation tool (GRE)
Final version
Platform Core
Using the remote data (Satellite UAVs orthophotos and digital surface model) combinedwith on field information (TLS) each single tree feature will be segmented including itsdeducted geometric properties
Task 21
Task 22
Task 23
3D forest modelVirtual 3D
environment
Platform CoreCanopy surface model Laser scanner point cloud Aerial amp satellite images
3D Modelling for harvesting planning
What Technologiy for 3D forest modelling
Realistic rendering Parametric model Point cloud visualization
3D Visualization Technologies
Approachesbull Desktop Visualization Platform
with Mobile Portingbull Web-Client Visualization
Platform
Desktop Platformbull Open-Source Library for 3d
visualization (OpenInventor Vtk Openscenegraph)
bull 3d Engine ( UdK IrrichlichtEngine Unity 3d)
Technologies
Web Client bull WebGL implementation of
OpenGL ES 20 for web programmable in JavaScript
bull Java Applet based on OpensourceGlobe Nasa World wind Cesioum
Actions
- Parallel session on WP2 tomorrow
- bi-weekly Skypewebex session
- Dedicated folder on consortium dropbox to share documentation
- Ftp area to exchange large testing datasets
Thank you for your attention
DR FEDERICO PRANDI
Federicoprandigraphitechit
Fondazione GraphitechVia Alla Cascata 56C38123 Trento (ITALY)
Phone +39 0461283394Fax +39 0461283398
Project SLOPE79
T 25 ndash Road and Logistic planning
Mikkeli 2nd-4th July 2014
1 Task objectives80
Task objectives
Build and validate and Optimization model to decide on optimal logistic network in a given forest area This means to calculate locations for buffer areas mills and processing plants routes and flows between nodes according to a forecast demand
Build and validate a Model to estimate traffic on individual sections for road maintenance and construction purposes in this forest area according to a forecasted demand
Grumes in Trento has been chosen as forest area for testing the models
To be developed from M8 (August 14) to M13 (January 15)
Includes development of ldquoD205 Road and logistic simulation modulerdquo
Due to Month 13
Partners involved
ITENE (leader) GRAPHITECH CNR BOKU FLY
2 Approaches for sites location and flow allocation decisions
81
The goal is to determine an optimal (minimum cost) forest logistic network to respond future demands
The approach should determine Location of facilities (normally from a set of posible sites) Size and capacity of facilities (storage areas and processing sites) Volume to harvest in every landing and stand area Volume of timber to transport from landings to facilities (it gives a first
estimation of road traffic for road planning) Routes to connect nodes
2 Approaches for sites location and flow allocation decisions
82
The model should consider inputs like
Forecast of future demand of timber Geographic characteristics of the area (Map distances slopes available
areas sizes coordinates hellip) Actual roads from forest to mills (forest accessibility) Map type hellip Amount and quality of available timber Possible location of millsbiomass areas and distance to the forest
(coordinates size) Dimension of the logs needed Individual costs related to transport infrastructures costs and others like
clearing meadows or watersides artificial anchors locking public roads
2 Approaches for sites location and flow allocation decisions
83
StandCable ways
forestlanes
2 Approaches for sites location and flow allocation decisions
84
minorroad
mainroad
land
land
land
stand
stand
stand
2 Approaches for sites location and flow allocation decisions
85
Solution flow
Possible flow
lands in forest storage and facilities (saw mills biomass)
2 Approaches for sites location and flow allocation decisions
86
Location of a single facility by center-of-gravity method Output XY coordinates for the facility Optimization based only on distances Binary model (source-sink) Useful for a first estimation of a facility location
to be supplied from specific lands
2 Approaches for sites location and flow allocation decisions
87
Location of selected number of facilities by the exact center-of-gravity method Output XY coordinates of a selected number
of facilities Optimization based only on distances Binary model (source-sink) Useful for a first estimation of 2 or more
facility locations to be supplied from specific lands
2 Approaches for sites location and flow allocation decisions
88
P-median multiple facility location Output selected facilities from a list of
candidate sites receiving flows from other sites Optimization based on transport costs and fix
costs but lack of capacity constrains and other inventory costs
Binary model (source-sink) Useful for a first estimation of 2 or more facility
locations to be supplied from specific lands
2 Approaches for sites location and flow allocation decisions
89
Mixed integer linear programming problem Output selected facilities and optimal flows
between nodes Optimization based on transport costs and fix
costs capacity constrains and inventory costs Three stages model More appropriate approach for a network with
more than 2 node types
lands in forest storage and facilities(saw mills biomass)
2 Approaches for sites location and flow allocation decisions
90
Dynamic linear programming Consider changing demand Output
Selected facilities Size an capacity of facilities (storage and processing sites) Volume of harvest in every landing and stand aacuterea Volume to transport
Timber from landings to facilities Product from facilities to demand sites
Decision to expand production capacity in a specific period in the planning horizon
Minimize total costs for timber supply and transport investment and operational costs product transport cost to demand sites fixed cost for capacity expansion
- 200 400 600 800
1000 1200
1 2 3 4 5 6 7
Period Demand Volume
lands in forest storage and facilities(saw mills biomass)
2 Approaches for sites location and flow allocation decisions
91
Previous Work
Facilities Location Models An Application for the Forest Production and Logistics
JUAN TRONCOSO T 1 RODRIGO GARRIDO H 2 XIMENA IBACACHE J 3
July 2002
1 Departamento de Ciencias Forestales Pontificia Universidad Catoacutelica de Chile Casilla 305 Correo 22 Santiago Chile E-mail jtroncotpuccl
2 Departamento de Ingenieriacutea de Transporte Pontificia Universidad Catoacutelica de Chile3 Escuela de Ingenieriacutea Forestal Universidad Mayor
2 Approaches for sites location and flow allocation decisions
92
INPUTS Demands of product per each period and type of quality from demand site
DATA COLLECTION FOR THE MODEL Positions of stands lands storage areas processing sites (saw paper mills and
biomass heating and power plants) demand sites Volume available to harvest in every stand per quality of timber and destination (saw
mill or energy) Position for stand respect existing roads Slope or grade of difficulty to access Capacity of ground to support specific machinery Size and availability of skyline deployment sites Capacity and location of storage areas and buffers and processing sites Characteristics of processing sites and conversion facilities Distances between different nodes
2 Approaches for sites location and flow allocation decisions
93
COST FACTORS supply and transport operational costs final product transport cost to demand sites fixed cost for capacity expansion during the planning horizon investment associated to construction of a new site
OUTPUT Selected facilities Size an capacity of facilities (storage and processing sites) Volume of harvest in every landing and stand aacuterea Volume to transport
Timber from landings to facilities
Product from facilities to demand sites
Decision to expand production capacity in a specific period in the planning horizon
3 Approaches to estimate traffic in existing roads
94
Once the different sites and locations have been selected and flows between sites have been determined for each future period
A Logistics Resource Planning Model will be used to determine the volume to harvest in every period in every land processing and transport means and a more precise estimation of traffic in every individual sections of road in terms of number of trip per vehicles type (size weight) in each period
This traffic estimation will allow to define plans for road maintenance and construction in the forest area taking into account the capability of roads to accept trucks and cranes of different weights and sizes
3 Approaches to estimate traffic in existing roads
95
Similarities to DRP method
Land 1
SITE Saw PlantX
City 1
Product demandHarvest orders
Land 2 City 2
3 Approaches to estimate traffic in existing roads
96
SITE Saw Plant X Minumum Batch (harvest) (m3period) 500 Lead time (number of periods) 1 Safety stock (m3) 200
Period 1 2 3 4 5 6 7 Demand Volume (m3) 400 500 600 1000 500 600 1000 Available Stock (m3) 700 300 300 200 200 200 100 100 Harvest recepcion (m3) - 500 500 1000 500 500 1000 Harvest order launch (m3) 500 500 1000 500 500 1000
Land 1 To harvest (m3) 500 500 1000 Available m3 in land 1 2000 1500 1000 -Size of vehicle (m3) 10 Number of vehicle trips size 10m3 50 50 100
land 2 To harvest (m3) - - - 500 500 1000 -Available m3 in land 1 3000 2500 2000 1000 1000 Size of vehicle (m3) 10 Number of vehicle trips size 10m3 50 50 100 -
97
4 Work done so far
1st virtual meeting (webex conference)ndash 16062014
Attendants Daniele and Giulio (GRAPHITEC) Gianni (CNR) Marco (FLYBY) Martin (BOKU) Patricia Emilio and Loli (ITENE)
Agenda Task 25 objectives description of subtasks and partner roles Decision on forest area as test scenario (Grumes Trento has been decided as test
forest area) Next steps and dates
98
4 Work done so far
Discussion tomorrow in the T25 technical session
Collect general info of Grumes forest area Map with locations and roads available characteristics facilities actors (owners) hellip
Review planning models used in the literature Identify and organize detailed Grumes forest data collection for
models
5 Work plan99
Choose a test scenario Done (Grumes Trento)
Collect general info of Grumes forest area Map with locations and roads available characteristics facilities owners willing to show interest give data demand scenario hellip (GRAPHITEC amp CNR) DEADLINE 15 JULY 2014
Review network opt models (BOKU) and traffic estimation models (CNR) used in the literature (CNR BOKUITENE) Conclusion Report DEADLINE 15 AUGUST 2014
Formulatedesign a Network optimization model for logistics site location and flow allocation decisions (BOKU) DEADLINE 30 SEPTEMBER 2014
Formulatedesign model to estimate traffic in existing roads (CNR) DEADLINE 30 SEPTEMBER 2014
Collect detailed Grumes forest data for models Costs model elements etc (ITENE GRAPHITEC CNR FLYBY) DEADLINE 31ST OCTOBER 2014
Data Elements integration with the global forest model (ITENE) DEADLINE 31ST OCTOBER 2014
Program the Optimization model to allocate landings with the mills and plants and traffic calculation on individual sections (BOKU) DEADLINE 14TH NOVEMBER 2014
Program the model for road planning based on the amount of timber to be transported and identification of traffic on existing forest infrastructure (BOKU) DEADLINE 28TH NOVEMBER 2014
Validate models and run a scenario simulation with demand data (BOKU) DEADLINE 19TH DECEMBER 2014
6 Contact info100
Emilio Gonzalez egonzalezitenecom
Patricia Bellver pbellveritenecom
- Project SLOPE
- SLOPE WP 2 ndash Task 21
- Task 21 participants
- Task 21 general description
- GANTT
- Working on a case study
- RapidEye satellite imagery
- Task 21 expected output
- 1deg DRAFT D201 index
- Chapter 1 General view on remote sensing
- Chapter 2
- Other chapters are under costruction
- METHODOLOGY
- Slide Number 14
- Identification of Forest plantation on Google Earth
- Flight Plan uploaded to Auto Pilot in accordance with CAA IAA European Aviation Authority Regulations
- Data Acquisition and Processing
- Data Acquisition and Processing
- Data Acquisition and Processing DEM DTM DCM Crown Sizes Animated views
- Data Acquisition and Processing DEM DTM DCM Crown Sizes Animated views
- Data Acquisition amp Processing
- Example of Data to Follow
- Coastway ndash UAV and Payloads
- UAV
- Transport Case
- Payloads
- Slide Number 27
- Development by UAV manufacturer forAgricultural Mapping
- Questions
- Overall Progress of WP 2
- WP2 Tasks Completed Planning Recommendations
- Planning -Test Site Trento
- Test Site Flight Plan - Trento
- Trento Test Site UAV Launch and Landing Sites
- Presentation of Tasks Completed ndash Integration WP22
- Presentation of Tasks Completed ndash Integration WP22
- Tasks Completed ndash Data collection
- Ongoing Tasks
- TreeMetricsldquoPROVIDE MORE END PRODUCT FROM LESS TREESrdquo
- The Products
- The Products General Values
- The Problem - ldquoThe Collision of Interestsrdquo
- Maximise Value
- Maximise Value Sawlog Lengths
- Maximise Value Sawlog Lengths
- Maximise Value Sawlog Lengths
- Maximise Value Sawlog Lengths
- Maximise Value Sawlog Lengths
- Maximise Value Sawlog Lengths
- Harvester Optimisation
- Log Quality Straightness (Sweep) Taper Branching Rot
- Our Offering
- Slide Number 53
- Slide Number 54
- Slide Number 55
- Terrestrial Laser Scanning Forest Measurement System (AutoStem Forest)
- Slide Number 57
- Output From Field Survey
- Forest Valuation Online Data
- Current Forest Value
- Slide Number 61
- Latest Development
- Slide Number 63
- Outlook
- Objectives
- Scheduling
- Participants role
- Participants role
- Functions
- Two levels of abstraction
- Two levels of abstraction
- Timeline
- Platform Core
- Platform Core
- 3D Modelling for harvesting planning
- 3D Visualization Technologies
- Actions
- Thank you for your attention
- Project SLOPE
- 1 Task objectives
- 2 Approaches for sites location and flow allocation decisions
- 2 Approaches for sites location and flow allocation decisions
- 2 Approaches for sites location and flow allocation decisions
- 2 Approaches for sites location and flow allocation decisions
- 2 Approaches for sites location and flow allocation decisions
- 2 Approaches for sites location and flow allocation decisions
- 2 Approaches for sites location and flow allocation decisions
- 2 Approaches for sites location and flow allocation decisions
- 2 Approaches for sites location and flow allocation decisions
- 2 Approaches for sites location and flow allocation decisions
- 2 Approaches for sites location and flow allocation decisions
- 2 Approaches for sites location and flow allocation decisions
- 2 Approaches for sites location and flow allocation decisions
- 3 Approaches to estimate traffic in existing roads
- 3 Approaches to estimate traffic in existing roads
- 3 Approaches to estimate traffic in existing roads
- 4 Work done so far
- 4 Work done so far
- 5 Work plan
- 6 Contact info
-

Maximise Value Sawlog Lengths
14cm
7cm
14cm
7cm
14cm
7cm
14cm
7cm
14cm
7cm
14cm
7cm
14cm
7cm
14cm
7cm
14cm
16cm
7cm7cmPulp
7cmPulpPulp M3
Large Sawlog M3
Small Sawlog M3
43mOption 2
Maximise Value Sawlog Lengths
14cm
7cm
14cm
7cm
14cm
7cm
14cm
7cm
14cm
7cm
14cm
7cm
14cm
7cm
14cm
7cm
14cm
16cm
7cm7cmPulp
7cmPulpPulp M3
Large Sawlog M3
Small Sawlog M3
49mOption 3
Maximise Value Sawlog Lengths
14cm
7cm
14cm
7cm
14cm
7cm
14cm
7cm
14cm
7cm
14cm
7cm
14cm
7cm
14cm
7cm
14cm
16cm
7cm7cmPulp
7cmPulpPulp M3
Large Sawlog M3
Small Sawlog M3
49mOption 3
Harvester Optimisation
Log Quality Straightness (Sweep) Taper Branching Rot
Our Offering
Forest Mapper - First In The World ndash Online Forest Mapping amp Analysis - Data Management System
Forest Mapper Automated net area calculation stratification and Location for ground sample plots to be collected
Sample Plots
Net Area
Stratification
(Inventory Planning)
Supporting different field data collection tools GPS Calipers Vertex
Terrestrial Laser Scanning Forest Measurement System(AutoStem Forest)
Automated 3D Forest Measurement System
Trusted and Independent Data
Output From Field Survey
bull XYZ Position of each treebull Measurement Informationbull Speciesbull Other information
ndash Defectsndash etc
Forest Valuation Online Data
Current Forest Value
Mobile Field Survey App ndash Report Sharing -Interconnectivity
Latest Development
bull Online Market Placebull 15000 forest ownersbull Irish Farmers Association
Task 24 - 3D Modelling for harvesting planning
bull Objectives
bull Scheduling
bull Participants and roles
bull Overview and timeline
Outlook
Objectives
Task 24 Goal To generate and make accessible a detailedinteractive 3D model of the forest environment
The WPrsquos purpose is to develop methodologies and tools to fully describe terrain and stand characteristics in order to evaluate the accessibility for and efficiency of harvestingtechnologies in mountain forests
Scheduling
Start Month 7End Month 15Deliverable Harvest simulation tool based on 3D forest modelTotal MM 20Task leader GRAPHITECHParticipants CNR KESLA COAST BOKU GRE FLY TRE
Participants role
GRAPHITECH(10) Task Leader It has in charge the development of tool for representing the virtual 3D environment of the mountain forest as well as the of the virtual system on mobile and machine-mounted displays Finally it will be involved into the developmet of the solution for interactive cableway positioning
CNR(1) Definition of the ldquotechnology layersrdquo (ie harvest parameters) and methodologies to coordinate tree marking with the subsequent harvesting operations
KESLA(1) Acting as final user in order to simulate the behaivor of own machine into the virtual system
COAST(2) Provide the input model for the virtual system combining the information of task 21 22 and 23
Participants role
BOKU(2) it will be involved into definition of the ldquotechnology layersrdquo (ie harvestparameters) then on the developmet of the solution for interactive cablewaypositioning
GRE(1) Acting as final user in order to simulate the behaivor of own machine into the virtual system
FLY(1) Provide the input model for the virtual system combining the information of task 21 22 and 23
TRE(2) Development of the Forest WarehouseTM for mountain forestry and support the deployment of the virtual system
Functions
bull Forestry measurements estimationsThe platform will allow the combination of accurate tree profile information with up to date remote sensing data
bull Interactive system for cableway positioning simulation
bull Definition of the ldquotechnology layersrdquo (ie harvest parameters)Technological layers show technical limitations of machines and
equipment on different forest areas
bull Deployment of the virtual system on mobile and machine-mounted displays
Two levels of abstraction
1St Level 2D map accessingof forest and logisticinformation inlcudingCadastral Volume of timber accessibility
Where available the systemallow access to the SLOPE information system
Two levels of abstraction
2nd Level 3D map accessingof forest tree by tree featuresallowing interaction and simulation of cable cranepositioning
Timeline
Defining the first version of the 3D forest model Partner involved (TRE COAST FLY)
Interface to access to the FIS database including OGC services both for 2D and 3D (Task 51+BOKU)
Cable Crane simulation tool (GRE)
Final version
Platform Core
Using the remote data (Satellite UAVs orthophotos and digital surface model) combinedwith on field information (TLS) each single tree feature will be segmented including itsdeducted geometric properties
Task 21
Task 22
Task 23
3D forest modelVirtual 3D
environment
Platform CoreCanopy surface model Laser scanner point cloud Aerial amp satellite images
3D Modelling for harvesting planning
What Technologiy for 3D forest modelling
Realistic rendering Parametric model Point cloud visualization
3D Visualization Technologies
Approachesbull Desktop Visualization Platform
with Mobile Portingbull Web-Client Visualization
Platform
Desktop Platformbull Open-Source Library for 3d
visualization (OpenInventor Vtk Openscenegraph)
bull 3d Engine ( UdK IrrichlichtEngine Unity 3d)
Technologies
Web Client bull WebGL implementation of
OpenGL ES 20 for web programmable in JavaScript
bull Java Applet based on OpensourceGlobe Nasa World wind Cesioum
Actions
- Parallel session on WP2 tomorrow
- bi-weekly Skypewebex session
- Dedicated folder on consortium dropbox to share documentation
- Ftp area to exchange large testing datasets
Thank you for your attention
DR FEDERICO PRANDI
Federicoprandigraphitechit
Fondazione GraphitechVia Alla Cascata 56C38123 Trento (ITALY)
Phone +39 0461283394Fax +39 0461283398
Project SLOPE79
T 25 ndash Road and Logistic planning
Mikkeli 2nd-4th July 2014
1 Task objectives80
Task objectives
Build and validate and Optimization model to decide on optimal logistic network in a given forest area This means to calculate locations for buffer areas mills and processing plants routes and flows between nodes according to a forecast demand
Build and validate a Model to estimate traffic on individual sections for road maintenance and construction purposes in this forest area according to a forecasted demand
Grumes in Trento has been chosen as forest area for testing the models
To be developed from M8 (August 14) to M13 (January 15)
Includes development of ldquoD205 Road and logistic simulation modulerdquo
Due to Month 13
Partners involved
ITENE (leader) GRAPHITECH CNR BOKU FLY
2 Approaches for sites location and flow allocation decisions
81
The goal is to determine an optimal (minimum cost) forest logistic network to respond future demands
The approach should determine Location of facilities (normally from a set of posible sites) Size and capacity of facilities (storage areas and processing sites) Volume to harvest in every landing and stand area Volume of timber to transport from landings to facilities (it gives a first
estimation of road traffic for road planning) Routes to connect nodes
2 Approaches for sites location and flow allocation decisions
82
The model should consider inputs like
Forecast of future demand of timber Geographic characteristics of the area (Map distances slopes available
areas sizes coordinates hellip) Actual roads from forest to mills (forest accessibility) Map type hellip Amount and quality of available timber Possible location of millsbiomass areas and distance to the forest
(coordinates size) Dimension of the logs needed Individual costs related to transport infrastructures costs and others like
clearing meadows or watersides artificial anchors locking public roads
2 Approaches for sites location and flow allocation decisions
83
StandCable ways
forestlanes
2 Approaches for sites location and flow allocation decisions
84
minorroad
mainroad
land
land
land
stand
stand
stand
2 Approaches for sites location and flow allocation decisions
85
Solution flow
Possible flow
lands in forest storage and facilities (saw mills biomass)
2 Approaches for sites location and flow allocation decisions
86
Location of a single facility by center-of-gravity method Output XY coordinates for the facility Optimization based only on distances Binary model (source-sink) Useful for a first estimation of a facility location
to be supplied from specific lands
2 Approaches for sites location and flow allocation decisions
87
Location of selected number of facilities by the exact center-of-gravity method Output XY coordinates of a selected number
of facilities Optimization based only on distances Binary model (source-sink) Useful for a first estimation of 2 or more
facility locations to be supplied from specific lands
2 Approaches for sites location and flow allocation decisions
88
P-median multiple facility location Output selected facilities from a list of
candidate sites receiving flows from other sites Optimization based on transport costs and fix
costs but lack of capacity constrains and other inventory costs
Binary model (source-sink) Useful for a first estimation of 2 or more facility
locations to be supplied from specific lands
2 Approaches for sites location and flow allocation decisions
89
Mixed integer linear programming problem Output selected facilities and optimal flows
between nodes Optimization based on transport costs and fix
costs capacity constrains and inventory costs Three stages model More appropriate approach for a network with
more than 2 node types
lands in forest storage and facilities(saw mills biomass)
2 Approaches for sites location and flow allocation decisions
90
Dynamic linear programming Consider changing demand Output
Selected facilities Size an capacity of facilities (storage and processing sites) Volume of harvest in every landing and stand aacuterea Volume to transport
Timber from landings to facilities Product from facilities to demand sites
Decision to expand production capacity in a specific period in the planning horizon
Minimize total costs for timber supply and transport investment and operational costs product transport cost to demand sites fixed cost for capacity expansion
- 200 400 600 800
1000 1200
1 2 3 4 5 6 7
Period Demand Volume
lands in forest storage and facilities(saw mills biomass)
2 Approaches for sites location and flow allocation decisions
91
Previous Work
Facilities Location Models An Application for the Forest Production and Logistics
JUAN TRONCOSO T 1 RODRIGO GARRIDO H 2 XIMENA IBACACHE J 3
July 2002
1 Departamento de Ciencias Forestales Pontificia Universidad Catoacutelica de Chile Casilla 305 Correo 22 Santiago Chile E-mail jtroncotpuccl
2 Departamento de Ingenieriacutea de Transporte Pontificia Universidad Catoacutelica de Chile3 Escuela de Ingenieriacutea Forestal Universidad Mayor
2 Approaches for sites location and flow allocation decisions
92
INPUTS Demands of product per each period and type of quality from demand site
DATA COLLECTION FOR THE MODEL Positions of stands lands storage areas processing sites (saw paper mills and
biomass heating and power plants) demand sites Volume available to harvest in every stand per quality of timber and destination (saw
mill or energy) Position for stand respect existing roads Slope or grade of difficulty to access Capacity of ground to support specific machinery Size and availability of skyline deployment sites Capacity and location of storage areas and buffers and processing sites Characteristics of processing sites and conversion facilities Distances between different nodes
2 Approaches for sites location and flow allocation decisions
93
COST FACTORS supply and transport operational costs final product transport cost to demand sites fixed cost for capacity expansion during the planning horizon investment associated to construction of a new site
OUTPUT Selected facilities Size an capacity of facilities (storage and processing sites) Volume of harvest in every landing and stand aacuterea Volume to transport
Timber from landings to facilities
Product from facilities to demand sites
Decision to expand production capacity in a specific period in the planning horizon
3 Approaches to estimate traffic in existing roads
94
Once the different sites and locations have been selected and flows between sites have been determined for each future period
A Logistics Resource Planning Model will be used to determine the volume to harvest in every period in every land processing and transport means and a more precise estimation of traffic in every individual sections of road in terms of number of trip per vehicles type (size weight) in each period
This traffic estimation will allow to define plans for road maintenance and construction in the forest area taking into account the capability of roads to accept trucks and cranes of different weights and sizes
3 Approaches to estimate traffic in existing roads
95
Similarities to DRP method
Land 1
SITE Saw PlantX
City 1
Product demandHarvest orders
Land 2 City 2
3 Approaches to estimate traffic in existing roads
96
SITE Saw Plant X Minumum Batch (harvest) (m3period) 500 Lead time (number of periods) 1 Safety stock (m3) 200
Period 1 2 3 4 5 6 7 Demand Volume (m3) 400 500 600 1000 500 600 1000 Available Stock (m3) 700 300 300 200 200 200 100 100 Harvest recepcion (m3) - 500 500 1000 500 500 1000 Harvest order launch (m3) 500 500 1000 500 500 1000
Land 1 To harvest (m3) 500 500 1000 Available m3 in land 1 2000 1500 1000 -Size of vehicle (m3) 10 Number of vehicle trips size 10m3 50 50 100
land 2 To harvest (m3) - - - 500 500 1000 -Available m3 in land 1 3000 2500 2000 1000 1000 Size of vehicle (m3) 10 Number of vehicle trips size 10m3 50 50 100 -
97
4 Work done so far
1st virtual meeting (webex conference)ndash 16062014
Attendants Daniele and Giulio (GRAPHITEC) Gianni (CNR) Marco (FLYBY) Martin (BOKU) Patricia Emilio and Loli (ITENE)
Agenda Task 25 objectives description of subtasks and partner roles Decision on forest area as test scenario (Grumes Trento has been decided as test
forest area) Next steps and dates
98
4 Work done so far
Discussion tomorrow in the T25 technical session
Collect general info of Grumes forest area Map with locations and roads available characteristics facilities actors (owners) hellip
Review planning models used in the literature Identify and organize detailed Grumes forest data collection for
models
5 Work plan99
Choose a test scenario Done (Grumes Trento)
Collect general info of Grumes forest area Map with locations and roads available characteristics facilities owners willing to show interest give data demand scenario hellip (GRAPHITEC amp CNR) DEADLINE 15 JULY 2014
Review network opt models (BOKU) and traffic estimation models (CNR) used in the literature (CNR BOKUITENE) Conclusion Report DEADLINE 15 AUGUST 2014
Formulatedesign a Network optimization model for logistics site location and flow allocation decisions (BOKU) DEADLINE 30 SEPTEMBER 2014
Formulatedesign model to estimate traffic in existing roads (CNR) DEADLINE 30 SEPTEMBER 2014
Collect detailed Grumes forest data for models Costs model elements etc (ITENE GRAPHITEC CNR FLYBY) DEADLINE 31ST OCTOBER 2014
Data Elements integration with the global forest model (ITENE) DEADLINE 31ST OCTOBER 2014
Program the Optimization model to allocate landings with the mills and plants and traffic calculation on individual sections (BOKU) DEADLINE 14TH NOVEMBER 2014
Program the model for road planning based on the amount of timber to be transported and identification of traffic on existing forest infrastructure (BOKU) DEADLINE 28TH NOVEMBER 2014
Validate models and run a scenario simulation with demand data (BOKU) DEADLINE 19TH DECEMBER 2014
6 Contact info100
Emilio Gonzalez egonzalezitenecom
Patricia Bellver pbellveritenecom
- Project SLOPE
- SLOPE WP 2 ndash Task 21
- Task 21 participants
- Task 21 general description
- GANTT
- Working on a case study
- RapidEye satellite imagery
- Task 21 expected output
- 1deg DRAFT D201 index
- Chapter 1 General view on remote sensing
- Chapter 2
- Other chapters are under costruction
- METHODOLOGY
- Slide Number 14
- Identification of Forest plantation on Google Earth
- Flight Plan uploaded to Auto Pilot in accordance with CAA IAA European Aviation Authority Regulations
- Data Acquisition and Processing
- Data Acquisition and Processing
- Data Acquisition and Processing DEM DTM DCM Crown Sizes Animated views
- Data Acquisition and Processing DEM DTM DCM Crown Sizes Animated views
- Data Acquisition amp Processing
- Example of Data to Follow
- Coastway ndash UAV and Payloads
- UAV
- Transport Case
- Payloads
- Slide Number 27
- Development by UAV manufacturer forAgricultural Mapping
- Questions
- Overall Progress of WP 2
- WP2 Tasks Completed Planning Recommendations
- Planning -Test Site Trento
- Test Site Flight Plan - Trento
- Trento Test Site UAV Launch and Landing Sites
- Presentation of Tasks Completed ndash Integration WP22
- Presentation of Tasks Completed ndash Integration WP22
- Tasks Completed ndash Data collection
- Ongoing Tasks
- TreeMetricsldquoPROVIDE MORE END PRODUCT FROM LESS TREESrdquo
- The Products
- The Products General Values
- The Problem - ldquoThe Collision of Interestsrdquo
- Maximise Value
- Maximise Value Sawlog Lengths
- Maximise Value Sawlog Lengths
- Maximise Value Sawlog Lengths
- Maximise Value Sawlog Lengths
- Maximise Value Sawlog Lengths
- Maximise Value Sawlog Lengths
- Harvester Optimisation
- Log Quality Straightness (Sweep) Taper Branching Rot
- Our Offering
- Slide Number 53
- Slide Number 54
- Slide Number 55
- Terrestrial Laser Scanning Forest Measurement System (AutoStem Forest)
- Slide Number 57
- Output From Field Survey
- Forest Valuation Online Data
- Current Forest Value
- Slide Number 61
- Latest Development
- Slide Number 63
- Outlook
- Objectives
- Scheduling
- Participants role
- Participants role
- Functions
- Two levels of abstraction
- Two levels of abstraction
- Timeline
- Platform Core
- Platform Core
- 3D Modelling for harvesting planning
- 3D Visualization Technologies
- Actions
- Thank you for your attention
- Project SLOPE
- 1 Task objectives
- 2 Approaches for sites location and flow allocation decisions
- 2 Approaches for sites location and flow allocation decisions
- 2 Approaches for sites location and flow allocation decisions
- 2 Approaches for sites location and flow allocation decisions
- 2 Approaches for sites location and flow allocation decisions
- 2 Approaches for sites location and flow allocation decisions
- 2 Approaches for sites location and flow allocation decisions
- 2 Approaches for sites location and flow allocation decisions
- 2 Approaches for sites location and flow allocation decisions
- 2 Approaches for sites location and flow allocation decisions
- 2 Approaches for sites location and flow allocation decisions
- 2 Approaches for sites location and flow allocation decisions
- 2 Approaches for sites location and flow allocation decisions
- 3 Approaches to estimate traffic in existing roads
- 3 Approaches to estimate traffic in existing roads
- 3 Approaches to estimate traffic in existing roads
- 4 Work done so far
- 4 Work done so far
- 5 Work plan
- 6 Contact info
-
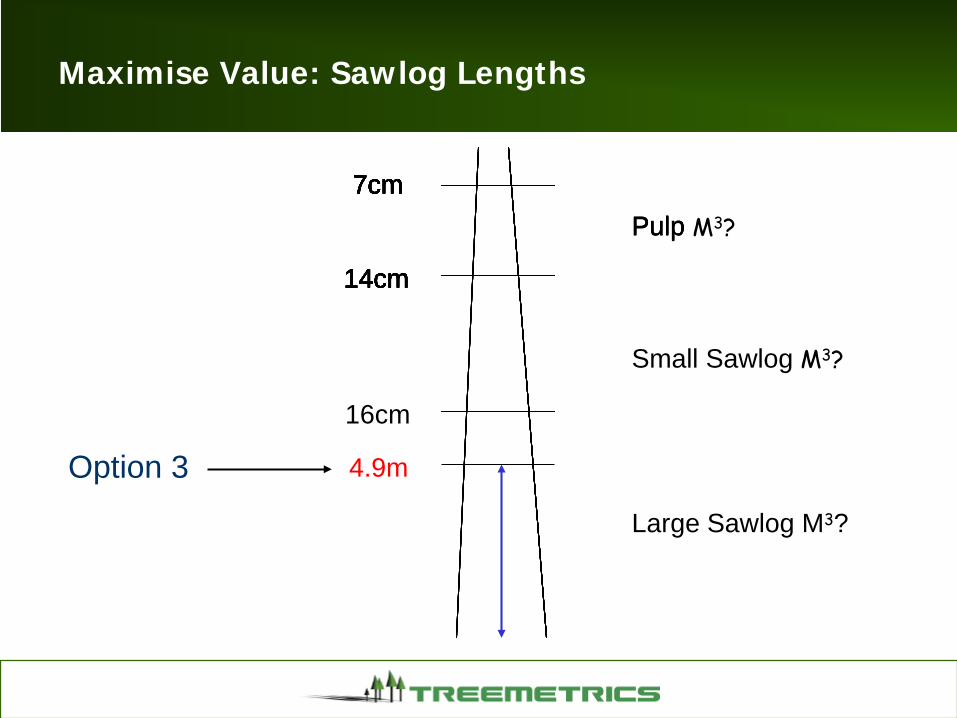
Maximise Value Sawlog Lengths
14cm
7cm
14cm
7cm
14cm
7cm
14cm
7cm
14cm
7cm
14cm
7cm
14cm
7cm
14cm
7cm
14cm
16cm
7cm7cmPulp
7cmPulpPulp M3
Large Sawlog M3
Small Sawlog M3
49mOption 3
Maximise Value Sawlog Lengths
14cm
7cm
14cm
7cm
14cm
7cm
14cm
7cm
14cm
7cm
14cm
7cm
14cm
7cm
14cm
7cm
14cm
16cm
7cm7cmPulp
7cmPulpPulp M3
Large Sawlog M3
Small Sawlog M3
49mOption 3
Harvester Optimisation
Log Quality Straightness (Sweep) Taper Branching Rot
Our Offering
Forest Mapper - First In The World ndash Online Forest Mapping amp Analysis - Data Management System
Forest Mapper Automated net area calculation stratification and Location for ground sample plots to be collected
Sample Plots
Net Area
Stratification
(Inventory Planning)
Supporting different field data collection tools GPS Calipers Vertex
Terrestrial Laser Scanning Forest Measurement System(AutoStem Forest)
Automated 3D Forest Measurement System
Trusted and Independent Data
Output From Field Survey
bull XYZ Position of each treebull Measurement Informationbull Speciesbull Other information
ndash Defectsndash etc
Forest Valuation Online Data
Current Forest Value
Mobile Field Survey App ndash Report Sharing -Interconnectivity
Latest Development
bull Online Market Placebull 15000 forest ownersbull Irish Farmers Association
Task 24 - 3D Modelling for harvesting planning
bull Objectives
bull Scheduling
bull Participants and roles
bull Overview and timeline
Outlook
Objectives
Task 24 Goal To generate and make accessible a detailedinteractive 3D model of the forest environment
The WPrsquos purpose is to develop methodologies and tools to fully describe terrain and stand characteristics in order to evaluate the accessibility for and efficiency of harvestingtechnologies in mountain forests
Scheduling
Start Month 7End Month 15Deliverable Harvest simulation tool based on 3D forest modelTotal MM 20Task leader GRAPHITECHParticipants CNR KESLA COAST BOKU GRE FLY TRE
Participants role
GRAPHITECH(10) Task Leader It has in charge the development of tool for representing the virtual 3D environment of the mountain forest as well as the of the virtual system on mobile and machine-mounted displays Finally it will be involved into the developmet of the solution for interactive cableway positioning
CNR(1) Definition of the ldquotechnology layersrdquo (ie harvest parameters) and methodologies to coordinate tree marking with the subsequent harvesting operations
KESLA(1) Acting as final user in order to simulate the behaivor of own machine into the virtual system
COAST(2) Provide the input model for the virtual system combining the information of task 21 22 and 23
Participants role
BOKU(2) it will be involved into definition of the ldquotechnology layersrdquo (ie harvestparameters) then on the developmet of the solution for interactive cablewaypositioning
GRE(1) Acting as final user in order to simulate the behaivor of own machine into the virtual system
FLY(1) Provide the input model for the virtual system combining the information of task 21 22 and 23
TRE(2) Development of the Forest WarehouseTM for mountain forestry and support the deployment of the virtual system
Functions
bull Forestry measurements estimationsThe platform will allow the combination of accurate tree profile information with up to date remote sensing data
bull Interactive system for cableway positioning simulation
bull Definition of the ldquotechnology layersrdquo (ie harvest parameters)Technological layers show technical limitations of machines and
equipment on different forest areas
bull Deployment of the virtual system on mobile and machine-mounted displays
Two levels of abstraction
1St Level 2D map accessingof forest and logisticinformation inlcudingCadastral Volume of timber accessibility
Where available the systemallow access to the SLOPE information system
Two levels of abstraction
2nd Level 3D map accessingof forest tree by tree featuresallowing interaction and simulation of cable cranepositioning
Timeline
Defining the first version of the 3D forest model Partner involved (TRE COAST FLY)
Interface to access to the FIS database including OGC services both for 2D and 3D (Task 51+BOKU)
Cable Crane simulation tool (GRE)
Final version
Platform Core
Using the remote data (Satellite UAVs orthophotos and digital surface model) combinedwith on field information (TLS) each single tree feature will be segmented including itsdeducted geometric properties
Task 21
Task 22
Task 23
3D forest modelVirtual 3D
environment
Platform CoreCanopy surface model Laser scanner point cloud Aerial amp satellite images
3D Modelling for harvesting planning
What Technologiy for 3D forest modelling
Realistic rendering Parametric model Point cloud visualization
3D Visualization Technologies
Approachesbull Desktop Visualization Platform
with Mobile Portingbull Web-Client Visualization
Platform
Desktop Platformbull Open-Source Library for 3d
visualization (OpenInventor Vtk Openscenegraph)
bull 3d Engine ( UdK IrrichlichtEngine Unity 3d)
Technologies
Web Client bull WebGL implementation of
OpenGL ES 20 for web programmable in JavaScript
bull Java Applet based on OpensourceGlobe Nasa World wind Cesioum
Actions
- Parallel session on WP2 tomorrow
- bi-weekly Skypewebex session
- Dedicated folder on consortium dropbox to share documentation
- Ftp area to exchange large testing datasets
Thank you for your attention
DR FEDERICO PRANDI
Federicoprandigraphitechit
Fondazione GraphitechVia Alla Cascata 56C38123 Trento (ITALY)
Phone +39 0461283394Fax +39 0461283398
Project SLOPE79
T 25 ndash Road and Logistic planning
Mikkeli 2nd-4th July 2014
1 Task objectives80
Task objectives
Build and validate and Optimization model to decide on optimal logistic network in a given forest area This means to calculate locations for buffer areas mills and processing plants routes and flows between nodes according to a forecast demand
Build and validate a Model to estimate traffic on individual sections for road maintenance and construction purposes in this forest area according to a forecasted demand
Grumes in Trento has been chosen as forest area for testing the models
To be developed from M8 (August 14) to M13 (January 15)
Includes development of ldquoD205 Road and logistic simulation modulerdquo
Due to Month 13
Partners involved
ITENE (leader) GRAPHITECH CNR BOKU FLY
2 Approaches for sites location and flow allocation decisions
81
The goal is to determine an optimal (minimum cost) forest logistic network to respond future demands
The approach should determine Location of facilities (normally from a set of posible sites) Size and capacity of facilities (storage areas and processing sites) Volume to harvest in every landing and stand area Volume of timber to transport from landings to facilities (it gives a first
estimation of road traffic for road planning) Routes to connect nodes
2 Approaches for sites location and flow allocation decisions
82
The model should consider inputs like
Forecast of future demand of timber Geographic characteristics of the area (Map distances slopes available
areas sizes coordinates hellip) Actual roads from forest to mills (forest accessibility) Map type hellip Amount and quality of available timber Possible location of millsbiomass areas and distance to the forest
(coordinates size) Dimension of the logs needed Individual costs related to transport infrastructures costs and others like
clearing meadows or watersides artificial anchors locking public roads
2 Approaches for sites location and flow allocation decisions
83
StandCable ways
forestlanes
2 Approaches for sites location and flow allocation decisions
84
minorroad
mainroad
land
land
land
stand
stand
stand
2 Approaches for sites location and flow allocation decisions
85
Solution flow
Possible flow
lands in forest storage and facilities (saw mills biomass)
2 Approaches for sites location and flow allocation decisions
86
Location of a single facility by center-of-gravity method Output XY coordinates for the facility Optimization based only on distances Binary model (source-sink) Useful for a first estimation of a facility location
to be supplied from specific lands
2 Approaches for sites location and flow allocation decisions
87
Location of selected number of facilities by the exact center-of-gravity method Output XY coordinates of a selected number
of facilities Optimization based only on distances Binary model (source-sink) Useful for a first estimation of 2 or more
facility locations to be supplied from specific lands
2 Approaches for sites location and flow allocation decisions
88
P-median multiple facility location Output selected facilities from a list of
candidate sites receiving flows from other sites Optimization based on transport costs and fix
costs but lack of capacity constrains and other inventory costs
Binary model (source-sink) Useful for a first estimation of 2 or more facility
locations to be supplied from specific lands
2 Approaches for sites location and flow allocation decisions
89
Mixed integer linear programming problem Output selected facilities and optimal flows
between nodes Optimization based on transport costs and fix
costs capacity constrains and inventory costs Three stages model More appropriate approach for a network with
more than 2 node types
lands in forest storage and facilities(saw mills biomass)
2 Approaches for sites location and flow allocation decisions
90
Dynamic linear programming Consider changing demand Output
Selected facilities Size an capacity of facilities (storage and processing sites) Volume of harvest in every landing and stand aacuterea Volume to transport
Timber from landings to facilities Product from facilities to demand sites
Decision to expand production capacity in a specific period in the planning horizon
Minimize total costs for timber supply and transport investment and operational costs product transport cost to demand sites fixed cost for capacity expansion
- 200 400 600 800
1000 1200
1 2 3 4 5 6 7
Period Demand Volume
lands in forest storage and facilities(saw mills biomass)
2 Approaches for sites location and flow allocation decisions
91
Previous Work
Facilities Location Models An Application for the Forest Production and Logistics
JUAN TRONCOSO T 1 RODRIGO GARRIDO H 2 XIMENA IBACACHE J 3
July 2002
1 Departamento de Ciencias Forestales Pontificia Universidad Catoacutelica de Chile Casilla 305 Correo 22 Santiago Chile E-mail jtroncotpuccl
2 Departamento de Ingenieriacutea de Transporte Pontificia Universidad Catoacutelica de Chile3 Escuela de Ingenieriacutea Forestal Universidad Mayor
2 Approaches for sites location and flow allocation decisions
92
INPUTS Demands of product per each period and type of quality from demand site
DATA COLLECTION FOR THE MODEL Positions of stands lands storage areas processing sites (saw paper mills and
biomass heating and power plants) demand sites Volume available to harvest in every stand per quality of timber and destination (saw
mill or energy) Position for stand respect existing roads Slope or grade of difficulty to access Capacity of ground to support specific machinery Size and availability of skyline deployment sites Capacity and location of storage areas and buffers and processing sites Characteristics of processing sites and conversion facilities Distances between different nodes
2 Approaches for sites location and flow allocation decisions
93
COST FACTORS supply and transport operational costs final product transport cost to demand sites fixed cost for capacity expansion during the planning horizon investment associated to construction of a new site
OUTPUT Selected facilities Size an capacity of facilities (storage and processing sites) Volume of harvest in every landing and stand aacuterea Volume to transport
Timber from landings to facilities
Product from facilities to demand sites
Decision to expand production capacity in a specific period in the planning horizon
3 Approaches to estimate traffic in existing roads
94
Once the different sites and locations have been selected and flows between sites have been determined for each future period
A Logistics Resource Planning Model will be used to determine the volume to harvest in every period in every land processing and transport means and a more precise estimation of traffic in every individual sections of road in terms of number of trip per vehicles type (size weight) in each period
This traffic estimation will allow to define plans for road maintenance and construction in the forest area taking into account the capability of roads to accept trucks and cranes of different weights and sizes
3 Approaches to estimate traffic in existing roads
95
Similarities to DRP method
Land 1
SITE Saw PlantX
City 1
Product demandHarvest orders
Land 2 City 2
3 Approaches to estimate traffic in existing roads
96
SITE Saw Plant X Minumum Batch (harvest) (m3period) 500 Lead time (number of periods) 1 Safety stock (m3) 200
Period 1 2 3 4 5 6 7 Demand Volume (m3) 400 500 600 1000 500 600 1000 Available Stock (m3) 700 300 300 200 200 200 100 100 Harvest recepcion (m3) - 500 500 1000 500 500 1000 Harvest order launch (m3) 500 500 1000 500 500 1000
Land 1 To harvest (m3) 500 500 1000 Available m3 in land 1 2000 1500 1000 -Size of vehicle (m3) 10 Number of vehicle trips size 10m3 50 50 100
land 2 To harvest (m3) - - - 500 500 1000 -Available m3 in land 1 3000 2500 2000 1000 1000 Size of vehicle (m3) 10 Number of vehicle trips size 10m3 50 50 100 -
97
4 Work done so far
1st virtual meeting (webex conference)ndash 16062014
Attendants Daniele and Giulio (GRAPHITEC) Gianni (CNR) Marco (FLYBY) Martin (BOKU) Patricia Emilio and Loli (ITENE)
Agenda Task 25 objectives description of subtasks and partner roles Decision on forest area as test scenario (Grumes Trento has been decided as test
forest area) Next steps and dates
98
4 Work done so far
Discussion tomorrow in the T25 technical session
Collect general info of Grumes forest area Map with locations and roads available characteristics facilities actors (owners) hellip
Review planning models used in the literature Identify and organize detailed Grumes forest data collection for
models
5 Work plan99
Choose a test scenario Done (Grumes Trento)
Collect general info of Grumes forest area Map with locations and roads available characteristics facilities owners willing to show interest give data demand scenario hellip (GRAPHITEC amp CNR) DEADLINE 15 JULY 2014
Review network opt models (BOKU) and traffic estimation models (CNR) used in the literature (CNR BOKUITENE) Conclusion Report DEADLINE 15 AUGUST 2014
Formulatedesign a Network optimization model for logistics site location and flow allocation decisions (BOKU) DEADLINE 30 SEPTEMBER 2014
Formulatedesign model to estimate traffic in existing roads (CNR) DEADLINE 30 SEPTEMBER 2014
Collect detailed Grumes forest data for models Costs model elements etc (ITENE GRAPHITEC CNR FLYBY) DEADLINE 31ST OCTOBER 2014
Data Elements integration with the global forest model (ITENE) DEADLINE 31ST OCTOBER 2014
Program the Optimization model to allocate landings with the mills and plants and traffic calculation on individual sections (BOKU) DEADLINE 14TH NOVEMBER 2014
Program the model for road planning based on the amount of timber to be transported and identification of traffic on existing forest infrastructure (BOKU) DEADLINE 28TH NOVEMBER 2014
Validate models and run a scenario simulation with demand data (BOKU) DEADLINE 19TH DECEMBER 2014
6 Contact info100
Emilio Gonzalez egonzalezitenecom
Patricia Bellver pbellveritenecom
- Project SLOPE
- SLOPE WP 2 ndash Task 21
- Task 21 participants
- Task 21 general description
- GANTT
- Working on a case study
- RapidEye satellite imagery
- Task 21 expected output
- 1deg DRAFT D201 index
- Chapter 1 General view on remote sensing
- Chapter 2
- Other chapters are under costruction
- METHODOLOGY
- Slide Number 14
- Identification of Forest plantation on Google Earth
- Flight Plan uploaded to Auto Pilot in accordance with CAA IAA European Aviation Authority Regulations
- Data Acquisition and Processing
- Data Acquisition and Processing
- Data Acquisition and Processing DEM DTM DCM Crown Sizes Animated views
- Data Acquisition and Processing DEM DTM DCM Crown Sizes Animated views
- Data Acquisition amp Processing
- Example of Data to Follow
- Coastway ndash UAV and Payloads
- UAV
- Transport Case
- Payloads
- Slide Number 27
- Development by UAV manufacturer forAgricultural Mapping
- Questions
- Overall Progress of WP 2
- WP2 Tasks Completed Planning Recommendations
- Planning -Test Site Trento
- Test Site Flight Plan - Trento
- Trento Test Site UAV Launch and Landing Sites
- Presentation of Tasks Completed ndash Integration WP22
- Presentation of Tasks Completed ndash Integration WP22
- Tasks Completed ndash Data collection
- Ongoing Tasks
- TreeMetricsldquoPROVIDE MORE END PRODUCT FROM LESS TREESrdquo
- The Products
- The Products General Values
- The Problem - ldquoThe Collision of Interestsrdquo
- Maximise Value
- Maximise Value Sawlog Lengths
- Maximise Value Sawlog Lengths
- Maximise Value Sawlog Lengths
- Maximise Value Sawlog Lengths
- Maximise Value Sawlog Lengths
- Maximise Value Sawlog Lengths
- Harvester Optimisation
- Log Quality Straightness (Sweep) Taper Branching Rot
- Our Offering
- Slide Number 53
- Slide Number 54
- Slide Number 55
- Terrestrial Laser Scanning Forest Measurement System (AutoStem Forest)
- Slide Number 57
- Output From Field Survey
- Forest Valuation Online Data
- Current Forest Value
- Slide Number 61
- Latest Development
- Slide Number 63
- Outlook
- Objectives
- Scheduling
- Participants role
- Participants role
- Functions
- Two levels of abstraction
- Two levels of abstraction
- Timeline
- Platform Core
- Platform Core
- 3D Modelling for harvesting planning
- 3D Visualization Technologies
- Actions
- Thank you for your attention
- Project SLOPE
- 1 Task objectives
- 2 Approaches for sites location and flow allocation decisions
- 2 Approaches for sites location and flow allocation decisions
- 2 Approaches for sites location and flow allocation decisions
- 2 Approaches for sites location and flow allocation decisions
- 2 Approaches for sites location and flow allocation decisions
- 2 Approaches for sites location and flow allocation decisions
- 2 Approaches for sites location and flow allocation decisions
- 2 Approaches for sites location and flow allocation decisions
- 2 Approaches for sites location and flow allocation decisions
- 2 Approaches for sites location and flow allocation decisions
- 2 Approaches for sites location and flow allocation decisions
- 2 Approaches for sites location and flow allocation decisions
- 2 Approaches for sites location and flow allocation decisions
- 3 Approaches to estimate traffic in existing roads
- 3 Approaches to estimate traffic in existing roads
- 3 Approaches to estimate traffic in existing roads
- 4 Work done so far
- 4 Work done so far
- 5 Work plan
- 6 Contact info
-

Maximise Value Sawlog Lengths
14cm
7cm
14cm
7cm
14cm
7cm
14cm
7cm
14cm
7cm
14cm
7cm
14cm
7cm
14cm
7cm
14cm
16cm
7cm7cmPulp
7cmPulpPulp M3
Large Sawlog M3
Small Sawlog M3
49mOption 3
Harvester Optimisation
Log Quality Straightness (Sweep) Taper Branching Rot
Our Offering
Forest Mapper - First In The World ndash Online Forest Mapping amp Analysis - Data Management System
Forest Mapper Automated net area calculation stratification and Location for ground sample plots to be collected
Sample Plots
Net Area
Stratification
(Inventory Planning)
Supporting different field data collection tools GPS Calipers Vertex
Terrestrial Laser Scanning Forest Measurement System(AutoStem Forest)
Automated 3D Forest Measurement System
Trusted and Independent Data
Output From Field Survey
bull XYZ Position of each treebull Measurement Informationbull Speciesbull Other information
ndash Defectsndash etc
Forest Valuation Online Data
Current Forest Value
Mobile Field Survey App ndash Report Sharing -Interconnectivity
Latest Development
bull Online Market Placebull 15000 forest ownersbull Irish Farmers Association
Task 24 - 3D Modelling for harvesting planning
bull Objectives
bull Scheduling
bull Participants and roles
bull Overview and timeline
Outlook
Objectives
Task 24 Goal To generate and make accessible a detailedinteractive 3D model of the forest environment
The WPrsquos purpose is to develop methodologies and tools to fully describe terrain and stand characteristics in order to evaluate the accessibility for and efficiency of harvestingtechnologies in mountain forests
Scheduling
Start Month 7End Month 15Deliverable Harvest simulation tool based on 3D forest modelTotal MM 20Task leader GRAPHITECHParticipants CNR KESLA COAST BOKU GRE FLY TRE
Participants role
GRAPHITECH(10) Task Leader It has in charge the development of tool for representing the virtual 3D environment of the mountain forest as well as the of the virtual system on mobile and machine-mounted displays Finally it will be involved into the developmet of the solution for interactive cableway positioning
CNR(1) Definition of the ldquotechnology layersrdquo (ie harvest parameters) and methodologies to coordinate tree marking with the subsequent harvesting operations
KESLA(1) Acting as final user in order to simulate the behaivor of own machine into the virtual system
COAST(2) Provide the input model for the virtual system combining the information of task 21 22 and 23
Participants role
BOKU(2) it will be involved into definition of the ldquotechnology layersrdquo (ie harvestparameters) then on the developmet of the solution for interactive cablewaypositioning
GRE(1) Acting as final user in order to simulate the behaivor of own machine into the virtual system
FLY(1) Provide the input model for the virtual system combining the information of task 21 22 and 23
TRE(2) Development of the Forest WarehouseTM for mountain forestry and support the deployment of the virtual system
Functions
bull Forestry measurements estimationsThe platform will allow the combination of accurate tree profile information with up to date remote sensing data
bull Interactive system for cableway positioning simulation
bull Definition of the ldquotechnology layersrdquo (ie harvest parameters)Technological layers show technical limitations of machines and
equipment on different forest areas
bull Deployment of the virtual system on mobile and machine-mounted displays
Two levels of abstraction
1St Level 2D map accessingof forest and logisticinformation inlcudingCadastral Volume of timber accessibility
Where available the systemallow access to the SLOPE information system
Two levels of abstraction
2nd Level 3D map accessingof forest tree by tree featuresallowing interaction and simulation of cable cranepositioning
Timeline
Defining the first version of the 3D forest model Partner involved (TRE COAST FLY)
Interface to access to the FIS database including OGC services both for 2D and 3D (Task 51+BOKU)
Cable Crane simulation tool (GRE)
Final version
Platform Core
Using the remote data (Satellite UAVs orthophotos and digital surface model) combinedwith on field information (TLS) each single tree feature will be segmented including itsdeducted geometric properties
Task 21
Task 22
Task 23
3D forest modelVirtual 3D
environment
Platform CoreCanopy surface model Laser scanner point cloud Aerial amp satellite images
3D Modelling for harvesting planning
What Technologiy for 3D forest modelling
Realistic rendering Parametric model Point cloud visualization
3D Visualization Technologies
Approachesbull Desktop Visualization Platform
with Mobile Portingbull Web-Client Visualization
Platform
Desktop Platformbull Open-Source Library for 3d
visualization (OpenInventor Vtk Openscenegraph)
bull 3d Engine ( UdK IrrichlichtEngine Unity 3d)
Technologies
Web Client bull WebGL implementation of
OpenGL ES 20 for web programmable in JavaScript
bull Java Applet based on OpensourceGlobe Nasa World wind Cesioum
Actions
- Parallel session on WP2 tomorrow
- bi-weekly Skypewebex session
- Dedicated folder on consortium dropbox to share documentation
- Ftp area to exchange large testing datasets
Thank you for your attention
DR FEDERICO PRANDI
Federicoprandigraphitechit
Fondazione GraphitechVia Alla Cascata 56C38123 Trento (ITALY)
Phone +39 0461283394Fax +39 0461283398
Project SLOPE79
T 25 ndash Road and Logistic planning
Mikkeli 2nd-4th July 2014
1 Task objectives80
Task objectives
Build and validate and Optimization model to decide on optimal logistic network in a given forest area This means to calculate locations for buffer areas mills and processing plants routes and flows between nodes according to a forecast demand
Build and validate a Model to estimate traffic on individual sections for road maintenance and construction purposes in this forest area according to a forecasted demand
Grumes in Trento has been chosen as forest area for testing the models
To be developed from M8 (August 14) to M13 (January 15)
Includes development of ldquoD205 Road and logistic simulation modulerdquo
Due to Month 13
Partners involved
ITENE (leader) GRAPHITECH CNR BOKU FLY
2 Approaches for sites location and flow allocation decisions
81
The goal is to determine an optimal (minimum cost) forest logistic network to respond future demands
The approach should determine Location of facilities (normally from a set of posible sites) Size and capacity of facilities (storage areas and processing sites) Volume to harvest in every landing and stand area Volume of timber to transport from landings to facilities (it gives a first
estimation of road traffic for road planning) Routes to connect nodes
2 Approaches for sites location and flow allocation decisions
82
The model should consider inputs like
Forecast of future demand of timber Geographic characteristics of the area (Map distances slopes available
areas sizes coordinates hellip) Actual roads from forest to mills (forest accessibility) Map type hellip Amount and quality of available timber Possible location of millsbiomass areas and distance to the forest
(coordinates size) Dimension of the logs needed Individual costs related to transport infrastructures costs and others like
clearing meadows or watersides artificial anchors locking public roads
2 Approaches for sites location and flow allocation decisions
83
StandCable ways
forestlanes
2 Approaches for sites location and flow allocation decisions
84
minorroad
mainroad
land
land
land
stand
stand
stand
2 Approaches for sites location and flow allocation decisions
85
Solution flow
Possible flow
lands in forest storage and facilities (saw mills biomass)
2 Approaches for sites location and flow allocation decisions
86
Location of a single facility by center-of-gravity method Output XY coordinates for the facility Optimization based only on distances Binary model (source-sink) Useful for a first estimation of a facility location
to be supplied from specific lands
2 Approaches for sites location and flow allocation decisions
87
Location of selected number of facilities by the exact center-of-gravity method Output XY coordinates of a selected number
of facilities Optimization based only on distances Binary model (source-sink) Useful for a first estimation of 2 or more
facility locations to be supplied from specific lands
2 Approaches for sites location and flow allocation decisions
88
P-median multiple facility location Output selected facilities from a list of
candidate sites receiving flows from other sites Optimization based on transport costs and fix
costs but lack of capacity constrains and other inventory costs
Binary model (source-sink) Useful for a first estimation of 2 or more facility
locations to be supplied from specific lands
2 Approaches for sites location and flow allocation decisions
89
Mixed integer linear programming problem Output selected facilities and optimal flows
between nodes Optimization based on transport costs and fix
costs capacity constrains and inventory costs Three stages model More appropriate approach for a network with
more than 2 node types
lands in forest storage and facilities(saw mills biomass)
2 Approaches for sites location and flow allocation decisions
90
Dynamic linear programming Consider changing demand Output
Selected facilities Size an capacity of facilities (storage and processing sites) Volume of harvest in every landing and stand aacuterea Volume to transport
Timber from landings to facilities Product from facilities to demand sites
Decision to expand production capacity in a specific period in the planning horizon
Minimize total costs for timber supply and transport investment and operational costs product transport cost to demand sites fixed cost for capacity expansion
- 200 400 600 800
1000 1200
1 2 3 4 5 6 7
Period Demand Volume
lands in forest storage and facilities(saw mills biomass)
2 Approaches for sites location and flow allocation decisions
91
Previous Work
Facilities Location Models An Application for the Forest Production and Logistics
JUAN TRONCOSO T 1 RODRIGO GARRIDO H 2 XIMENA IBACACHE J 3
July 2002
1 Departamento de Ciencias Forestales Pontificia Universidad Catoacutelica de Chile Casilla 305 Correo 22 Santiago Chile E-mail jtroncotpuccl
2 Departamento de Ingenieriacutea de Transporte Pontificia Universidad Catoacutelica de Chile3 Escuela de Ingenieriacutea Forestal Universidad Mayor
2 Approaches for sites location and flow allocation decisions
92
INPUTS Demands of product per each period and type of quality from demand site
DATA COLLECTION FOR THE MODEL Positions of stands lands storage areas processing sites (saw paper mills and
biomass heating and power plants) demand sites Volume available to harvest in every stand per quality of timber and destination (saw
mill or energy) Position for stand respect existing roads Slope or grade of difficulty to access Capacity of ground to support specific machinery Size and availability of skyline deployment sites Capacity and location of storage areas and buffers and processing sites Characteristics of processing sites and conversion facilities Distances between different nodes
2 Approaches for sites location and flow allocation decisions
93
COST FACTORS supply and transport operational costs final product transport cost to demand sites fixed cost for capacity expansion during the planning horizon investment associated to construction of a new site
OUTPUT Selected facilities Size an capacity of facilities (storage and processing sites) Volume of harvest in every landing and stand aacuterea Volume to transport
Timber from landings to facilities
Product from facilities to demand sites
Decision to expand production capacity in a specific period in the planning horizon
3 Approaches to estimate traffic in existing roads
94
Once the different sites and locations have been selected and flows between sites have been determined for each future period
A Logistics Resource Planning Model will be used to determine the volume to harvest in every period in every land processing and transport means and a more precise estimation of traffic in every individual sections of road in terms of number of trip per vehicles type (size weight) in each period
This traffic estimation will allow to define plans for road maintenance and construction in the forest area taking into account the capability of roads to accept trucks and cranes of different weights and sizes
3 Approaches to estimate traffic in existing roads
95
Similarities to DRP method
Land 1
SITE Saw PlantX
City 1
Product demandHarvest orders
Land 2 City 2
3 Approaches to estimate traffic in existing roads
96
SITE Saw Plant X Minumum Batch (harvest) (m3period) 500 Lead time (number of periods) 1 Safety stock (m3) 200
Period 1 2 3 4 5 6 7 Demand Volume (m3) 400 500 600 1000 500 600 1000 Available Stock (m3) 700 300 300 200 200 200 100 100 Harvest recepcion (m3) - 500 500 1000 500 500 1000 Harvest order launch (m3) 500 500 1000 500 500 1000
Land 1 To harvest (m3) 500 500 1000 Available m3 in land 1 2000 1500 1000 -Size of vehicle (m3) 10 Number of vehicle trips size 10m3 50 50 100
land 2 To harvest (m3) - - - 500 500 1000 -Available m3 in land 1 3000 2500 2000 1000 1000 Size of vehicle (m3) 10 Number of vehicle trips size 10m3 50 50 100 -
97
4 Work done so far
1st virtual meeting (webex conference)ndash 16062014
Attendants Daniele and Giulio (GRAPHITEC) Gianni (CNR) Marco (FLYBY) Martin (BOKU) Patricia Emilio and Loli (ITENE)
Agenda Task 25 objectives description of subtasks and partner roles Decision on forest area as test scenario (Grumes Trento has been decided as test
forest area) Next steps and dates
98
4 Work done so far
Discussion tomorrow in the T25 technical session
Collect general info of Grumes forest area Map with locations and roads available characteristics facilities actors (owners) hellip
Review planning models used in the literature Identify and organize detailed Grumes forest data collection for
models
5 Work plan99
Choose a test scenario Done (Grumes Trento)
Collect general info of Grumes forest area Map with locations and roads available characteristics facilities owners willing to show interest give data demand scenario hellip (GRAPHITEC amp CNR) DEADLINE 15 JULY 2014
Review network opt models (BOKU) and traffic estimation models (CNR) used in the literature (CNR BOKUITENE) Conclusion Report DEADLINE 15 AUGUST 2014
Formulatedesign a Network optimization model for logistics site location and flow allocation decisions (BOKU) DEADLINE 30 SEPTEMBER 2014
Formulatedesign model to estimate traffic in existing roads (CNR) DEADLINE 30 SEPTEMBER 2014
Collect detailed Grumes forest data for models Costs model elements etc (ITENE GRAPHITEC CNR FLYBY) DEADLINE 31ST OCTOBER 2014
Data Elements integration with the global forest model (ITENE) DEADLINE 31ST OCTOBER 2014
Program the Optimization model to allocate landings with the mills and plants and traffic calculation on individual sections (BOKU) DEADLINE 14TH NOVEMBER 2014
Program the model for road planning based on the amount of timber to be transported and identification of traffic on existing forest infrastructure (BOKU) DEADLINE 28TH NOVEMBER 2014
Validate models and run a scenario simulation with demand data (BOKU) DEADLINE 19TH DECEMBER 2014
6 Contact info100
Emilio Gonzalez egonzalezitenecom
Patricia Bellver pbellveritenecom
- Project SLOPE
- SLOPE WP 2 ndash Task 21
- Task 21 participants
- Task 21 general description
- GANTT
- Working on a case study
- RapidEye satellite imagery
- Task 21 expected output
- 1deg DRAFT D201 index
- Chapter 1 General view on remote sensing
- Chapter 2
- Other chapters are under costruction
- METHODOLOGY
- Slide Number 14
- Identification of Forest plantation on Google Earth
- Flight Plan uploaded to Auto Pilot in accordance with CAA IAA European Aviation Authority Regulations
- Data Acquisition and Processing
- Data Acquisition and Processing
- Data Acquisition and Processing DEM DTM DCM Crown Sizes Animated views
- Data Acquisition and Processing DEM DTM DCM Crown Sizes Animated views
- Data Acquisition amp Processing
- Example of Data to Follow
- Coastway ndash UAV and Payloads
- UAV
- Transport Case
- Payloads
- Slide Number 27
- Development by UAV manufacturer forAgricultural Mapping
- Questions
- Overall Progress of WP 2
- WP2 Tasks Completed Planning Recommendations
- Planning -Test Site Trento
- Test Site Flight Plan - Trento
- Trento Test Site UAV Launch and Landing Sites
- Presentation of Tasks Completed ndash Integration WP22
- Presentation of Tasks Completed ndash Integration WP22
- Tasks Completed ndash Data collection
- Ongoing Tasks
- TreeMetricsldquoPROVIDE MORE END PRODUCT FROM LESS TREESrdquo
- The Products
- The Products General Values
- The Problem - ldquoThe Collision of Interestsrdquo
- Maximise Value
- Maximise Value Sawlog Lengths
- Maximise Value Sawlog Lengths
- Maximise Value Sawlog Lengths
- Maximise Value Sawlog Lengths
- Maximise Value Sawlog Lengths
- Maximise Value Sawlog Lengths
- Harvester Optimisation
- Log Quality Straightness (Sweep) Taper Branching Rot
- Our Offering
- Slide Number 53
- Slide Number 54
- Slide Number 55
- Terrestrial Laser Scanning Forest Measurement System (AutoStem Forest)
- Slide Number 57
- Output From Field Survey
- Forest Valuation Online Data
- Current Forest Value
- Slide Number 61
- Latest Development
- Slide Number 63
- Outlook
- Objectives
- Scheduling
- Participants role
- Participants role
- Functions
- Two levels of abstraction
- Two levels of abstraction
- Timeline
- Platform Core
- Platform Core
- 3D Modelling for harvesting planning
- 3D Visualization Technologies
- Actions
- Thank you for your attention
- Project SLOPE
- 1 Task objectives
- 2 Approaches for sites location and flow allocation decisions
- 2 Approaches for sites location and flow allocation decisions
- 2 Approaches for sites location and flow allocation decisions
- 2 Approaches for sites location and flow allocation decisions
- 2 Approaches for sites location and flow allocation decisions
- 2 Approaches for sites location and flow allocation decisions
- 2 Approaches for sites location and flow allocation decisions
- 2 Approaches for sites location and flow allocation decisions
- 2 Approaches for sites location and flow allocation decisions
- 2 Approaches for sites location and flow allocation decisions
- 2 Approaches for sites location and flow allocation decisions
- 2 Approaches for sites location and flow allocation decisions
- 2 Approaches for sites location and flow allocation decisions
- 3 Approaches to estimate traffic in existing roads
- 3 Approaches to estimate traffic in existing roads
- 3 Approaches to estimate traffic in existing roads
- 4 Work done so far
- 4 Work done so far
- 5 Work plan
- 6 Contact info
-
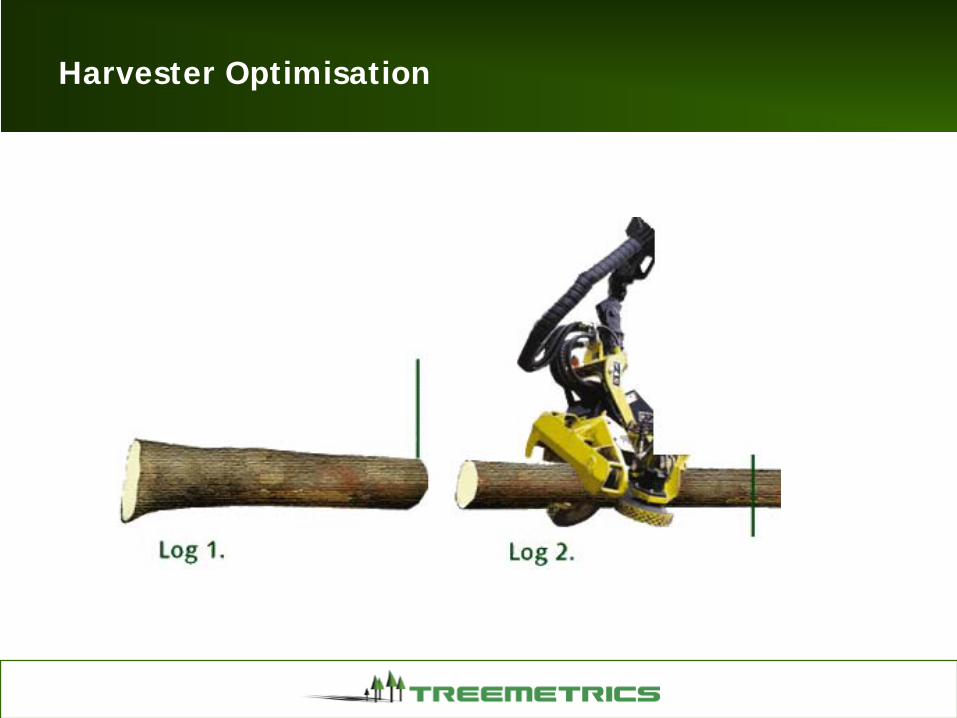
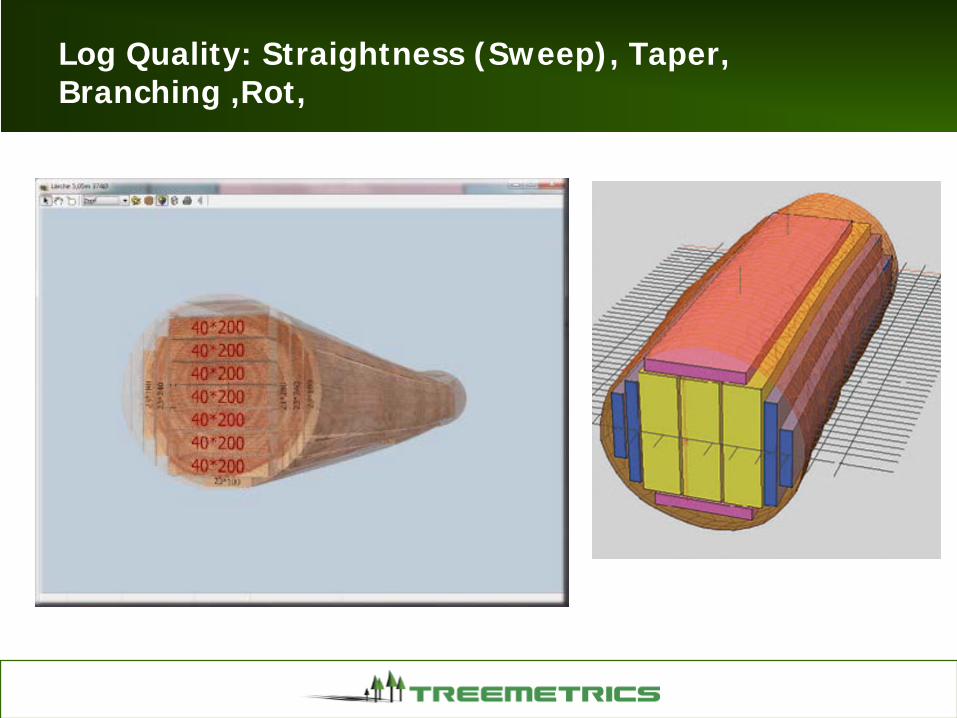
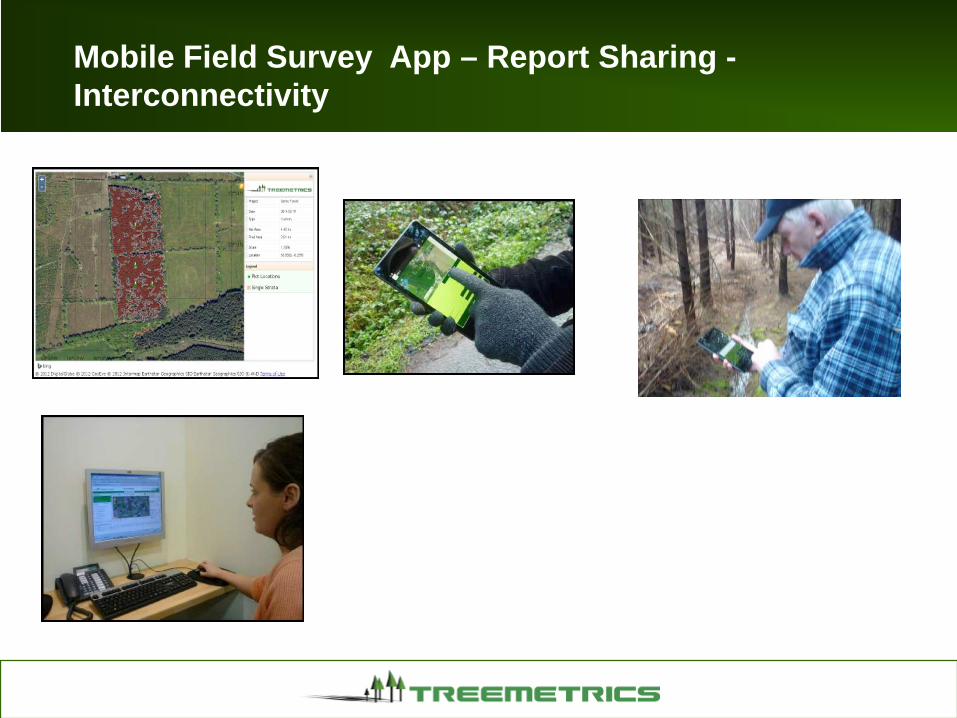

Participants role
BOKU(2) it will be involved into definition of the ldquotechnology layersrdquo (ie harvestparameters) then on the developmet of the solution for interactive cablewaypositioning
GRE(1) Acting as final user in order to simulate the behaivor of own machine into the virtual system
FLY(1) Provide the input model for the virtual system combining the information of task 21 22 and 23
TRE(2) Development of the Forest WarehouseTM for mountain forestry and support the deployment of the virtual system
Functions
bull Forestry measurements estimationsThe platform will allow the combination of accurate tree profile information with up to date remote sensing data
bull Interactive system for cableway positioning simulation
bull Definition of the ldquotechnology layersrdquo (ie harvest parameters)Technological layers show technical limitations of machines and
equipment on different forest areas
bull Deployment of the virtual system on mobile and machine-mounted displays
Two levels of abstraction
1St Level 2D map accessingof forest and logisticinformation inlcudingCadastral Volume of timber accessibility
Where available the systemallow access to the SLOPE information system
Two levels of abstraction
2nd Level 3D map accessingof forest tree by tree featuresallowing interaction and simulation of cable cranepositioning
Timeline
Defining the first version of the 3D forest model Partner involved (TRE COAST FLY)
Interface to access to the FIS database including OGC services both for 2D and 3D (Task 51+BOKU)
Cable Crane simulation tool (GRE)
Final version
Platform Core
Using the remote data (Satellite UAVs orthophotos and digital surface model) combinedwith on field information (TLS) each single tree feature will be segmented including itsdeducted geometric properties
Task 21
Task 22
Task 23
3D forest modelVirtual 3D
environment
Platform CoreCanopy surface model Laser scanner point cloud Aerial amp satellite images
3D Modelling for harvesting planning
What Technologiy for 3D forest modelling
Realistic rendering Parametric model Point cloud visualization
3D Visualization Technologies
Approachesbull Desktop Visualization Platform
with Mobile Portingbull Web-Client Visualization
Platform
Desktop Platformbull Open-Source Library for 3d
visualization (OpenInventor Vtk Openscenegraph)
bull 3d Engine ( UdK IrrichlichtEngine Unity 3d)
Technologies
Web Client bull WebGL implementation of
OpenGL ES 20 for web programmable in JavaScript
bull Java Applet based on OpensourceGlobe Nasa World wind Cesioum
Actions
- Parallel session on WP2 tomorrow
- bi-weekly Skypewebex session
- Dedicated folder on consortium dropbox to share documentation
- Ftp area to exchange large testing datasets
Thank you for your attention
DR FEDERICO PRANDI
Federicoprandigraphitechit
Fondazione GraphitechVia Alla Cascata 56C38123 Trento (ITALY)
Phone +39 0461283394Fax +39 0461283398
Project SLOPE79
T 25 ndash Road and Logistic planning
Mikkeli 2nd-4th July 2014
1 Task objectives80
Task objectives
Build and validate and Optimization model to decide on optimal logistic network in a given forest area This means to calculate locations for buffer areas mills and processing plants routes and flows between nodes according to a forecast demand
Build and validate a Model to estimate traffic on individual sections for road maintenance and construction purposes in this forest area according to a forecasted demand
Grumes in Trento has been chosen as forest area for testing the models
To be developed from M8 (August 14) to M13 (January 15)
Includes development of ldquoD205 Road and logistic simulation modulerdquo
Due to Month 13
Partners involved
ITENE (leader) GRAPHITECH CNR BOKU FLY
2 Approaches for sites location and flow allocation decisions
81
The goal is to determine an optimal (minimum cost) forest logistic network to respond future demands
The approach should determine Location of facilities (normally from a set of posible sites) Size and capacity of facilities (storage areas and processing sites) Volume to harvest in every landing and stand area Volume of timber to transport from landings to facilities (it gives a first
estimation of road traffic for road planning) Routes to connect nodes
2 Approaches for sites location and flow allocation decisions
82
The model should consider inputs like
Forecast of future demand of timber Geographic characteristics of the area (Map distances slopes available
areas sizes coordinates hellip) Actual roads from forest to mills (forest accessibility) Map type hellip Amount and quality of available timber Possible location of millsbiomass areas and distance to the forest
(coordinates size) Dimension of the logs needed Individual costs related to transport infrastructures costs and others like
clearing meadows or watersides artificial anchors locking public roads
2 Approaches for sites location and flow allocation decisions
83
StandCable ways
forestlanes
2 Approaches for sites location and flow allocation decisions
84
minorroad
mainroad
land
land
land
stand
stand
stand
2 Approaches for sites location and flow allocation decisions
85
Solution flow
Possible flow
lands in forest storage and facilities (saw mills biomass)
2 Approaches for sites location and flow allocation decisions
86
Location of a single facility by center-of-gravity method Output XY coordinates for the facility Optimization based only on distances Binary model (source-sink) Useful for a first estimation of a facility location
to be supplied from specific lands
2 Approaches for sites location and flow allocation decisions
87
Location of selected number of facilities by the exact center-of-gravity method Output XY coordinates of a selected number
of facilities Optimization based only on distances Binary model (source-sink) Useful for a first estimation of 2 or more
facility locations to be supplied from specific lands
2 Approaches for sites location and flow allocation decisions
88
P-median multiple facility location Output selected facilities from a list of
candidate sites receiving flows from other sites Optimization based on transport costs and fix
costs but lack of capacity constrains and other inventory costs
Binary model (source-sink) Useful for a first estimation of 2 or more facility
locations to be supplied from specific lands
2 Approaches for sites location and flow allocation decisions
89
Mixed integer linear programming problem Output selected facilities and optimal flows
between nodes Optimization based on transport costs and fix
costs capacity constrains and inventory costs Three stages model More appropriate approach for a network with
more than 2 node types
lands in forest storage and facilities(saw mills biomass)
2 Approaches for sites location and flow allocation decisions
90
Dynamic linear programming Consider changing demand Output
Selected facilities Size an capacity of facilities (storage and processing sites) Volume of harvest in every landing and stand aacuterea Volume to transport
Timber from landings to facilities Product from facilities to demand sites
Decision to expand production capacity in a specific period in the planning horizon
Minimize total costs for timber supply and transport investment and operational costs product transport cost to demand sites fixed cost for capacity expansion
- 200 400 600 800
1000 1200
1 2 3 4 5 6 7
Period Demand Volume
lands in forest storage and facilities(saw mills biomass)
2 Approaches for sites location and flow allocation decisions
91
Previous Work
Facilities Location Models An Application for the Forest Production and Logistics
JUAN TRONCOSO T 1 RODRIGO GARRIDO H 2 XIMENA IBACACHE J 3
July 2002
1 Departamento de Ciencias Forestales Pontificia Universidad Catoacutelica de Chile Casilla 305 Correo 22 Santiago Chile E-mail jtroncotpuccl
2 Departamento de Ingenieriacutea de Transporte Pontificia Universidad Catoacutelica de Chile3 Escuela de Ingenieriacutea Forestal Universidad Mayor
2 Approaches for sites location and flow allocation decisions
92
INPUTS Demands of product per each period and type of quality from demand site
DATA COLLECTION FOR THE MODEL Positions of stands lands storage areas processing sites (saw paper mills and
biomass heating and power plants) demand sites Volume available to harvest in every stand per quality of timber and destination (saw
mill or energy) Position for stand respect existing roads Slope or grade of difficulty to access Capacity of ground to support specific machinery Size and availability of skyline deployment sites Capacity and location of storage areas and buffers and processing sites Characteristics of processing sites and conversion facilities Distances between different nodes
2 Approaches for sites location and flow allocation decisions
93
COST FACTORS supply and transport operational costs final product transport cost to demand sites fixed cost for capacity expansion during the planning horizon investment associated to construction of a new site
OUTPUT Selected facilities Size an capacity of facilities (storage and processing sites) Volume of harvest in every landing and stand aacuterea Volume to transport
Timber from landings to facilities
Product from facilities to demand sites
Decision to expand production capacity in a specific period in the planning horizon
3 Approaches to estimate traffic in existing roads
94
Once the different sites and locations have been selected and flows between sites have been determined for each future period
A Logistics Resource Planning Model will be used to determine the volume to harvest in every period in every land processing and transport means and a more precise estimation of traffic in every individual sections of road in terms of number of trip per vehicles type (size weight) in each period
This traffic estimation will allow to define plans for road maintenance and construction in the forest area taking into account the capability of roads to accept trucks and cranes of different weights and sizes
3 Approaches to estimate traffic in existing roads
95
Similarities to DRP method
Land 1
SITE Saw PlantX
City 1
Product demandHarvest orders
Land 2 City 2
3 Approaches to estimate traffic in existing roads
96
SITE Saw Plant X Minumum Batch (harvest) (m3period) 500 Lead time (number of periods) 1 Safety stock (m3) 200
Period 1 2 3 4 5 6 7 Demand Volume (m3) 400 500 600 1000 500 600 1000 Available Stock (m3) 700 300 300 200 200 200 100 100 Harvest recepcion (m3) - 500 500 1000 500 500 1000 Harvest order launch (m3) 500 500 1000 500 500 1000
Land 1 To harvest (m3) 500 500 1000 Available m3 in land 1 2000 1500 1000 -Size of vehicle (m3) 10 Number of vehicle trips size 10m3 50 50 100
land 2 To harvest (m3) - - - 500 500 1000 -Available m3 in land 1 3000 2500 2000 1000 1000 Size of vehicle (m3) 10 Number of vehicle trips size 10m3 50 50 100 -
97
4 Work done so far
1st virtual meeting (webex conference)ndash 16062014
Attendants Daniele and Giulio (GRAPHITEC) Gianni (CNR) Marco (FLYBY) Martin (BOKU) Patricia Emilio and Loli (ITENE)
Agenda Task 25 objectives description of subtasks and partner roles Decision on forest area as test scenario (Grumes Trento has been decided as test
forest area) Next steps and dates
98
4 Work done so far
Discussion tomorrow in the T25 technical session
Collect general info of Grumes forest area Map with locations and roads available characteristics facilities actors (owners) hellip
Review planning models used in the literature Identify and organize detailed Grumes forest data collection for
models
5 Work plan99
Choose a test scenario Done (Grumes Trento)
Collect general info of Grumes forest area Map with locations and roads available characteristics facilities owners willing to show interest give data demand scenario hellip (GRAPHITEC amp CNR) DEADLINE 15 JULY 2014
Review network opt models (BOKU) and traffic estimation models (CNR) used in the literature (CNR BOKUITENE) Conclusion Report DEADLINE 15 AUGUST 2014
Formulatedesign a Network optimization model for logistics site location and flow allocation decisions (BOKU) DEADLINE 30 SEPTEMBER 2014
Formulatedesign model to estimate traffic in existing roads (CNR) DEADLINE 30 SEPTEMBER 2014
Collect detailed Grumes forest data for models Costs model elements etc (ITENE GRAPHITEC CNR FLYBY) DEADLINE 31ST OCTOBER 2014
Data Elements integration with the global forest model (ITENE) DEADLINE 31ST OCTOBER 2014
Program the Optimization model to allocate landings with the mills and plants and traffic calculation on individual sections (BOKU) DEADLINE 14TH NOVEMBER 2014
Program the model for road planning based on the amount of timber to be transported and identification of traffic on existing forest infrastructure (BOKU) DEADLINE 28TH NOVEMBER 2014
Validate models and run a scenario simulation with demand data (BOKU) DEADLINE 19TH DECEMBER 2014
6 Contact info100
Emilio Gonzalez egonzalezitenecom
Patricia Bellver pbellveritenecom
- Project SLOPE
- SLOPE WP 2 ndash Task 21
- Task 21 participants
- Task 21 general description
- GANTT
- Working on a case study
- RapidEye satellite imagery
- Task 21 expected output
- 1deg DRAFT D201 index
- Chapter 1 General view on remote sensing
- Chapter 2
- Other chapters are under costruction
- METHODOLOGY
- Slide Number 14
- Identification of Forest plantation on Google Earth
- Flight Plan uploaded to Auto Pilot in accordance with CAA IAA European Aviation Authority Regulations
- Data Acquisition and Processing
- Data Acquisition and Processing
- Data Acquisition and Processing DEM DTM DCM Crown Sizes Animated views
- Data Acquisition and Processing DEM DTM DCM Crown Sizes Animated views
- Data Acquisition amp Processing
- Example of Data to Follow
- Coastway ndash UAV and Payloads
- UAV
- Transport Case
- Payloads
- Slide Number 27
- Development by UAV manufacturer forAgricultural Mapping
- Questions
- Overall Progress of WP 2
- WP2 Tasks Completed Planning Recommendations
- Planning -Test Site Trento
- Test Site Flight Plan - Trento
- Trento Test Site UAV Launch and Landing Sites
- Presentation of Tasks Completed ndash Integration WP22
- Presentation of Tasks Completed ndash Integration WP22
- Tasks Completed ndash Data collection
- Ongoing Tasks
- TreeMetricsldquoPROVIDE MORE END PRODUCT FROM LESS TREESrdquo
- The Products
- The Products General Values
- The Problem - ldquoThe Collision of Interestsrdquo
- Maximise Value
- Maximise Value Sawlog Lengths
- Maximise Value Sawlog Lengths
- Maximise Value Sawlog Lengths
- Maximise Value Sawlog Lengths
- Maximise Value Sawlog Lengths
- Maximise Value Sawlog Lengths
- Harvester Optimisation
- Log Quality Straightness (Sweep) Taper Branching Rot
- Our Offering
- Slide Number 53
- Slide Number 54
- Slide Number 55
- Terrestrial Laser Scanning Forest Measurement System (AutoStem Forest)
- Slide Number 57
- Output From Field Survey
- Forest Valuation Online Data
- Current Forest Value
- Slide Number 61
- Latest Development
- Slide Number 63
- Outlook
- Objectives
- Scheduling
- Participants role
- Participants role
- Functions
- Two levels of abstraction
- Two levels of abstraction
- Timeline
- Platform Core
- Platform Core
- 3D Modelling for harvesting planning
- 3D Visualization Technologies
- Actions
- Thank you for your attention
- Project SLOPE
- 1 Task objectives
- 2 Approaches for sites location and flow allocation decisions
- 2 Approaches for sites location and flow allocation decisions
- 2 Approaches for sites location and flow allocation decisions
- 2 Approaches for sites location and flow allocation decisions
- 2 Approaches for sites location and flow allocation decisions
- 2 Approaches for sites location and flow allocation decisions
- 2 Approaches for sites location and flow allocation decisions
- 2 Approaches for sites location and flow allocation decisions
- 2 Approaches for sites location and flow allocation decisions
- 2 Approaches for sites location and flow allocation decisions
- 2 Approaches for sites location and flow allocation decisions
- 2 Approaches for sites location and flow allocation decisions
- 2 Approaches for sites location and flow allocation decisions
- 3 Approaches to estimate traffic in existing roads
- 3 Approaches to estimate traffic in existing roads
- 3 Approaches to estimate traffic in existing roads
- 4 Work done so far
- 4 Work done so far
- 5 Work plan
- 6 Contact info
-

Two levels of abstraction
2nd Level 3D map accessingof forest tree by tree featuresallowing interaction and simulation of cable cranepositioning
Timeline
Defining the first version of the 3D forest model Partner involved (TRE COAST FLY)
Interface to access to the FIS database including OGC services both for 2D and 3D (Task 51+BOKU)
Cable Crane simulation tool (GRE)
Final version
Platform Core
Using the remote data (Satellite UAVs orthophotos and digital surface model) combinedwith on field information (TLS) each single tree feature will be segmented including itsdeducted geometric properties
Task 21
Task 22
Task 23
3D forest modelVirtual 3D
environment
Platform CoreCanopy surface model Laser scanner point cloud Aerial amp satellite images
3D Modelling for harvesting planning
What Technologiy for 3D forest modelling
Realistic rendering Parametric model Point cloud visualization
3D Visualization Technologies
Approachesbull Desktop Visualization Platform
with Mobile Portingbull Web-Client Visualization
Platform
Desktop Platformbull Open-Source Library for 3d
visualization (OpenInventor Vtk Openscenegraph)
bull 3d Engine ( UdK IrrichlichtEngine Unity 3d)
Technologies
Web Client bull WebGL implementation of
OpenGL ES 20 for web programmable in JavaScript
bull Java Applet based on OpensourceGlobe Nasa World wind Cesioum
Actions
- Parallel session on WP2 tomorrow
- bi-weekly Skypewebex session
- Dedicated folder on consortium dropbox to share documentation
- Ftp area to exchange large testing datasets
Thank you for your attention
DR FEDERICO PRANDI
Federicoprandigraphitechit
Fondazione GraphitechVia Alla Cascata 56C38123 Trento (ITALY)
Phone +39 0461283394Fax +39 0461283398
Project SLOPE79
T 25 ndash Road and Logistic planning
Mikkeli 2nd-4th July 2014
1 Task objectives80
Task objectives
Build and validate and Optimization model to decide on optimal logistic network in a given forest area This means to calculate locations for buffer areas mills and processing plants routes and flows between nodes according to a forecast demand
Build and validate a Model to estimate traffic on individual sections for road maintenance and construction purposes in this forest area according to a forecasted demand
Grumes in Trento has been chosen as forest area for testing the models
To be developed from M8 (August 14) to M13 (January 15)
Includes development of ldquoD205 Road and logistic simulation modulerdquo
Due to Month 13
Partners involved
ITENE (leader) GRAPHITECH CNR BOKU FLY
2 Approaches for sites location and flow allocation decisions
81
The goal is to determine an optimal (minimum cost) forest logistic network to respond future demands
The approach should determine Location of facilities (normally from a set of posible sites) Size and capacity of facilities (storage areas and processing sites) Volume to harvest in every landing and stand area Volume of timber to transport from landings to facilities (it gives a first
estimation of road traffic for road planning) Routes to connect nodes
2 Approaches for sites location and flow allocation decisions
82
The model should consider inputs like
Forecast of future demand of timber Geographic characteristics of the area (Map distances slopes available
areas sizes coordinates hellip) Actual roads from forest to mills (forest accessibility) Map type hellip Amount and quality of available timber Possible location of millsbiomass areas and distance to the forest
(coordinates size) Dimension of the logs needed Individual costs related to transport infrastructures costs and others like
clearing meadows or watersides artificial anchors locking public roads
2 Approaches for sites location and flow allocation decisions
83
StandCable ways
forestlanes
2 Approaches for sites location and flow allocation decisions
84
minorroad
mainroad
land
land
land
stand
stand
stand
2 Approaches for sites location and flow allocation decisions
85
Solution flow
Possible flow
lands in forest storage and facilities (saw mills biomass)
2 Approaches for sites location and flow allocation decisions
86
Location of a single facility by center-of-gravity method Output XY coordinates for the facility Optimization based only on distances Binary model (source-sink) Useful for a first estimation of a facility location
to be supplied from specific lands
2 Approaches for sites location and flow allocation decisions
87
Location of selected number of facilities by the exact center-of-gravity method Output XY coordinates of a selected number
of facilities Optimization based only on distances Binary model (source-sink) Useful for a first estimation of 2 or more
facility locations to be supplied from specific lands
2 Approaches for sites location and flow allocation decisions
88
P-median multiple facility location Output selected facilities from a list of
candidate sites receiving flows from other sites Optimization based on transport costs and fix
costs but lack of capacity constrains and other inventory costs
Binary model (source-sink) Useful for a first estimation of 2 or more facility
locations to be supplied from specific lands
2 Approaches for sites location and flow allocation decisions
89
Mixed integer linear programming problem Output selected facilities and optimal flows
between nodes Optimization based on transport costs and fix
costs capacity constrains and inventory costs Three stages model More appropriate approach for a network with
more than 2 node types
lands in forest storage and facilities(saw mills biomass)
2 Approaches for sites location and flow allocation decisions
90
Dynamic linear programming Consider changing demand Output
Selected facilities Size an capacity of facilities (storage and processing sites) Volume of harvest in every landing and stand aacuterea Volume to transport
Timber from landings to facilities Product from facilities to demand sites
Decision to expand production capacity in a specific period in the planning horizon
Minimize total costs for timber supply and transport investment and operational costs product transport cost to demand sites fixed cost for capacity expansion
- 200 400 600 800
1000 1200
1 2 3 4 5 6 7
Period Demand Volume
lands in forest storage and facilities(saw mills biomass)
2 Approaches for sites location and flow allocation decisions
91
Previous Work
Facilities Location Models An Application for the Forest Production and Logistics
JUAN TRONCOSO T 1 RODRIGO GARRIDO H 2 XIMENA IBACACHE J 3
July 2002
1 Departamento de Ciencias Forestales Pontificia Universidad Catoacutelica de Chile Casilla 305 Correo 22 Santiago Chile E-mail jtroncotpuccl
2 Departamento de Ingenieriacutea de Transporte Pontificia Universidad Catoacutelica de Chile3 Escuela de Ingenieriacutea Forestal Universidad Mayor
2 Approaches for sites location and flow allocation decisions
92
INPUTS Demands of product per each period and type of quality from demand site
DATA COLLECTION FOR THE MODEL Positions of stands lands storage areas processing sites (saw paper mills and
biomass heating and power plants) demand sites Volume available to harvest in every stand per quality of timber and destination (saw
mill or energy) Position for stand respect existing roads Slope or grade of difficulty to access Capacity of ground to support specific machinery Size and availability of skyline deployment sites Capacity and location of storage areas and buffers and processing sites Characteristics of processing sites and conversion facilities Distances between different nodes
2 Approaches for sites location and flow allocation decisions
93
COST FACTORS supply and transport operational costs final product transport cost to demand sites fixed cost for capacity expansion during the planning horizon investment associated to construction of a new site
OUTPUT Selected facilities Size an capacity of facilities (storage and processing sites) Volume of harvest in every landing and stand aacuterea Volume to transport
Timber from landings to facilities
Product from facilities to demand sites
Decision to expand production capacity in a specific period in the planning horizon
3 Approaches to estimate traffic in existing roads
94
Once the different sites and locations have been selected and flows between sites have been determined for each future period
A Logistics Resource Planning Model will be used to determine the volume to harvest in every period in every land processing and transport means and a more precise estimation of traffic in every individual sections of road in terms of number of trip per vehicles type (size weight) in each period
This traffic estimation will allow to define plans for road maintenance and construction in the forest area taking into account the capability of roads to accept trucks and cranes of different weights and sizes
3 Approaches to estimate traffic in existing roads
95
Similarities to DRP method
Land 1
SITE Saw PlantX
City 1
Product demandHarvest orders
Land 2 City 2
3 Approaches to estimate traffic in existing roads
96
SITE Saw Plant X Minumum Batch (harvest) (m3period) 500 Lead time (number of periods) 1 Safety stock (m3) 200
Period 1 2 3 4 5 6 7 Demand Volume (m3) 400 500 600 1000 500 600 1000 Available Stock (m3) 700 300 300 200 200 200 100 100 Harvest recepcion (m3) - 500 500 1000 500 500 1000 Harvest order launch (m3) 500 500 1000 500 500 1000
Land 1 To harvest (m3) 500 500 1000 Available m3 in land 1 2000 1500 1000 -Size of vehicle (m3) 10 Number of vehicle trips size 10m3 50 50 100
land 2 To harvest (m3) - - - 500 500 1000 -Available m3 in land 1 3000 2500 2000 1000 1000 Size of vehicle (m3) 10 Number of vehicle trips size 10m3 50 50 100 -
97
4 Work done so far
1st virtual meeting (webex conference)ndash 16062014
Attendants Daniele and Giulio (GRAPHITEC) Gianni (CNR) Marco (FLYBY) Martin (BOKU) Patricia Emilio and Loli (ITENE)
Agenda Task 25 objectives description of subtasks and partner roles Decision on forest area as test scenario (Grumes Trento has been decided as test
forest area) Next steps and dates
98
4 Work done so far
Discussion tomorrow in the T25 technical session
Collect general info of Grumes forest area Map with locations and roads available characteristics facilities actors (owners) hellip
Review planning models used in the literature Identify and organize detailed Grumes forest data collection for
models
5 Work plan99
Choose a test scenario Done (Grumes Trento)
Collect general info of Grumes forest area Map with locations and roads available characteristics facilities owners willing to show interest give data demand scenario hellip (GRAPHITEC amp CNR) DEADLINE 15 JULY 2014
Review network opt models (BOKU) and traffic estimation models (CNR) used in the literature (CNR BOKUITENE) Conclusion Report DEADLINE 15 AUGUST 2014
Formulatedesign a Network optimization model for logistics site location and flow allocation decisions (BOKU) DEADLINE 30 SEPTEMBER 2014
Formulatedesign model to estimate traffic in existing roads (CNR) DEADLINE 30 SEPTEMBER 2014
Collect detailed Grumes forest data for models Costs model elements etc (ITENE GRAPHITEC CNR FLYBY) DEADLINE 31ST OCTOBER 2014
Data Elements integration with the global forest model (ITENE) DEADLINE 31ST OCTOBER 2014
Program the Optimization model to allocate landings with the mills and plants and traffic calculation on individual sections (BOKU) DEADLINE 14TH NOVEMBER 2014
Program the model for road planning based on the amount of timber to be transported and identification of traffic on existing forest infrastructure (BOKU) DEADLINE 28TH NOVEMBER 2014
Validate models and run a scenario simulation with demand data (BOKU) DEADLINE 19TH DECEMBER 2014
6 Contact info100
Emilio Gonzalez egonzalezitenecom
Patricia Bellver pbellveritenecom
- Project SLOPE
- SLOPE WP 2 ndash Task 21
- Task 21 participants
- Task 21 general description
- GANTT
- Working on a case study
- RapidEye satellite imagery
- Task 21 expected output
- 1deg DRAFT D201 index
- Chapter 1 General view on remote sensing
- Chapter 2
- Other chapters are under costruction
- METHODOLOGY
- Slide Number 14
- Identification of Forest plantation on Google Earth
- Flight Plan uploaded to Auto Pilot in accordance with CAA IAA European Aviation Authority Regulations
- Data Acquisition and Processing
- Data Acquisition and Processing
- Data Acquisition and Processing DEM DTM DCM Crown Sizes Animated views
- Data Acquisition and Processing DEM DTM DCM Crown Sizes Animated views
- Data Acquisition amp Processing
- Example of Data to Follow
- Coastway ndash UAV and Payloads
- UAV
- Transport Case
- Payloads
- Slide Number 27
- Development by UAV manufacturer forAgricultural Mapping
- Questions
- Overall Progress of WP 2
- WP2 Tasks Completed Planning Recommendations
- Planning -Test Site Trento
- Test Site Flight Plan - Trento
- Trento Test Site UAV Launch and Landing Sites
- Presentation of Tasks Completed ndash Integration WP22
- Presentation of Tasks Completed ndash Integration WP22
- Tasks Completed ndash Data collection
- Ongoing Tasks
- TreeMetricsldquoPROVIDE MORE END PRODUCT FROM LESS TREESrdquo
- The Products
- The Products General Values
- The Problem - ldquoThe Collision of Interestsrdquo
- Maximise Value
- Maximise Value Sawlog Lengths
- Maximise Value Sawlog Lengths
- Maximise Value Sawlog Lengths
- Maximise Value Sawlog Lengths
- Maximise Value Sawlog Lengths
- Maximise Value Sawlog Lengths
- Harvester Optimisation
- Log Quality Straightness (Sweep) Taper Branching Rot
- Our Offering
- Slide Number 53
- Slide Number 54
- Slide Number 55
- Terrestrial Laser Scanning Forest Measurement System (AutoStem Forest)
- Slide Number 57
- Output From Field Survey
- Forest Valuation Online Data
- Current Forest Value
- Slide Number 61
- Latest Development
- Slide Number 63
- Outlook
- Objectives
- Scheduling
- Participants role
- Participants role
- Functions
- Two levels of abstraction
- Two levels of abstraction
- Timeline
- Platform Core
- Platform Core
- 3D Modelling for harvesting planning
- 3D Visualization Technologies
- Actions
- Thank you for your attention
- Project SLOPE
- 1 Task objectives
- 2 Approaches for sites location and flow allocation decisions
- 2 Approaches for sites location and flow allocation decisions
- 2 Approaches for sites location and flow allocation decisions
- 2 Approaches for sites location and flow allocation decisions
- 2 Approaches for sites location and flow allocation decisions
- 2 Approaches for sites location and flow allocation decisions
- 2 Approaches for sites location and flow allocation decisions
- 2 Approaches for sites location and flow allocation decisions
- 2 Approaches for sites location and flow allocation decisions
- 2 Approaches for sites location and flow allocation decisions
- 2 Approaches for sites location and flow allocation decisions
- 2 Approaches for sites location and flow allocation decisions
- 2 Approaches for sites location and flow allocation decisions
- 3 Approaches to estimate traffic in existing roads
- 3 Approaches to estimate traffic in existing roads
- 3 Approaches to estimate traffic in existing roads
- 4 Work done so far
- 4 Work done so far
- 5 Work plan
- 6 Contact info
-
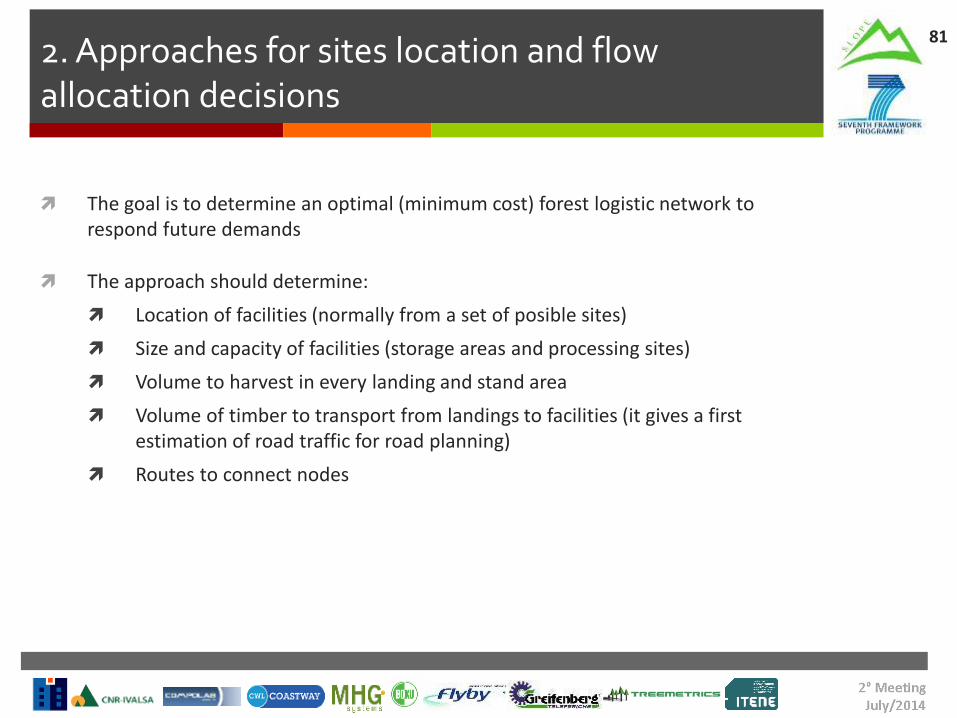
2 Approaches for sites location and flow allocation decisions
81
The goal is to determine an optimal (minimum cost) forest logistic network to respond future demands
The approach should determine Location of facilities (normally from a set of posible sites) Size and capacity of facilities (storage areas and processing sites) Volume to harvest in every landing and stand area Volume of timber to transport from landings to facilities (it gives a first
estimation of road traffic for road planning) Routes to connect nodes
2 Approaches for sites location and flow allocation decisions
82
The model should consider inputs like
Forecast of future demand of timber Geographic characteristics of the area (Map distances slopes available
areas sizes coordinates hellip) Actual roads from forest to mills (forest accessibility) Map type hellip Amount and quality of available timber Possible location of millsbiomass areas and distance to the forest
(coordinates size) Dimension of the logs needed Individual costs related to transport infrastructures costs and others like
clearing meadows or watersides artificial anchors locking public roads
2 Approaches for sites location and flow allocation decisions
83
StandCable ways
forestlanes
2 Approaches for sites location and flow allocation decisions
84
minorroad
mainroad
land
land
land
stand
stand
stand
2 Approaches for sites location and flow allocation decisions
85
Solution flow
Possible flow
lands in forest storage and facilities (saw mills biomass)
2 Approaches for sites location and flow allocation decisions
86
Location of a single facility by center-of-gravity method Output XY coordinates for the facility Optimization based only on distances Binary model (source-sink) Useful for a first estimation of a facility location
to be supplied from specific lands
2 Approaches for sites location and flow allocation decisions
87
Location of selected number of facilities by the exact center-of-gravity method Output XY coordinates of a selected number
of facilities Optimization based only on distances Binary model (source-sink) Useful for a first estimation of 2 or more
facility locations to be supplied from specific lands
2 Approaches for sites location and flow allocation decisions
88
P-median multiple facility location Output selected facilities from a list of
candidate sites receiving flows from other sites Optimization based on transport costs and fix
costs but lack of capacity constrains and other inventory costs
Binary model (source-sink) Useful for a first estimation of 2 or more facility
locations to be supplied from specific lands
2 Approaches for sites location and flow allocation decisions
89
Mixed integer linear programming problem Output selected facilities and optimal flows
between nodes Optimization based on transport costs and fix
costs capacity constrains and inventory costs Three stages model More appropriate approach for a network with
more than 2 node types
lands in forest storage and facilities(saw mills biomass)
2 Approaches for sites location and flow allocation decisions
90
Dynamic linear programming Consider changing demand Output
Selected facilities Size an capacity of facilities (storage and processing sites) Volume of harvest in every landing and stand aacuterea Volume to transport
Timber from landings to facilities Product from facilities to demand sites
Decision to expand production capacity in a specific period in the planning horizon
Minimize total costs for timber supply and transport investment and operational costs product transport cost to demand sites fixed cost for capacity expansion
- 200 400 600 800
1000 1200
1 2 3 4 5 6 7
Period Demand Volume
lands in forest storage and facilities(saw mills biomass)
2 Approaches for sites location and flow allocation decisions
91
Previous Work
Facilities Location Models An Application for the Forest Production and Logistics
JUAN TRONCOSO T 1 RODRIGO GARRIDO H 2 XIMENA IBACACHE J 3
July 2002
1 Departamento de Ciencias Forestales Pontificia Universidad Catoacutelica de Chile Casilla 305 Correo 22 Santiago Chile E-mail jtroncotpuccl
2 Departamento de Ingenieriacutea de Transporte Pontificia Universidad Catoacutelica de Chile3 Escuela de Ingenieriacutea Forestal Universidad Mayor
2 Approaches for sites location and flow allocation decisions
92
INPUTS Demands of product per each period and type of quality from demand site
DATA COLLECTION FOR THE MODEL Positions of stands lands storage areas processing sites (saw paper mills and
biomass heating and power plants) demand sites Volume available to harvest in every stand per quality of timber and destination (saw
mill or energy) Position for stand respect existing roads Slope or grade of difficulty to access Capacity of ground to support specific machinery Size and availability of skyline deployment sites Capacity and location of storage areas and buffers and processing sites Characteristics of processing sites and conversion facilities Distances between different nodes
2 Approaches for sites location and flow allocation decisions
93
COST FACTORS supply and transport operational costs final product transport cost to demand sites fixed cost for capacity expansion during the planning horizon investment associated to construction of a new site
OUTPUT Selected facilities Size an capacity of facilities (storage and processing sites) Volume of harvest in every landing and stand aacuterea Volume to transport
Timber from landings to facilities
Product from facilities to demand sites
Decision to expand production capacity in a specific period in the planning horizon
3 Approaches to estimate traffic in existing roads
94
Once the different sites and locations have been selected and flows between sites have been determined for each future period
A Logistics Resource Planning Model will be used to determine the volume to harvest in every period in every land processing and transport means and a more precise estimation of traffic in every individual sections of road in terms of number of trip per vehicles type (size weight) in each period
This traffic estimation will allow to define plans for road maintenance and construction in the forest area taking into account the capability of roads to accept trucks and cranes of different weights and sizes
3 Approaches to estimate traffic in existing roads
95
Similarities to DRP method
Land 1
SITE Saw PlantX
City 1
Product demandHarvest orders
Land 2 City 2
3 Approaches to estimate traffic in existing roads
96
SITE Saw Plant X Minumum Batch (harvest) (m3period) 500 Lead time (number of periods) 1 Safety stock (m3) 200
Period 1 2 3 4 5 6 7 Demand Volume (m3) 400 500 600 1000 500 600 1000 Available Stock (m3) 700 300 300 200 200 200 100 100 Harvest recepcion (m3) - 500 500 1000 500 500 1000 Harvest order launch (m3) 500 500 1000 500 500 1000
Land 1 To harvest (m3) 500 500 1000 Available m3 in land 1 2000 1500 1000 -Size of vehicle (m3) 10 Number of vehicle trips size 10m3 50 50 100
land 2 To harvest (m3) - - - 500 500 1000 -Available m3 in land 1 3000 2500 2000 1000 1000 Size of vehicle (m3) 10 Number of vehicle trips size 10m3 50 50 100 -
97
4 Work done so far
1st virtual meeting (webex conference)ndash 16062014
Attendants Daniele and Giulio (GRAPHITEC) Gianni (CNR) Marco (FLYBY) Martin (BOKU) Patricia Emilio and Loli (ITENE)
Agenda Task 25 objectives description of subtasks and partner roles Decision on forest area as test scenario (Grumes Trento has been decided as test
forest area) Next steps and dates
98
4 Work done so far
Discussion tomorrow in the T25 technical session
Collect general info of Grumes forest area Map with locations and roads available characteristics facilities actors (owners) hellip
Review planning models used in the literature Identify and organize detailed Grumes forest data collection for
models
5 Work plan99
Choose a test scenario Done (Grumes Trento)
Collect general info of Grumes forest area Map with locations and roads available characteristics facilities owners willing to show interest give data demand scenario hellip (GRAPHITEC amp CNR) DEADLINE 15 JULY 2014
Review network opt models (BOKU) and traffic estimation models (CNR) used in the literature (CNR BOKUITENE) Conclusion Report DEADLINE 15 AUGUST 2014
Formulatedesign a Network optimization model for logistics site location and flow allocation decisions (BOKU) DEADLINE 30 SEPTEMBER 2014
Formulatedesign model to estimate traffic in existing roads (CNR) DEADLINE 30 SEPTEMBER 2014
Collect detailed Grumes forest data for models Costs model elements etc (ITENE GRAPHITEC CNR FLYBY) DEADLINE 31ST OCTOBER 2014
Data Elements integration with the global forest model (ITENE) DEADLINE 31ST OCTOBER 2014
Program the Optimization model to allocate landings with the mills and plants and traffic calculation on individual sections (BOKU) DEADLINE 14TH NOVEMBER 2014
Program the model for road planning based on the amount of timber to be transported and identification of traffic on existing forest infrastructure (BOKU) DEADLINE 28TH NOVEMBER 2014
Validate models and run a scenario simulation with demand data (BOKU) DEADLINE 19TH DECEMBER 2014
6 Contact info100
Emilio Gonzalez egonzalezitenecom
Patricia Bellver pbellveritenecom
- Project SLOPE
- SLOPE WP 2 ndash Task 21
- Task 21 participants
- Task 21 general description
- GANTT
- Working on a case study
- RapidEye satellite imagery
- Task 21 expected output
- 1deg DRAFT D201 index
- Chapter 1 General view on remote sensing
- Chapter 2
- Other chapters are under costruction
- METHODOLOGY
- Slide Number 14
- Identification of Forest plantation on Google Earth
- Flight Plan uploaded to Auto Pilot in accordance with CAA IAA European Aviation Authority Regulations
- Data Acquisition and Processing
- Data Acquisition and Processing
- Data Acquisition and Processing DEM DTM DCM Crown Sizes Animated views
- Data Acquisition and Processing DEM DTM DCM Crown Sizes Animated views
- Data Acquisition amp Processing
- Example of Data to Follow
- Coastway ndash UAV and Payloads
- UAV
- Transport Case
- Payloads
- Slide Number 27
- Development by UAV manufacturer forAgricultural Mapping
- Questions
- Overall Progress of WP 2
- WP2 Tasks Completed Planning Recommendations
- Planning -Test Site Trento
- Test Site Flight Plan - Trento
- Trento Test Site UAV Launch and Landing Sites
- Presentation of Tasks Completed ndash Integration WP22
- Presentation of Tasks Completed ndash Integration WP22
- Tasks Completed ndash Data collection
- Ongoing Tasks
- TreeMetricsldquoPROVIDE MORE END PRODUCT FROM LESS TREESrdquo
- The Products
- The Products General Values
- The Problem - ldquoThe Collision of Interestsrdquo
- Maximise Value
- Maximise Value Sawlog Lengths
- Maximise Value Sawlog Lengths
- Maximise Value Sawlog Lengths
- Maximise Value Sawlog Lengths
- Maximise Value Sawlog Lengths
- Maximise Value Sawlog Lengths
- Harvester Optimisation
- Log Quality Straightness (Sweep) Taper Branching Rot
- Our Offering
- Slide Number 53
- Slide Number 54
- Slide Number 55
- Terrestrial Laser Scanning Forest Measurement System (AutoStem Forest)
- Slide Number 57
- Output From Field Survey
- Forest Valuation Online Data
- Current Forest Value
- Slide Number 61
- Latest Development
- Slide Number 63
- Outlook
- Objectives
- Scheduling
- Participants role
- Participants role
- Functions
- Two levels of abstraction
- Two levels of abstraction
- Timeline
- Platform Core
- Platform Core
- 3D Modelling for harvesting planning
- 3D Visualization Technologies
- Actions
- Thank you for your attention
- Project SLOPE
- 1 Task objectives
- 2 Approaches for sites location and flow allocation decisions
- 2 Approaches for sites location and flow allocation decisions
- 2 Approaches for sites location and flow allocation decisions
- 2 Approaches for sites location and flow allocation decisions
- 2 Approaches for sites location and flow allocation decisions
- 2 Approaches for sites location and flow allocation decisions
- 2 Approaches for sites location and flow allocation decisions
- 2 Approaches for sites location and flow allocation decisions
- 2 Approaches for sites location and flow allocation decisions
- 2 Approaches for sites location and flow allocation decisions
- 2 Approaches for sites location and flow allocation decisions
- 2 Approaches for sites location and flow allocation decisions
- 2 Approaches for sites location and flow allocation decisions
- 3 Approaches to estimate traffic in existing roads
- 3 Approaches to estimate traffic in existing roads
- 3 Approaches to estimate traffic in existing roads
- 4 Work done so far
- 4 Work done so far
- 5 Work plan
- 6 Contact info
-
2 Approaches for sites location and flow allocation decisions
82
The model should consider inputs like
Forecast of future demand of timber Geographic characteristics of the area (Map distances slopes available
areas sizes coordinates hellip) Actual roads from forest to mills (forest accessibility) Map type hellip Amount and quality of available timber Possible location of millsbiomass areas and distance to the forest
(coordinates size) Dimension of the logs needed Individual costs related to transport infrastructures costs and others like
clearing meadows or watersides artificial anchors locking public roads
2 Approaches for sites location and flow allocation decisions
83
StandCable ways
forestlanes
2 Approaches for sites location and flow allocation decisions
84
minorroad
mainroad
land
land
land
stand
stand
stand
2 Approaches for sites location and flow allocation decisions
85
Solution flow
Possible flow
lands in forest storage and facilities (saw mills biomass)
2 Approaches for sites location and flow allocation decisions
86
Location of a single facility by center-of-gravity method Output XY coordinates for the facility Optimization based only on distances Binary model (source-sink) Useful for a first estimation of a facility location
to be supplied from specific lands
2 Approaches for sites location and flow allocation decisions
87
Location of selected number of facilities by the exact center-of-gravity method Output XY coordinates of a selected number
of facilities Optimization based only on distances Binary model (source-sink) Useful for a first estimation of 2 or more
facility locations to be supplied from specific lands
2 Approaches for sites location and flow allocation decisions
88
P-median multiple facility location Output selected facilities from a list of
candidate sites receiving flows from other sites Optimization based on transport costs and fix
costs but lack of capacity constrains and other inventory costs
Binary model (source-sink) Useful for a first estimation of 2 or more facility
locations to be supplied from specific lands
2 Approaches for sites location and flow allocation decisions
89
Mixed integer linear programming problem Output selected facilities and optimal flows
between nodes Optimization based on transport costs and fix
costs capacity constrains and inventory costs Three stages model More appropriate approach for a network with
more than 2 node types
lands in forest storage and facilities(saw mills biomass)
2 Approaches for sites location and flow allocation decisions
90
Dynamic linear programming Consider changing demand Output
Selected facilities Size an capacity of facilities (storage and processing sites) Volume of harvest in every landing and stand aacuterea Volume to transport
Timber from landings to facilities Product from facilities to demand sites
Decision to expand production capacity in a specific period in the planning horizon
Minimize total costs for timber supply and transport investment and operational costs product transport cost to demand sites fixed cost for capacity expansion
- 200 400 600 800
1000 1200
1 2 3 4 5 6 7
Period Demand Volume
lands in forest storage and facilities(saw mills biomass)
2 Approaches for sites location and flow allocation decisions
91
Previous Work
Facilities Location Models An Application for the Forest Production and Logistics
JUAN TRONCOSO T 1 RODRIGO GARRIDO H 2 XIMENA IBACACHE J 3
July 2002
1 Departamento de Ciencias Forestales Pontificia Universidad Catoacutelica de Chile Casilla 305 Correo 22 Santiago Chile E-mail jtroncotpuccl
2 Departamento de Ingenieriacutea de Transporte Pontificia Universidad Catoacutelica de Chile3 Escuela de Ingenieriacutea Forestal Universidad Mayor
2 Approaches for sites location and flow allocation decisions
92
INPUTS Demands of product per each period and type of quality from demand site
DATA COLLECTION FOR THE MODEL Positions of stands lands storage areas processing sites (saw paper mills and
biomass heating and power plants) demand sites Volume available to harvest in every stand per quality of timber and destination (saw
mill or energy) Position for stand respect existing roads Slope or grade of difficulty to access Capacity of ground to support specific machinery Size and availability of skyline deployment sites Capacity and location of storage areas and buffers and processing sites Characteristics of processing sites and conversion facilities Distances between different nodes
2 Approaches for sites location and flow allocation decisions
93
COST FACTORS supply and transport operational costs final product transport cost to demand sites fixed cost for capacity expansion during the planning horizon investment associated to construction of a new site
OUTPUT Selected facilities Size an capacity of facilities (storage and processing sites) Volume of harvest in every landing and stand aacuterea Volume to transport
Timber from landings to facilities
Product from facilities to demand sites
Decision to expand production capacity in a specific period in the planning horizon
3 Approaches to estimate traffic in existing roads
94
Once the different sites and locations have been selected and flows between sites have been determined for each future period
A Logistics Resource Planning Model will be used to determine the volume to harvest in every period in every land processing and transport means and a more precise estimation of traffic in every individual sections of road in terms of number of trip per vehicles type (size weight) in each period
This traffic estimation will allow to define plans for road maintenance and construction in the forest area taking into account the capability of roads to accept trucks and cranes of different weights and sizes
3 Approaches to estimate traffic in existing roads
95
Similarities to DRP method
Land 1
SITE Saw PlantX
City 1
Product demandHarvest orders
Land 2 City 2
3 Approaches to estimate traffic in existing roads
96
SITE Saw Plant X Minumum Batch (harvest) (m3period) 500 Lead time (number of periods) 1 Safety stock (m3) 200
Period 1 2 3 4 5 6 7 Demand Volume (m3) 400 500 600 1000 500 600 1000 Available Stock (m3) 700 300 300 200 200 200 100 100 Harvest recepcion (m3) - 500 500 1000 500 500 1000 Harvest order launch (m3) 500 500 1000 500 500 1000
Land 1 To harvest (m3) 500 500 1000 Available m3 in land 1 2000 1500 1000 -Size of vehicle (m3) 10 Number of vehicle trips size 10m3 50 50 100
land 2 To harvest (m3) - - - 500 500 1000 -Available m3 in land 1 3000 2500 2000 1000 1000 Size of vehicle (m3) 10 Number of vehicle trips size 10m3 50 50 100 -
97
4 Work done so far
1st virtual meeting (webex conference)ndash 16062014
Attendants Daniele and Giulio (GRAPHITEC) Gianni (CNR) Marco (FLYBY) Martin (BOKU) Patricia Emilio and Loli (ITENE)
Agenda Task 25 objectives description of subtasks and partner roles Decision on forest area as test scenario (Grumes Trento has been decided as test
forest area) Next steps and dates
98
4 Work done so far
Discussion tomorrow in the T25 technical session
Collect general info of Grumes forest area Map with locations and roads available characteristics facilities actors (owners) hellip
Review planning models used in the literature Identify and organize detailed Grumes forest data collection for
models
5 Work plan99
Choose a test scenario Done (Grumes Trento)
Collect general info of Grumes forest area Map with locations and roads available characteristics facilities owners willing to show interest give data demand scenario hellip (GRAPHITEC amp CNR) DEADLINE 15 JULY 2014
Review network opt models (BOKU) and traffic estimation models (CNR) used in the literature (CNR BOKUITENE) Conclusion Report DEADLINE 15 AUGUST 2014
Formulatedesign a Network optimization model for logistics site location and flow allocation decisions (BOKU) DEADLINE 30 SEPTEMBER 2014
Formulatedesign model to estimate traffic in existing roads (CNR) DEADLINE 30 SEPTEMBER 2014
Collect detailed Grumes forest data for models Costs model elements etc (ITENE GRAPHITEC CNR FLYBY) DEADLINE 31ST OCTOBER 2014
Data Elements integration with the global forest model (ITENE) DEADLINE 31ST OCTOBER 2014
Program the Optimization model to allocate landings with the mills and plants and traffic calculation on individual sections (BOKU) DEADLINE 14TH NOVEMBER 2014
Program the model for road planning based on the amount of timber to be transported and identification of traffic on existing forest infrastructure (BOKU) DEADLINE 28TH NOVEMBER 2014
Validate models and run a scenario simulation with demand data (BOKU) DEADLINE 19TH DECEMBER 2014
6 Contact info100
Emilio Gonzalez egonzalezitenecom
Patricia Bellver pbellveritenecom
- Project SLOPE
- SLOPE WP 2 ndash Task 21
- Task 21 participants
- Task 21 general description
- GANTT
- Working on a case study
- RapidEye satellite imagery
- Task 21 expected output
- 1deg DRAFT D201 index
- Chapter 1 General view on remote sensing
- Chapter 2
- Other chapters are under costruction
- METHODOLOGY
- Slide Number 14
- Identification of Forest plantation on Google Earth
- Flight Plan uploaded to Auto Pilot in accordance with CAA IAA European Aviation Authority Regulations
- Data Acquisition and Processing
- Data Acquisition and Processing
- Data Acquisition and Processing DEM DTM DCM Crown Sizes Animated views
- Data Acquisition and Processing DEM DTM DCM Crown Sizes Animated views
- Data Acquisition amp Processing
- Example of Data to Follow
- Coastway ndash UAV and Payloads
- UAV
- Transport Case
- Payloads
- Slide Number 27
- Development by UAV manufacturer forAgricultural Mapping
- Questions
- Overall Progress of WP 2
- WP2 Tasks Completed Planning Recommendations
- Planning -Test Site Trento
- Test Site Flight Plan - Trento
- Trento Test Site UAV Launch and Landing Sites
- Presentation of Tasks Completed ndash Integration WP22
- Presentation of Tasks Completed ndash Integration WP22
- Tasks Completed ndash Data collection
- Ongoing Tasks
- TreeMetricsldquoPROVIDE MORE END PRODUCT FROM LESS TREESrdquo
- The Products
- The Products General Values
- The Problem - ldquoThe Collision of Interestsrdquo
- Maximise Value
- Maximise Value Sawlog Lengths
- Maximise Value Sawlog Lengths
- Maximise Value Sawlog Lengths
- Maximise Value Sawlog Lengths
- Maximise Value Sawlog Lengths
- Maximise Value Sawlog Lengths
- Harvester Optimisation
- Log Quality Straightness (Sweep) Taper Branching Rot
- Our Offering
- Slide Number 53
- Slide Number 54
- Slide Number 55
- Terrestrial Laser Scanning Forest Measurement System (AutoStem Forest)
- Slide Number 57
- Output From Field Survey
- Forest Valuation Online Data
- Current Forest Value
- Slide Number 61
- Latest Development
- Slide Number 63
- Outlook
- Objectives
- Scheduling
- Participants role
- Participants role
- Functions
- Two levels of abstraction
- Two levels of abstraction
- Timeline
- Platform Core
- Platform Core
- 3D Modelling for harvesting planning
- 3D Visualization Technologies
- Actions
- Thank you for your attention
- Project SLOPE
- 1 Task objectives
- 2 Approaches for sites location and flow allocation decisions
- 2 Approaches for sites location and flow allocation decisions
- 2 Approaches for sites location and flow allocation decisions
- 2 Approaches for sites location and flow allocation decisions
- 2 Approaches for sites location and flow allocation decisions
- 2 Approaches for sites location and flow allocation decisions
- 2 Approaches for sites location and flow allocation decisions
- 2 Approaches for sites location and flow allocation decisions
- 2 Approaches for sites location and flow allocation decisions
- 2 Approaches for sites location and flow allocation decisions
- 2 Approaches for sites location and flow allocation decisions
- 2 Approaches for sites location and flow allocation decisions
- 2 Approaches for sites location and flow allocation decisions
- 3 Approaches to estimate traffic in existing roads
- 3 Approaches to estimate traffic in existing roads
- 3 Approaches to estimate traffic in existing roads
- 4 Work done so far
- 4 Work done so far
- 5 Work plan
- 6 Contact info
-

2 Approaches for sites location and flow allocation decisions
87
Location of selected number of facilities by the exact center-of-gravity method Output XY coordinates of a selected number
of facilities Optimization based only on distances Binary model (source-sink) Useful for a first estimation of 2 or more
facility locations to be supplied from specific lands
2 Approaches for sites location and flow allocation decisions
88
P-median multiple facility location Output selected facilities from a list of
candidate sites receiving flows from other sites Optimization based on transport costs and fix
costs but lack of capacity constrains and other inventory costs
Binary model (source-sink) Useful for a first estimation of 2 or more facility
locations to be supplied from specific lands
2 Approaches for sites location and flow allocation decisions
89
Mixed integer linear programming problem Output selected facilities and optimal flows
between nodes Optimization based on transport costs and fix
costs capacity constrains and inventory costs Three stages model More appropriate approach for a network with
more than 2 node types
lands in forest storage and facilities(saw mills biomass)
2 Approaches for sites location and flow allocation decisions
90
Dynamic linear programming Consider changing demand Output
Selected facilities Size an capacity of facilities (storage and processing sites) Volume of harvest in every landing and stand aacuterea Volume to transport
Timber from landings to facilities Product from facilities to demand sites
Decision to expand production capacity in a specific period in the planning horizon
Minimize total costs for timber supply and transport investment and operational costs product transport cost to demand sites fixed cost for capacity expansion
- 200 400 600 800
1000 1200
1 2 3 4 5 6 7
Period Demand Volume
lands in forest storage and facilities(saw mills biomass)
2 Approaches for sites location and flow allocation decisions
91
Previous Work
Facilities Location Models An Application for the Forest Production and Logistics
JUAN TRONCOSO T 1 RODRIGO GARRIDO H 2 XIMENA IBACACHE J 3
July 2002
1 Departamento de Ciencias Forestales Pontificia Universidad Catoacutelica de Chile Casilla 305 Correo 22 Santiago Chile E-mail jtroncotpuccl
2 Departamento de Ingenieriacutea de Transporte Pontificia Universidad Catoacutelica de Chile3 Escuela de Ingenieriacutea Forestal Universidad Mayor
2 Approaches for sites location and flow allocation decisions
92
INPUTS Demands of product per each period and type of quality from demand site
DATA COLLECTION FOR THE MODEL Positions of stands lands storage areas processing sites (saw paper mills and
biomass heating and power plants) demand sites Volume available to harvest in every stand per quality of timber and destination (saw
mill or energy) Position for stand respect existing roads Slope or grade of difficulty to access Capacity of ground to support specific machinery Size and availability of skyline deployment sites Capacity and location of storage areas and buffers and processing sites Characteristics of processing sites and conversion facilities Distances between different nodes
2 Approaches for sites location and flow allocation decisions
93
COST FACTORS supply and transport operational costs final product transport cost to demand sites fixed cost for capacity expansion during the planning horizon investment associated to construction of a new site
OUTPUT Selected facilities Size an capacity of facilities (storage and processing sites) Volume of harvest in every landing and stand aacuterea Volume to transport
Timber from landings to facilities
Product from facilities to demand sites
Decision to expand production capacity in a specific period in the planning horizon
3 Approaches to estimate traffic in existing roads
94
Once the different sites and locations have been selected and flows between sites have been determined for each future period
A Logistics Resource Planning Model will be used to determine the volume to harvest in every period in every land processing and transport means and a more precise estimation of traffic in every individual sections of road in terms of number of trip per vehicles type (size weight) in each period
This traffic estimation will allow to define plans for road maintenance and construction in the forest area taking into account the capability of roads to accept trucks and cranes of different weights and sizes
3 Approaches to estimate traffic in existing roads
95
Similarities to DRP method
Land 1
SITE Saw PlantX
City 1
Product demandHarvest orders
Land 2 City 2
3 Approaches to estimate traffic in existing roads
96
SITE Saw Plant X Minumum Batch (harvest) (m3period) 500 Lead time (number of periods) 1 Safety stock (m3) 200
Period 1 2 3 4 5 6 7 Demand Volume (m3) 400 500 600 1000 500 600 1000 Available Stock (m3) 700 300 300 200 200 200 100 100 Harvest recepcion (m3) - 500 500 1000 500 500 1000 Harvest order launch (m3) 500 500 1000 500 500 1000
Land 1 To harvest (m3) 500 500 1000 Available m3 in land 1 2000 1500 1000 -Size of vehicle (m3) 10 Number of vehicle trips size 10m3 50 50 100
land 2 To harvest (m3) - - - 500 500 1000 -Available m3 in land 1 3000 2500 2000 1000 1000 Size of vehicle (m3) 10 Number of vehicle trips size 10m3 50 50 100 -
97
4 Work done so far
1st virtual meeting (webex conference)ndash 16062014
Attendants Daniele and Giulio (GRAPHITEC) Gianni (CNR) Marco (FLYBY) Martin (BOKU) Patricia Emilio and Loli (ITENE)
Agenda Task 25 objectives description of subtasks and partner roles Decision on forest area as test scenario (Grumes Trento has been decided as test
forest area) Next steps and dates
98
4 Work done so far
Discussion tomorrow in the T25 technical session
Collect general info of Grumes forest area Map with locations and roads available characteristics facilities actors (owners) hellip
Review planning models used in the literature Identify and organize detailed Grumes forest data collection for
models
5 Work plan99
Choose a test scenario Done (Grumes Trento)
Collect general info of Grumes forest area Map with locations and roads available characteristics facilities owners willing to show interest give data demand scenario hellip (GRAPHITEC amp CNR) DEADLINE 15 JULY 2014
Review network opt models (BOKU) and traffic estimation models (CNR) used in the literature (CNR BOKUITENE) Conclusion Report DEADLINE 15 AUGUST 2014
Formulatedesign a Network optimization model for logistics site location and flow allocation decisions (BOKU) DEADLINE 30 SEPTEMBER 2014
Formulatedesign model to estimate traffic in existing roads (CNR) DEADLINE 30 SEPTEMBER 2014
Collect detailed Grumes forest data for models Costs model elements etc (ITENE GRAPHITEC CNR FLYBY) DEADLINE 31ST OCTOBER 2014
Data Elements integration with the global forest model (ITENE) DEADLINE 31ST OCTOBER 2014
Program the Optimization model to allocate landings with the mills and plants and traffic calculation on individual sections (BOKU) DEADLINE 14TH NOVEMBER 2014
Program the model for road planning based on the amount of timber to be transported and identification of traffic on existing forest infrastructure (BOKU) DEADLINE 28TH NOVEMBER 2014
Validate models and run a scenario simulation with demand data (BOKU) DEADLINE 19TH DECEMBER 2014
6 Contact info100
Emilio Gonzalez egonzalezitenecom
Patricia Bellver pbellveritenecom
- Project SLOPE
- SLOPE WP 2 ndash Task 21
- Task 21 participants
- Task 21 general description
- GANTT
- Working on a case study
- RapidEye satellite imagery
- Task 21 expected output
- 1deg DRAFT D201 index
- Chapter 1 General view on remote sensing
- Chapter 2
- Other chapters are under costruction
- METHODOLOGY
- Slide Number 14
- Identification of Forest plantation on Google Earth
- Flight Plan uploaded to Auto Pilot in accordance with CAA IAA European Aviation Authority Regulations
- Data Acquisition and Processing
- Data Acquisition and Processing
- Data Acquisition and Processing DEM DTM DCM Crown Sizes Animated views
- Data Acquisition and Processing DEM DTM DCM Crown Sizes Animated views
- Data Acquisition amp Processing
- Example of Data to Follow
- Coastway ndash UAV and Payloads
- UAV
- Transport Case
- Payloads
- Slide Number 27
- Development by UAV manufacturer forAgricultural Mapping
- Questions
- Overall Progress of WP 2
- WP2 Tasks Completed Planning Recommendations
- Planning -Test Site Trento
- Test Site Flight Plan - Trento
- Trento Test Site UAV Launch and Landing Sites
- Presentation of Tasks Completed ndash Integration WP22
- Presentation of Tasks Completed ndash Integration WP22
- Tasks Completed ndash Data collection
- Ongoing Tasks
- TreeMetricsldquoPROVIDE MORE END PRODUCT FROM LESS TREESrdquo
- The Products
- The Products General Values
- The Problem - ldquoThe Collision of Interestsrdquo
- Maximise Value
- Maximise Value Sawlog Lengths
- Maximise Value Sawlog Lengths
- Maximise Value Sawlog Lengths
- Maximise Value Sawlog Lengths
- Maximise Value Sawlog Lengths
- Maximise Value Sawlog Lengths
- Harvester Optimisation
- Log Quality Straightness (Sweep) Taper Branching Rot
- Our Offering
- Slide Number 53
- Slide Number 54
- Slide Number 55
- Terrestrial Laser Scanning Forest Measurement System (AutoStem Forest)
- Slide Number 57
- Output From Field Survey
- Forest Valuation Online Data
- Current Forest Value
- Slide Number 61
- Latest Development
- Slide Number 63
- Outlook
- Objectives
- Scheduling
- Participants role
- Participants role
- Functions
- Two levels of abstraction
- Two levels of abstraction
- Timeline
- Platform Core
- Platform Core
- 3D Modelling for harvesting planning
- 3D Visualization Technologies
- Actions
- Thank you for your attention
- Project SLOPE
- 1 Task objectives
- 2 Approaches for sites location and flow allocation decisions
- 2 Approaches for sites location and flow allocation decisions
- 2 Approaches for sites location and flow allocation decisions
- 2 Approaches for sites location and flow allocation decisions
- 2 Approaches for sites location and flow allocation decisions
- 2 Approaches for sites location and flow allocation decisions
- 2 Approaches for sites location and flow allocation decisions
- 2 Approaches for sites location and flow allocation decisions
- 2 Approaches for sites location and flow allocation decisions
- 2 Approaches for sites location and flow allocation decisions
- 2 Approaches for sites location and flow allocation decisions
- 2 Approaches for sites location and flow allocation decisions
- 2 Approaches for sites location and flow allocation decisions
- 3 Approaches to estimate traffic in existing roads
- 3 Approaches to estimate traffic in existing roads
- 3 Approaches to estimate traffic in existing roads
- 4 Work done so far
- 4 Work done so far
- 5 Work plan
- 6 Contact info
-
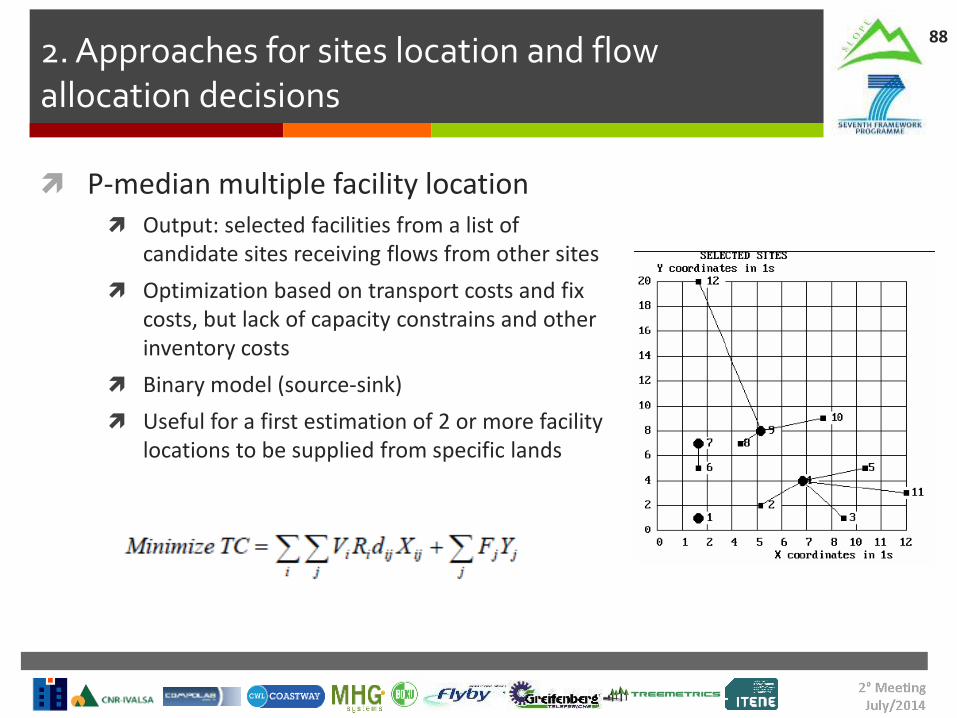
2 Approaches for sites location and flow allocation decisions
92
INPUTS Demands of product per each period and type of quality from demand site
DATA COLLECTION FOR THE MODEL Positions of stands lands storage areas processing sites (saw paper mills and
biomass heating and power plants) demand sites Volume available to harvest in every stand per quality of timber and destination (saw
mill or energy) Position for stand respect existing roads Slope or grade of difficulty to access Capacity of ground to support specific machinery Size and availability of skyline deployment sites Capacity and location of storage areas and buffers and processing sites Characteristics of processing sites and conversion facilities Distances between different nodes
2 Approaches for sites location and flow allocation decisions
93
COST FACTORS supply and transport operational costs final product transport cost to demand sites fixed cost for capacity expansion during the planning horizon investment associated to construction of a new site
OUTPUT Selected facilities Size an capacity of facilities (storage and processing sites) Volume of harvest in every landing and stand aacuterea Volume to transport
Timber from landings to facilities
Product from facilities to demand sites
Decision to expand production capacity in a specific period in the planning horizon
3 Approaches to estimate traffic in existing roads
94
Once the different sites and locations have been selected and flows between sites have been determined for each future period
A Logistics Resource Planning Model will be used to determine the volume to harvest in every period in every land processing and transport means and a more precise estimation of traffic in every individual sections of road in terms of number of trip per vehicles type (size weight) in each period
This traffic estimation will allow to define plans for road maintenance and construction in the forest area taking into account the capability of roads to accept trucks and cranes of different weights and sizes
3 Approaches to estimate traffic in existing roads
95
Similarities to DRP method
Land 1
SITE Saw PlantX
City 1
Product demandHarvest orders
Land 2 City 2
3 Approaches to estimate traffic in existing roads
96
SITE Saw Plant X Minumum Batch (harvest) (m3period) 500 Lead time (number of periods) 1 Safety stock (m3) 200
Period 1 2 3 4 5 6 7 Demand Volume (m3) 400 500 600 1000 500 600 1000 Available Stock (m3) 700 300 300 200 200 200 100 100 Harvest recepcion (m3) - 500 500 1000 500 500 1000 Harvest order launch (m3) 500 500 1000 500 500 1000
Land 1 To harvest (m3) 500 500 1000 Available m3 in land 1 2000 1500 1000 -Size of vehicle (m3) 10 Number of vehicle trips size 10m3 50 50 100
land 2 To harvest (m3) - - - 500 500 1000 -Available m3 in land 1 3000 2500 2000 1000 1000 Size of vehicle (m3) 10 Number of vehicle trips size 10m3 50 50 100 -
97
4 Work done so far
1st virtual meeting (webex conference)ndash 16062014
Attendants Daniele and Giulio (GRAPHITEC) Gianni (CNR) Marco (FLYBY) Martin (BOKU) Patricia Emilio and Loli (ITENE)
Agenda Task 25 objectives description of subtasks and partner roles Decision on forest area as test scenario (Grumes Trento has been decided as test
forest area) Next steps and dates
98
4 Work done so far
Discussion tomorrow in the T25 technical session
Collect general info of Grumes forest area Map with locations and roads available characteristics facilities actors (owners) hellip
Review planning models used in the literature Identify and organize detailed Grumes forest data collection for
models
5 Work plan99
Choose a test scenario Done (Grumes Trento)
Collect general info of Grumes forest area Map with locations and roads available characteristics facilities owners willing to show interest give data demand scenario hellip (GRAPHITEC amp CNR) DEADLINE 15 JULY 2014
Review network opt models (BOKU) and traffic estimation models (CNR) used in the literature (CNR BOKUITENE) Conclusion Report DEADLINE 15 AUGUST 2014
Formulatedesign a Network optimization model for logistics site location and flow allocation decisions (BOKU) DEADLINE 30 SEPTEMBER 2014
Formulatedesign model to estimate traffic in existing roads (CNR) DEADLINE 30 SEPTEMBER 2014
Collect detailed Grumes forest data for models Costs model elements etc (ITENE GRAPHITEC CNR FLYBY) DEADLINE 31ST OCTOBER 2014
Data Elements integration with the global forest model (ITENE) DEADLINE 31ST OCTOBER 2014
Program the Optimization model to allocate landings with the mills and plants and traffic calculation on individual sections (BOKU) DEADLINE 14TH NOVEMBER 2014
Program the model for road planning based on the amount of timber to be transported and identification of traffic on existing forest infrastructure (BOKU) DEADLINE 28TH NOVEMBER 2014
Validate models and run a scenario simulation with demand data (BOKU) DEADLINE 19TH DECEMBER 2014
6 Contact info100
Emilio Gonzalez egonzalezitenecom
Patricia Bellver pbellveritenecom
- Project SLOPE
- SLOPE WP 2 ndash Task 21
- Task 21 participants
- Task 21 general description
- GANTT
- Working on a case study
- RapidEye satellite imagery
- Task 21 expected output
- 1deg DRAFT D201 index
- Chapter 1 General view on remote sensing
- Chapter 2
- Other chapters are under costruction
- METHODOLOGY
- Slide Number 14
- Identification of Forest plantation on Google Earth
- Flight Plan uploaded to Auto Pilot in accordance with CAA IAA European Aviation Authority Regulations
- Data Acquisition and Processing
- Data Acquisition and Processing
- Data Acquisition and Processing DEM DTM DCM Crown Sizes Animated views
- Data Acquisition and Processing DEM DTM DCM Crown Sizes Animated views
- Data Acquisition amp Processing
- Example of Data to Follow
- Coastway ndash UAV and Payloads
- UAV
- Transport Case
- Payloads
- Slide Number 27
- Development by UAV manufacturer forAgricultural Mapping
- Questions
- Overall Progress of WP 2
- WP2 Tasks Completed Planning Recommendations
- Planning -Test Site Trento
- Test Site Flight Plan - Trento
- Trento Test Site UAV Launch and Landing Sites
- Presentation of Tasks Completed ndash Integration WP22
- Presentation of Tasks Completed ndash Integration WP22
- Tasks Completed ndash Data collection
- Ongoing Tasks
- TreeMetricsldquoPROVIDE MORE END PRODUCT FROM LESS TREESrdquo
- The Products
- The Products General Values
- The Problem - ldquoThe Collision of Interestsrdquo
- Maximise Value
- Maximise Value Sawlog Lengths
- Maximise Value Sawlog Lengths
- Maximise Value Sawlog Lengths
- Maximise Value Sawlog Lengths
- Maximise Value Sawlog Lengths
- Maximise Value Sawlog Lengths
- Harvester Optimisation
- Log Quality Straightness (Sweep) Taper Branching Rot
- Our Offering
- Slide Number 53
- Slide Number 54
- Slide Number 55
- Terrestrial Laser Scanning Forest Measurement System (AutoStem Forest)
- Slide Number 57
- Output From Field Survey
- Forest Valuation Online Data
- Current Forest Value
- Slide Number 61
- Latest Development
- Slide Number 63
- Outlook
- Objectives
- Scheduling
- Participants role
- Participants role
- Functions
- Two levels of abstraction
- Two levels of abstraction
- Timeline
- Platform Core
- Platform Core
- 3D Modelling for harvesting planning
- 3D Visualization Technologies
- Actions
- Thank you for your attention
- Project SLOPE
- 1 Task objectives
- 2 Approaches for sites location and flow allocation decisions
- 2 Approaches for sites location and flow allocation decisions
- 2 Approaches for sites location and flow allocation decisions
- 2 Approaches for sites location and flow allocation decisions
- 2 Approaches for sites location and flow allocation decisions
- 2 Approaches for sites location and flow allocation decisions
- 2 Approaches for sites location and flow allocation decisions
- 2 Approaches for sites location and flow allocation decisions
- 2 Approaches for sites location and flow allocation decisions
- 2 Approaches for sites location and flow allocation decisions
- 2 Approaches for sites location and flow allocation decisions
- 2 Approaches for sites location and flow allocation decisions
- 2 Approaches for sites location and flow allocation decisions
- 3 Approaches to estimate traffic in existing roads
- 3 Approaches to estimate traffic in existing roads
- 3 Approaches to estimate traffic in existing roads
- 4 Work done so far
- 4 Work done so far
- 5 Work plan
- 6 Contact info
-

3 Approaches to estimate traffic in existing roads
96
SITE Saw Plant X Minumum Batch (harvest) (m3period) 500 Lead time (number of periods) 1 Safety stock (m3) 200
Period 1 2 3 4 5 6 7 Demand Volume (m3) 400 500 600 1000 500 600 1000 Available Stock (m3) 700 300 300 200 200 200 100 100 Harvest recepcion (m3) - 500 500 1000 500 500 1000 Harvest order launch (m3) 500 500 1000 500 500 1000
Land 1 To harvest (m3) 500 500 1000 Available m3 in land 1 2000 1500 1000 -Size of vehicle (m3) 10 Number of vehicle trips size 10m3 50 50 100
land 2 To harvest (m3) - - - 500 500 1000 -Available m3 in land 1 3000 2500 2000 1000 1000 Size of vehicle (m3) 10 Number of vehicle trips size 10m3 50 50 100 -
97
4 Work done so far
1st virtual meeting (webex conference)ndash 16062014
Attendants Daniele and Giulio (GRAPHITEC) Gianni (CNR) Marco (FLYBY) Martin (BOKU) Patricia Emilio and Loli (ITENE)
Agenda Task 25 objectives description of subtasks and partner roles Decision on forest area as test scenario (Grumes Trento has been decided as test
forest area) Next steps and dates
98
4 Work done so far
Discussion tomorrow in the T25 technical session
Collect general info of Grumes forest area Map with locations and roads available characteristics facilities actors (owners) hellip
Review planning models used in the literature Identify and organize detailed Grumes forest data collection for
models
5 Work plan99
Choose a test scenario Done (Grumes Trento)
Collect general info of Grumes forest area Map with locations and roads available characteristics facilities owners willing to show interest give data demand scenario hellip (GRAPHITEC amp CNR) DEADLINE 15 JULY 2014
Review network opt models (BOKU) and traffic estimation models (CNR) used in the literature (CNR BOKUITENE) Conclusion Report DEADLINE 15 AUGUST 2014
Formulatedesign a Network optimization model for logistics site location and flow allocation decisions (BOKU) DEADLINE 30 SEPTEMBER 2014
Formulatedesign model to estimate traffic in existing roads (CNR) DEADLINE 30 SEPTEMBER 2014
Collect detailed Grumes forest data for models Costs model elements etc (ITENE GRAPHITEC CNR FLYBY) DEADLINE 31ST OCTOBER 2014
Data Elements integration with the global forest model (ITENE) DEADLINE 31ST OCTOBER 2014
Program the Optimization model to allocate landings with the mills and plants and traffic calculation on individual sections (BOKU) DEADLINE 14TH NOVEMBER 2014
Program the model for road planning based on the amount of timber to be transported and identification of traffic on existing forest infrastructure (BOKU) DEADLINE 28TH NOVEMBER 2014
Validate models and run a scenario simulation with demand data (BOKU) DEADLINE 19TH DECEMBER 2014
6 Contact info100
Emilio Gonzalez egonzalezitenecom
Patricia Bellver pbellveritenecom
- Project SLOPE
- SLOPE WP 2 ndash Task 21
- Task 21 participants
- Task 21 general description
- GANTT
- Working on a case study
- RapidEye satellite imagery
- Task 21 expected output
- 1deg DRAFT D201 index
- Chapter 1 General view on remote sensing
- Chapter 2
- Other chapters are under costruction
- METHODOLOGY
- Slide Number 14
- Identification of Forest plantation on Google Earth
- Flight Plan uploaded to Auto Pilot in accordance with CAA IAA European Aviation Authority Regulations
- Data Acquisition and Processing
- Data Acquisition and Processing
- Data Acquisition and Processing DEM DTM DCM Crown Sizes Animated views
- Data Acquisition and Processing DEM DTM DCM Crown Sizes Animated views
- Data Acquisition amp Processing
- Example of Data to Follow
- Coastway ndash UAV and Payloads
- UAV
- Transport Case
- Payloads
- Slide Number 27
- Development by UAV manufacturer forAgricultural Mapping
- Questions
- Overall Progress of WP 2
- WP2 Tasks Completed Planning Recommendations
- Planning -Test Site Trento
- Test Site Flight Plan - Trento
- Trento Test Site UAV Launch and Landing Sites
- Presentation of Tasks Completed ndash Integration WP22
- Presentation of Tasks Completed ndash Integration WP22
- Tasks Completed ndash Data collection
- Ongoing Tasks
- TreeMetricsldquoPROVIDE MORE END PRODUCT FROM LESS TREESrdquo
- The Products
- The Products General Values
- The Problem - ldquoThe Collision of Interestsrdquo
- Maximise Value
- Maximise Value Sawlog Lengths
- Maximise Value Sawlog Lengths
- Maximise Value Sawlog Lengths
- Maximise Value Sawlog Lengths
- Maximise Value Sawlog Lengths
- Maximise Value Sawlog Lengths
- Harvester Optimisation
- Log Quality Straightness (Sweep) Taper Branching Rot
- Our Offering
- Slide Number 53
- Slide Number 54
- Slide Number 55
- Terrestrial Laser Scanning Forest Measurement System (AutoStem Forest)
- Slide Number 57
- Output From Field Survey
- Forest Valuation Online Data
- Current Forest Value
- Slide Number 61
- Latest Development
- Slide Number 63
- Outlook
- Objectives
- Scheduling
- Participants role
- Participants role
- Functions
- Two levels of abstraction
- Two levels of abstraction
- Timeline
- Platform Core
- Platform Core
- 3D Modelling for harvesting planning
- 3D Visualization Technologies
- Actions
- Thank you for your attention
- Project SLOPE
- 1 Task objectives
- 2 Approaches for sites location and flow allocation decisions
- 2 Approaches for sites location and flow allocation decisions
- 2 Approaches for sites location and flow allocation decisions
- 2 Approaches for sites location and flow allocation decisions
- 2 Approaches for sites location and flow allocation decisions
- 2 Approaches for sites location and flow allocation decisions
- 2 Approaches for sites location and flow allocation decisions
- 2 Approaches for sites location and flow allocation decisions
- 2 Approaches for sites location and flow allocation decisions
- 2 Approaches for sites location and flow allocation decisions
- 2 Approaches for sites location and flow allocation decisions
- 2 Approaches for sites location and flow allocation decisions
- 2 Approaches for sites location and flow allocation decisions
- 3 Approaches to estimate traffic in existing roads
- 3 Approaches to estimate traffic in existing roads
- 3 Approaches to estimate traffic in existing roads
- 4 Work done so far
- 4 Work done so far
- 5 Work plan
- 6 Contact info
-


