Download - 2 case study on kangaroos
1
Development of light-weight video-tracking technology for use in wildlife research: A 1
case study on kangaroos 2
3
Herbert CA1*, Dassis M2, Pye M1., Jones PW3, Leong PHW3, Thomas G 1, Cope H1, Jarman 4
A1, Hobbs R4, Murray PE5 and Machovsky Capuska GE6 5
6
1 School of Life and Environmental Sciences, The University of Sydney, Sydney, NSW, 2006, 7
Australia. 8
2 Facultad de Ciencias Exactas y Naturales, Universidad Nacional de Mar del Plata-CONICET, 9
7600 Mar del Plata, Argentina. 10
3 School of Electrical and Information Engineering, The University of Sydney, NSW 2006, 11
Sydney, Australia. 12
4 Taronga Institute of Science and Learning, Taronga Conservation Society Australia, Sydney, 13
NSW 2088, Australia 14
5 Nelson Bay Golf Club, 57 Dowling St, Nelson Bay, NSW, 2315. 15
6 The Charles Perkins Centre, The University of Sydney, Sydney, NSW 2006, Australia. 16
* Corresponding author: [email protected] 17
18
2
Abstract 19
There have been significant advances in the development of animal-borne sensor 20
technologies, or biologgers, in recent years. This has resulted in tremendous capacity for 21
wildlife researchers to remotely collect physiological, behavioural and social data from 22
wildlife in circumstances that were unthinkable just decades ago. While this technology can 23
provide us with a unique insight into the “secret lives” of wild animals, there is a need to 24
evaluate the utility of these new sensors versus traditional wildlife research methodologies, 25
and to critically evaluate the integrity of the data collected by ensuring that these devices 26
themselves do not alter the physiology or behaviour of the recipient animal. This paper 27
reports on the development of a light weight “animal borne video and environmental data 28
collection system” (AVED), which can be deployed on animals as small as 11 kg, whilst still 29
meeting the desired 3% body weight threshold. This AVED (referred to as the “Kangaroo-30
cam”) simultaneously collects video footage and GPS location data for an average of 19 h. 31
Kangaroo-cams were deployed on seven kangaroos as a proof of concept of their potential 32
utility for the study of location specific behaviour and diet in a medium-sized terrestrial 33
herbivore. Following device recovery and data processing, we were able to successfully score 34
83 foraging events which allowed us to determine diet based on visual identification (to the 35
family level) of plants consumed. This approach could be further broadened to include a 36
comparison of plant species consumed versus plant species encountered to provide a novel 37
approach to diet selection analysis. When combined with GPS mapping of foraging locations, 38
this approach would allow researchers to address questions on diet selection at both fine 39
(within patch) and broad (habitat) spatial scales, overcoming some of the limitations of 40
traditional diet selection methodologies. However, animal capture and collar deployment 41
caused a significant elevation in stress hormone concentrations within the first 24 h post-42
capture, which highlighted the need to incorporate a time-delay capacity into these devices. 43
3
We conclude the paper by reviewing recent advances in the development of AVED 44
technology and providing suggestions for the improvement of this Kangaroo-cam device. 45
46
Keywords: AVED, biologger, diet selection, GPS, macropod, movement ecology, telemetry, 47
wildlife 48
49
Introduction 50
Over the last decade, there have been significant advances in the development of animal-borne 51
sensor technology. These sensors, often termed biologgers, provide data about an animal’s 52
movements, behaviour and/or physiology (Fehlmann and King 2016), and often facilitate the 53
collection of multiple forms of data simultaneously from wild animals. One particular type of 54
biologger that has seen significant technological advances recently is the “animal borne video 55
and environmental data collection system”, or AVED (Moll et al. 2007). 56
57
AVEDs simultaneously record fine scale geolocations and continuous video footage of the 58
environment from the perspective of the animal (Moll et al. 2007), thus facilitating the process 59
of video-tracking (Bluff and Rutz 2008). This combination of time-referenced location and 60
video images allow for a greater suite of ecological questions to be answered, including 61
understanding how animals interact with the environment or conspecifics, and developing 62
location and time-specific behavioural budgets (Moll et al. 2007). 63
Some of the greatest scientific impacts of animal-borne loggers have been in marine mammals 64
and birds, where direct observation is difficult or impossible (Machovsky-Capuska et al. 65
2016a; Machovsky-Capuska et al. 2016b; Pearson et al. 2017). AVEDs in particular have been 66
deployed predominantly in large marine animals or birds, and this is partly related to the large 67
4
size of these units, which limits the size of animal upon which they can be deployed, or the 68
short-term nature of deployments in birds. For example, Fehlmann and King (2016) recently 69
reported that 90% of papers presented at the 5th bio-logging symposium in Strasbourg in 2014 70
involved birds or marine mammals. As such, the development of technology for use in 71
terrestrial mammals has arguably fallen behind, despite many of the advantages of this 72
technology still being highly relevant to this group of animals. 73
74
Global positioning system (GPS) and other traditional telemetry technologies have been widely 75
used to study the movement patterns of a broad range of terrestrial mammals. While telemetry 76
units have the capacity to tell where an animal has been, they do not provide detailed 77
information about what the animal was doing at each geographic location without the addition 78
of other sensors (Machovsky-Capuska 2016a). This gap can be partially filled by the use of 79
traditional behavioural observations, but it is widely accepted that it is difficult, if not 80
impossible, to directly observe free-range behaviour of wildlife for extended periods of time 81
without affecting their behaviour (Beringer et al. 2004). Hence, AVEDs have the capacity to 82
provide an unbiased view of the complete repertoire of animal behaviour irrespective of the 83
location of an animal. As such, their potential utility is high, even for large, relatively 84
conspicuous, terrestrial mammal species. 85
86
In this paper, we report the development of the “Kangaroo-cam”, a biologger that 87
simultaneously collects video footage and the GPS location in time and space. Using the 88
eastern grey kangaroo (Macropus giganteus; hereafter kangaroo) as a sample medium-large 89
herbivorous, terrestrial mammal (females 17-42 kg, males 19-85 kg; Coulson 2008), we 90
explore their fine scale behaviour and foraging ecology. We specifically aim to: 1. establish 91
5
the diel activity budgets and location-specific behaviours; and 2. identify the feeding locations 92
and diet. Further, we wanted to explore whether the “Kangaroo-cam” collected an unbiased 93
sample of animal behaviour, as it is important to ensure that the devices themselves do not have 94
a welfare or behavioural impact on the animal carrying the logger (Moll et al. 2009; Thomson 95
and Heithaus 2014). Hence, an additional aim of this study was to determine whether kangaroos 96
elicited a discernible stress response to capture, restraint and device fitting, as measured by 97
faecal glucocorticoid metabolite concentrations (FGMs), which are a proxy for circulating 98
stress hormone concentrations (Sheriff et al. 2011). A noticeable stress response is likely to 99
indicate that the animal’s behaviour is altered by the deployment of the device and may not be 100
reflective of their “normal” behavioural repertoire, thereby influencing the integrity of the 101
results (Schulz et al. 2005). 102
103
Materials and methods 104
Study area 105
The study was conducted in February 2014 and 2015 at Nelson Bay Golf Course (NBGC), 106
which is located 208 km north of Sydney, Australia (32°43’31”S, 152°8’44”E). The NBGC 107
has a population of 100-200, individually identifiable (via ear tags), free-range kangaroos with 108
a high level of site fidelity, making it an ideal site for testing new animal tracking technology. 109
The golf course itself is comprised of exotic, improved pastures, and is surrounded by Tomaree 110
National Park (TNP) to the south and east. Vegetation in the areas of TNP bordering on the 111
golf course is predominantly comprised of “Blackbutt-Apple Open Forest on Deeper Sands” 112
(open dry-sclerophyll forest dominated by Blackbutt, Eucalyptus pilularis; Sydney Red Gum, 113
Angophora costata; Red Bloodwood, Corymbia gummifera; and Old Man Banksia, Banksia 114
serrata), with intermittent patches of “Nerong Open Forest” and “Wallum Scrub-Heath” (Bell 115
1997). 116
6
117
Animal handling and collar deployment 118
Seven adult kangaroos (females (n=5; two with no young, one with a young-at-foot and two 119
with pouch young; and males (n=2)) were immobilised using Zoletil (Virbac, Milperra, NSW, 120
Australia) at a concentration of approximately 5 mg/kg body weight, delivered by either a CO2 121
powered projector (X-calibre, Pneu-dart, Williamsport, PA, USA using a 1 cc 3/4” dart) or a 122
pole syringe (1 ml drug volume with 18 G ½” needle). Each kangaroo was weighed (digital 123
hanging scale, WS603, 150 x 0.05 kg, Wedderburn, Ingleburn, NSW, Australia), sexed and ear 124
tagged (sheep button and/or mini tags, Allflex, Capalaba, Qld, Australia) for unique 125
identification. Additional samples, such as blood samples, were also collected as part of other 126
investigations on these animals. Capture, measurements, sampling and Kangaroo-cam 127
deployment took around 20 min. Kangaroos were then left in handling bags for approximately 128
two and a half hours to fully recover from anaesthesia prior to release. Collars were retrieved 129
by recapture approximately seven days post-release to facilitate GPS and video data download. 130
This study was conducted with the approval of the University of Sydney Animal Ethics 131
Committee (N00/7-2012/3/5791) and the NSW National Parks and Wildlife Service 132
(SL100961). 133
134
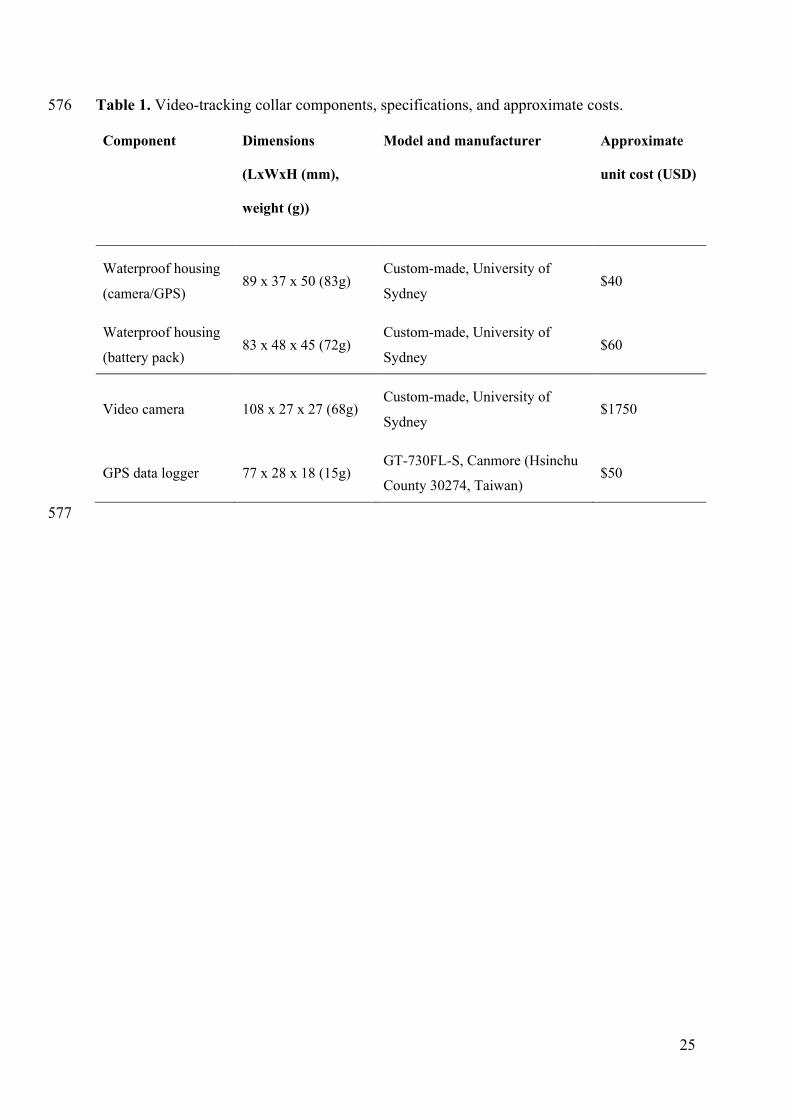
Kangaroo-cam devices 135
We combined a miniaturised camera (previoulsy incorporated into other species-specific 136
designs, see: Machovsky-Capuska et al. 2016b, Bombara et al. 2017, Pearson et al. 2017) with 137
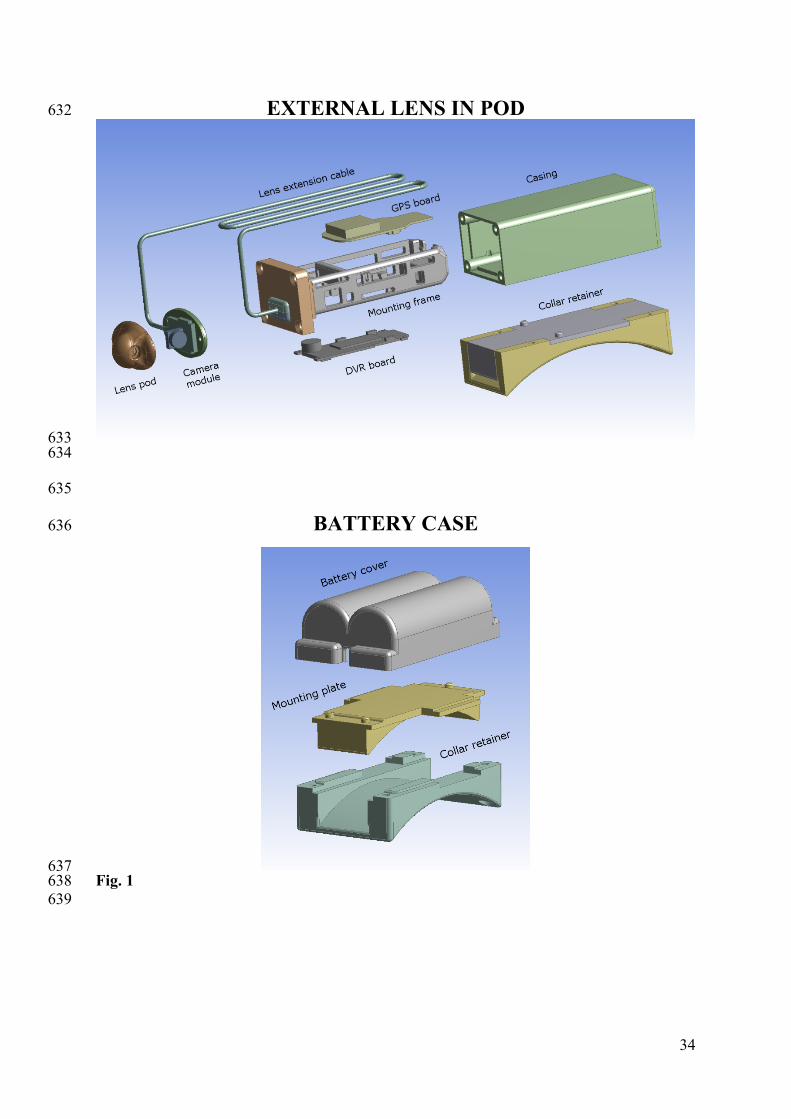
a GPS transmitter to develop video-tracking smart collars (Kangaroo-cam) (Fig. 1). The 138
miniaturised-video-camera (U10 AU HD USB Flash Drive DVR Camera DV, Taiwan; see 139
Machovsky-Capuska et al. 2016b for more details) and GPS logger (GT-730FL-S, Canmore, 140
Taiwan) were powered by two 3400 mAh lithium polymer batteries (Table 1). Two 3D-printed 141
7
plastic cases covered with water-resistant paint were used to enclose the miniature camera and 142
GPS logger (L: 89 x W: 50 x H:37 mm) and the batteries (L: 83 x W: 48 x H:45 mm). Both 143
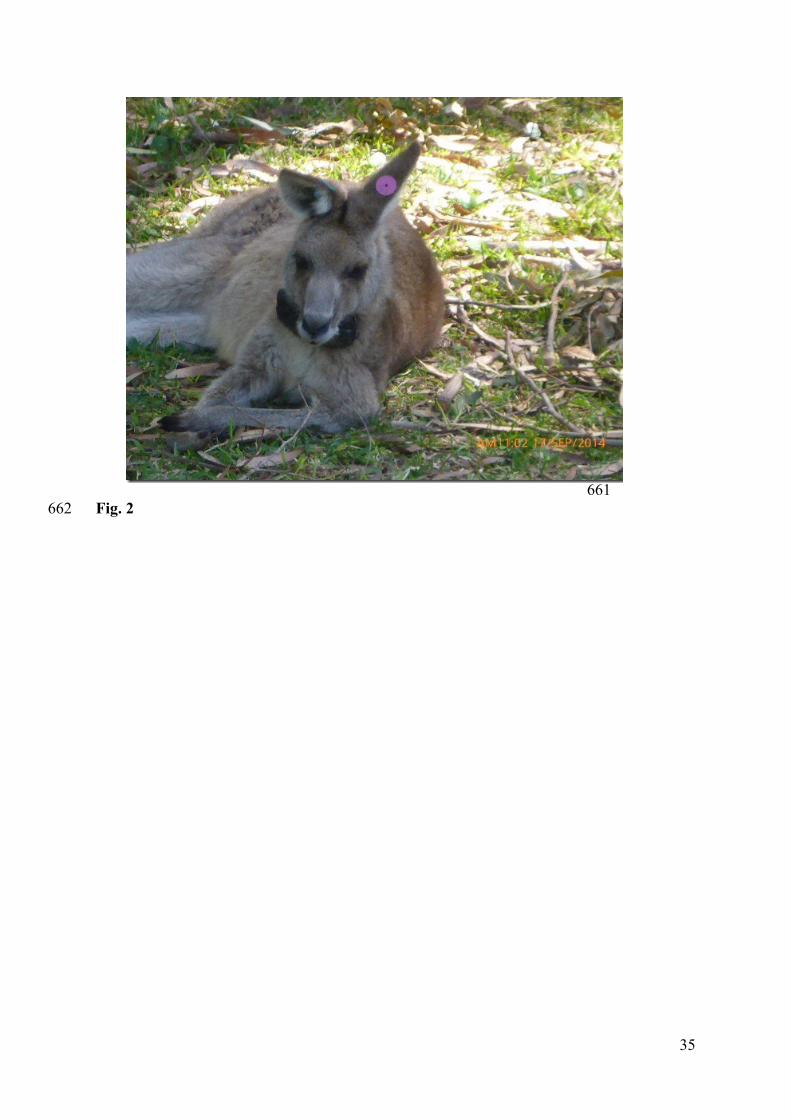
cases were attached to a medium dog collar (Fig. 2) and secured to the neck of the kangaroos 144
(Nexaband liquid tissue adhesive) to reduce movement. The collars recorded approximately 145
20 h of continuous video footage with a 36° field of view at 30 frames per second (720 x 480 146
HD) and latitute and longitude data for up to two days (1 s intervals). The smart collars weighed 147
330 g, which was < 3% of the weight of the kangaroo adult body mass (mean ± s.e.m. female 148
weight = 27.5 ± 1.5 kg (n = 5, range 22.5 - 30.3 kg); male weights 46.7 kg and 61.9 kg). The 149
camera was mounted on the side of the collar (Fig. 2), which represented a compromise 150
between having a viewing angle which permitted us to determine when an animal was actively 151
chewing, versus a better camera placement for a wider angle of view, which may have made 152
it difficult to tell whether the animal was actively chewing. 153
154
Kangaroo behaviours 155
Kangaroo-cams enabled us to extract fine scale detailed behaviours. We determined the amount 156
of time that animals undertook each of the following behaviours (to the nearest second): i) 157
resting: the animal was lying down and not feeding, sometimes sleeping; ii) feeding: the animal 158
had its head towards the ground and started nosing different foods until it raised its head again 159
(Garnick et al. 2010), including chewing and foraging at the same time; iii) grooming: the 160
animal was either scratching, self-cleaning, wetting forearms/inner thighs; iv) hopping: the 161
animal was in a bipedal motion; vi) standing: the animal was upright and stationary and not 162
actively feeding or chewing. These behavioural categories were mutually exclusive. Because 163
we were predominantly interested in exploring feeding behaviour, this category took 164
precedence over the other categories, and may include an animal that was simultaneously lying 165
or standing and feeding. 166
8
167
Feeding behaviour 168
Feeding events were identified from the videos as those where the animal could be seen to scan 169
available forage (usually depicted by the animal nosing different plants in the environment) 170
and select plant material, followed by short up-and-down head movements (discernible from 171
the movement of the camera or in some cases the animals jaw could be seen moving) that were 172
defined as chewing. The combination of these behaviours was considered as a feeding event. 173
Feeding events separated by less than 1 min were treated as a single feeding event regardless 174
of the behaviour displayed in the intervening time to ensure that each feeding event was 175
independent and involved separate forage selection. For each feeding event, the plants that 176
were consumed were identified to Family based on visual characteristics. In some cases, 177
identification to species level was possible when the plant displayed unique characteristics or 178
displayed reproductive characters to confidently allow identification to that level. All 179
identifications were verified using PlantNet NSW Flora Online descriptions and distribution 180
data (National Herbarium of New South Wales). 181
182
Video-tracking technique 183
The internal GPS clock and the camera clock were synchonised after recovery. The GPS clock 184
was set to Australian Eastern Daylight Savings time (AEDT) and the camera clock recorded 185
the time that had elapsed since it started recording video. As both devices were turned on 186
simultaneously, the starting time for both could be ascertained and “common times” recorded 187
for both as either AEDT or time (in seconds) relative to deployment. Once behavioural events 188
were identified by the video analysis, they were assigned to the GPS location with the same 189
common time within ArcGIS 3.2. When the behavioural event occurred at a time with no exact 190
coincident position, it was assigned to the position closest in time, within a tolerance range of 191
9
30 s. According to the average speed reported for these animals (6 km/h, Garnick et al. 2010), 192
this is a very conservative and accurate criterion to geographically locate behaviours. 193
Following this procedure, a total of 87 behavioural events were identified and classified as one 194
of three distinctive behavioural states (see below) and each assigned to a geographic location. 195
Behavioural states with "common times" greater than 30 s to the closest position were discarded 196
from further analysis. 197
198
Using the above-mentioned video-tracking technique, we established the spatio-temporal scale 199
of three distinctive behavioural states: i) feeding, ii) resting and iii) moving. Kernel areas (50 200
(core), 60, 70, 80, 90 and 95%) were calculated for each animal using the adaptive Kernel 201
method (Worton 1989) using the Home Range Tools extension in ArcGIS 9.8. Finally, these 202
behavioural states were plotted on a map, along with movement tracks and Kernel areas to give 203
a map of behavioural activities at different locations. 204
205
Faecal glucocorticoid metabolite assay 206
The physiological response to collar deployment was determined by measuring faecal 207
glucocorticoid metabolites (FGMs) in an additional subset of animals carrying collars that were 208
of similar weights to the devices used in the study, but minus the camera lens, as it was not 209
possible to collect samples at the time of the initial deployment. Stress hormone concentrations 210
were determined by measuring FGMs at 0, 24 and 48 h post-capture and collar deployment in 211
six animals (four females and two males), compared with the response to the same capture, 212
handling and release (without collar deployment) in eight control animals (four males and four 213
females). The females in the collar group had pouch young (PY) that were 10 d and 161 d, 214
while the remaining two had no PY. The control (capture only) females had PY that were 10 215
d, 62 d, 86 d and the remaining female had no PY. Circulating stress hormones 216
10
(glucocorticoids, predominantly cortisol) are metabolised in the liver and secreted in faeces 217
following a lag time, which is equivalent to 24 h in this species (Fanson et al. 2017). Hence, 218
FGM concentrations at 0 h represent the baseline, pre-capture circulating stress hormone 219
concentration, with 24 h samples being indicative of the time of capture and 48 h samples 220
representing one day post capture and collar fitting. 221
222
Faecal samples were collected when voided at the time of capture and immobilisation and at 223
other times by searching the golf course for the collared or control individuals 24 and 48 h post 224
capture. All animals have a unique ear tag colour and number combination, which can be 225
readily discerned from distances in excess of 50 m with binoculars (Nikon, 10 x 50, Monarch 226
5, M511) or a spotting scope (Nikon, Prostaff 5, 20-60 x). Once a collared animal was 227
identified, its ear tag number was recorded and the animal was observed from a distance until 228
it defecated. Once defecation occurred, the faecal sample was visually located and collected in 229
a zip-lock bag, and stored on ice for up to 4 h before being placed in long-term storage at -20° 230
C for subsequent enzyme immune-assay to determine FGM concentrations. 231
232
FGMs were extracted from 0.5 g (± 0.01 g) thawed wet faeces with 5 ml of 80% methanol, 233
following the method described by Fanson et al. (2017). The EIA used an antibody raised in 234
rabbits against the FGM 3b,5a-tetrahydrocorticosterone (37e; Touma et al. 2003), and has 235
previously been validated in eastern grey kangaroos (Fanson et al. 2017) by demonstrating an 236
increase in FGM 24 h post adrenocorticotropic hormone (ACTH) challenge. The assay was run 237
as described in Fanson et al. (2017). Briefly, 0.05 ml of standard, diluted faecal extract, or 238
control were added to duplicate wells of a pre-coated 96-well plate, followed by 0.1 ml 239
biotinylated steroid (working dilution 1:15,000) and 0.1 ml of primary antibody (working 240
dilution 1:15,000). Plates were incubated overnight at 4° C and then washed 3 times before 241
11
0.25 ml streptavidin-peroxidase was added to each well. After 45 min incubation at 4° C, plates 242
were washed 6 times and 0.25 ml TMB substrate was added. The reaction was stopped with 243
0.05 ml H2SO4 and optical density measured at 450 nm using a Dynex MRX Revelation plate 244
reader (after Fanson et al. 2017). The intra-assay coefficient was calculated from repeated 245
measures of 10 – 20 replicates of a single sample on one plate at 12.0%. Likewise, the inter-246
assay coefficients were calculated for low (7.7%) and high (12.9%) controls. The assay 247
sensitivity was 0.02 ng/ml. 248
249
Data analyses 250
To assess the differences in food consumption in relation to geographic location and food type 251
we used generalised linear models (GLMs). The first GLM was specified with a binary 252
response denoting whether or not an observed feeding event occurred within the NBGC (0) or 253
TNP (1). A second model depicted whether the kangaroos consumed native (0) vs non-native 254
(1) plants. The third model tested whether foraging location (NBGC vs TNP) influenced the 255
consumption of the different plant groups. 256
257
FGM concentrations were compared between collared and non-collared animals at 0, 24 and 258
48 h post-immobilisation, using the general linear model (repeated measures) function, the 259
model being y = treatment, time, treatment × time, with time as the repeated subject. Results 260
are presented as mean ± s.e.m. All analyses were performed using the software SPSS (IBM, 261
SPSS Statistics, version 24; Chicago, IL) 262
263
Results 264
Camera deployments 265
12
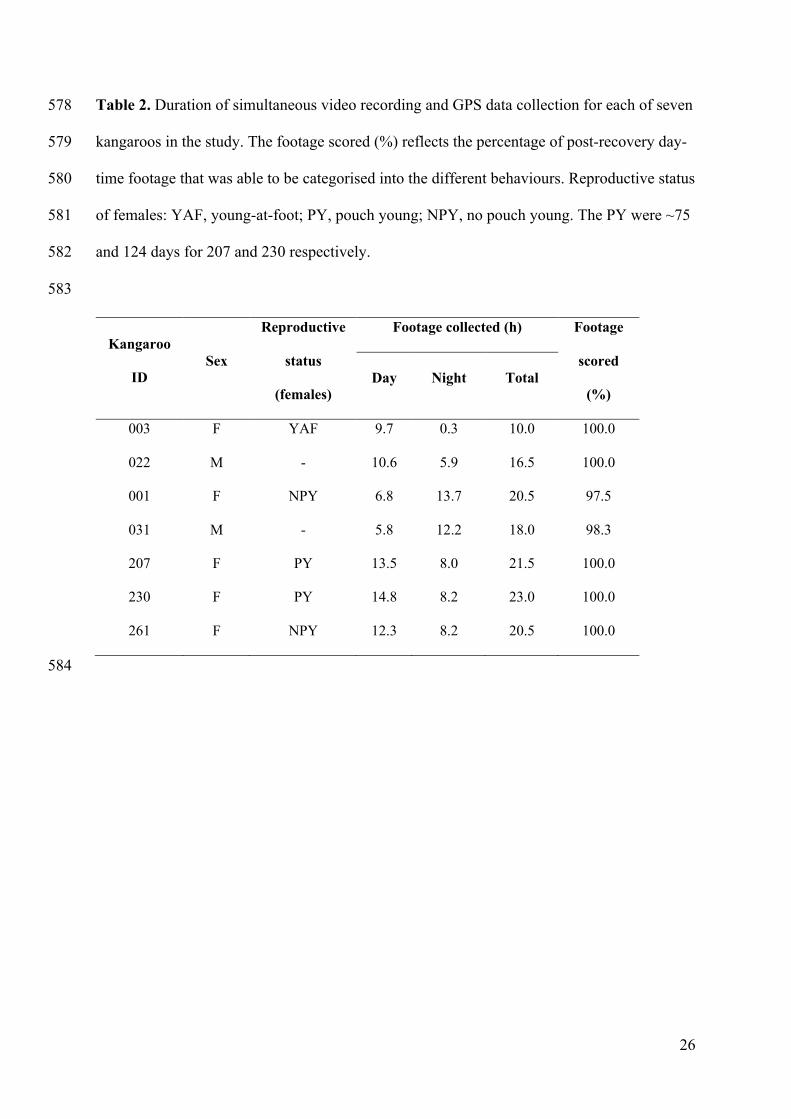
We collected 130 h of video footage from the seven kangaroos fitted with “Kangaroo-cams”, 266
with an average recording duration of 18.6 ± 1.6 h per animal. This included periods of day 267
and night for each animal (Table 2). 268
269
Kangaroo behaviour and diel activity patterns 270
For each kangaroo, an average of 99.9% of the post-release, day-time video footage was able 271
to be characterised into the different behavioural states, ranging from 97.5 - 100% (Table 2). 272
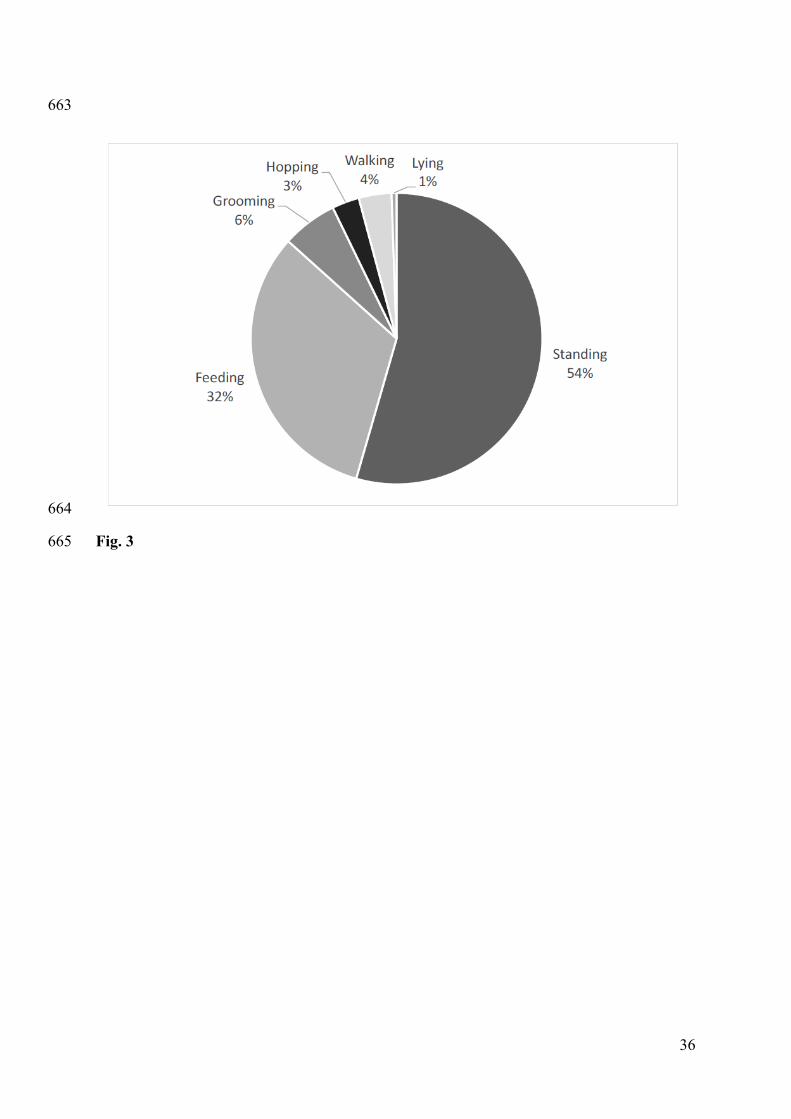
Overall, kangaroos spent the majority of their daytime hours standing or feeding (Fig. 3). 273
274
Feeding behaviour 275
A total of 83 feeding events were recorded and scored from the video footage (12 ± 4 per 276
animal). Of the total observed feeding events, 57% (n=47) occurred on the golf course 277
whereas 35 (n=36) were within the national park (Wald test, z = 12.18, df = 1, P < 0.0001). 278
Kangaroos consumed significantly more non-native (76%), than native plants (24%) (Wald 279
test, z = 41.10, df = 1, P < 0.0001). 280
281
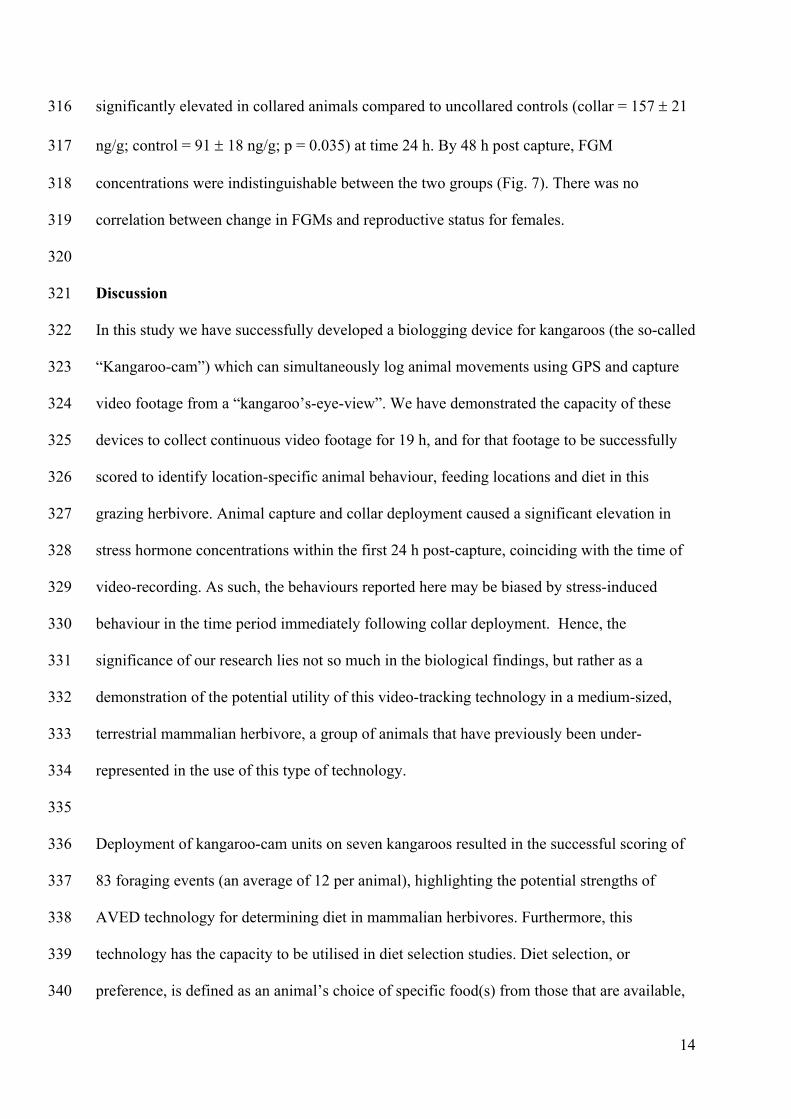
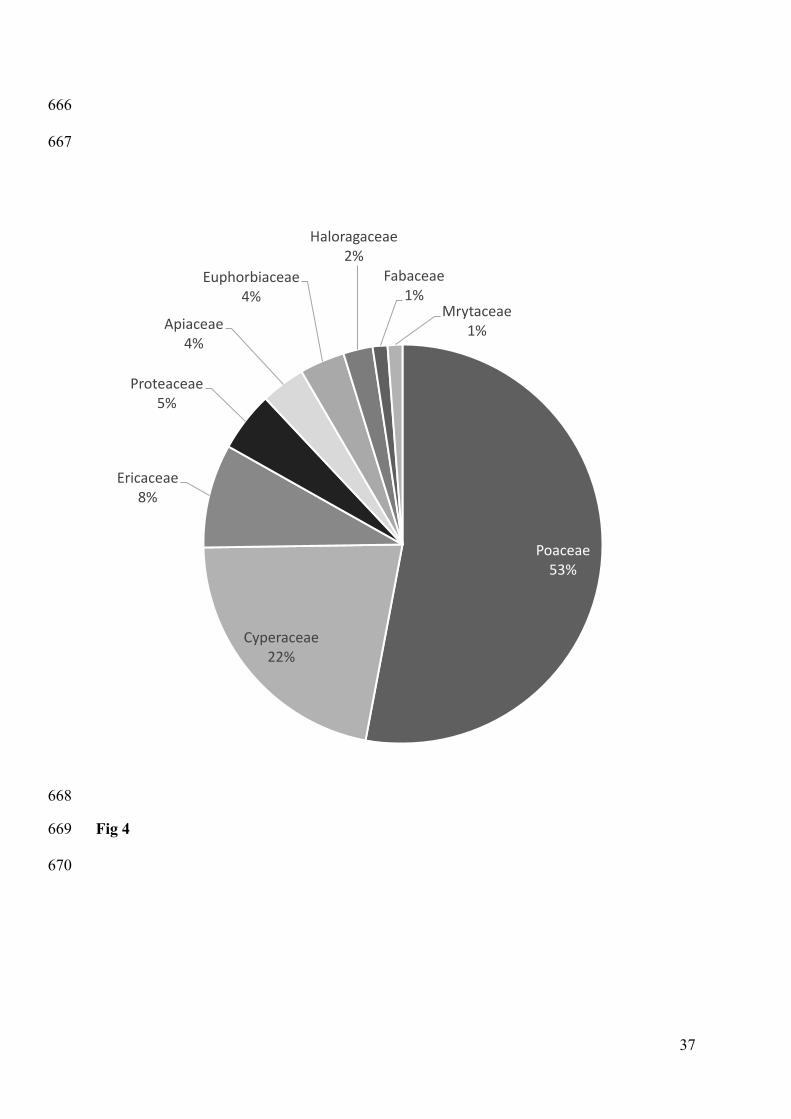
A total of nine plant families were identified in foraging events (Fig. 4), but over 50% of their 282
forage intake was from the Family Poaceae (grasses) and 22% from Cyperaceae (perennial or 283
annual herbs) (Fig. 4). Consumption of plants in the family Poaceae and Haloragaceae was 284
positively associated with foraging on the golf course rather than the national park (Poaceae: 285
Wald test, z = 7.46, df = 1, P < 0.0001; Haloragaceae: Wald test, z = 6.48, df = 1, P < 0.01). 286
However, no significant differences in foraging locations were observed for the other plant 287
families. 288
289
Behaviour and habitat use 290
13
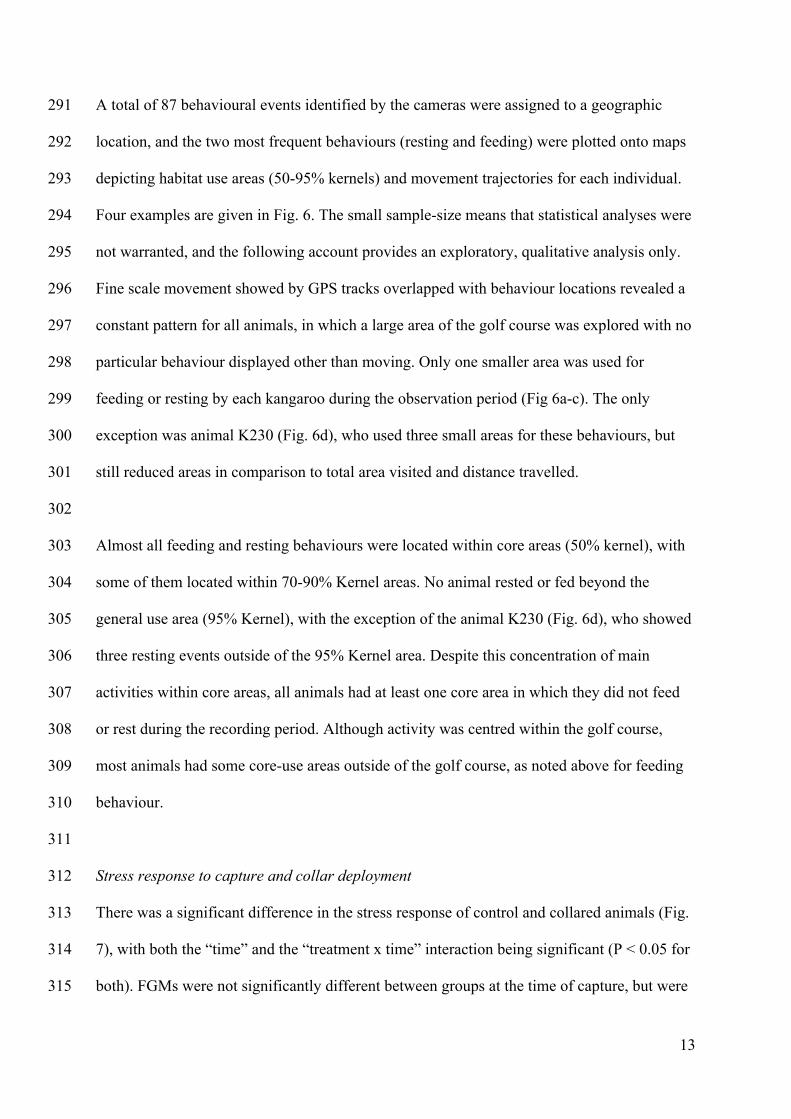
A total of 87 behavioural events identified by the cameras were assigned to a geographic 291
location, and the two most frequent behaviours (resting and feeding) were plotted onto maps 292
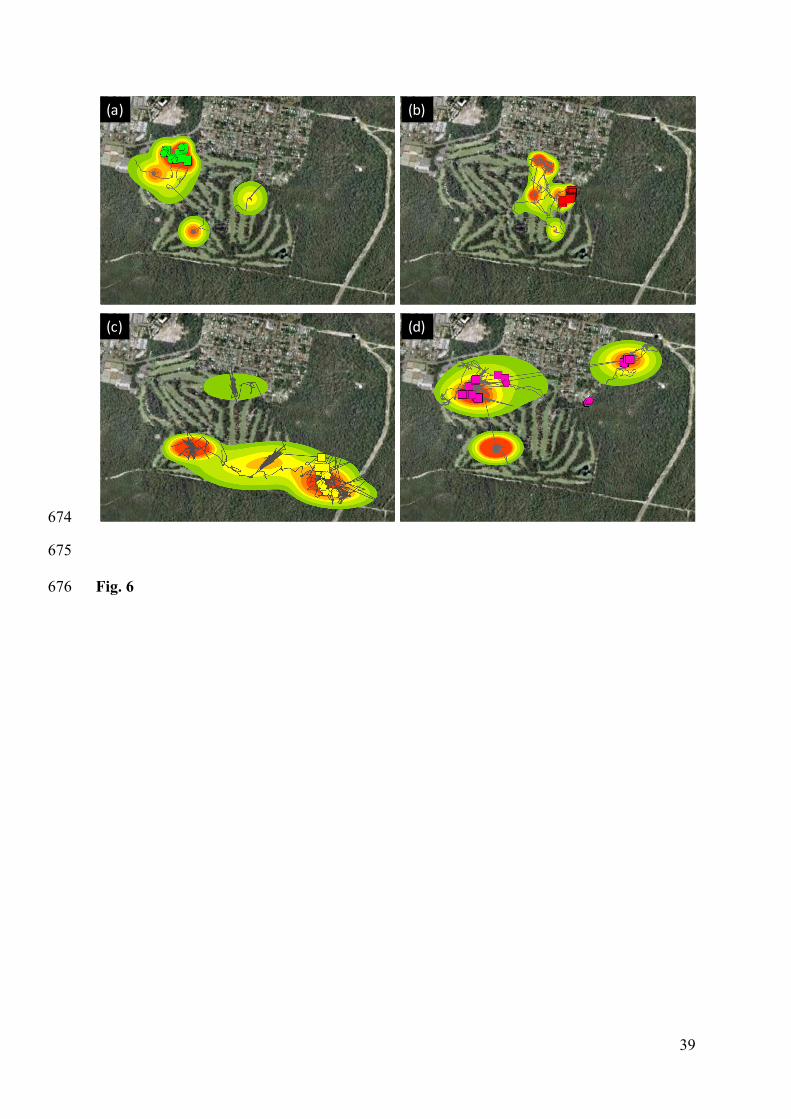
depicting habitat use areas (50-95% kernels) and movement trajectories for each individual. 293
Four examples are given in Fig. 6. The small sample-size means that statistical analyses were 294
not warranted, and the following account provides an exploratory, qualitative analysis only. 295
Fine scale movement showed by GPS tracks overlapped with behaviour locations revealed a 296
constant pattern for all animals, in which a large area of the golf course was explored with no 297
particular behaviour displayed other than moving. Only one smaller area was used for 298
feeding or resting by each kangaroo during the observation period (Fig 6a-c). The only 299
exception was animal K230 (Fig. 6d), who used three small areas for these behaviours, but 300
still reduced areas in comparison to total area visited and distance travelled. 301
302
Almost all feeding and resting behaviours were located within core areas (50% kernel), with 303
some of them located within 70-90% Kernel areas. No animal rested or fed beyond the 304
general use area (95% Kernel), with the exception of the animal K230 (Fig. 6d), who showed 305
three resting events outside of the 95% Kernel area. Despite this concentration of main 306
activities within core areas, all animals had at least one core area in which they did not feed 307
or rest during the recording period. Although activity was centred within the golf course, 308
most animals had some core-use areas outside of the golf course, as noted above for feeding 309
behaviour. 310
311
Stress response to capture and collar deployment 312
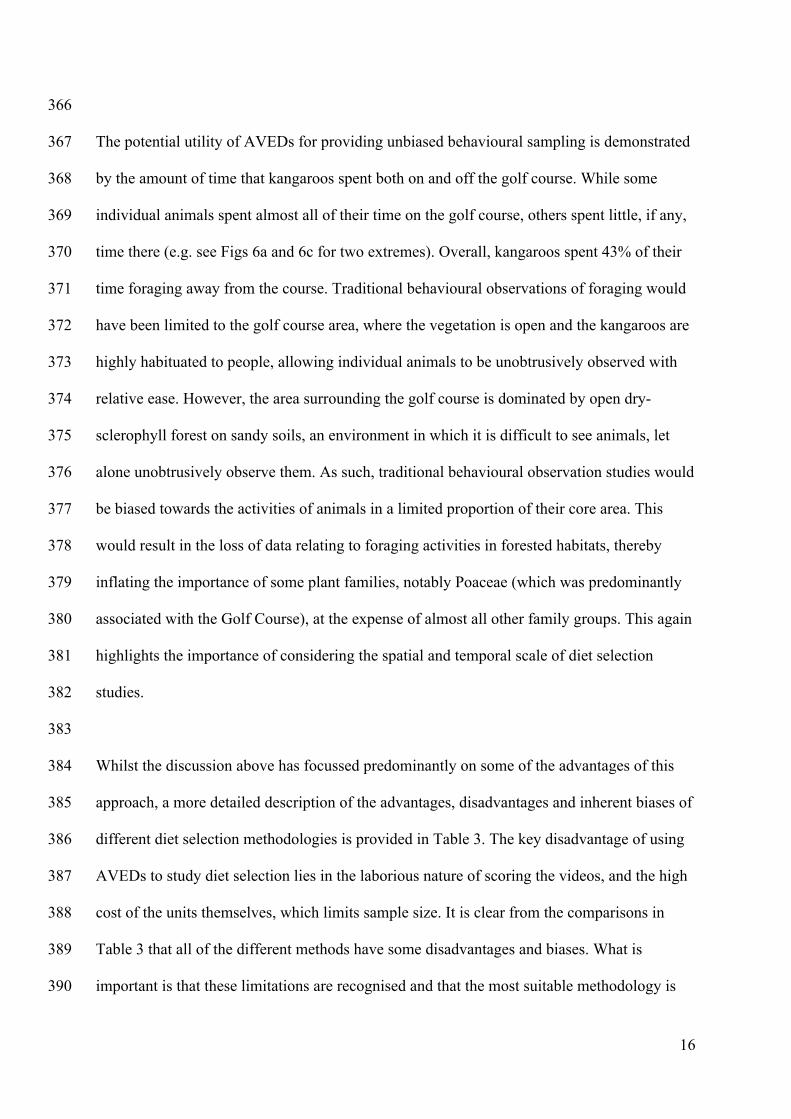
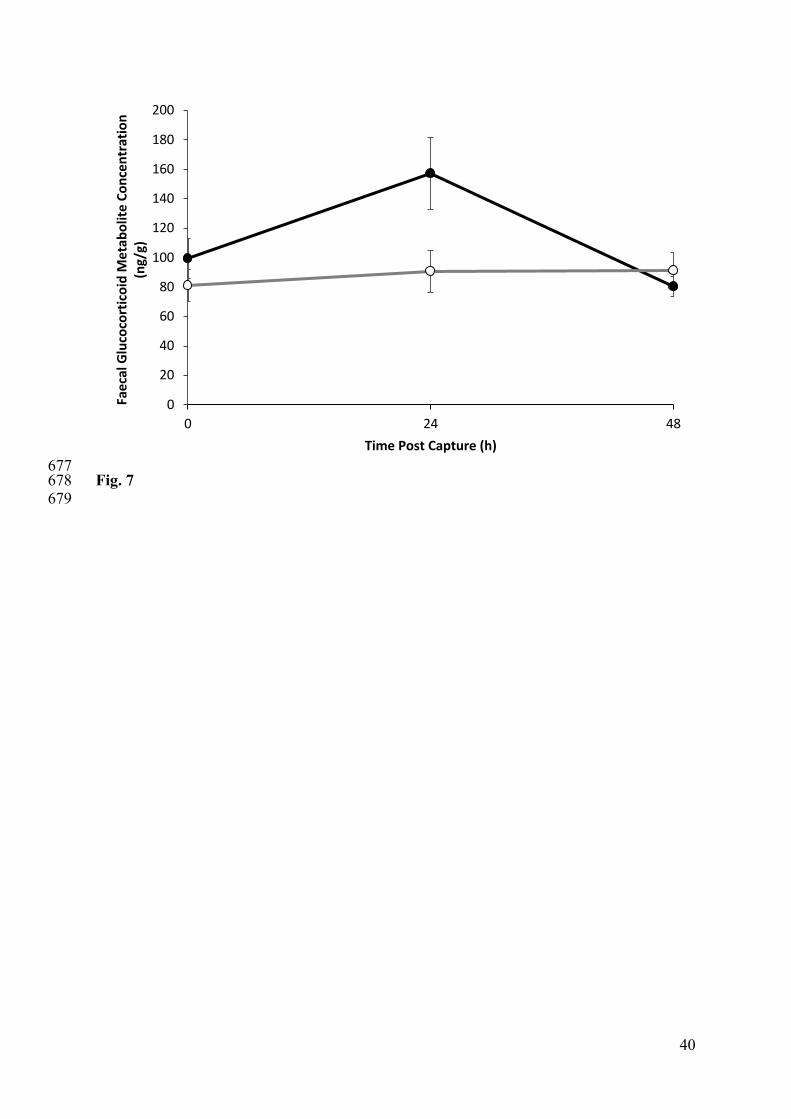
There was a significant difference in the stress response of control and collared animals (Fig. 313
7), with both the “time” and the “treatment x time” interaction being significant (P < 0.05 for 314
both). FGMs were not significantly different between groups at the time of capture, but were 315
14
significantly elevated in collared animals compared to uncollared controls (collar = 157 ± 21 316
ng/g; control = 91 ± 18 ng/g; p = 0.035) at time 24 h. By 48 h post capture, FGM 317
concentrations were indistinguishable between the two groups (Fig. 7). There was no 318
correlation between change in FGMs and reproductive status for females. 319
320
Discussion 321
In this study we have successfully developed a biologging device for kangaroos (the so-called 322
“Kangaroo-cam”) which can simultaneously log animal movements using GPS and capture 323
video footage from a “kangaroo’s-eye-view”. We have demonstrated the capacity of these 324
devices to collect continuous video footage for 19 h, and for that footage to be successfully 325
scored to identify location-specific animal behaviour, feeding locations and diet in this 326
grazing herbivore. Animal capture and collar deployment caused a significant elevation in 327
stress hormone concentrations within the first 24 h post-capture, coinciding with the time of 328
video-recording. As such, the behaviours reported here may be biased by stress-induced 329
behaviour in the time period immediately following collar deployment. Hence, the 330
significance of our research lies not so much in the biological findings, but rather as a 331
demonstration of the potential utility of this video-tracking technology in a medium-sized, 332
terrestrial mammalian herbivore, a group of animals that have previously been under-333
represented in the use of this type of technology. 334
335
Deployment of kangaroo-cam units on seven kangaroos resulted in the successful scoring of 336
83 foraging events (an average of 12 per animal), highlighting the potential strengths of 337
AVED technology for determining diet in mammalian herbivores. Furthermore, this 338
technology has the capacity to be utilised in diet selection studies. Diet selection, or 339
preference, is defined as an animal’s choice of specific food(s) from those that are available, 340
15
and therefore requires a quantitative comparison of what is ingested by an animal versus what 341
is available to that animal at a given place and time (Norbury and Sanson 1992). As such, still 342
frames from the video footage of foraging events can be used to identify the plants 343
immediately available to an animal, versus those actively consumed, in a foraging event. This 344
has the capacity to overcome many of the current limitations with diet selection studies, 345
which is the ability to look at diet selection at different temporal and spatial scales. At a 346
broader scale, GPS tracking data can be used to ascertain the broader habitat utilisation 347
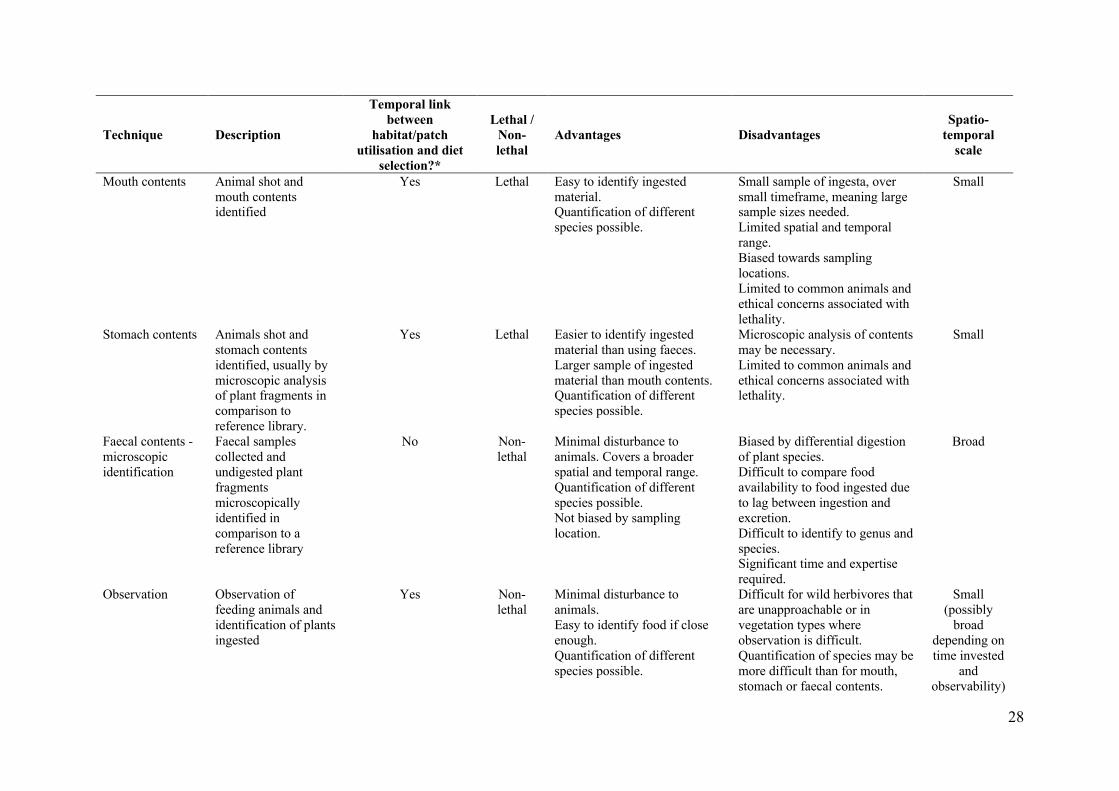
choice through the analysis of home range location. At a finer scale, foraging locations within 348
a home range can be mapped by utilising the combined video and GPS data. At an even finer 349
scale again, preferred plants within those feeding areas can also be determined. Other 350
methodological approaches for measuring diet selection tend to focus on one or other of these 351
spatial and temporal scales (summarised in Table 3), thereby limiting the scale at which 352
statements about diet selection can be made and the ecological questions that can be 353
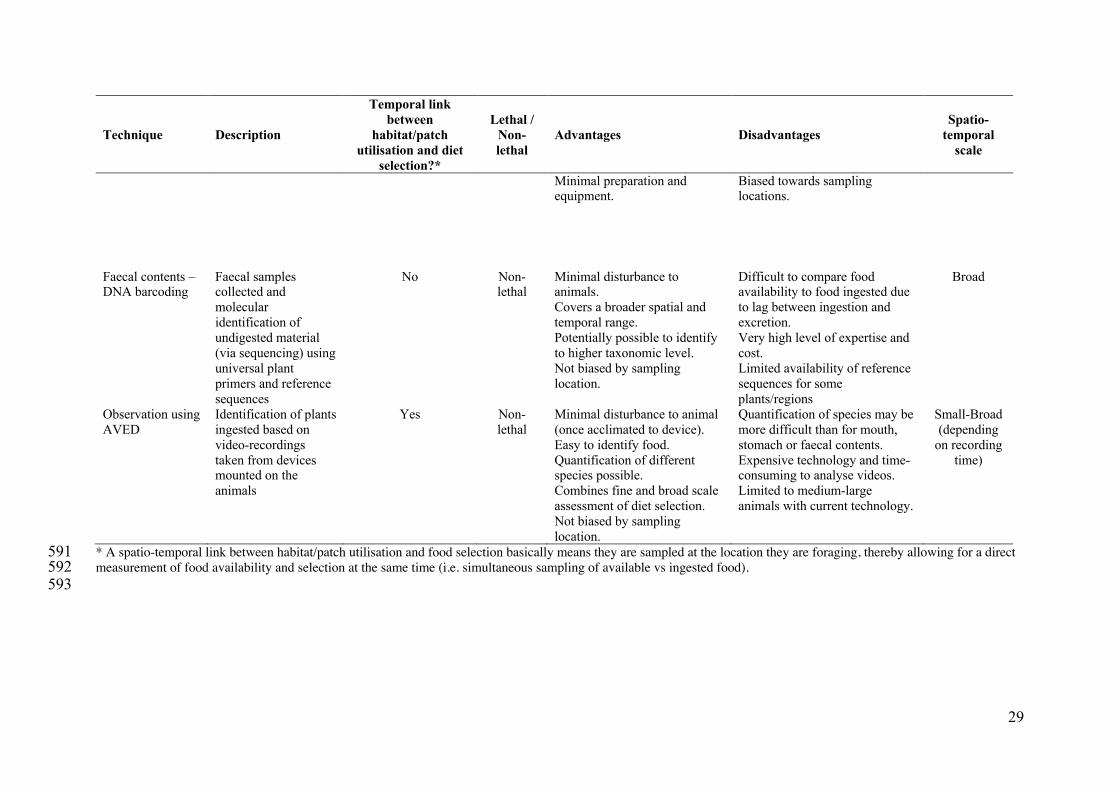
answered (Norbury and Sanson 1992). As such, one of the real advantages of incorporating 354
AVED technology into diet selection studies is the capacity to measure diet selection across a 355
range of spatial scales, using the one sampling approach to determine what foods the animals 356
encounter (i.e. availability) and what they ingest (i.e. select), regardless of where they eat it. 357
This removes any potential location sampling bias, as animals are sampled irrespective of 358
their location rather than the researcher choosing where they sample. It also ensures there is 359
not a mismatch between the scale at which food availability and selection are assessed as 360
both can be measured simultaneously within video frames. It also allows both fine-scale, 361
within patch selection to be measured as well a broader-scale habitat selection within an 362
animal’s home-range. For example, in the current study we could determine exactly where an 363
animal was foraging within its home range (Fig. 6), as well as what individual plants animals 364
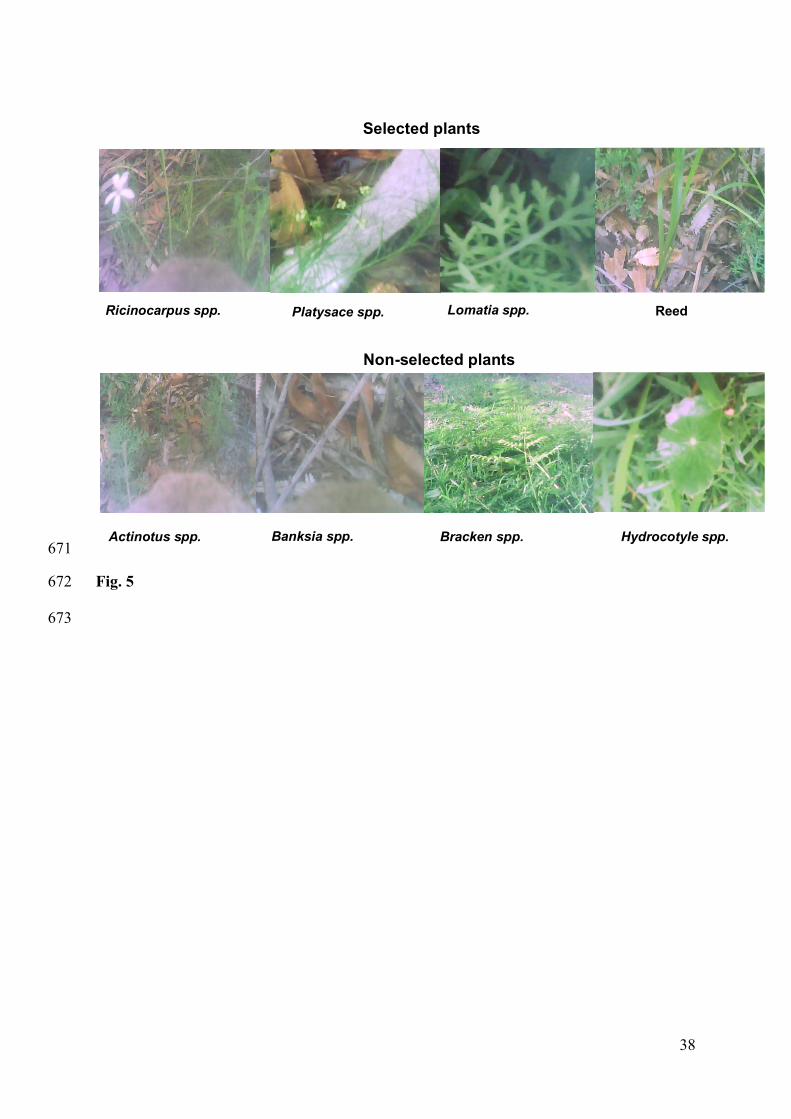
were consuming or avoiding within patches (Fig. 5). 365
16
366
The potential utility of AVEDs for providing unbiased behavioural sampling is demonstrated 367
by the amount of time that kangaroos spent both on and off the golf course. While some 368
individual animals spent almost all of their time on the golf course, others spent little, if any, 369
time there (e.g. see Figs 6a and 6c for two extremes). Overall, kangaroos spent 43% of their 370
time foraging away from the course. Traditional behavioural observations of foraging would 371
have been limited to the golf course area, where the vegetation is open and the kangaroos are 372
highly habituated to people, allowing individual animals to be unobtrusively observed with 373
relative ease. However, the area surrounding the golf course is dominated by open dry-374
sclerophyll forest on sandy soils, an environment in which it is difficult to see animals, let 375
alone unobtrusively observe them. As such, traditional behavioural observation studies would 376
be biased towards the activities of animals in a limited proportion of their core area. This 377
would result in the loss of data relating to foraging activities in forested habitats, thereby 378
inflating the importance of some plant families, notably Poaceae (which was predominantly 379
associated with the Golf Course), at the expense of almost all other family groups. This again 380
highlights the importance of considering the spatial and temporal scale of diet selection 381
studies. 382
383
Whilst the discussion above has focussed predominantly on some of the advantages of this 384
approach, a more detailed description of the advantages, disadvantages and inherent biases of 385
different diet selection methodologies is provided in Table 3. The key disadvantage of using 386
AVEDs to study diet selection lies in the laborious nature of scoring the videos, and the high 387
cost of the units themselves, which limits sample size. It is clear from the comparisons in 388
Table 3 that all of the different methods have some disadvantages and biases. What is 389
important is that these limitations are recognised and that the most suitable methodology is 390
17
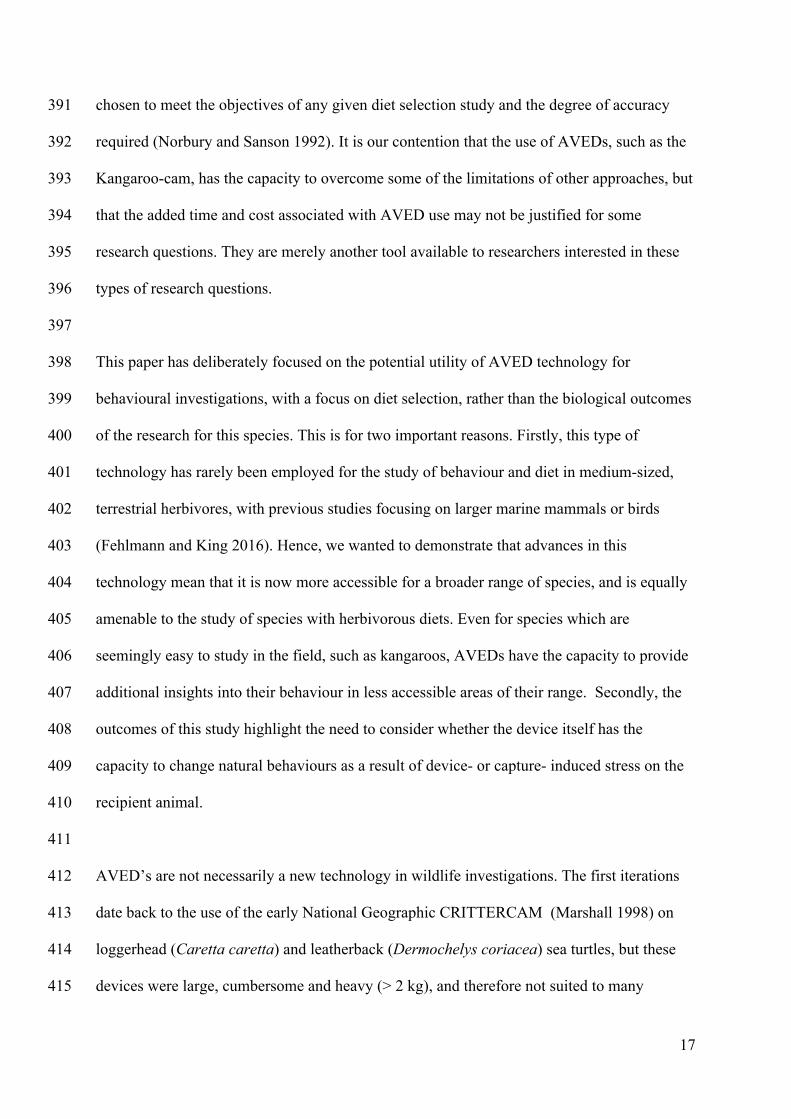
chosen to meet the objectives of any given diet selection study and the degree of accuracy 391
required (Norbury and Sanson 1992). It is our contention that the use of AVEDs, such as the 392
Kangaroo-cam, has the capacity to overcome some of the limitations of other approaches, but 393
that the added time and cost associated with AVED use may not be justified for some 394
research questions. They are merely another tool available to researchers interested in these 395
types of research questions. 396
397
This paper has deliberately focused on the potential utility of AVED technology for 398
behavioural investigations, with a focus on diet selection, rather than the biological outcomes 399
of the research for this species. This is for two important reasons. Firstly, this type of 400
technology has rarely been employed for the study of behaviour and diet in medium-sized, 401
terrestrial herbivores, with previous studies focusing on larger marine mammals or birds 402
(Fehlmann and King 2016). Hence, we wanted to demonstrate that advances in this 403
technology mean that it is now more accessible for a broader range of species, and is equally 404
amenable to the study of species with herbivorous diets. Even for species which are 405
seemingly easy to study in the field, such as kangaroos, AVEDs have the capacity to provide 406
additional insights into their behaviour in less accessible areas of their range. Secondly, the 407
outcomes of this study highlight the need to consider whether the device itself has the 408
capacity to change natural behaviours as a result of device- or capture- induced stress on the 409
recipient animal. 410
411
AVED’s are not necessarily a new technology in wildlife investigations. The first iterations 412
date back to the use of the early National Geographic CRITTERCAM (Marshall 1998) on 413
loggerhead (Caretta caretta) and leatherback (Dermochelys coriacea) sea turtles, but these 414
devices were large, cumbersome and heavy (> 2 kg), and therefore not suited to many 415
18
animals (Bicknell et al. 2016). The Kangaroo-cam presented here is one example of how 416
such limitations are now being overcome. Table 4 compares the weight and technical 417
specifications of the Kangaroo-cam to a sample of historic and more recent innovative 418
AVEDs reported in the literature. This table highlights the dramatic reductions in weight of 419
devices, with seemingly simultaneous increases in recording times. As one example, the 420
Kangaroo-cam could potentially be deployed on animals as small as 11 kg, whilst still 421
meeting the desired 3% body weight threshold (and still obtaining approximately 19 h of 422
video footage). 423
424
The capture of kangaroos and fitting of Kangaroo-cam devices resulted in a transient increase 425
in FGM concentrations, which is indicative of a physiological stress response (Sheriff et al. 426
2011). This increase was not seen in control animals, which were captured and handled but 427
did not have collars fitted, suggesting that the collar itself is inducing a stress response, 428
independent of the capture process. These results are similar to those reported for white-tailed 429
deer (Odocoileus virginianus) fitted with AVEDs (Moll et al. 2009) and Dickcissels (Spiza 430
americana) fitted with radio-transmitters (Wells et al. 2003). Although Moll et al. (2009) 431
reported no difference between AVED and control deer over an extended period of time, 432
closer scrutiny of their data shows a transient increase in FGM in the acute period post collar 433
fitting. In all studies, this transient elevation in FGMs had diminished within 24 h. As such, it 434
is unlikely that this acute physiological response is detrimental to the welfare of the animal 435
(Wells et al. 2003). These findings are relevant, however, to the question of the integrity of 436
the data collected and point towards the need to exclude data collected during the first 1-2 d 437
after collar deployment, as it may not reflect the “normal” behaviour of the animals. In the 438
case of AVEDs, where battery life is so limited, this highlights the need to incorporate a 439
19
time-delay option for the commencement of recording, as has been incorporated into other 440
devices (e.g. Beringer et al. 2004; Bluff and Rutz 2008; Table 4). 441
442
The video-recording timeframe for the units developed in this study (approximately 19 h) 443
represents one of the longest recording timeframes reported (Table 4), and highlights the 444
recent advances in battery efficiency. However, the current study did not effectively utilise 445
this entire timeframe, as the camera was recording continuously from the time of deployment, 446
including anaesthetic recovery and night time when videos were un-scorable. As such, the 447
benefits of this enhanced battery life were not fully realised in this study. Further 448
modifications to the devices, such as addition of programable recording intervals (e.g. 449
Nifong et al. 2013; Nifong et al. 2014; Table 4) or a light-activated time-delay switch 450
(Beringer et al. 2004; Table 4), would ensure that the benefits of enhanced battery life are 451
fully realised in the future. 452
453
In this paper, we have discussed the advantages of this approach for diet selection studies in 454
kangaroos, and other terrestrial herbivores more generally (see Table 3 for a summary). 455
However, AVEDs have the capacity to study other aspects of the biology of wild animals, 456
including social interactions. For example, a study employing a similar device on domestic 457
dogs was used to establish contact rates between con-specific animals (Bombara et al. 2017). 458
In the current study we were surprised by how few social interactions we observed between 459
conspecific kangaroos, especially since this species is highly gregarious and feeds in large 460
groups (or mobs) out in the open (Coulson 2008). This failure to observe close social 461
interactions is likely to be a result of the camera placement on the collar, rather than the 462
absence of such behavioural interactions. Mounting the camera on the side of the collar to 463
maximise our observations of feeding behaviour reduced the angle of view, which probably 464
20
accounts for the lack of social observations. Moreover, we found it difficult to find a robust 465
way of affixing the camera to the head of the animal (which would facilitate a broader view), 466
whilst still maintaining the cables between the battery unit and recording unit. 467
468
In conclusion, this study has demonstrated the potential utility of AVEDs for studying diet 469
selection in a medium-sized, terrestrial herbivore. Whilst the technology is not without its 470
limitations, modifications to the existing “Kangaroo-cam” and the addition of other sensors, 471
has the capacity to further enhance the utility of this behavioural sampling approach. 472
473
Acknowledgements 474
This research was funded by the Faculty of Veterinary Science through an intramural 475
fellowship, in collaboration with the Charles Perkins Centre, awarded to CAH. The authors 476
would like to express their gratitude to Nelson Bay Golf Club for allowing us to work on 477
their site, and for supplying us with numerous in-kind resources. We are also deeply indebted 478
to the many volunteers who have contributed to this project. We thank two anonymous 479
referees for their insightful comments on the manuscript. 480
481
References 482
Bell, S. A. J. 1997. Tomaree National Park Vegetation Survey. Report to NSW National 483
Parks and Wildlife Service Hunter District. . 484
https://data.nsw.gov.au/data/dataset/tomaree-national-park-vegetation-1998-vis_id-485
661613be/resource/ed9f5ee5-529d-47fa-8021-9068f0c548b3, NSW National Parks 486
and Wildlife Service. 487
21
Beringer, J., Millspaugh, J. J., Sartwell, J. and Woeck, R. 2004. Real-time video 488
recording of food selection by captive white-tailed deer. Wildlife Society Bulletin 489
32(3): 648-654. 490
Bicknell, A. W. J., Godley, B. J., Sheehan, E. V., Votier, S. C. and Witt, M.J. 2016. 491
Camera technology for monitoring marine biodiversity and human impact. 492
Frontiers in Ecology and the Environment 14(8): 424-432. 493
Bluff, L. A. and Rutz, C. 2008. A quick guide to video-tracking birds. Biology Letters 4(4): 494
319-322. 495
Bombara, C. B., Durr, S., Machovsky-Capuska, G. E., Jones, P. W. and Ward M. P. 496
2017. A preliminary study to estimate contact rates between free-roaming domestic 497
dogs using novel miniature cameras. Plos One 12(7). 498
Bowen, W. D., Tully, D., Boness, D. J., Bulheier, B. M. and Marshall, G. J. 2002. Prey-499
dependent foraging tactics and prey profitability in a marine mammal. Marine 500
Ecology Progress Series 244: 235-245. 501
Coulson, G. 2008. Eastern grey kangaroo Macropus giganteus. Pp. 335-338 in The 502
Mammals of Australia, edited by S. Van Dyck and R. Strahan. Reed New Holland, 503
Sydney, Australia. 504
Fanson, K. V., Best, E. C., Bunce, A., Fanson, B. G., Hogan, L. A., Keeley, T., Narayan, 505
E. J., Palme, R., Parrott, M. L., Sharp, T. M., Skogvold, K., Tuthill, L., 506
Webster, K. N. and Bashaw, M. 2017. One size does not fit all: Monitoring 507
faecal glucocorticoid metabolites in marsupials. General and Comparative 508
Endocrinology 244: 146-156. 509
Fehlmann, G. and King, A. J. 2016. Bio-logging. Current Biology 26(18): R830-R831. 510
22
Garnick, S. W., Elgar, M. A., Beveridge, I. and Coulson, G. 2010. Foraging efficiency and 511
parasite risk in eastern grey kangaroos (Macropus giganteus). Behavioral Ecology 512
21(1): 129-137. 513
Guo, Y. P., Zhang, H., Chen, W. Q. and Zhang, Y. J. 2018. Herbivore-diet analysis based 514
on Illumina MiSeq sequencing: The potential use of an ITS2-Barcoding approach 515
to establish qualitative and quantitative predictions of diet composition of 516
Mongolian sheep. Journal of Agricultural and Food Chemistry 66(37): 9858-9867. 517
Loyd, K. A. T., Hernandez, S. M., Carroll, J. P., Abernathy, K. J. and Marshall, G. J. 518
2013. Quantifying free-roaming domestic cat predation using animal-borne video 519
cameras. Biological Conservation 160: 183-189. 520
Machovsky-Capuska, G. E., Coogan, S. C. P., Simpson, S. J. and Raubenheimer, D. 521
2016. Motive for killing: What drives prey choice in wild predators? Ethology 522
122(9): 703-711. 523
Machovsky-Capuska, G. E., Priddel, D., Leong, P. H. W., Jones, P., Carlile, N., 524
Shannon, L., Portelli, D., McEwan, A., Chaves, A. V., and Raubenheimer, D. 525
2016. Coupling bio-logging with nutritional geometry to reveal novel insights into 526
the foraging behaviour of a plunge-diving marine predator. New Zealand Journal 527
of Marine and Freshwater Research 50(3): 418-432. 528
Marshall, G. J. 1998. "CRITTERCAM: An animal-borne imaging and data logging system. 529
Marine Technology Society Journal 32(1): 11-17. 530
Moll, R. J., Millspaugh, J. J., Beringer, J., Sartwell, J. and He, Z. 2007. A new 'view' of 531
ecology and conservation though animal-borne video systems. Trends in Ecology 532
& Evolution 22(12): 660-668. 533
23
Moll, R. J., Millspaugh, J. J., Beringer, J., Sartwell, J., Woods, R. J. and Vercauteren, 534
K. C. 2009. Physiological stress response of captive white-tailed deer to video 535
collars. Journal of Wildlife Management 73(4): 609-614. 536
Nifong, J. C., Lowers, R. H., Silliman, B. R., Abernathy, K. and Marshall, G. 2013. 537
Attachment and deployment of remote video/audio recording devices (Crittercams) 538
on wild American alligators (Alligator mississippiensis). Herpetological Review 539
44(2): 243-247. 540
Nifong, J. C., Nifong, R. L., Silliman, B. R., Lowers, R. H., Guillette, L. J., Ferguson, J. 541
M., Welsh, M., Abernathy, K. and Marshall, G. 2014. Animal-borne imaging 542
reveals novel insights into the foraging behaviors and diel activity of a large-543
bodied apex predator, the American alligator (Alligator mississippiensis). PLoS 544
One 9(1). 545
Norbury, G. L. and Sanson, G. D. 1992. Problems with measuring diet selection of 546
terrestrial, mammalian herbivores. Australian Journal of Ecology 17(1): 1-7. 547
Pearson, H. C., Jones, P. W., Srinivasan, M., Lundquist, D., Pearson, C. J., Stockin, K. 548
A. and Machovsky-Capuska, G. E. 2017. Testing and deployment of C-VISS 549
(cetacean-borne video camera and integrated sensor system) on wild dolphins. 550
Marine Biology 164(3). 551
National Herbarium of New South Wales 2018. PlantNet NSW Flora Online. Accessed 552
August 2017. http://plantnet.rbgsyd.nsw.gov.au/floraonline.htm. 553
Rutz, C. and Bluff, L. A. 2008. Animal-borne imaging takes wing, or the dawn of 'wildlife 554
video-tracking'. Trends in Ecology & Evolution 23(6): 292-294. 555
Schulz, J. H., Millspaugh, J. J., Washburn, B. E., Bermudez, A. J., Tomlinson, J. L., 556
Mong, T. W. and He, Z. Q. 2005. Physiological effects of radiotransmitters on 557
mourning doves. Wildlife Society Bulletin 33(3): 1092-1100. 558
24
Sheriff, M. J., Dantzer, B., Delehanty, B., Palme, R. and Boonstra, R. 2011. Measuring 559
stress in wildlife: techniques for quantifying glucocorticoids. Oecologia 166(4): 560
869-887. 561
Thomson, J. A. and Heithaus, M. R. 2014. Animal-borne video reveals seasonal activity 562
patterns of green sea turtles and the importance of accounting for capture stress in 563
short-term biologging. Journal of Experimental Marine Biology and Ecology 450: 564
15-20. 565
Touma, C., Sachser, N., Mostl, E., and Palme, R. (2003). Effects of sex and time of day 566
on metabolism and excretion of corticosterone in urine and feces of mice. General 567
and Comparative Endocrinology 130(3): 267-278. 568
Wells, K. M. S., Washburn, B. E., Millspaugh, J. J., Ryan, M. R. and Hubbard, M. W. 569
2003. Effects of radio-transmitters on fecal glucocorticoid levels in captive 570
Dickcissels. Condor 105(4): 805-810. 571
Worton, B. J. 1989. Kernel methods for estimating the utilization distribution in home-range 572
studies. Ecology 70(1): 164-168. 573
574
575
25
Table 1. Video-tracking collar components, specifications, and approximate costs. 576
Component Dimensions
(LxWxH (mm),
weight (g))
Model and manufacturer Approximate
unit cost (USD)
Waterproof housing
(camera/GPS) 89 x 37 x 50 (83g)
Custom-made, University of
Sydney $40
Waterproof housing
(battery pack) 83 x 48 x 45 (72g)
Custom-made, University of
Sydney $60
Video camera 108 x 27 x 27 (68g) Custom-made, University of
Sydney $1750
GPS data logger 77 x 28 x 18 (15g) GT-730FL-S, Canmore (Hsinchu
County 30274, Taiwan) $50
577
26
Table 2. Duration of simultaneous video recording and GPS data collection for each of seven 578
kangaroos in the study. The footage scored (%) reflects the percentage of post-recovery day-579
time footage that was able to be categorised into the different behaviours. Reproductive status 580
of females: YAF, young-at-foot; PY, pouch young; NPY, no pouch young. The PY were ~75 581
and 124 days for 207 and 230 respectively. 582
583
Kangaroo
ID Sex
Reproductive
status
(females)
Footage collected (h) Footage
scored
(%) Day Night Total
003 F YAF 9.7 0.3 10.0 100.0
022 M - 10.6 5.9 16.5 100.0
001 F NPY 6.8 13.7 20.5 97.5
031 M - 5.8 12.2 18.0 98.3
207 F PY 13.5 8.0 21.5 100.0
230 F PY 14.8 8.2 23.0 100.0
261 F NPY 12.3 8.2 20.5 100.0
584

27
Table 3. Summary of the characteristics of commonly used methods for measuring diet 585 selection in terrestrial, mammalian herbivores. 586 Information presented in the table is based in large part on an historic review by Norbury and 587 Sanson (1992), with the addition of new and emerging techniques, such as the use of AVEDs 588 (this paper) and the use of DNA barcoding of plant species in faeces (Guo et al. 2018). 589 590
28
Technique Description
Temporal link between
habitat/patch utilisation and diet
selection?*
Lethal / Non-lethal
Advantages Disadvantages Spatio-
temporal scale
Mouth contents Animal shot and mouth contents identified
Yes Lethal Easy to identify ingested material. Quantification of different species possible.
Small sample of ingesta, over small timeframe, meaning large sample sizes needed. Limited spatial and temporal range. Biased towards sampling locations. Limited to common animals and ethical concerns associated with lethality.
Small
Stomach contents Animals shot and stomach contents identified, usually by microscopic analysis of plant fragments in comparison to reference library.
Yes Lethal Easier to identify ingested material than using faeces. Larger sample of ingested material than mouth contents. Quantification of different species possible.
Microscopic analysis of contents may be necessary. Limited to common animals and ethical concerns associated with lethality.
Small
Faecal contents - microscopic identification
Faecal samples collected and undigested plant fragments microscopically identified in comparison to a reference library
No Non-lethal
Minimal disturbance to animals. Covers a broader spatial and temporal range. Quantification of different species possible. Not biased by sampling location.
Biased by differential digestion of plant species. Difficult to compare food availability to food ingested due to lag between ingestion and excretion. Difficult to identify to genus and species. Significant time and expertise required.
Broad
Observation Observation of feeding animals and identification of plants ingested
Yes Non-lethal
Minimal disturbance to animals. Easy to identify food if close enough. Quantification of different species possible.
Difficult for wild herbivores that are unapproachable or in vegetation types where observation is difficult. Quantification of species may be more difficult than for mouth, stomach or faecal contents.
Small (possibly
broad depending on time invested
and observability)
29
Technique Description
Temporal link between
habitat/patch utilisation and diet
selection?*
Lethal / Non-lethal
Advantages Disadvantages Spatio-
temporal scale
Minimal preparation and equipment.
Biased towards sampling locations.
Faecal contents – DNA barcoding
Faecal samples collected and molecular identification of undigested material (via sequencing) using universal plant primers and reference sequences
No Non-lethal
Minimal disturbance to animals. Covers a broader spatial and temporal range. Potentially possible to identify to higher taxonomic level. Not biased by sampling location.
Difficult to compare food availability to food ingested due to lag between ingestion and excretion. Very high level of expertise and cost. Limited availability of reference sequences for some plants/regions
Broad
Observation using AVED
Identification of plants ingested based on video-recordings taken from devices mounted on the animals
Yes Non-lethal
Minimal disturbance to animal (once acclimated to device). Easy to identify food. Quantification of different species possible. Combines fine and broad scale assessment of diet selection. Not biased by sampling location.
Quantification of species may be more difficult than for mouth, stomach or faecal contents. Expensive technology and time-consuming to analyse videos. Limited to medium-large animals with current technology.
Small-Broad (depending
on recording time)
* A spatio-temporal link between habitat/patch utilisation and food selection basically means they are sampled at the location they are foraging, thereby allowing for a direct 591 measurement of food availability and selection at the same time (i.e. simultaneous sampling of available vs ingested food). 592 593
30
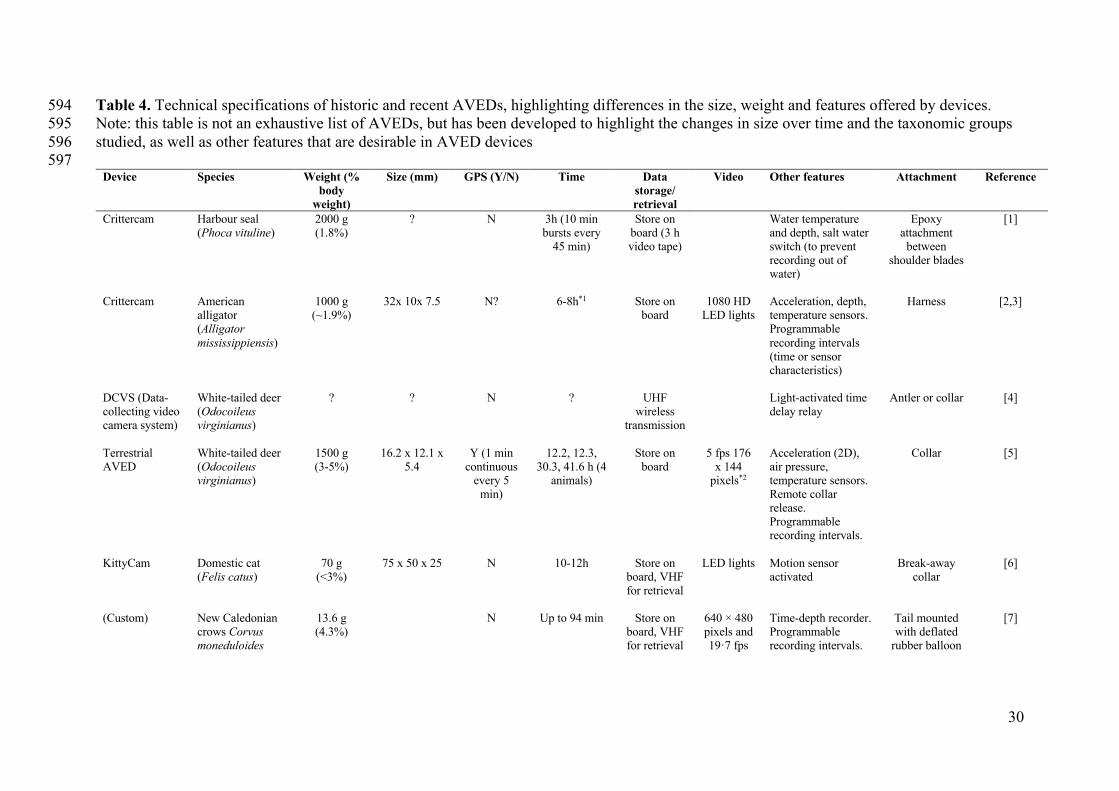
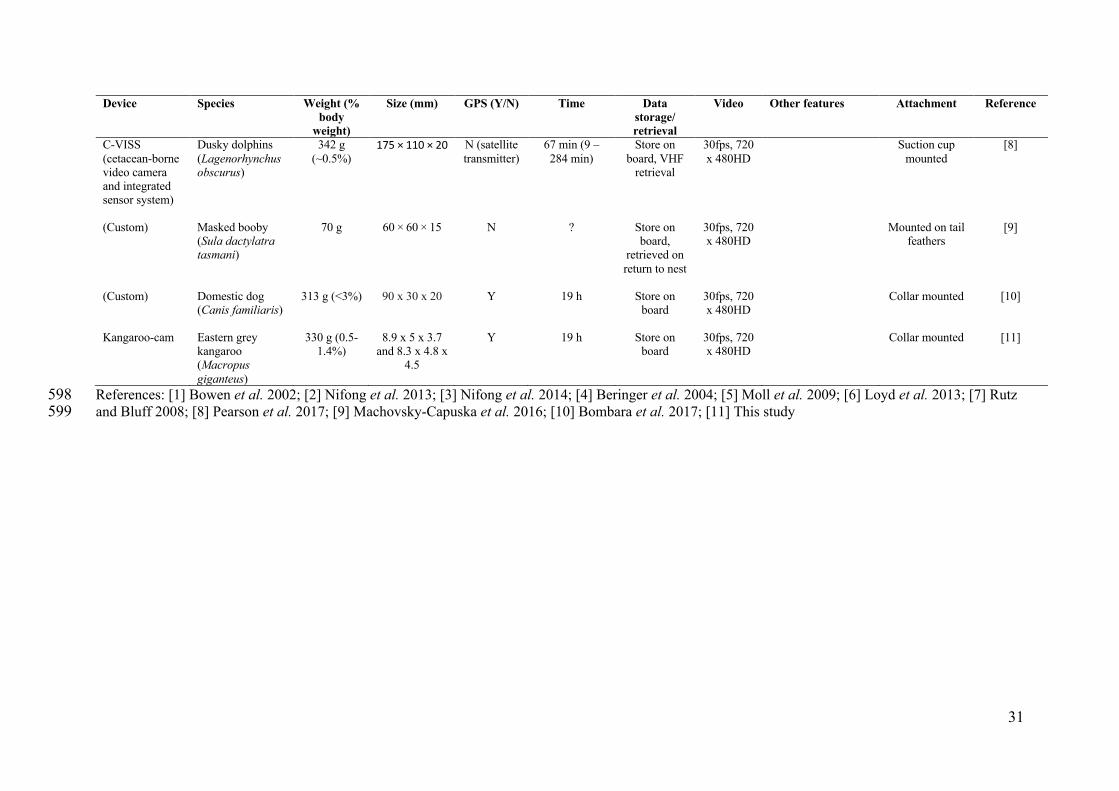
Table 4. Technical specifications of historic and recent AVEDs, highlighting differences in the size, weight and features offered by devices. 594 Note: this table is not an exhaustive list of AVEDs, but has been developed to highlight the changes in size over time and the taxonomic groups 595
studied, as well as other features that are desirable in AVED devices 596 597
Device
Species Weight (% body
weight)
Size (mm) GPS (Y/N) Time Data storage/ retrieval
Video Other features Attachment Reference
Crittercam Harbour seal (Phoca vituline)
2000 g (1.8%)
? N 3h (10 min bursts every
45 min)
Store on board (3 h video tape)
Water temperature and depth, salt water switch (to prevent recording out of water)
Epoxy attachment
between shoulder blades
[1]
Crittercam American alligator (Alligator mississippiensis)
1000 g (~1.9%)
32x 10x 7.5 N? 6-8h*1 Store on board
1080 HD LED lights
Acceleration, depth, temperature sensors. Programmable
recording intervals (time or sensor characteristics)
Harness [2,3]
DCVS (Data-collecting video camera system)
White-tailed deer (Odocoileus virginianus)
? ? N ? UHF wireless
transmission
Light-activated time delay relay
Antler or collar [4]
Terrestrial AVED
White-tailed deer (Odocoileus virginianus)
1500 g (3-5%)
16.2 x 12.1 x 5.4
Y (1 min continuous
every 5 min)
12.2, 12.3, 30.3, 41.6 h (4
animals)
Store on board
5 fps 176 x 144
pixels*2
Acceleration (2D), air pressure, temperature sensors. Remote collar release. Programmable recording intervals.
Collar [5]
KittyCam Domestic cat (Felis catus)
70 g (<3%)
75 x 50 x 25 N 10-12h Store on board, VHF for retrieval
LED lights Motion sensor activated
Break-away collar
[6]
(Custom) New Caledonian crows Corvus moneduloides
13.6 g (4.3%)
N Up to 94 min Store on board, VHF for retrieval
640 × 480 pixels and 19·7 fps
Time-depth recorder. Programmable recording intervals.
Tail mounted with deflated
rubber balloon
[7]
31
Device
Species Weight (% body
weight)
Size (mm) GPS (Y/N) Time Data storage/ retrieval
Video Other features Attachment Reference
C-VISS
(cetacean-borne video camera and integrated sensor system)
Dusky dolphins
(Lagenorhynchus obscurus)
342 g
(~0.5%) 175 × 110 × 20
N (satellite
transmitter)
67 min (9 –
284 min)
Store on
board, VHF retrieval
30fps, 720
x 480HD
Suction cup
mounted
[8]
(Custom) Masked booby (Sula dactylatra tasmani)
70 g 60 × 60 × 15 N ? Store on board,
retrieved on
return to nest
30fps, 720 x 480HD
Mounted on tail feathers
[9]
(Custom) Domestic dog (Canis familiaris)
313 g (<3%) 90 x 30 x 20 Y 19 h Store on board
30fps, 720 x 480HD
Collar mounted [10]
Kangaroo-cam Eastern grey kangaroo (Macropus giganteus)
330 g (0.5-1.4%)
8.9 x 5 x 3.7 and 8.3 x 4.8 x
4.5
Y 19 h Store on board
30fps, 720 x 480HD
Collar mounted [11]
References: [1] Bowen et al. 2002; [2] Nifong et al. 2013; [3] Nifong et al. 2014; [4] Beringer et al. 2004; [5] Moll et al. 2009; [6] Loyd et al. 2013; [7] Rutz 598 and Bluff 2008; [8] Pearson et al. 2017; [9] Machovsky-Capuska et al. 2016; [10] Bombara et al. 2017; [11] This study 599
32
Figure 1. Individual components of the kangaroo-cam units, which were incorporated into 600
one of two cases – the battery case or the component case (Shown as External lens in pod in 601
this figure). Details of the specific components, size, suppliers and cost are shown in Table 1. 602
603
Figure 2. Eastern grey kangaroo (female) carrying the Kangaroo-cam device. The Kangaroo-604
cam is oriented pointing forwards from its location, which means it is pointed directly 605
forward in this image . 606
607
Figure 3. Proportion of time (as a percentage of total scorable recording time) that kangaroos 608
spent in each behavioural state during daylight hours, as determined by scoring videos 609
recorded by Kangaroo-cam units. Note that all states are mutually exclusive and that feeding 610
took precedence over other activities (see methods section). 611
612
Figure 4. Proportion (as a percentage) of foraging events in which different plant families 613
were consumed by seven kangaroos. 614
615
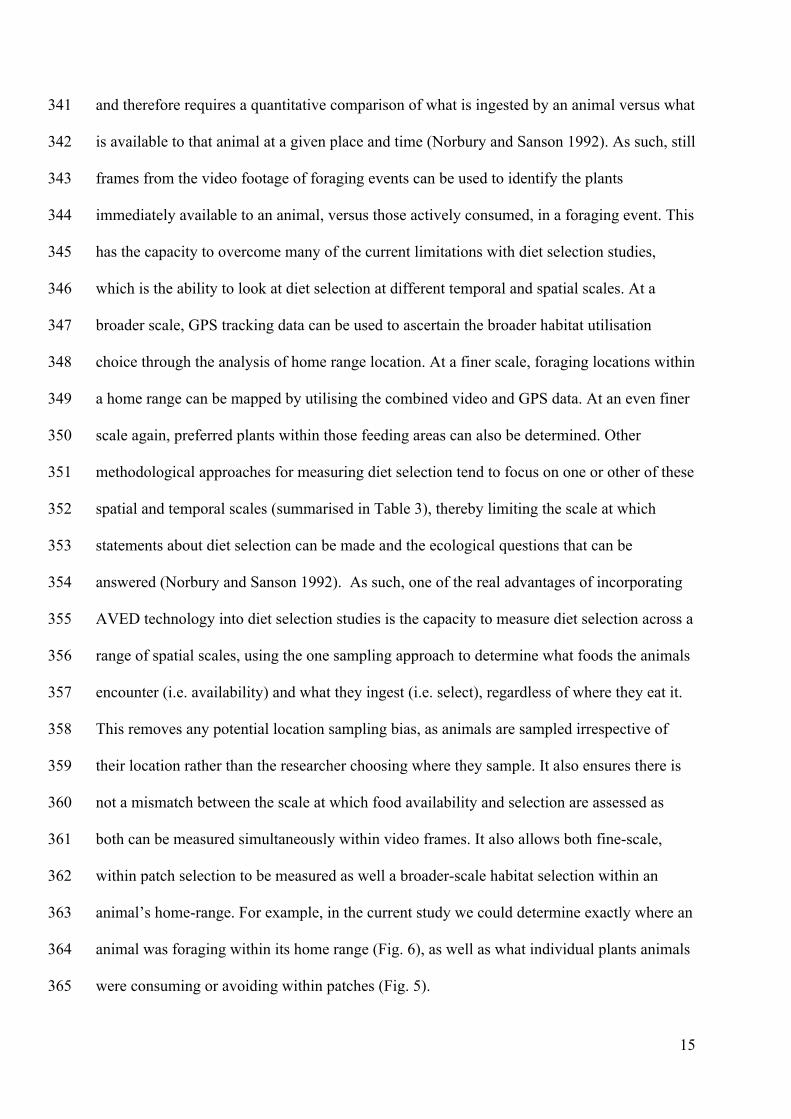
Figure 5. Still frames of images taken by the Kangaroo-cam units, showing the identification 616
of plants consumed versus those available during foraging events in kangaroos. This highlights 617
the potential utility of this approach for diet selection studies in herbivores. 618
619
Figure 6. GPS movement tracks and core use areas, with behavioural categories superimposed 620
for four individuals: (a) animal 022 (male), (b) animal 261 (female); (c) animal 207 (female), 621
and (d) animal 230 (female). Squares indicate feeding sites and pentagons indicate resting sites, 622
while lines indicate movement trajectories. Shading represents the 50-95% kernel for core and 623
33
general animal use as follows: Red (50%), dark orange (60%), light orange (70%), yellow 624
(80%), light green (90%) and dark green (95%). 625
626
Figure 7. Mean ± s.e.m. faecal glucocorticoid concentrations at 0, 24 and 48 h post capture in 627
GPS collared (black line, closed circles; n = 6) and non-collared animals (grey line, open 628
circles; n = 8) animals immobilised at time zero. Concentrations are significantly different 629
between groups at 24 h. 630
631
34
EXTERNAL LENS IN POD 632
633 634
635
BATTERY CASE 636
637 Fig. 1 638 639
35
640 641 642 643 644 645 646 647 648 649 650 651 652 653 654 655 656 657 658 659 660 661
Fig. 2 662
36
663
664
Fig. 3 665
37
666
667
668
Fig 4 669
670
Poaceae53%
Cyperaceae22%
Ericaceae8%
Proteaceae5%
Apiaceae4%
Euphorbiaceae4%
Haloragaceae2%
Fabaceae1%
Mrytaceae1%
38
671
Fig. 5 672
673
Selected plants
Ricinocarpus spp. Platysace spp. Lomatia spp. Reed
Non-selected plants
Actinotus spp. Banksia spp. Bracken spp. Hydrocotyle spp.
39
674
675
Fig. 6 676
(a) (b)
(c) (d)
40
677 Fig. 7 678 679
0
20
40
60
80
100
120
140
160
180
200
0 24 48
Faec
al G
luco
cort
icoid
Met
abol
ite C
once
ntra
tion
(ng/
g)
Time Post Capture (h)


