
2018 TARGET WEIGHTS
BLOOMBERG COMMODITY INDEX

2
26 commodity contracts tested for inclusion
No constituent changes (22 commodities constituents / 20 commodities)
Energy reaches lowest weight in 17 years
Gold remains largest single constituent
Corn has largest weight drop
2018 SUMMARY

STEPS TO COMPUTE 2018 TARGET WEIGHTS
Calculate ICIP Scores and Filter Commodities with Low ICIP Scores
FIA Volume Data Lead Contract Prices
World Production Data Lead Contract Prices Brent Crude, Crude Oil, Gold,
RBOB Gasoline, ULS Diesel (HO), Natural Gas, Soybeans, Copper, Corn, Live Cattle, Lean Hogs, Silver, Wheat (Chicago), Aluminum, Sugar, Soy Meal, Soybean Oil, Zinc , Nickel, Coffee, Cotton, Wheat (KC HRW),Lead, Cocoa, Platinum, Tin
Liquidity Percentages Production Percentages +
Interim Commodity Index Percentiles (ICIP)
(2/3rd Liquidity and 1/3rd Production)
Brent Crude, Crude Oil, Gold, RBOB Gasoline, ULS Diesel (HO), Natural Gas, Soybeans, Copper, Corn, Live Cattle, Lean Hogs, Silver, Wheat (Chicago), Aluminum, Sugar, Soy Meal, Soybean Oil, Zinc, Nickel, Coffee, Cotton, Wheat (KC HRW)
Lead, Cocoa, Platinum, Tin
22 Pass the 0.4% ICIP Threshold
4 Fail the 0.4% ICIP Threshold and are excluded
Apply Sector and Group Limits
Adjust for the Commodity Liquidity Threshold
Increase any Sector ICIP under 2% to 2%
Set Gold & Silver Weights to equal their CLP
Limit related commodity groups
weights to a max of 33%
Set single commodity max limit of 15%
Set Single commodity and its derivative
to a max of 25%
Commodity Target Weight
Natural Gas 8.01%
Brent Crude Oil 7.68%
WTI Crude Oil 7.31%
RBOB Gasoline 3.75%
ULS Diesel 3.66%
Corn 6.13%
Soybeans 5.95%
Wheat 3.25%
Soybean Meal 3.03%
Soybean Oil 2.74%
HRW Wheat 1.30%
Copper 7.15%
Aluminum 4.50%
Zinc 3.09%
Nickel 2.76%
Gold 11.94%
Silver 3.67%
Sugar 3.53%
Coffee 2.60%
Cotton 1.45%
Live Cattle 4.31%
Lean Hogs 2.07%
Target Weights
26 Commodities

4
Target Weight
Energy
Natural Gas 8.01%
30.43%
Brent Crude Oil 7.68%
WTI Crude Oil 7.31%
RBOB Gasoline 3.75%
ULS Diesel 3.66%
Grains
Corn 6.13%
22.44%
Soybeans 5.95%
Wheat 3.25%
Soybean Meal 3.03%
Soybean Oil 2.74%
HRW Wheat 1.30%
Industrial Metals
Copper 7.15%
17.53% Aluminum 4.50%
Zinc 3.09%
Nickel 2.76%
Precious Metals Gold 11.94%
15.62% Silver 3.67%
Softs
Sugar 3.53%
7.60% Coffee 2.60%
Cotton 1.45%
Livestock Live Cattle 4.31%
6.39% Lean Hogs 2.07%
2018 BCOM TARGET WEIGHTS

5
2017-2018 TARGET WEIGHT % CHANGES
1.97% -1.81% 1.97%
-0.37% -4.29%
-17.22%
2.07%
4.62% -1.76%
-2.11%
10.26%
-5.69%
-1.30%
15.18%
8.69%
8.41%
-0.86%
6.93%
-10.75% 4.08%
9.57%
0.41%
0%
2%
4%
6%
8%
10%
12%
14%
2017 CIP 2018 CIP
ENERGY
(-0.14%)
GRAINS
(-1.02%)
INDUSTRIAL
(0.14%)
LIVESTOCK
(0.32%)
PRECIOUS
(0.32%)
SOFTS
(0.38%)

6
HISTORICAL GROUP WEIGHTS (1999-2018)
0%
2%
4%
6%
8%
10%
12%
14%
16%
199
9
200
0
200
1
200
2
200
3
200
4
200
5
200
6
200
7
200
8
200
9
201
0
201
1
201
2
201
3
201
4
201
5
201
6
201
7
201
8
Energy
WTI Crude Oil Brent Crude Oil ULS Diesel
RBOB Gasoline Natural Gas
0%
2%
4%
6%
8%
10%
199
9
200
0
200
1
200
2
200
3
200
4
200
5
200
6
200
7
200
8
200
9
201
0
201
1
201
2
201
3
201
4
201
5
201
6
201
7
201
8
Industrial Metals
Copper (HG) Aluminum Nickel Zinc
0%
2%
4%
6%
8%
10%
199
9
200
0
200
1
200
2
200
3
200
4
200
5
200
6
200
7
200
8
200
9
201
0
201
1
201
2
201
3
201
4
201
5
201
6
201
7
201
8Grains
Soybean Oil Soybean Soybean Meal
Corn Chicago Wheat Kansas City Wheat
0%
1%
2%
3%
4%
5%
19
99
20
01
20
02
20
03
20
04
20
05
20
06
20
07
20
08
20
09
20
10
20
11
20
12
20
14
20
15
20
16
20
17
20
18
Softs
Cocoa Cotton Coffee Sugar
0%
2%
4%
6%
8%
10%
12%
14%
199
9
200
1
200
2
200
3
200
4
200
5
200
6
200
8
200
9
201
0
201
1
201
2
201
3
201
5
201
6
201
7
201
8
Precious Metals
Gold Silver
0%
1%
2%
3%
4%
5%
6%
7%
19
99
20
01
20
02
20
03
20
04
20
05
20
06
20
07
20
08
20
09
20
10
20
11
20
12
20
14
20
15
20
16
20
17
20
18
Livestock
Live Cattle Lean Hogs

7
HISTORICAL GROUP WEIGHTS (1999-2018)
0%
5%
10%
15%
20%
25%
30%
35%
1999 2000 2001 2002 2003 2004 2005 2006 2007 2008 2009 2010 2011 2012 2013 2014 2015 2016 2017 2018
Energy
Grains
Softs
Livestock
Industrial Metals

8
HISTORICAL SECTOR WEIGHTS (1999-2018)
20%
25%
30%
35%
40%
45%
1999 2000 2001 2002 2003 2004 2005 2006 2007 2008 2009 2010 2011 2012 2013 2014 2015 2016 2017 2018
Agriculture
Energy
Metals
9
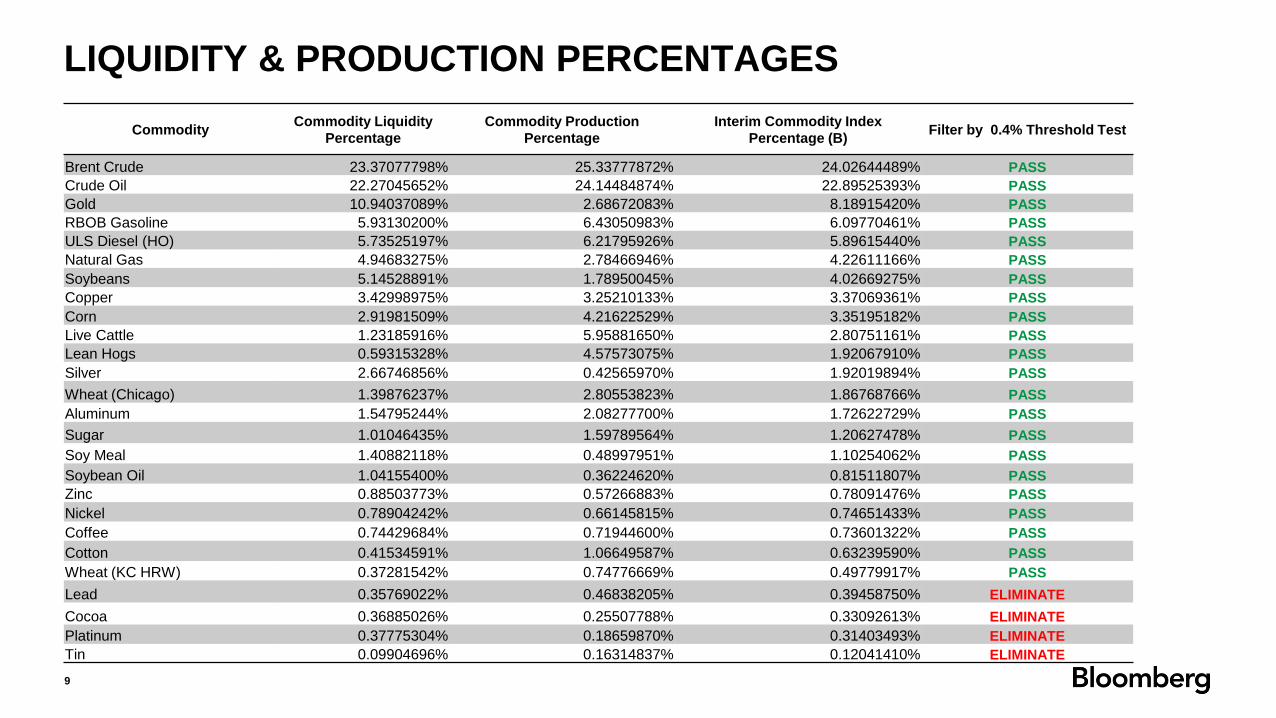
LIQUIDITY & PRODUCTION PERCENTAGES
Commodity Commodity Liquidity
Percentage
Commodity Production
Percentage
Interim Commodity Index
Percentage (B) Filter by 0.4% Threshold Test
Brent Crude 23.37077798% 25.33777872% 24.02644489% PASS
Crude Oil 22.27045652% 24.14484874% 22.89525393% PASS
Gold 10.94037089% 2.68672083% 8.18915420% PASS
RBOB Gasoline 5.93130200% 6.43050983% 6.09770461% PASS
ULS Diesel (HO) 5.73525197% 6.21795926% 5.89615440% PASS
Natural Gas 4.94683275% 2.78466946% 4.22611166% PASS
Soybeans 5.14528891% 1.78950045% 4.02669275% PASS
Copper 3.42998975% 3.25210133% 3.37069361% PASS
Corn 2.91981509% 4.21622529% 3.35195182% PASS
Live Cattle 1.23185916% 5.95881650% 2.80751161% PASS
Lean Hogs 0.59315328% 4.57573075% 1.92067910% PASS
Silver 2.66746856% 0.42565970% 1.92019894% PASS
Wheat (Chicago) 1.39876237% 2.80553823% 1.86768766% PASS
Aluminum 1.54795244% 2.08277700% 1.72622729% PASS
Sugar 1.01046435% 1.59789564% 1.20627478% PASS
Soy Meal 1.40882118% 0.48997951% 1.10254062% PASS
Soybean Oil 1.04155400% 0.36224620% 0.81511807% PASS
Zinc 0.88503773% 0.57266883% 0.78091476% PASS
Nickel 0.78904242% 0.66145815% 0.74651433% PASS
Coffee 0.74429684% 0.71944600% 0.73601322% PASS
Cotton 0.41534591% 1.06649587% 0.63239590% PASS
Wheat (KC HRW) 0.37281542% 0.74776669% 0.49779917% PASS
Lead 0.35769022% 0.46838205% 0.39458750% ELIMINATE
Cocoa 0.36885026% 0.25507788% 0.33092613% ELIMINATE
Platinum 0.37775304% 0.18659870% 0.31403493% ELIMINATE
Tin 0.09904696% 0.16314837% 0.12041410% ELIMINATE

10
YEAR OVER YEAR TARGET WEIGHT COMPARISON
Bloomberg Ticker 2017 CIP 2018 CIP YoY % Change
Zinc LX 2.6893410% 3.0976320% 15.18%
Wheat (KC HRW) KW 1.1834590% 1.3048540% 10.26%
Coffee KC 2.3774300% 2.6050390% 9.57%
Nickel LN 2.5409170% 2.7616480% 8.66%
Live Cattle LC 3.9771090% 4.3115070% 8.40%
Gold GC 11.1715570% 11.9458820% 6.93%
Soy Meal SM 2.9015200% 3.0355430% 4.62%
Sugar SB 3.3978760% 3.5366250% 4.08%
Soybeans S 5.8387700% 5.9596950% 2.07%
Crude Oil CL 7.1781390% 7.3193290% 1.97%
Natural Gas NG 7.9765050% 8.0140970% 0.47%
Cotton CT 1.4478190% 1.4537110% 0.41%
RBOB Gasoline XB 3.7645450% 3.7506600% -0.37%
Lean Hogs LH 2.0941230% 2.0760360% -0.86%
Aluminum LA 4.5682530% 4.5087010% -1.30%
Wheat (Chicago) W 3.3174200% 3.2589240% -1.76%
Brent Crude CO 7.8218610% 7.6806710% -1.80%
Soybean Oil BO 2.8074440% 2.7481210% -2.11%
ULS Diesel (HO) HO 3.8295210% 3.6652400% -4.29%
Copper HG 7.5907620% 7.1586790% -5.69%
Silver SI 4.1152560% 3.6729800% -10.75%
Corn C 7.4103730% 6.1344250% -17.21%

11
Commodity 2012 2013 2014 2015 2016 % Change
2015-2016
Wheat (KC HRW) 5,524,694 5,573,776 6,702,061 8,554,850 11,724,522 37.05%
Silver 14,205,014 13,762,940 13,478,008 15,909,264 20,852,803 31.07%
Natural Gas 88,511,266 76,091,668 79,436,041 86,182,057 105,913,138 22.89%
Crude Oil 143,254,254 136,980,084 180,811,113 242,504,173 296,643,163 22.32%
Gold 47,102,033 39,854,694 42,935,014 50,897,089 61,189,546 20.22%
Lean Hogs 11,262,642 11,262,642 10,359,707 8,695,761 10,364,029 19.18%
Live Cattle 13,138,069 13,138,069 12,225,270 13,295,761 15,607,886 17.39%
Platinum 3,295,753 3,086,177 3,400,401 3,837,044 4,454,155 16.08%
Brent Crude 153,358,199 154,909,534 179,084,449 198,223,611 230,085,976 16.07%
RBOB Gasoline 35,783,854 32,756,800 38,641,276 42,531,265 48,438,670 13.89%
Cocoa 6,520,572 6,302,342 6,939,220 9,285,990 10,447,548 12.51%
ULS Diesel (HO) 35,100,529 31,406,733 36,392,272 38,496,379 41,118,037 6.81%
Wheat (Chicago) 25,706,206 24,946,566 29,296,099 31,101,352 32,848,308 5.62%
Zinc 10,131,889 10,288,642 9,773,205 9,006,891 9,226,461 2.44%
Cotton 6,238,985 5,646,406 6,442,278 7,448,905 7,612,476 2.20%
Soybean Oil 25,740,648 22,994,772 26,432,802 29,476,283 29,770,226 1.00%
Coffee 7,000,207 6,997,195 7,318,193 9,374,943 9,263,226 -1.19%
Nickel 4,184,284 5,635,819 6,311,085 6,705,340 6,579,559 -1.88%
Corn 63,734,064 67,621,436 78,591,373 87,335,044 85,358,965 -2.26%
Soy Meal 18,778,391 19,589,688 23,292,170 26,601,121 24,810,514 -6.73%
Aluminum 21,030,581 21,391,002 20,809,585 18,557,538 17,022,664 -8.27%
Copper 12,838,800 12,868,534 13,217,166 12,431,650 11,385,014 -8.42%
Tin 675,263 732,578 550,835 466,106 423,492 -9.14%
Lead 4,560,392 4,441,760 4,246,966 3,676,761 3,330,633 -9.41%
Sugar 28,079,048 30,573,425 31,333,154 34,917,081 31,135,413 -10.83%
Soybeans 46,386,935 47,518,704 53,581,666 62,495,645 53,446,445 -14.48%
FIA VOLUME DATA

12
Commodity 2012 2013 2014 2015 2016 % Change
2015-2016*
Zinc $ 1,964.90 $ 1,980.13 $ 2,211.69 $ 1,797.42 $ 2,595.90 44.42%
Natural Gas $ 3.59 $ 4.17 $ 3.27 $ 2.38 $ 3.08 29.61%
Tin $ 21,533.83 $ 22,502.83 $ 18,595 $ 15,769.92 $ 20,015.58 26.92%
Sugar $ 0.19 $ 0.17 $ 0.14 $ 0.15 $ 0.19 26.04%
Lead $ 2,171.25 $ 2,113.10 $ 1,980.50 $ 1,732.25 $ 2,152.85 24.28%
Cotton $ 0.79 $ 0.84 $ 0.63 $ 0.62 $ 0.73 17.34%
Silver $ 28.83 $ 20.50 $ 17.05 $ 15.36 $ 17.83 16.11%
Coffee $ 1.49 $ 1.44 $ 1.64 $ 1.23 $ 1.43 15.88%
Aluminum $ 1,968.98 $ 1,784.05 $ 1,894.06 $ 1,559.63 $ 1,793.79 15.01%
Crude Oil $ 92.98 $ 100.71 $ 67.56 $ 42.62 $ 48.95 14.85%
Brent Crude $ 107.87 $ 108.34 $ 74.16 $ 45.04 $ 51.40 14.12%
Copper $ 7,680.08 $ 7,053.51 $ 6,320.29 $ 4,839.61 $ 5,478.49 13.20%
ULS Diesel (HO) $ 3 $ 2.99 $ 2.16 $ 1.37 $ 1.54 12.76%
Soybean Oil $ 0.51 $ 0.41 $ 0.33 $ 0.30 $ 0.33 9.74%
Nickel $ 16,447.67 $ 15,386.38 $ 15,029.25 $ 9,281.04 $ 10,094.48 8.76%
RBOB Gasoline $ 2.85 $ 2.81 $ 2.04 $ 1.42 $ 1.53 7.82%
Gold $ 1,597.47 $ 1,292.82 $ 1,214.60 $ 1,170.78 $ 1,255.49 7.24%
Soybeans $ 14.85 $ 13.32 $ 9.95 $ 9.37 $ 9.82 4.78%
Platinum $ 1,551.58 $ 1,435.56 $ 1,229.69 $ 954.70 $ 984.91 3.16%
Soy Meal $ 442.15 $ 428.03 $ 333.94 $ 311.22 $ 316.84 1.81%
Corn $ 7.07 $ 4.56 $ 3.73 $ 3.73 $ 3.58 -3.92%
Wheat (KC HRW) $ 8.20 $ 7.09 $ 5.78 $ 4.68 $ 4.37 -6.66%
Lean Hogs $ 0.85 $ 1.02 $ 0.84 $ 0.70 $ 0.65 -7.46%
Wheat (Chicago) $ 7.81 $ 6.41 $ 5.31 $ 4.78 $ 4.31 -9.76%
Live Cattle $ 1.26 $ 1.36 $ 1.57 $ 1.31 $ 1.13 -13.82%
Cocoa $ 2,324.25 $ 2,778.17 $ 2,988.33 $ 3,092.33 $ 2,315.92 -25.11%
AVERAGE LEAD FUTURES CONTRACT PRICE
* Calculated using the settlement price on the first business day of each month

13
Commodity Reporting Unit 2010 2011 2012 2013 2014 % Change
2013-2014
Tin Metric Tons 340,000 344,000 338,000 336,000 392,000 16.67%
Soybeans Thous. Met Tons 264,959 261,624 241,732.26 277,679 306,519 10.39%
Copper Thous. Met Tons 19,100 19,700 20,200 21,000 22,200 5.71%
Cotton Thous. Met Tons 23,591 26,355 26,932.45 24,804 26,157 5.45%
Aluminum Thous. Met Tons 41,800 46,800 49,200 51,900 54,000 4.05%
Silver Metric Tons 23,300 23,200 24,400 25,800 26,800 3.88%
Zinc Thous. Met Tons 12,800 13,100 12,600 13,000 13,500 3.85%
Gold Kilograms 2,600,000 2,670,000 2,750,000 2,920,000 3,010,000 3.08%
Crude Petroleum Thous. Barrels 32,222,187 32,411,761 33,135,033 33,322,204 34,241,545 2.76%
Wheat Thous. Met Tons 641,909 697,498 672,738 710,957 729,012 2.54%
Corn Thous. Met Tons 851,300 886,921 873,151 1,014,274 1,037,792 2.32%
Natural Gas Billion Cubic Feet 34,187 35,696 36,168 36,706 37,479 2.11%
Pork Thous. Met Tons 107,443 108,010 111,492 113,289 115,314 1.79%
Sugar Thous. Met Tons 162,221 172,349 177,843 175,886 177,419 0.87%
Beef & Fresh Veal Thous. Met Tons 63,103 62,673 63,250 64,286 64,681 0.61%
Nickel Metric Tons 1,470,000 1,630,000 1,800,000 2,010,000 2,010,000 0.00%
Lead Thous. Met Tons 9,610 10,300 10,500 10,600 10,600 0.00%
Cocoa Thous. Met Tons 4,329 4,615 4,615 4,488 4,450 -0.85%
Coffee Thous. Met Tons 8,484 8,397 8,823 8,891 8,790 -1.14%
Platinum Kilograms 193,000 202,000 181,000 185,000 146,000 -21.08%
WORLD PRODUCTION DATA

14
Commodity Source Table
Natural Gas U.S. EIA Annual Statistical Supplement Gross Natural Gas Production
Crude Oil U.S. EIA Annual Statistical Supplement World Crude Oil Production
Live Cattle FAOSTAT Cattle Meat
Lean Hogs FAOSTAT Pig Meat
Wheat FAOSTAT Wheat Production
Corn FAOSTAT Maize
Soybeans FAOSTAT Soybeans
Aluminum Minerals Yearbook Aluminum Primary World Production
Copper Minerals Yearbook Copper, World Refinery Production
Zinc Minerals Yearbook Zinc World Smelter Production
Nickel Minerals Yearbook Nickel World Plant Production
Lead Minerals Yearbook Lead World Refinery Production
Tin Minerals Yearbook Tin World Smelter Production
Gold Minerals Yearbook World Mine Production
Silver Minerals Yearbook World Mine Production
Platinum Minerals Yearbook Platinum-Group Metals, World Production
Sugar USDA Sugar and Sweeteners Yearbook World Production, Supply, and Distribution, Centrifugal Sugar
Cotton FAOSTAT Cotton Lint
Coffee FAOSTAT Coffee, Green
Cocoa FAOSTAT Cocoa Beans
WORLD PRODUCTION DATA SOURCES

15
Commodity Production Units Production Size Factor Contract Terms Conversion Factor
Natural Gas Cubic Feet 35,464 1 10000 mmbtu 1,000,000
Crude Petroleum Barrels 31,782,935 1000 1000 bbl 1
Beef & Fresh Veal Thous. Met Tons 63,188 1000 40000 lbs 3,486.43
Pork Thous. Met Tons 107,417 1000 40000 lbs 2,204.62
Wheat Thous. Met Tons 651,907 1000 5000 bu 36.7437
Corn Thous. Met Tons 849,792 1000 5000 bu 39.3683
Soybeans Thous. Met Tons 265,050 1000 5000 bu 36.7437
Aluminum Thous. Met Tons 40,800 1000 25 mtons 1
Copper Thous. Met Tons 19,100 1000 25000 lbs 1
Zinc Thous. Met Tons 12,700 1000 25 mtons 1
Nickel Metric Tons 1,470,000 1 6 mtons 1
Lead Thous. Met Tons 9,490 1000 25 mtons 1
Tin Metric Tons 350,000 1 5 mtons 1
Gold Kilograms 2,560,000 1 100 oz 32.1508
Silver Metric Tons 23,100 1 5000 oz 32,150.75
Platinum Kilograms 192,000 1 50 oz 32.1508
Sugar Thous. Met Tons 156,556 1000 112000 lbs 2,204.62
Cotton Thous. Met Tons 23,711 1000 50000 lbs 2,204.62
Coffee Thous. Met Tons 8,304 1000 37500 lbs 2,204.62
Cocoa Thous. Met Tons 4,292 1000 10 tons 1
COMMODITY CONVERSION FACTORS

16
BLOOMBERG, BCOM and BLOOMBERG INDICES are trademarks or service marks of Bloomberg Finance L.P. Bloomberg Finance L.P. and its affiliates ("collectively, "Bloomberg") or
Bloomberg's licensors own all proprietary right in the BLOOMBERG INDICES. Bloomberg does not guarantee the timeliness, accuracy or completeness of any data or information relating
to BLOOMBERG INDICES. Bloomberg makes no warranty, express or implied, as to the BLOOMBERG INDICES or any data or values relating thereto or results to be obtained therefrom,
and expressly disclaims all warranties of merchantability and fitness for a particular purpose with respect thereto. It is not possible to invest directly in an index. Back-tested performance is
not actual performance. Past performance is not an indication of future results. To the maximum extent allowed by law, Bloomberg, its licensors, and its and their respective employees,
contractors, agents, suppliers and vendors shall have no liability or responsibility whatsoever for any injury or damages - whether direct, indirect, consequential, incidental, punitive or
otherwise - arising in connection with BLOOMBERG INDICES or any data or values relating thereto - whether arising from their negligence or otherwise. This document constitutes the
provision of factual information, rather than financial product advice. Nothing in the BLOOMBERG INDICES shall constitute or be construed as an offering of financial instruments or as
investment advice or investment recommendations (i.e., recommendations as to whether or not to “buy”, “sell”, “hold”, or to enter or not to enter into any other transaction involving any
specific interest or interests) by Bloomberg or its affiliates or a recommendation as to an investment or other strategy by Bloomberg or its affiliates. Data and other information available via
the BLOOMBERG INDICES should not be considered as information sufficient upon which to base an investment decision. All information provided by the BLOOMBERG INDICES is
impersonal and not tailored to the needs of any person, entity or group of persons. Bloomberg and its affiliates do not express an opinion on the future or expected value of any security or
other interest and do not explicitly or implicitly recommend or suggest an investment strategy of any kind. Customers should consider obtaining independent advice before making any
financial decisions.
Bloombergindices.com


