Download - 2nd Quarter 2019 - Johnson & Johnson

2nd Quarter 2019Earnings Call
July 16, 2019

Cautionary Note on Forward-looking Statements
3
This presentation contains “forward-looking statements” as defined in the Private Securities Litigation Reform Act of 1995 regarding, among other things: future
operating and financial performance, product development, market position and business strategy. The viewer is cautioned not to rely on these forward-looking
statements. These statements are based on current expectations of future events. If underlying assumptions prove inaccurate or known or unknown risks or
uncertainties materialize, actual results could vary materially from the expectations and projections of Johnson & Johnson. Risks and uncertainties include, but are not
limited to: economic factors, such as interest rate and currency exchange rate fluctuations; competition, including technological advances, new products and patents
attained by competitors; challenges inherent in new product research and development, including unexpected clinical trial results, additional analysis of existing clinical
data, uncertainty of clinical success and obtaining regulatory approvals; uncertainty of commercial success for new and existing products; the impact of business
combinations and divestitures; challenges to patents; the impact of patent expirations; the ability of the company to successfully execute strategic plans, including
restructuring plans; manufacturing difficulties or delays, internally or within the supply chain; product efficacy or safety concerns resulting in product recalls or regulatory
action; significant adverse litigation or government action, including related to product liability claims; changes to applicable laws and regulations, including tax laws,
global health care reforms and import/export and trade laws; trends toward health care cost containment; changes in behavior and spending patterns of purchasers of
health care products and services; financial instability of international economies and legal systems and sovereign risk; increased scrutiny of the health care industry by
government agencies. A further list and descriptions of these risks, uncertainties and other factors can be found in Johnson & Johnson's Annual Report on Form 10-K
for the fiscal year ended December 30, 2018, including in the sections captioned “Cautionary Note Regarding Forward-Looking Statements” and “Item 1A. Risk
Factors,” in the company’s most recently filed Quarterly Report on Form 10-Q and in the company’s subsequent filings with the Securities and Exchange Commission.
Copies of these filings are available online at www.sec.gov, www.jnj.com or on request from Johnson & Johnson. Any forward-looking statement made in this
presentation speaks only as of the date of this presentation. Johnson & Johnson does not undertake to update any forward-looking statement as a result of new
information or future events or developments.
Cautionary Note on Non-GAAP Financial MeasuresThis presentation refers to certain non-GAAP financial measures. These non-GAAP financial measures should not be considered replacements for, and should be read
together with, the most comparable GAAP financial measures.
A reconciliation of these non-GAAP financial measures to the most directly comparable GAAP financial measures can be found in the accompanying financial
schedules of the earnings release and the Investor Relations section of the Company’s website at www.investor.jnj.com.

Strategic Partnerships,
Collaborations & Licensing Arrangements
4
During the course of this morning’s presentation, we will discuss a number of products and compounds developed in collaboration
with strategic partners or licensed from other companies. The following is an acknowledgement of those relationships:
Consumer RHINOCORT licensed from AstraZeneca
Orthopaedics MONOVISC/ORTHOVISC licensed from Anika Therapeutics, Inc.
ImmunologyREMICADE and SIMPONI/ SIMPONI ARIA marketing partners are Schering-Plough (Ireland) Company, a subsidiary of Merck & Co., Inc.
and Mitsubishi Tanabe Pharma Corporation, and TREMFYA discovered using MorphoSys AG antibody technology
Neuroscience INVEGA SUSTENNA/ XEPLION/ INVEGA TRINZA/ TREVICTA includes technology licensed from Alkermes Pharma Ireland Limited
Infectious Diseases
& VirologyPREZCOBIX/ REZOLSTA fixed-dose combination, SYMTUZA and ODEFSEY developed in collaboration with Gilead Sciences, Inc., and
JULUCA developed in collaboration with ViiV Healthcare UK
Cardiovascular/
Metabolism/OtherINVOKANA/ INVOKAMET/ VOKANAMET/ INVOKAMET XR fixed-dose combination licensed from Mitsubishi Tanabe Pharma
Corporation, XARELTO co-developed with Bayer HealthCare AG, and PROCRIT/ EPREX licensed from Amgen Inc.
OncologyIMBRUVICA developed in collaboration and co-marketed in the U.S. with Pharmacyclics, LLC, an AbbVie company, ZYTIGA licensed
from BTG International Ltd., VELCADE developed in collaboration with Millennium: The Takeda Oncology Company, DARZALEX licensed
from Genmab A/S, and BALVERSA discovered in collaboration with Astex Pharmaceuticals, Inc.
Pulmonary
HypertensionUPTRAVI license and supply agreement with Nippon Shinyaku (co-promotion in Japan), and OPSUMIT co-promotion agreement with
Nippon Shinyaku in Japan

Opening Remarks and Logistics1.
5
Agenda
Joaquin Duato
Vice Chairman of the
Executive Committee
Paul Stoffels, M.D.
Vice Chairman of the
Executive Committee &
Chief Scientific Officer
Joseph J. Wolk
Executive Vice President,
Chief Financial Officer
Joseph J. Wolk
Executive Vice President,
Chief Financial Officer
Chris DelOrefice
Vice President,
Investor Relations
Q&A
Sales Performance and
Financial Results Review
3. Capital Allocation and
Guidance
4.
Quarter Key Highlights2.
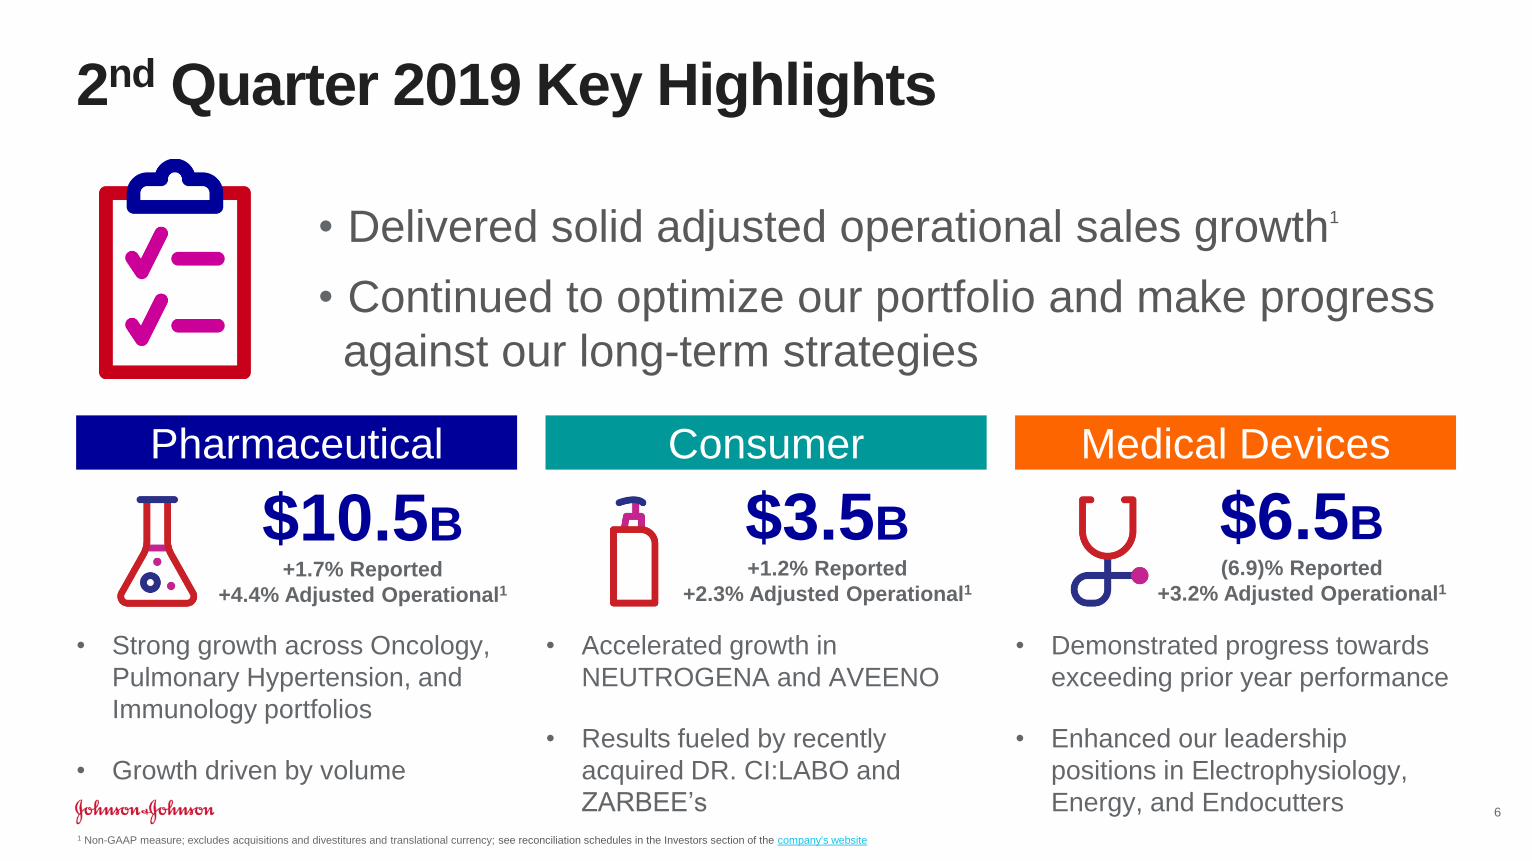
• Demonstrated progress towards
exceeding prior year performance
• Enhanced our leadership
positions in Electrophysiology,
Energy, and Endocutters
• Strong growth across Oncology,
Pulmonary Hypertension, and
Immunology portfolios
• Growth driven by volume
• Accelerated growth in
NEUTROGENA and AVEENO
• Results fueled by recently
acquired DR. CI:LABO and
ZARBEE’s
2nd Quarter 2019 Key Highlights
• Delivered solid adjusted operational sales growth1
• Continued to optimize our portfolio and make progress
against our long-term strategies
Pharmaceutical Consumer Medical Devices
$10.5B+1.7% Reported
+4.4% Adjusted Operational1
$3.5B+1.2% Reported
+2.3% Adjusted Operational1
$6.5B(6.9)% Reported
+3.2% Adjusted Operational1
6
1 Non-GAAP measure; excludes acquisitions and divestitures and translational currency; see reconciliation schedules in the Investors section of the company's website

Regional Sales Results Q2 2019 Q2 2018
% CHANGE
Reported Operational1
U.S. $10.4 $10.6 (2.2)% (2.2)%
Europe 4.7 4.8 (1.6) 4.7
Western Hemisphere
(ex U.S.)1.5 1.5 (5.5) 4.2
Asia-Pacific, Africa 4.0 3.8 3.4 7.2
International 10.2 10.2 (0.3) 5.5
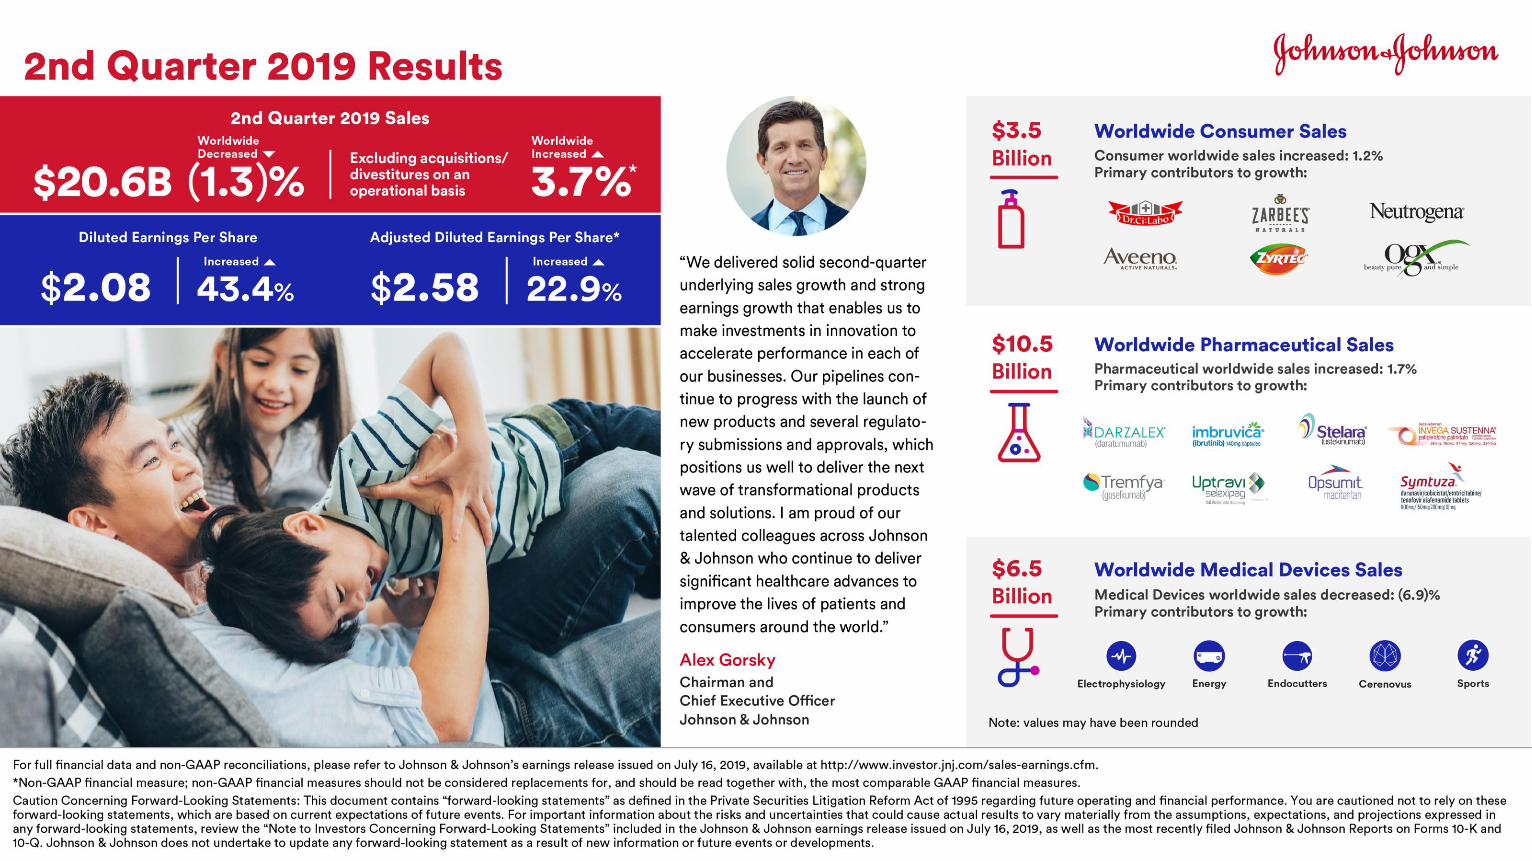
Worldwide (WW) $20.6 $20.8 (1.3)% 1.6%
1 Non-GAAP measure; excludes the impact of translational currency; see reconciliation schedules in the Investors section of the company's website2 Note: values may have been rounded
2nd Quarter 2019 Sales
Dollars in Billions
7
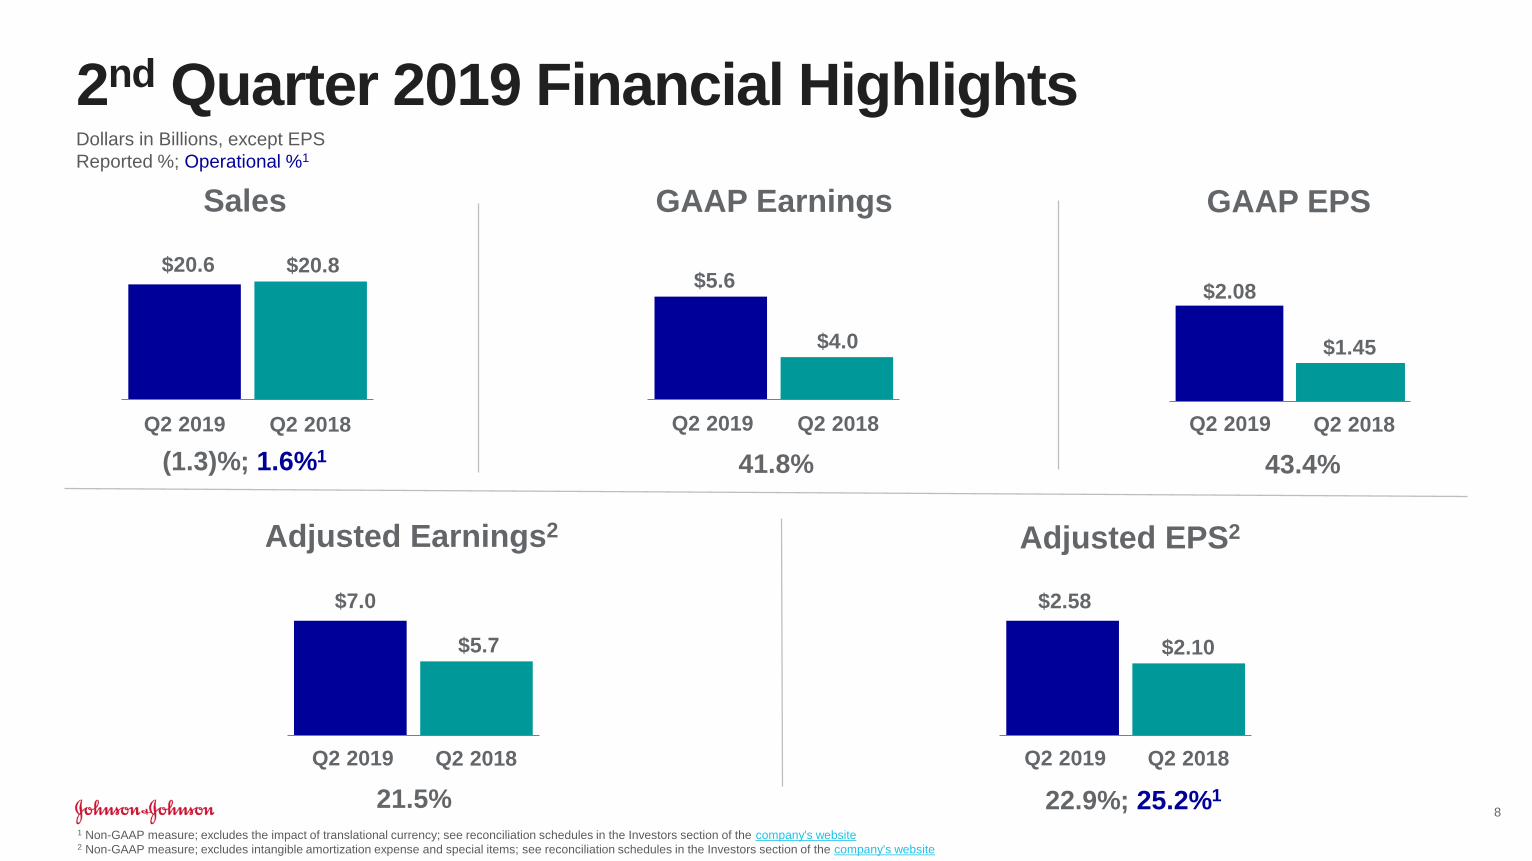
22.9%; 25.2%1
Q2 2019 Q2 2018
$2.58
$2.10
2nd Quarter 2019 Financial HighlightsDollars in Billions, except EPS
Reported %; Operational %1
8
Sales
Adjusted Earnings2 Adjusted EPS2
(1.3)%; 1.6%1
$20.6 $20.8
GAAP Earnings
41.8%
$5.6
$4.0
21.5%
Q2 2019 Q2 2018
GAAP EPS
43.4%
$2.08
$1.45
Q2 2019Q2 2019 Q2 2018 Q2 2018Q2 2019 Q2 2018
$7.0
$5.7
1 Non-GAAP measure; excludes the impact of translational currency; see reconciliation schedules in the Investors section of the company's website2 Non-GAAP measure; excludes intangible amortization expense and special items; see reconciliation schedules in the Investors section of the company's website
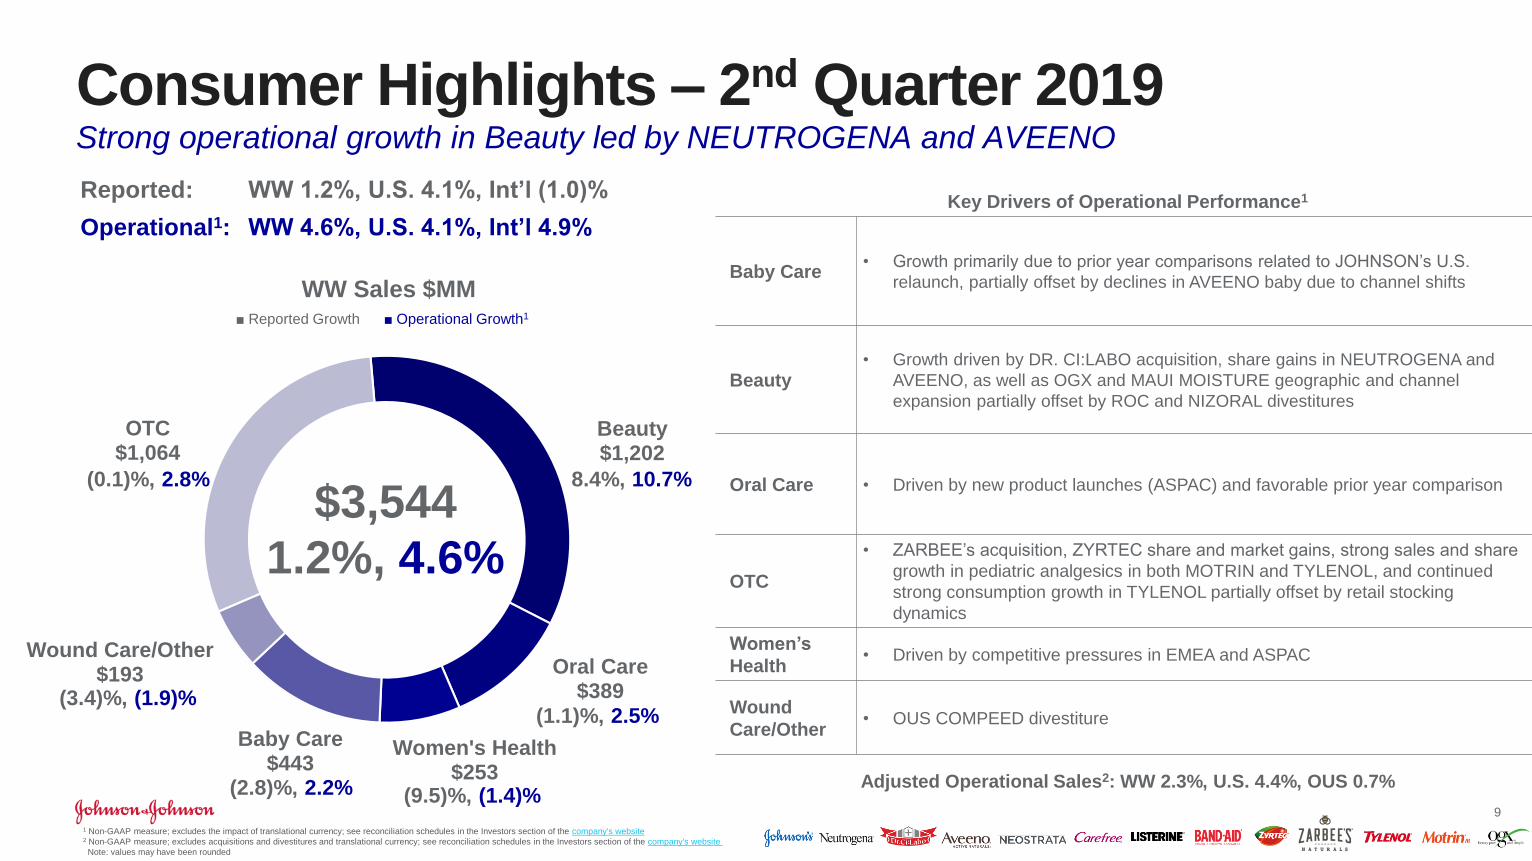
Beauty$1,202
Oral Care$389
Women's Health$253
Baby Care$443
Wound Care/Other$193
OTC$1,064
$3,544
1.2%, 4.6%
WW Sales $MM
(0.1)%, 2.8% 8.4%, 10.7%
(3.4)%, (1.9)%
(2.8)%, 2.2% (9.5)%, (1.4)%
(1.1)%, 2.5%
■ Reported Growth ■ Operational Growth1
Consumer Highlights – 2nd Quarter 2019Strong operational growth in Beauty led by NEUTROGENA and AVEENO
9
Key Drivers of Operational Performance1
Baby Care• Growth primarily due to prior year comparisons related to JOHNSON’s U.S.
relaunch, partially offset by declines in AVEENO baby due to channel shifts
Beauty• Growth driven by DR. CI:LABO acquisition, share gains in NEUTROGENA and
AVEENO, as well as OGX and MAUI MOISTURE geographic and channel
expansion partially offset by ROC and NIZORAL divestitures
Oral Care • Driven by new product launches (ASPAC) and favorable prior year comparison
OTC
• ZARBEE’s acquisition, ZYRTEC share and market gains, strong sales and share
growth in pediatric analgesics in both MOTRIN and TYLENOL, and continued
strong consumption growth in TYLENOL partially offset by retail stocking
dynamics
Women’s
Health• Driven by competitive pressures in EMEA and ASPAC
Wound
Care/Other• OUS COMPEED divestiture
Adjusted Operational Sales2: WW 2.3%, U.S. 4.4%, OUS 0.7%
Reported: WW 1.2%, U.S. 4.1%, Int’l (1.0)%
Operational1: WW 4.6%, U.S. 4.1%, Int’l 4.9%
1 Non-GAAP measure; excludes the impact of translational currency; see reconciliation schedules in the Investors section of the company's website2 Non-GAAP measure; excludes acquisitions and divestitures and translational currency; see reconciliation schedules in the Investors section of the company's website
Note: values may have been rounded

Key Drivers of Operational Performance1
Immunology• Growth driven by strong uptake of STELARA in Crohn’s Disease, strong launch uptake of
TREMFYA, expanded indications of SIMPONI ARIA, and U.S. immunology market growth
• REMICADE decline due to increased discounts/rebates and biosimilar competition
Infectious
Diseases
• Strong sales of SYMTUZA and launch of JULUCA partially offset by increased competition
for PREZISTA/PREZCOBIX/REZOLSTA and PREZISTA OUS LOE
Neuroscience• Paliperidone long-acting injectables growth due to strength of INVEGA TRINZA/TREVICTA
and INVEGA SUSTENNA/XEPLION, partially offset by cannibalization of RISPERDAL
CONSTA and lower sales of CONCERTA due to generic competition
Oncology
• DARZALEX continued strong market growth and share gains in the U.S. and EU, driven by
patient uptake in all lines of therapy, strong growth in Japan and Latin America. Sales
included one-time adjustments related to completion of pricing & reimbursement discussions
in certain European countries which positively impacted WW operational growth by 16 pts.
• Strong sales of IMBRUVICA due to increased patient uptake globally, higher market share
and growth across multiple indications, primarily CLL L1
• Lower sales of ZYTIGA in the U.S. due to generic competition partially offset by strong sales
and share growth of ZYTIGA in EU
• Launch uptake of ERLEADA and share gains in non-metastatic CRPC; launched in EMEA
and available in 5 countries with several additional launches planned
Cardiovascular/
Metabolism/
Other
(CVM/Other)
• XARELTO lower sales driven by higher Medicare Part D utilization and rebates, higher
donut hole utilization and legislative rebate change, partially offset by higher market share
• INVOKANA/INVOKAMET lower sales due to share loss from competitive pressures and
safety label update
Pulmonary
Hypertension
(PH)
• Growth driven by strong sales of OPSUMIT and UPTRAVI due to continued market growth
and share gains
• Lower sales of TRACLEER due to increased use of OPSUMIT and generics in the U.S./EU
Adjusted Operational Sales2: WW 4.4%, U.S. (2.0)%, OUS 12.9%
Immunology$3,466
Infectious Diseases$862
Neuroscience$1,538
Oncology$2,697 CVM/Other
$1,275
PH$690$10,529
1.7%, 4.4%
WW Sales $MM
0.6%, 3.9%
(16.0)%, (14.7)%
1.5%, 5.4%3.8%, 5.7%
3.8%, 6.0%
9.8%, 14.1%
■ Reported Growth ■ Operational Growth1
Pharmaceutical Highlights – 2nd Quarter 2019Double-digit growth in nine key products across multiple therapeutic areas
10
Reported: WW 1.7%, U.S. (2.0)%, Int’l 6.5%
Operational1: WW 4.4%, U.S. (2.0)%, Int’l 12.9%
1 Non-GAAP measure; excludes the impact of translational currency; see reconciliation schedules in the Investors section of the company's website2 Non-GAAP measure; excludes acquisitions and divestitures and translational currency; see reconciliation schedules in the Investors section of the company's website
Note: values may have been rounded
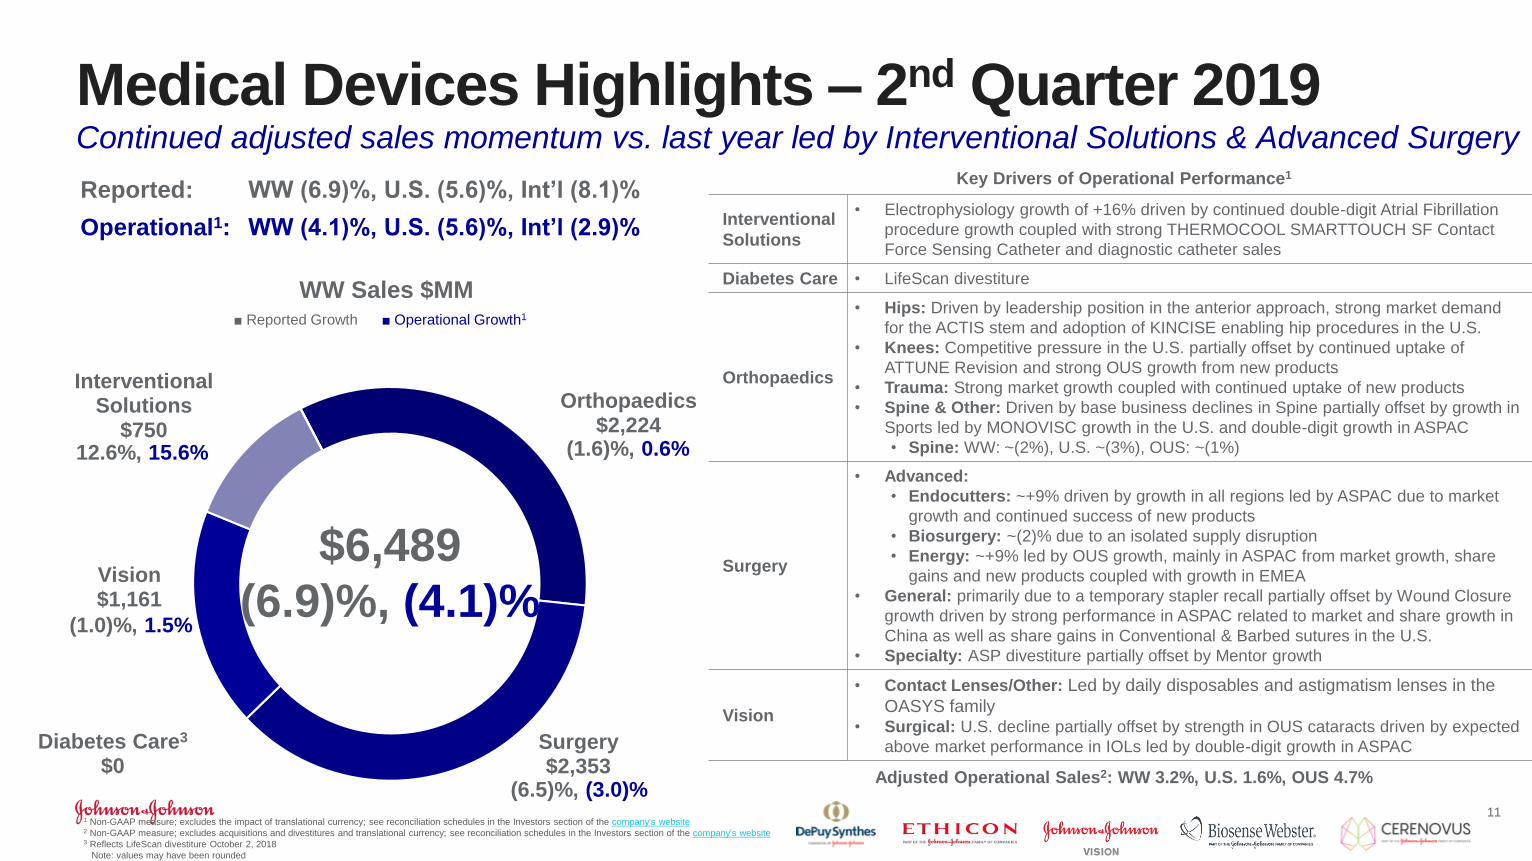
Orthopaedics$2,224
Surgery$2,353
Vision$1,161
Interventional Solutions
$750
Diabetes Care3
$0
$6,489
(6.9)%, (4.1)%
(1.6)%, 0.6%12.6%, 15.6%
(1.0)%, 1.5%
(6.5)%, (3.0)%
WW Sales $MM■ Reported Growth ■ Operational Growth1
Medical Devices Highlights – 2nd Quarter 2019Continued adjusted sales momentum vs. last year led by Interventional Solutions & Advanced Surgery
11
Reported: WW (6.9)%, U.S. (5.6)%, Int’l (8.1)%
Operational1: WW (4.1)%, U.S. (5.6)%, Int’l (2.9)%
Key Drivers of Operational Performance1
Interventional
Solutions
• Electrophysiology growth of +16% driven by continued double-digit Atrial Fibrillation
procedure growth coupled with strong THERMOCOOL SMARTTOUCH SF Contact
Force Sensing Catheter and diagnostic catheter sales
Diabetes Care • LifeScan divestiture
Orthopaedics
• Hips: Driven by leadership position in the anterior approach, strong market demand
for the ACTIS stem and adoption of KINCISE enabling hip procedures in the U.S.
• Knees: Competitive pressure in the U.S. partially offset by continued uptake of
ATTUNE Revision and strong OUS growth from new products
• Trauma: Strong market growth coupled with continued uptake of new products
• Spine & Other: Driven by base business declines in Spine partially offset by growth in
Sports led by MONOVISC growth in the U.S. and double-digit growth in ASPAC
• Spine: WW: ~(2%), U.S. ~(3%), OUS: ~(1%)
Surgery
• Advanced:
• Endocutters: ~+9% driven by growth in all regions led by ASPAC due to market
growth and continued success of new products
• Biosurgery: ~(2)% due to an isolated supply disruption
• Energy: ~+9% led by OUS growth, mainly in ASPAC from market growth, share
gains and new products coupled with growth in EMEA
• General: primarily due to a temporary stapler recall partially offset by Wound Closure
growth driven by strong performance in ASPAC related to market and share growth in
China as well as share gains in Conventional & Barbed sutures in the U.S.
• Specialty: ASP divestiture partially offset by Mentor growth
Vision
• Contact Lenses/Other: Led by daily disposables and astigmatism lenses in the
OASYS family• Surgical: U.S. decline partially offset by strength in OUS cataracts driven by expected
above market performance in IOLs led by double-digit growth in ASPAC
Adjusted Operational Sales2: WW 3.2%, U.S. 1.6%, OUS 4.7%
1 Non-GAAP measure; excludes the impact of translational currency; see reconciliation schedules in the Investors section of the company's website2 Non-GAAP measure; excludes acquisitions and divestitures and translational currency; see reconciliation schedules in the Investors section of the company's website 3 Reflects LifeScan divestiture October 2, 2018
Note: values may have been rounded
1 Non-GAAP measure; excludes the impact of translational currency; see reconciliation schedules in the Investors section of the company's website
Note: values may have been rounded
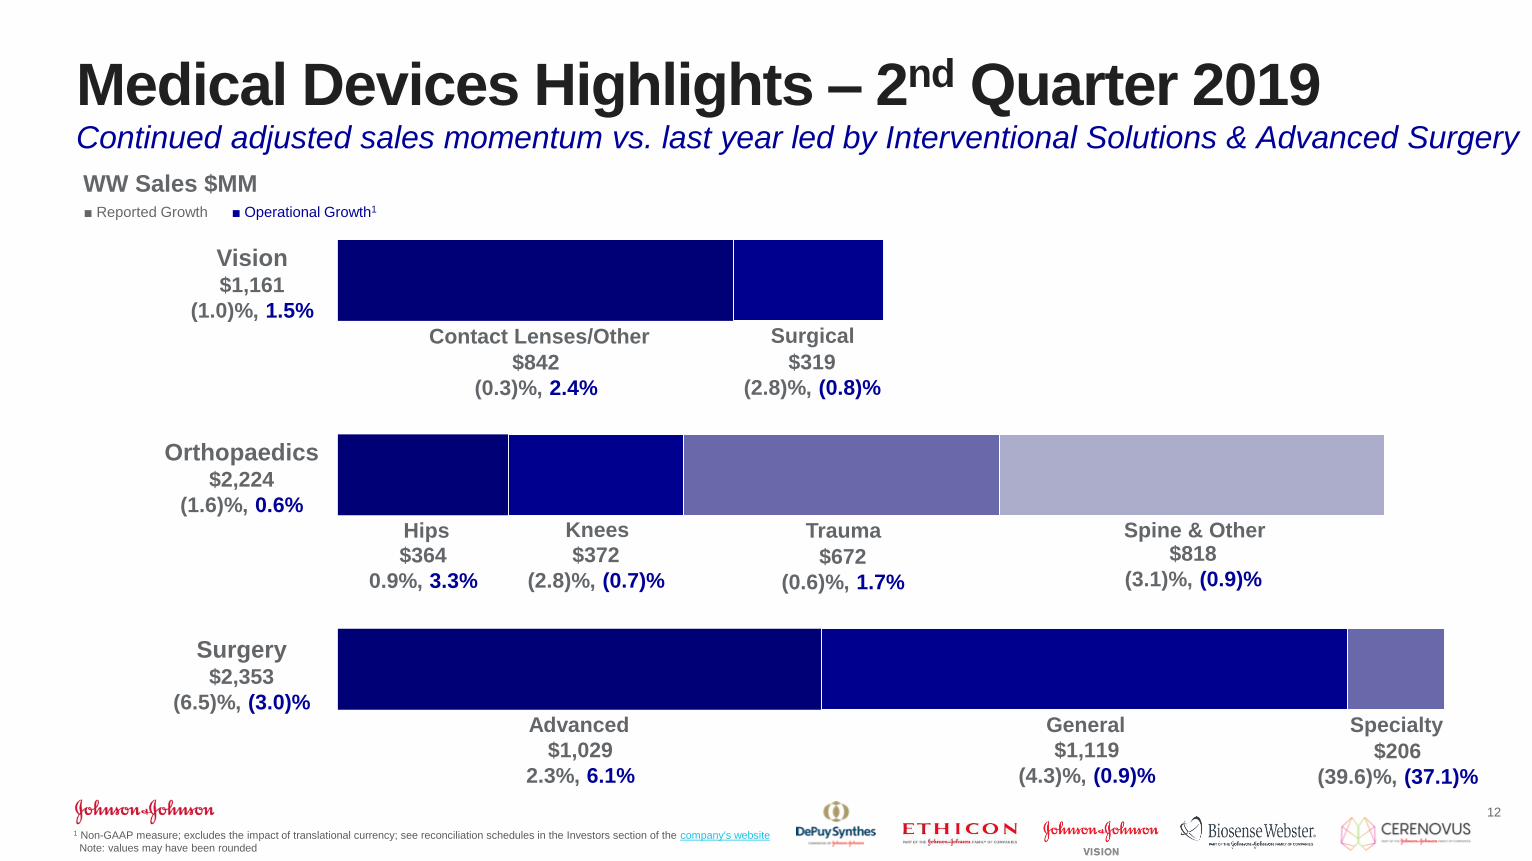
Medical Devices Highlights – 2nd Quarter 2019Continued adjusted sales momentum vs. last year led by Interventional Solutions & Advanced Surgery
12
Surgery
Orthopaedics
Vision Care
Contact Lenses/Other
Advanced General Specialty
Hips Knees Trauma Spine & Other
Surgical
$842
(0.3)%, 2.4%
$319
(2.8)%, (0.8)%
$1,029
2.3%, 6.1%
$1,119
(4.3)%, (0.9)%
$364
0.9%, 3.3%
$372
(2.8)%, (0.7)%$672
(0.6)%, 1.7%
$818
(3.1)%, (0.9)%
$206
(39.6)%, (37.1)%
WW Sales $MM■ Reported Growth ■ Operational Growth1
Vision$1,161
(1.0)%, 1.5%
Orthopaedics$2,224
(1.6)%, 0.6%
Surgery$2,353
(6.5)%, (3.0)%
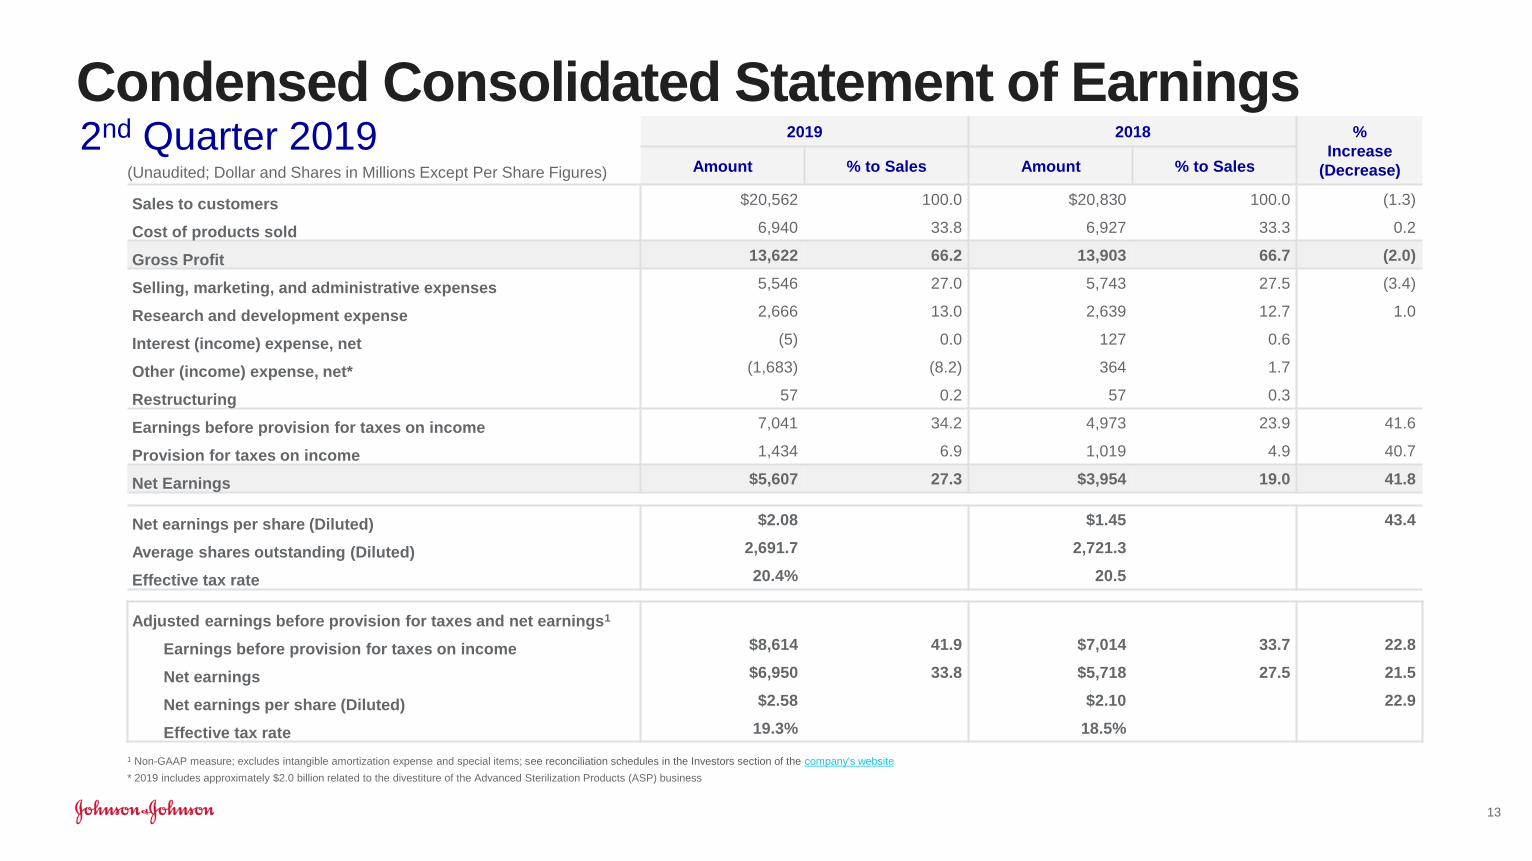
Condensed Consolidated Statement of Earnings
1 Non-GAAP measure; excludes intangible amortization expense and special items; see reconciliation schedules in the Investors section of the company's website
* 2019 includes approximately $2.0 billion related to the divestiture of the Advanced Sterilization Products (ASP) business
13
2019 2018 %
Increase
(Decrease)Amount % to Sales Amount % to Sales
Sales to customers $20,562 100.0 $20,830 100.0 (1.3)
Cost of products sold 6,940 33.8 6,927 33.3 0.2
Gross Profit 13,622 66.2 13,903 66.7 (2.0)
Selling, marketing, and administrative expenses 5,546 27.0 5,743 27.5 (3.4)
Research and development expense 2,666 13.0 2,639 12.7 1.0
Interest (income) expense, net (5) 0.0 127 0.6
Other (income) expense, net* (1,683) (8.2) 364 1.7
Restructuring 57 0.2 57 0.3
Earnings before provision for taxes on income 7,041 34.2 4,973 23.9 41.6
Provision for taxes on income 1,434 6.9 1,019 4.9 40.7
Net Earnings $5,607 27.3 $3,954 19.0 41.8
-
Net earnings per share (Diluted) $2.08 $1.45 43.4
Average shares outstanding (Diluted) 2,691.7 2,721.3
Effective tax rate 20.4% 20.5
.
Adjusted earnings before provision for taxes and net earnings1
Earnings before provision for taxes on income $8,614 41.9 $7,014 33.7 22.8
Net earnings $6,950 33.8 $5,718 27.5 21.5
Net earnings per share (Diluted) $2.58 $2.10 22.9
Effective tax rate 19.3% 18.5%
2nd Quarter 2019(Unaudited; Dollar and Shares in Millions Except Per Share Figures)

2019 2018($0.2) ($0.3)
Adjusted Income Before Tax by Segment1
2nd Quarter 2019
$8.6B
$4.4
$3.7
$0.7
14
Pharmaceutical
Medical Devices*
Consumer
Expenses Not Allocated to Segments
2019 2018
Pharmaceutical 41.6% 43.2%
Medical Devices 57.5% 27.8%
Consumer 20.9% 25.7%
Total 41.9% 33.7%
1 Non-GAAP measure; excludes amortization expense and special items; see reconciliation schedules in the Investors section of the company's website2 Estimated as of 7/16/19
* 2019 includes approximately $2.0 billion related to the divestiture of the Advanced Sterilization Products (ASP) business
$7.0B
$4.5
$1.9
$0.9
% to Sales
2
Medical Devices• Announced early results from first-in-human study of Monarch Platform ongoing BENEFIT study of Monarch Platform indicates safety, feasibility and
successful localization of lung nodules in 92% of cases
Pharmaceuticals• The Committee for Medicinal Products for Human Use (CHMP) of the European Medicines Agency (EMA) has recommended broadening the existing
marketing authorization for IMBRUVICA (ibrutinib) for the use of ibrutinib in combination with obinutuzumab in adult patients with previously untreated
chronic lymphocytic leukemia (CLL) and for use of ibrutinib plus rituximab for the treatment of adult patients with Waldenström’s macroglobulinemia (WM)
• The U.S. Food and Drug Administration (FDA) approved of DARZALEX (daratumumab) in combination with lenalidomide and dexamethasone (Rd) for the
treatment of patients with newly diagnosed multiple myeloma who are ineligible for autologous stem cell transplant (ASCT)
• A Type II variation was submitted to the EMA seeking approval of ERLEADA (apalutamide) for the treatment of patients with metastatic hormone-sensitive
prostate cancer (mHSPC)
• A sNDA was submitted to the FDA seeking approval of a new indication for ERLEADA (apalutamide) for the treatment of patients with metastatic
castration-sensitive prostate cancer (mCSPC)
• The FDA granted Priority Review for the supplemental New Drug Application (sNDA) for INVOKANA (canagliflozin) to reduce the risk of end-stage kidney
disease, the doubling of serum creatinine, and renal or cardiovascular death in adults with type 2 diabetes and chronic kidney disease
• A New Drug Application (NDA) to the FDA has been submitted by ViiV Healthcare for the investigational once monthly, injectable, two-drug regimen of
Janssen’s rilpivirine and ViiV’s cabotegravir for the treatment of HIV in adults whose viral load is suppressed and who are not resistant to cabotegravir or
rilpivirine
• A Biologics License Application (BLA) was submitted to the FDA seeking approval of a new subcutaneous (SC) formulation of DARZALEX (daratumumab)
for the treatment of patients with multiple myeloma2
Notable Events in 2nd Quarter 20191
15
1 These developments and all other news releases are available online in the Investors section of the company’s website at news releases2 Subsequent to the quarter
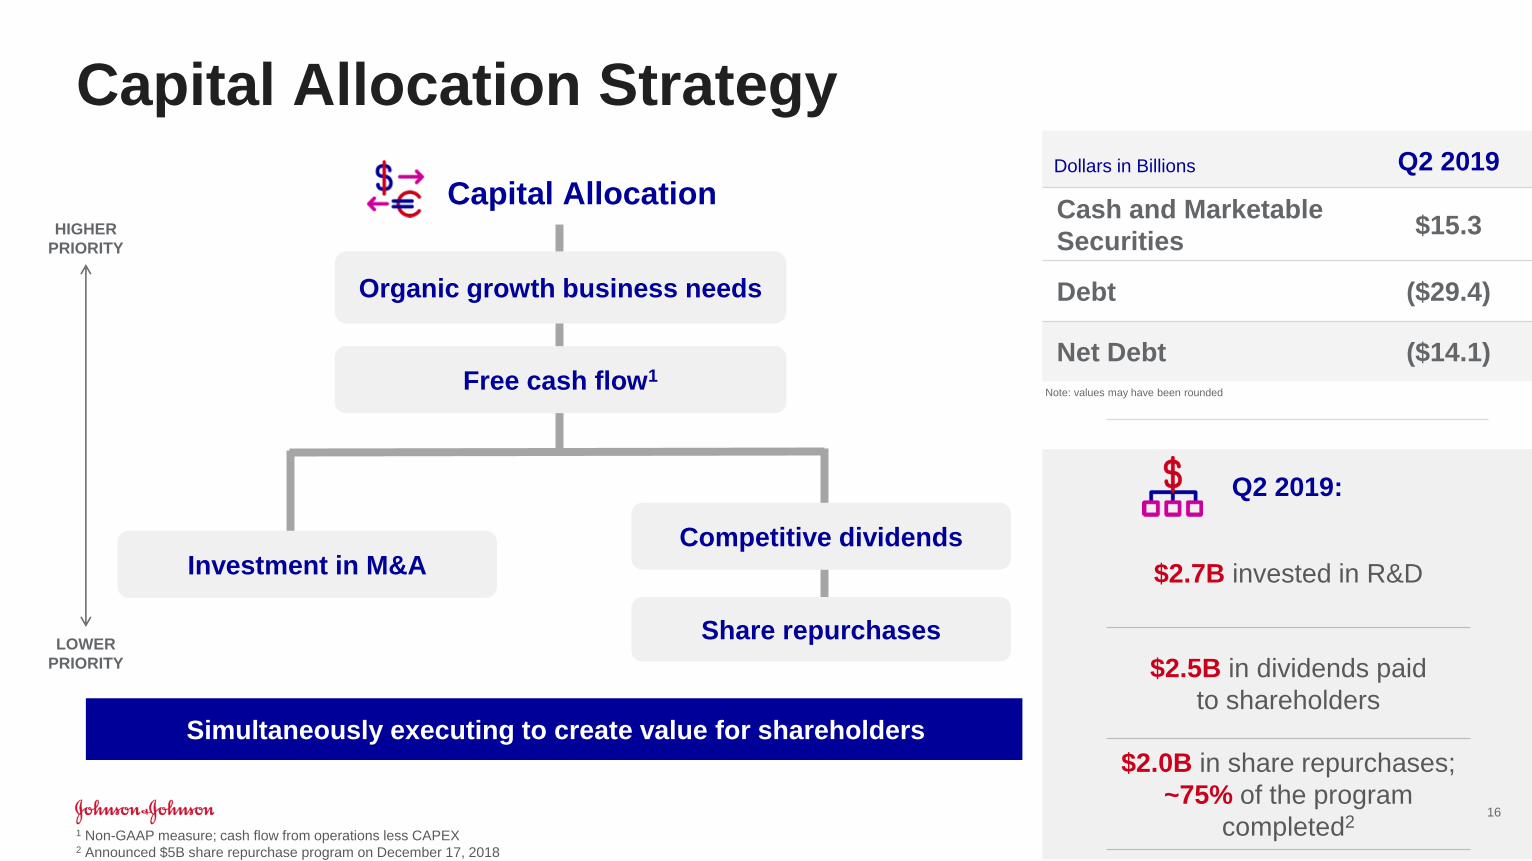
Capital Allocation Strategy
Capital Allocation
Organic growth business needs
Free cash flow1
Simultaneously executing to create value for shareholders
Competitive dividends
Share repurchases
HIGHER
PRIORITY
LOWER
PRIORITY
Investment in M&A
Dollars in Billions Q2 2019
Cash and Marketable
Securities$15.3
Debt ($29.4)
Net Debt ($14.1)
Q2 2019:
$2.7B invested in R&D
$2.0B in share repurchases;
~75% of the program
completed2
$2.5B in dividends paid
to shareholders
Note: values may have been rounded
1 Non-GAAP measure; cash flow from operations less CAPEX2 Announced $5B share repurchase program on December 17, 2018
16
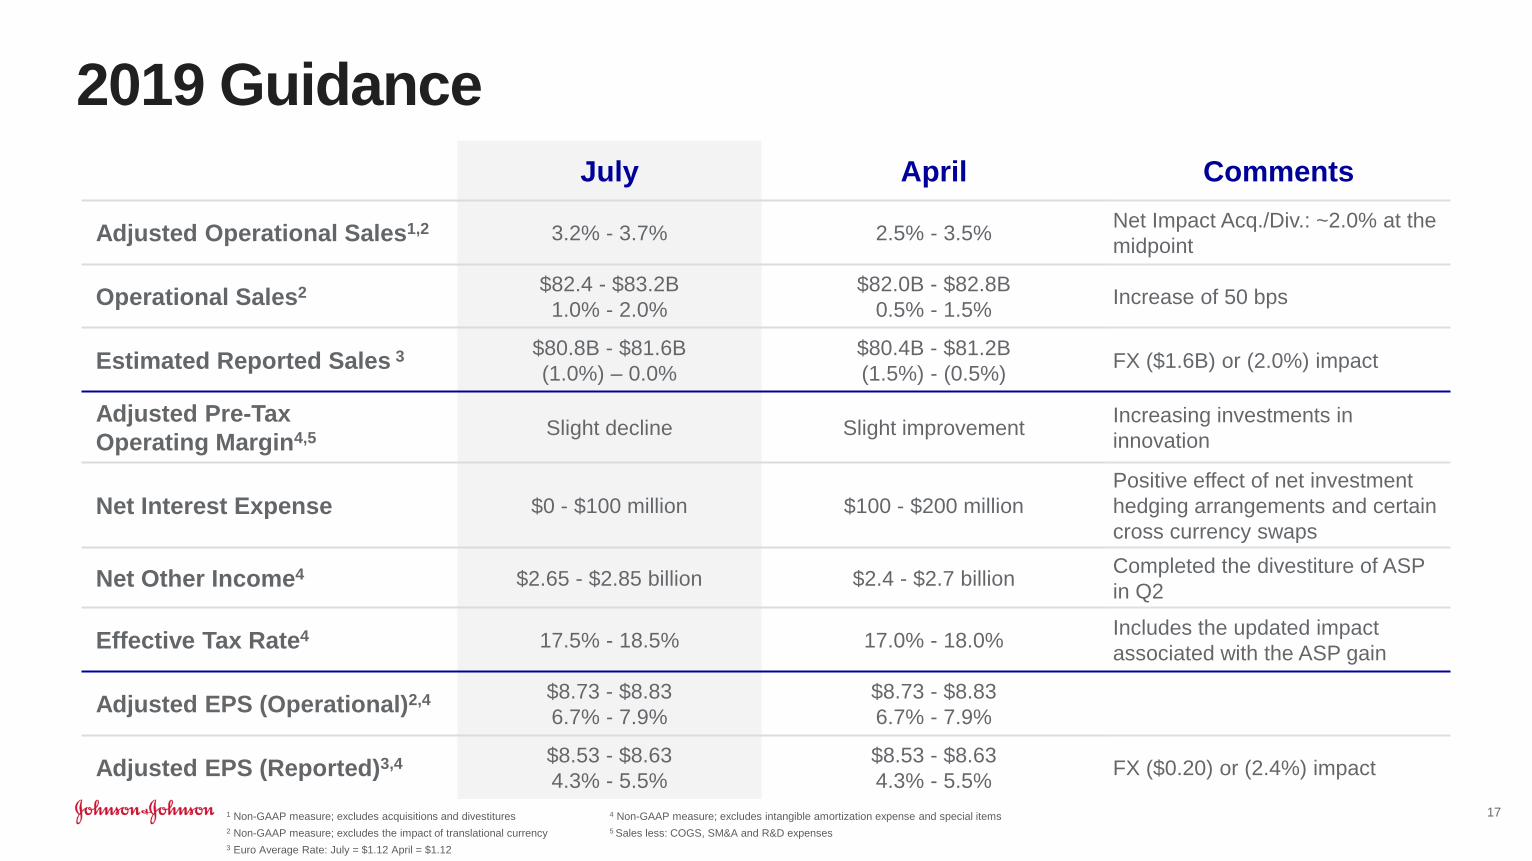
2019 Guidance
1 Non-GAAP measure; excludes acquisitions and divestitures 4 Non-GAAP measure; excludes intangible amortization expense and special items
2 Non-GAAP measure; excludes the impact of translational currency 5 Sales less: COGS, SM&A and R&D expenses
3 Euro Average Rate: July = $1.12 April = $1.12
17
July April Comments
Adjusted Operational Sales1,2 3.2% - 3.7% 2.5% - 3.5%Net Impact Acq./Div.: ~2.0% at the
midpoint
Operational Sales2 $82.4 - $83.2B
1.0% - 2.0%
$82.0B - $82.8B
0.5% - 1.5%Increase of 50 bps
Estimated Reported Sales 3 $80.8B - $81.6B
(1.0%) – 0.0%
$80.4B - $81.2B
(1.5%) - (0.5%)FX ($1.6B) or (2.0%) impact
Adjusted Pre-Tax
Operating Margin4,5Slight decline Slight improvement
Increasing investments in
innovation
Net Interest Expense $0 - $100 million $100 - $200 million
Positive effect of net investment
hedging arrangements and certain
cross currency swaps
Net Other Income4 $2.65 - $2.85 billion $2.4 - $2.7 billionCompleted the divestiture of ASP
in Q2
Effective Tax Rate4 17.5% - 18.5% 17.0% - 18.0%Includes the updated impact
associated with the ASP gain
Adjusted EPS (Operational)2,4 $8.73 - $8.83
6.7% - 7.9%
$8.73 - $8.83
6.7% - 7.9%
Adjusted EPS (Reported)3,4 $8.53 - $8.63
4.3% - 5.5%
$8.53 - $8.63
4.3% - 5.5%FX ($0.20) or (2.4%) impact


Q&A
Joseph J. WolkExecutive Vice President,
Chief Financial Officer
Paul Stoffels, M.D.Vice Chairman of the
Executive Committee &
Chief Scientific Officer
Joaquin DuatoVice Chairman of the
Executive Committee


