A COMPARATIVE STUDY OF THE IMPACT OF GLOBALISATION ON THE DEVELOPMENT OF
BANGLADESH AND TANZANIA
By
RACHELLE SIMPSON
Submitted for the degree of Doctor of Philosophy December 2007
School of Applied Economics Faculty of Business and Law
Victoria University

i
Student Declaration
I, Rachelle Simpson, declare that the PhD thesis entitled “A Comparative Study of the
Impact of Globalisation on the Development of Bangladesh and Tanzania” is no more
than 100,000 words in length including quotes and exclusive of tables, figures,
appendices, bibliography, references and footnotes. This thesis contains no material that
has been submitted previously, in whole or in part, for the award of any other academic
degree or diploma. Except where otherwise indicated, this thesis is my own work.
Signature Date
ii
Acknowledgement
Undertaking this research would not have been possible without the support and guidance
of many people. I am especially grateful to my supervisors, Muhammad Mahmood and
László Kónya, for their persistence and the support, encouragement and ideas provided to
me throughout this process.
iii
Abstract
Across the extensive body of literature on the subject of developing countries in the most
recent period of globalised economic activity three main arguments are evident, firstly,
that globalisation has had a positive impact on these countries, secondly, that
globalisation has had a negative impact on these countries, and thirdly, that these
countries have been by-passed by the most recent period of globalisation. This research
seeks to understand what the impact has been on two of the world’s poorest developing
countries, Bangladesh and Tanzania. Within the research globalisation is measured by
openness, specifically changes in trade and investment flows. Impact is measured through
change in development, and in order to do this, a modified Human Development Index is
created. Through analysing each of the two countries during the globalisation period and
comparing and contrasting the experience with the period prior to globalisation utilising
common econometric techniques, this research reaches the conclusion that neither
country has been excluded from the most recent period of globalisation. Further, it is
concluded that the net impact of globalisation on development in both countries has been
neither positive nor negative, thereby suggesting that both positive and negative forces
have counterbalanced one another.
iv
Table of Contents
Student Declaration ..................................................................................................... i Acknowledgement........................................................................................................ ii Abstract....................................................................................................................... iii Table of Contents ........................................................................................................iv List of Figures ........................................................................................................... vii List of Tables ............................................................................................................ viii List of Tables ............................................................................................................ viii
1 INTRODUCTION ........................................................................................................... 1 1.1 RESEARCH OBJECTIVE.................................................................................................. 1 1.2 GLOBALISATION........................................................................................................... 1 1.3 STATEMENT OF SIGNIFICANCE ..................................................................................... 5 1.4 RESEARCH OVERVIEW.................................................................................................. 6
1.4.1 The countries which will be studied .................................................................. 6 1.4.2 How impact will be assessed.............................................................................. 7
1.5 RESEARCH OBJECTIVES ................................................................................................ 8 1.6 STRUCTURE OF THIS THESIS ......................................................................................... 9
2 GLOBALISATION ....................................................................................................... 13 2.1 INTRODUCTION........................................................................................................... 13 2.2 DEFINITIONS AND COMPONENTS OF GLOBALISATION ............................................... 14 2.3 ENABLERS AND DRIVERS OF GLOBALISATION ........................................................... 15
2.3.1 Enablers of globalisation ................................................................................. 15 2.3.2 Drivers of globalisation.................................................................................... 17
2.4 ROLES WITHIN THE GLOBALISED ECONOMY.............................................................. 18 2.5 WHAT HAS OCCURRED IN THE INTERNATIONAL ECONOMY ...................................... 20 2.6 DIFFERENCES BETWEEN THE CURRENT PERIOD AND EARLIER PERIODS IN ECONOMIC HISTORY .................................................................................................................................. 29 2.7 GLOBALISATION AND DEVELOPING COUNTRIES........................................................ 30
2.7.1 Globalisation by-passing developing countries.............................................. 32 2.7.2 Disadvantages of globalisation for developing countries.............................. 38 2.7.3 Advantages of globalisation for developing countries ................................... 42
2.8 CONCLUSION .............................................................................................................. 44
3 TRADE AND INVESTMENT THEORY.......................................................................... 45 3.1 INTRODUCTION........................................................................................................... 45 3.2 TRADE ........................................................................................................................ 45
3.2.1 Classical and Neo-classical trade theory........................................................ 45 3.2.2 Additional benefits of trade.............................................................................. 50 3.2.3 Criticisms of traditional trade theory.............................................................. 51 3.2.4 Relevance of traditional trade theory to the current international economy 55 3.2.5 Relevance of trade theory to developing countries ........................................ 58 3.2.6 Support for Classical and Neo-classical trade theory ................................... 60
3.3 INVESTMENT............................................................................................................... 61 3.3.1 Theories of FDI................................................................................................. 63
v
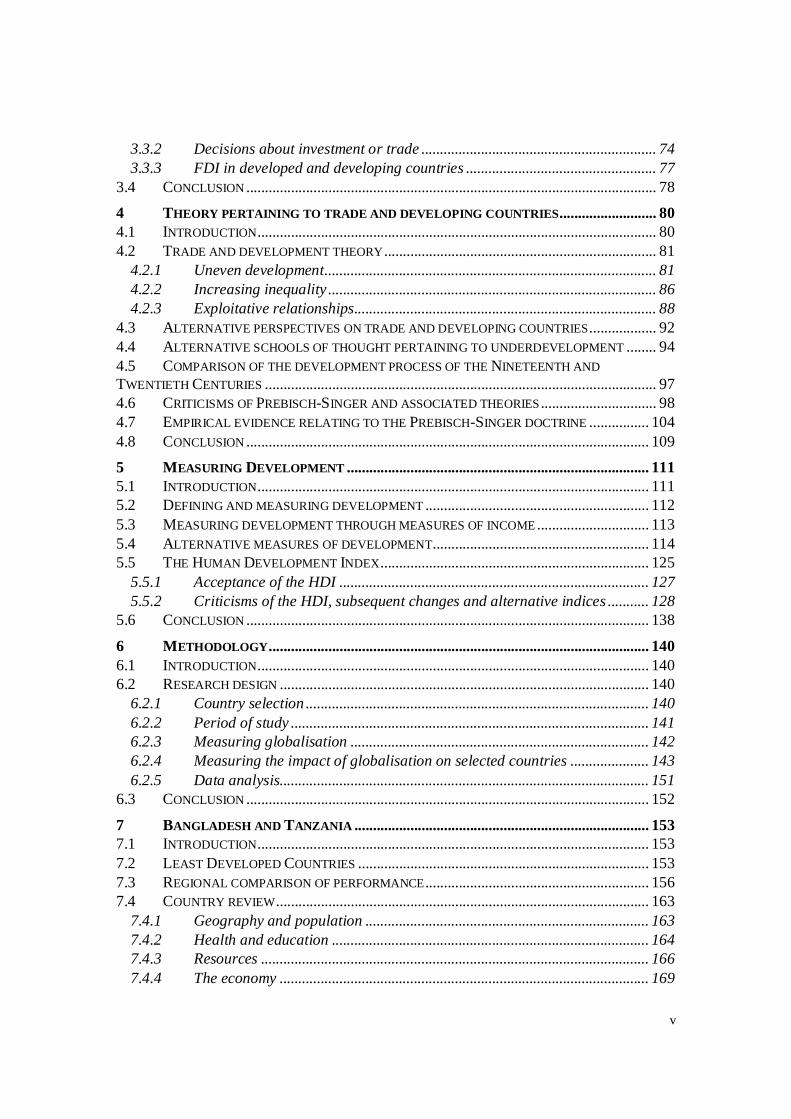
3.3.2 Decisions about investment or trade ............................................................... 74 3.3.3 FDI in developed and developing countries ................................................... 77
3.4 CONCLUSION .............................................................................................................. 78
4 THEORY PERTAINING TO TRADE AND DEVELOPING COUNTRIES.......................... 80 4.1 INTRODUCTION........................................................................................................... 80 4.2 TRADE AND DEVELOPMENT THEORY ......................................................................... 81
4.2.1 Uneven development......................................................................................... 81 4.2.2 Increasing inequality ........................................................................................ 86 4.2.3 Exploitative relationships................................................................................. 88
4.3 ALTERNATIVE PERSPECTIVES ON TRADE AND DEVELOPING COUNTRIES.................. 92 4.4 ALTERNATIVE SCHOOLS OF THOUGHT PERTAINING TO UNDERDEVELOPMENT ........ 94 4.5 COMPARISON OF THE DEVELOPMENT PROCESS OF THE NINETEENTH AND TWENTIETH CENTURIES ......................................................................................................... 97 4.6 CRITICISMS OF PREBISCH-SINGER AND ASSOCIATED THEORIES ............................... 98 4.7 EMPIRICAL EVIDENCE RELATING TO THE PREBISCH-SINGER DOCTRINE ................ 104 4.8 CONCLUSION ............................................................................................................ 109
5 MEASURING DEVELOPMENT ................................................................................. 111 5.1 INTRODUCTION......................................................................................................... 111 5.2 DEFINING AND MEASURING DEVELOPMENT ............................................................ 112 5.3 MEASURING DEVELOPMENT THROUGH MEASURES OF INCOME .............................. 113 5.4 ALTERNATIVE MEASURES OF DEVELOPMENT.......................................................... 114 5.5 THE HUMAN DEVELOPMENT INDEX........................................................................ 125
5.5.1 Acceptance of the HDI ................................................................................... 127 5.5.2 Criticisms of the HDI, subsequent changes and alternative indices ........... 128
5.6 CONCLUSION ............................................................................................................ 138
6 METHODOLOGY...................................................................................................... 140 6.1 INTRODUCTION......................................................................................................... 140 6.2 RESEARCH DESIGN ................................................................................................... 140
6.2.1 Country selection ............................................................................................ 140 6.2.2 Period of study ................................................................................................ 141 6.2.3 Measuring globalisation ................................................................................ 142 6.2.4 Measuring the impact of globalisation on selected countries ..................... 143 6.2.5 Data analysis................................................................................................... 151
6.3 CONCLUSION ............................................................................................................ 152
7 BANGLADESH AND TANZANIA ............................................................................... 153 7.1 INTRODUCTION......................................................................................................... 153 7.2 LEAST DEVELOPED COUNTRIES .............................................................................. 153 7.3 REGIONAL COMPARISON OF PERFORMANCE............................................................ 156 7.4 COUNTRY REVIEW.................................................................................................... 163
7.4.1 Geography and population ............................................................................ 163 7.4.2 Health and education ..................................................................................... 164 7.4.3 Resources ........................................................................................................ 166 7.4.4 The economy ................................................................................................... 169

vi
7.5 CONCLUSION ............................................................................................................ 190
8 MODIFIED DEVELOPMENT INDEX......................................................................... 192 8.1 INTRODUCTION......................................................................................................... 192 8.2 THE MODIFIED INDEX............................................................................................... 193
8.2.1 Construction of the index and potential inclusion of additional components ... .......................................................................................................................... 193 8.2.2 The components of the modified index .......................................................... 196 8.2.3 End points for indicators................................................................................ 206
8.3 CALCULATION OF INDEX FOR BANGLADESH AND TANZANIA ................................ 208 8.4 ANALYSIS OF DEVELOPMENT INDICES ..................................................................... 211
8.4.1 Correlation of AHDI and GHDI.................................................................... 211 8.4.2 Correlation of AHDI and its components ..................................................... 212 8.4.3 Changes in the development index during the globalisation period ........... 217
8.5 INCLUSION OF AN ENVIRONMENTAL INDICATOR..................................................... 220 8.6 CONCLUSION ............................................................................................................ 228
9 OPENNESS AND DEVELOPMENT............................................................................. 231 9.1 INTRODUCTION......................................................................................................... 231 9.2 OPENNESS................................................................................................................. 232 9.3 ANALYTICAL APPROACH.......................................................................................... 234 9.4 ANALYSIS ................................................................................................................. 236
9.4.1 Correlation coefficients.................................................................................. 236 9.4.2 Unit root testing.............................................................................................. 239 9.4.3 Cointegration .................................................................................................. 242 9.4.4 Granger Causality .......................................................................................... 243
9.5 SUMMARY OF TEST RESULTS ................................................................................... 245 9.6 DISCUSSION .............................................................................................................. 247 9.7 CONCLUSION ............................................................................................................ 248
10 RESEARCH FINDINGS AND CONTRIBUTION ........................................................... 250 10.1 INTRODUCTION......................................................................................................... 250 10.2 RESEARCH OBJECTIVES ............................................................................................ 250 10.3 CONTRIBUTION TO KNOWLEDGE ............................................................................. 255 10.4 AREAS FOR FUTURE RESEARCH ............................................................................... 256
BIBLIOGRAPHY.................................................................................................................... 259

vii
List of Figures
FIGURE 7.1: LDC EXPORT PERFORMANCE BETWEEN 1998 AND 2000................................ 155 FIGURE 7.2: AFRICAN DEVELOPING COUNTRY EXPORT PERFORMANCE 1980 - 2000 ......... 157 FIGURE 7.3: ASIAN DEVELOPING COUNTRY EXPORT PERFORMANCE 1980 - 2000 ............. 157 FIGURE 7.4: DEVELOPING COUNTRY EXPORT PERFORMANCE BETWEEN 1980 AND 2000.. 158 FIGURE 7.5: AFRICAN DEVELOPING COUNTRIES – VALUE AND VOLUME OF EXPORTS (BASE
YEAR 2000) ................................................................................................................... 159 FIGURE 7.6: ASIAN DEVELOPING COUNTRIES – VALUE AND VOLUME OF EXPORTS (BASE
YEAR 2000) ................................................................................................................... 159 FIGURE 7.7: TERMS OF TRADE PERFORMANCE (BASE YEAR 2000) ..................................... 160 FIGURE 7.8: GDP PER CAPITA – US DOLLARS (CONSTANT 1995)..................................... 173 FIGURE 7.9: GROSS DOMESTIC PRODUCT – US $BILLION (CONSTANT 1995) ................... 174 FIGURE 7.10: SECTORAL COMPOSITION OF GDP – BANGLADESH ...................................... 175 FIGURE 7.11: SECTORAL COMPOSITION OF GDP – TANZANIA............................................ 175 FIGURE 7.12: BANGLADESH AND TANZANIA EXPORT AND IMPORT VOLUMES ................... 183 FIGURE 7.13: TRADE AS A PROPORTION OF GDP ................................................................ 183 FIGURE 7.14: MAIN EXPORTS – BANGLADESH .................................................................... 184 FIGURE 7.15: MAIN EXPORTS – TANZANIA.......................................................................... 185 FIGURE 7.16: MAJOR EXPORT PERFORMANCE – BANGLADESH .......................................... 185 FIGURE 7.17: MAJOR EXPORT PERFORMANCE – TANZANIA................................................ 186 FIGURE 7.18: FOREIGN DIRECT INVESTMENT – NET INFLOWS (BOP, CURRENT
US$MILLION) ............................................................................................................... 190 FIGURE 8.1: GINI COEFFICIENT ESTIMATES – BANGLADESH AND TANZANIA..................... 195 FIGURE 8.2: CHILD MORTALITY INTERPOLATION – BANGLADESH .................................... 201 FIGURE 8.3: CHILD MORTALITY INTERPOLATION – TANZANIA .......................................... 202 FIGURE 8.4: PUPIL-TEACHER RATIO FOR PRIMARY EDUCATION INTERPOLATION –
BANGLADESH................................................................................................................ 205 FIGURE 8.5: PUPIL-TEACHER RATIO FOR PRIMARY EDUCATION INTERPOLATION –
TANZANIA ..................................................................................................................... 206 FIGURE 8.6: COMPOSITE INDEX CONSTRUCTED UTILISING ARITHMETIC MEAN .................. 210 FIGURE 8.7: COMPOSITE INDEX CONSTRUCTED UTILISING GEOMETRIC MEAN ................... 210 FIGURE 8.8: DEVELOPMENT INDEX (AHDI) AND COMPONENTS – BANGLADESH .............. 215 FIGURE 8.9: DEVELOPMENT INDEX (AHDI) AND COMPONENTS – TANZANIA ................... 216 FIGURE 8.10: DEVELOPMENT INDEX WITH ENVIRONMENTAL INDICATOR – BANGLADESH227 FIGURE 8.11: DEVELOPMENT INDEX WITH ENVIRONMENTAL INDICATOR – TANZANIA..... 227 FIGURE 9.1: OPENNESS COMPOSITION – BANGLADESH....................................................... 232 FIGURE 9.2: OPENNESS COMPOSITION – TANZANIA ............................................................ 233 FIGURE 9.3: OPENNESS AND DEVELOPMENT INDEX – BANGLADESH.................................. 237 FIGURE 9.4: OPENNESS AND DEVELOPMENT INDEX – TANZANIA ....................................... 237
viii
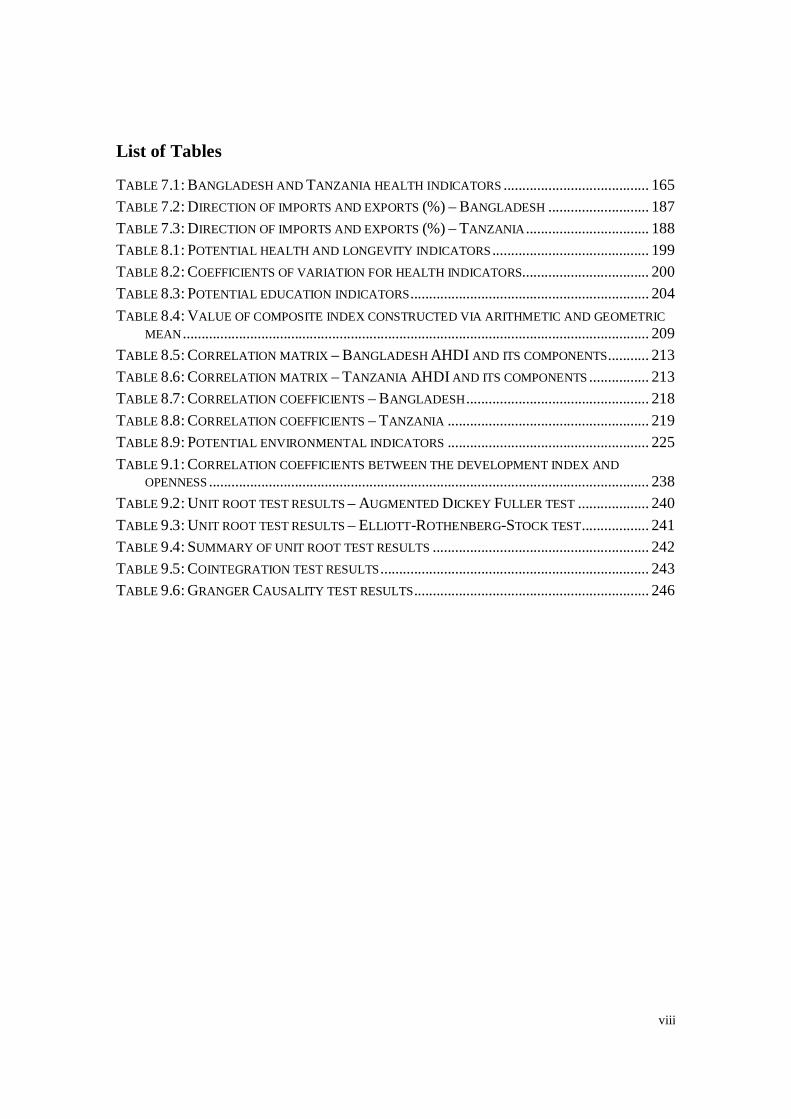
List of Tables
TABLE 7.1: BANGLADESH AND TANZANIA HEALTH INDICATORS ....................................... 165 TABLE 7.2: DIRECTION OF IMPORTS AND EXPORTS (%) – BANGLADESH ........................... 187 TABLE 7.3: DIRECTION OF IMPORTS AND EXPORTS (%) – TANZANIA ................................. 188 TABLE 8.1: POTENTIAL HEALTH AND LONGEVITY INDICATORS .......................................... 199 TABLE 8.2: COEFFICIENTS OF VARIATION FOR HEALTH INDICATORS.................................. 200 TABLE 8.3: POTENTIAL EDUCATION INDICATORS................................................................ 204 TABLE 8.4: VALUE OF COMPOSITE INDEX CONSTRUCTED VIA ARITHMETIC AND GEOMETRIC
MEAN ............................................................................................................................. 209 TABLE 8.5: CORRELATION MATRIX – BANGLADESH AHDI AND ITS COMPONENTS........... 213 TABLE 8.6: CORRELATION MATRIX – TANZANIA AHDI AND ITS COMPONENTS ................ 213 TABLE 8.7: CORRELATION COEFFICIENTS – BANGLADESH................................................. 218 TABLE 8.8: CORRELATION COEFFICIENTS – TANZANIA ...................................................... 219 TABLE 8.9: POTENTIAL ENVIRONMENTAL INDICATORS ...................................................... 225 TABLE 9.1: CORRELATION COEFFICIENTS BETWEEN THE DEVELOPMENT INDEX AND
OPENNESS ...................................................................................................................... 238 TABLE 9.2: UNIT ROOT TEST RESULTS – AUGMENTED DICKEY FULLER TEST ................... 240 TABLE 9.3: UNIT ROOT TEST RESULTS – ELLIOTT-ROTHENBERG-STOCK TEST.................. 241 TABLE 9.4: SUMMARY OF UNIT ROOT TEST RESULTS .......................................................... 242 TABLE 9.5: COINTEGRATION TEST RESULTS........................................................................ 243 TABLE 9.6: GRANGER CAUSALITY TEST RESULTS............................................................... 246
1
1 Introduction
1.1 Research objective
The overall objective of this research is to provide an empirical study into the impact of
globalisation on two of the world’s poorest countries.
This introductory chapter briefly presents what is understood about the most recent
period of globalisation and the various impacts it is purported to have on developing
countries. The knowledge gap in the existing literature is outlined, along with how the
current research will make a contribution to shedding more light on the area where the
gap occurs. Research objectives are established and a structure provided for the
remainder of the thesis.
1.2 Globalisation
During the past two decades a plethora of literature has emerged on the subject of
globalisation. Within this literature there is a lack of consensus as to what globalisation
is, about when the most recent period of globalisation commenced and how it differs
from other periods in economic history, and what its effects have been. In general, most
definitions of globalisation make reference to international flows, whether that is of
capital, goods and services, knowledge or people. A second common theme is that of
time and space compression, whereby as a consequence of technology and other
developments, communication and exchange are able to occur much more rapidly.
2
Globalisation is a multifaceted phenomenon encompassing not only economics but also
other fields of study including politics and sociology. The economic components of
globalisation include trade, investment, production, finance, competition and demand.
The main focus of this thesis is trade and investment, although what is observed within
these two areas is strongly influenced by the other economic areas. For example, trade in
components has been influenced by the production trend of a breakdown in value chains,
while larger investment flows have been facilitated by new financial instruments.
As has been mentioned, there is a lack of consensus as to when the most recent period of
globalisation commenced. There are some perspectives that globalisation commenced
more than 200 years ago, such as Lindert and Williamson (2001), while an alternative
view points to the growth in trade and investment flow after recovery from the Second
World War (Scholte 1996). Much of the literature however points to globalisation as a
much more recent phenomenon, or at least acknowledges that the last one to two decades
have presented some different or unique characteristics to other periods within economic
history, albeit periods that have displayed strong growth in trade and integration within
the international economy. There is a similar lack of consensus about what the defining
factors of the most recent period have been, although some of the recurring themes point
to the changing dynamics of players within the international economy, the extent of
technology, the nature of flows and exchanges and the intensification of competition
(Hay & Marsh 2000b).

3
One of the main areas of focus of the globalisation literature has been the impact on
developing countries. This is also an area where there are alternate perspectives and no
clear consensus as to what the impact has been. From this literature three key themes
emerge about developing countries: firstly, that globalisation has largely by-passed
developing countries; secondly, that globalisation has had detrimental consequences for
developing countries; and thirdly, that globalisation has been a positive experience for
developing countries.
The first theme to emerge is that developing countries have largely been by-passed by the
processes of globalisation. The main arguments within this theme relate to the
unsuitability of developing countries to deal with the processes of globalisation due to
institutional and structural problems inherent within these countries. More specifically,
developing countries are largely unable to produce what is being demanded within the
international economy, some developing countries are disadvantaged by their
geographical location, and the resources and infrastructure within developing countries
mean that these countries are not able to adapt to production trends associated with
globalisation. While globalisation has brought about higher levels of trade and
investment, many developing countries have not seen much change in their volumes of
trade and investment, and at times, there has even been declines experienced, as trade and
investment are redirected to countries that are more able to participate in the international
economy that has emerged (UNCTAD 2002a).

4
The second theme is that developing countries have been disadvantaged through
globalisation. One of the most common arguments within this theme is that as a
consequence of the increased specialisation that has come about with globalisation, many
developing countries have a more narrow export focus, which is centred on what are
essentially unattractive products (see for example, Porter 1990). More specifically
exports from developing countries are largely commodities which have demonstrated
declines in terms of trade and high levels of volatility, and have low growth prospects, as
such products are not demanded within the international economy that has emerged
(UNCTAD 2002b). Other key arguments within this theme pertain to the detrimental
consequences that have been experienced when developing countries have participated in
globalisation, which include deterioration in labour and environmental standards,
environmental degradation and application of unsuitable technologies (see for example,
Baker, Epstein & Pollin 1998; Chussodovsky 1997; Cole 2000; Crotty, Epstein & Kelly
1998; Goldmsith, E. 1996; Hamilton & Clements 1999; Khor 1996; Nayyar 2001;
Obstfeld 1998).
The third theme, that globalisation has been beneficial for developing countries, is
strongly aligned with the general benefits of trade, such as providing access to capital,
technology, managerial practices and production techniques, and bringing previously
unemployed labour into production (see for example, Gundlach & Nunnenkamp 1998).
Time and space compression has facilitated more rapid access than may otherwise have
been evidenced. One of the main arguments in support of this theme is that the trends
associated with globalisation, for example, the break down of value chains, have afforded
5
developing countries opportunities that would have otherwise not have presented. Such
opportunities include participating in international trade, thereby earning export income
and raising national income, attracting foreign direct investment (FDI) and developing
manufacturing sectors, which is recognised as a key step along the path to development
(Arndt 1999).
To a large extent, there is alignment between economic theory and the globalisation
literature as it pertains to developing countries. Much of the arguments that globalisation
has been beneficial for developing countries find their origins in classical and neo-
classical theory. The arguments that globalisation has had negative implications for
developing countries have a high level of alignment with the likes of Prebisch (1950) and
Singer (1950) and the economists that built upon their initial doctrine. Advocates of the
perspective that globalisation has been detrimental for developing countries explore the
differences between the current international economy and the international economy that
existed when traditional economic theories that espoused the benefits of trade were
proposed. The perspective that developing countries have been by-passed by
globalisation acknowledges the benefits of trade recognised by classical and neoclassical
economists, but claims that these benefits have not been extended to developing countries
(see for example, Hirst & Thompson 1996; Hoogvelt 1997).
1.3 Statement of significance
Despite the plethora of literature on the subject of globalisation, and more specifically,
globalisation and developing countries, there is an absence of comprehensive studies that
6
have attempted to classify and categorise the experience of any individual developing
country, in order to understand whether the experience has been positive or negative. To
a large extent the literature is general or focuses on specific issues, for example,
exploring the potential environmental implications globalisation has had on a specific
developing country, and therefore, does not explore the totality of effects of globalisation.
Additionally, much of the literature is qualitative in nature, thereby, exploring the
implications but not combining the effects into a single measure of impact. Finally, much
of the literature that has emerged on the subject is largely conjectural, without clear
empirical evidence to support the statements made.
In summary, a clear gap in the current literature exists in providing a comprehensive
study of individual countries in order to understand if these have been by-passed by the
processes of globalisation, and if not, whether the net effect on these countries has been
positive or negative.
1.4 Research overview
1.4.1 The countries which will be studied
The countries selected for this research are designated as Least Developed Countries
(LDCs) by the United Nations Conference on Trade and Development. The rationale for
selecting these countries is that they are amongst the world’s poorest and most
disadvantaged. Ultimately, it is of most interest how these countries and their population
7
has been impacted by globalisation, as opposed to some of the more advanced developing
countries, which are on the verge of being classified as developed or newly industrialised.
This research will focus on two countries, and in doing so, compare and contrast the
experience of each country. The majority of the world’s LDCs are located in either Africa
or Asia, and therefore a country from each region will be considered. By researching
countries in different regions, regional developments and considerations can be
encompassed within the analysis. For example, there is evidence that suggests that
African countries have faired worse than their Asian counterparts within the globalisation
period, largely, because Asian countries have been able to exploit regional linkages
(UNCTAD 2003). The two countries that will be explored are Bangladesh in Asia and
Tanzania in Africa.
1.4.2 How impact will be assessed
How globalisation has impacted developing countries could be assessed a number of
ways, for example, impact on growth, income or sectoral composition. The current
research is concerned with how the lives of the populations of the countries that will be
studied have been be impacted. The way to measure impact on the lives of populations is
generally via development (UNDP 1990). One of the presently most accepted measures
of development is the United Nations Development Programme’s (UNDP) Human
Development Index (HDI). As part of this research, a variation of the HDI will be created
which is aligned to the nature and objectives of the research, specifically, ascertaining the
impact of globalisation on the two subject countries.

8
1.5 Research objectives
The overall aim of this research is to provide a comparative study of the impact of
globalisation on the development of two of the world’s Least Developed Countries, in
order to assess whether the effects have been beneficial, detrimental or neutral in each
country, or whether these countries have largely been by-passed by the processes of
globalisation. A secondary objective is to compare and contrast the experience of these
two countries to better understand how country specific factors have come into play. In
order to achieve the overall aim, the following objectives will be pursued:
(i) Selection of a measure of development that is responsive to changes in the short
term and reflective of the current issues facing developing economies;
(ii) Selection of a measure of openness that is reflective of participation in the
international economy;
(iii) Selection of a time period which is representative of the current period of
globalisation;
(iv) Analysis of movement in both the measure of openness and the measure of
development over the globalisation period, and in the period preceding the
globalisation period, in order to ascertain differences between the two time
periods;
(v) Analysis of the relationship between the measures of development and openness
during the globalisation period, and in the period preceding the globalisation
period, in order to ascertain differences between the two time periods;
9
(vi) Consideration of factors that have influenced the development of each of the
subject countries during the globalisation period;
(vii) Consideration of factors that have influenced the openness of each of the subject
countries during the globalisation period;
(viii) Comparison of the findings for each economy in order to understand and
potentially explain similarities and dissimilarities.
1.6 Structure of this thesis
In the following chapter, Chapter 2, a review of the literature on globalisation is provided,
initially focussing on what globalisation is, what the enablers and drivers have been, and
how the current globalisation period differs from other periods in economic history. The
chapter then goes on to explore what the most recent period of globalisation has meant
for developing countries, and the main arguments that have emerged in each of the three
areas discussed previously - positive impact, negative impact and no or limited impact, as
a consequence of being by-passed.
Chapter 3 reviews classical and neo-classical trade theory and considers its relevance to
what has been observed within the most recent period of globalisation. Given that two
main economic components of globalisation have been identified as trade and investment,
Chapter 3 also reviews the literature on investment theory, focussing on the emergence of
multinational enterprises (MNEs).

10
Chapter 4 presents the economic theories that have emerged over the past six decades that
focus on the implications of trade for developing countries. The alignment of these
theories with the arguments presented in relation to globalisation and developing
countries is considered. The rationale for only presenting trade within this chapter is that
there is extensive literature on trade and developing countries, whereas investment theory
has focussed largely on explaining the investment flows between developed countries.
Chapter 5 presents a review of the literature on measuring development. This is an
important context for determining how development will be measured for the current
research. The chapter considers how measuring development has moved away from
considering purely income toward more encompassing measurements before reviewing
the literature on the HDI, a widely accepted measurement of development.
With the previous chapters having set the scene for understanding globalisation, how
economic theory relates to what has been observed within the most recent period of
globalisation and how development has previously been measured, Chapter 6 presents the
research methodology in detail. The purpose of Chapter 6 is to outline how this research
will contribute to the body of knowledge on globalisation and developing countries. Each
research component is discussed in detail, including the measurement of openness. A
considerable part of the chapter involves describing how the measure of development will
be produced, the decisions that need to be made and factors taken into consideration.
11
Chapter 7 introduces the two countries that are the subject of the research. It briefly looks
at LDCs as a group and differences in the African and Asian regions, before embarking
on detailed analysis of Bangladesh and Tanzania. A brief review of the recent economic
history for the period preceding globalisation is provided for both countries, before
examining how each country changed throughout the globalisation period. The focus of
the analysis in this chapter is understanding how output and production changed, and also
how the external sector changed, specifically in terms of export volume and value, the
goods and services exported and imported by each country during the globalisation
period, and the countries traded with. Investment is also considered. The experience of
each country is compared and contrasted.
Chapter 8 presents the creation of a modified development index based on the HDI, but
taking into account the nature and objectives of the current research, and criticisms of the
HDI and suggestions for improvement. The modified index is calculated for Bangladesh
and Tanzania for a forty year period, and then analysed.
In Chapter 9, the modified development index is analysed with the measure of openness
utilising widely accepted economic analytical approaches, culminating in testing for
Granger causality between openness and development to ascertain if openness does
precede development.
Chapter 10 presents what has been learned about the impact of globalisation on two of the
world’s poorest developing countries, in light of the original research objectives set. The

12
contribution that has been made to the body of knowledge on the subject is explained,
research limitations and areas for future study are provided.
13
2 Globalisation
2.1 Introduction
The purpose of this chapter is to shed light on what is meant by the term globalisation,
and explore what has occurred within the international economy. Significant literature
has been produced on the topic over the past two decades. There are a large number of
diverse perspectives pertaining to what globalisation is, what has caused it and what has
resulted from it. This chapter seeks to bring together these perspectives and ideas to
succinctly analyse the most recent period of international economic activity. The chapter
commences with a review of definitions and components of globalisation. Enablers and
drivers are then analysed and discussed, and the key players and roles are presented. To
provide some context, enablers are factors that have made globalisation possible, while
drivers are factors that have lead or pushed the occurrence of globalised activity. What
has been observed within the international economy is next discussed, and this is
contrasted with what has occurred in earlier periods of economic history, both the period
prior to the most recent period of globalisation, and then to a time in history which is
highlighted as one of heightened international economic activities. The second half of the
chapter discusses what recent occurrences have meant for the developing world, and
more specifically, the most underdeveloped countries.
14
2.2 Definitions and components of globalisation
The term globalisation is used to describe a recent period in international economic
activity, commencing from the late 1980s. Notably, there is no firm consensus of when
the period of globalisation started, and when or whether it has ended, however, the period
indicated relates to when many of the writings on the subject globalisation emerged, and
the period generally discussed or referenced in these writings.
There are a significant number of definitions of globalisation and concepts of what it
entails, so much so, that Hirst and Thompson (1996) assert that there is no one accepted
model of the globalised economy and how it differs from the past. Similarly, Bairoch and
Kozul-Wright (1996, pp.2-3) assert “most contemporary observers have differed in their
description of the globalisation process, and have failed to construct a consistent
theoretical explanation of what is driving it and where it might be going”.
As a start to explaining the phenomena of globalisation, most definitions make reference
to openness, integration or flows. Openness pertains to individual countries participating
in, or being willing to participate in, international economic activity. Integration refers to
combining or amalgamating elements across countries, which predominantly occurs
through cross-border activity and international division of production (Gundlach &
Nunnenkamp 1994). Flows as they pertain to globalisation encapsulates the movement of
goods and services through trade, financial transaction through investment and foreign
exchange markets and the sharing of ideas, intellectual property and technology. While
the focus of this thesis and analysis is on the economic aspects, globalisation is
15
multidisciplinary and also spans the areas of politics, sociology and anthropology (Inda &
Rosaldo 2002; Mittelman 1996).
In relation to what has been observed within the more recent period of international
economic activity, Hay and Marsh (2000) assert that there has been a gradual evolution
toward globalisation rather than a quantum leap at any particular point in time, while
Hirst and Thompson (1996) note that what has emerged is not a truly global economy,
but rather a high level of interaction between individual players within the international
economy.
The economic components of globalisation pertain to production, trade, investment,
finance, competition and demand. All of these factors have exhibited increased
international integration over the past two decades. What has specifically been observed
in relation to these factors will be explored in later sections of this chapter.
2.3 Enablers and drivers of globalisation 2.3.1 Enablers of globalisation
As referred to in the introduction of this chapter, enablers are factors that have changed
within the international economy to allow an increased level of integration or greater
flows between countries. Some of these factors have represented reductions in barriers to
international activities that have previously existed. Broadly, the factors that have enabled
globalisation encompass technology and innovation, improvements in transportation and
16
communication, political developments, reduced protectionism, trends towards
deregulation, and developments in financial markets. These factors are explored in further
detail below.
New technologies have been introduced, which have increased the ease of relocating
production facilities and have enabled buyers to understand and source products globally
(Dunning, Van Hoesel & Narula 1998). Improvements in transportation and
communication have reduced perceptions of time and distance (Hoogvelt 1997; Sassen
1996). More specifically, transportation innovations have lowered the cost of transporting
and reduced the time it takes to move products, while developments in communication
have resulted in improvements to consumer markets, for example, through providing an
understanding of alternative offerings, and have facilitated knowledge sharing (Naisbitt
1994).
Two key political developments have enabled globalisation – ideological shifts and
growth in international institutions. The end of the cold war and the demise of
communism has increased the strength of capitalism and free market forces within the
international economy, which has in turn facilitated the spread of private sector activity
(Oman 1994; Pieper & Taylor 1998). Simultaneously, multilateral institutions, such as
the World Bank, International Monetary Fund (IMF) and World Trade Organisation
(WTO), have strengthened in influence, and alliances between countries such as Group of
7 (G7) have emerged. Such developments have contributed to a higher level of
integration within the international economy.
17
In the period preceding globalisation, trends of deregulation were evidenced across many
economies, encompassing liberalisation of trade, foreign investment and financial
markets. Barriers to trade, in particular tariffs, progressively fell during the first four
decades following the Second World War under the auspices of the General Agreement
of Trade and Tariffs (GATT), thereby encouraging trade between countries. Additionally,
countries entered into regional trading bloc arrangements in order to facilitate and
promote trade. Within the 1990s, protection levels within developed countries increased
by way of non-tariff barriers, especially through contingent protection measures such as
anti-dumping duties (ADD), countervailing duties (CVD) and safeguard measures, which
are discussed further later in this chapter. Technologies and new instruments in financial
markets, along with liberalisation of foreign investment and financial markets have
increased cross border financial flows.
2.3.2 Drivers of globalisation
Globalisation has predominantly been driven by economic factors, and more specifically
the profit motivations of corporate entities, and these entities seeking to achieve
competitive advantages. Firms have globalised by fragmenting their production processes
across national frontiers, in order to reduce costs, and have sought to attract customers
from multiple markets in order to maximise revenues. Profit motivations have also
influenced foreign investment decisions and decisions to globally outsource and enter
into strategic alliances with foreign entities. Trends evidenced in production, such as high
sunk costs, rates of technological obsolescence and changing product life cycles, have
18
necessitated corporate entities seeking lower production costs and multiple markets for
products.
2.4 Roles within the globalised economy
With the deregulation that has enabled globalisation, market forces are increasingly
driving international economic activity. MNEs, firms that own and control operations in
more than one country, have emerged as the dominant players within the globalised
economy. Such entities largely control trade and investment, and their contribution to
global economic activity tends to receive as much, if not more, recognition as that of
nations (Naisbitt 1994; Porter 1990). Supranational organisations, international banks and
financial intermediaries have also increased in significance within the global economy
(Nayyar 2003; Pieper & Taylor 1998; Scholte 1996).
Much has been written about the changing role of government within the globalised
economy. Some critics have referred to the diminishing role of government (for example,
Chang 1998; Nayyar 2003), while others have pointed to changed roles for governments
to fulfil (for example, Cantwell 1989; Porter 1990). With trends toward deregulation,
governments have less of a regulatory role to play in economic activity. Similarly, with
privatisation of activity, governments less directly participate in economic activity. With
the proportion of economic activity which has moved from a national to an international
level, individual governments have a diminished ability to control or influence economic
activity (Rodrik 1997). There has been some convergence in government policies
globally, under the auspices of multilateral institutions. This has contributed towards the
19
trends of privatisation and deregulation, and the growth of more market oriented
economies. The increasing volume of funds circulating has lessened the ability of central
banks to manage exchange rates. Governments have used monetary and fiscal policies
less to control and influence economic activity, recognising that these policies potentially
impact the competitiveness of domestic industry in an international economy. These
policies have also influenced investment decisions of MNEs, which has further
constrained governments in the policies they have been able to implement. The
effectiveness of monetary policy has also been weakened by the volume of funds
circulating within the international economy (Oman 1996).
Despite the trends noted in relation to the changing role of national governments, there
are clear, albeit less direct, functions for national governments to perform within the
international economy that have emerged in the most recent period of globalisation. Such
roles pertain to enabling private sector activities to be successful through the promotion
of trade, innovation and industrial development. National governments also have a role to
target and foster select industries (Cantwell 1989; Porter 1990). Gwynne (1996) notes
that targeting lay at the heart of the successful East Asian development model. Further,
national governments have a role to enable access to the most competitive goods and
services globally, in order to assist domestic entities in becoming internationally
competitive (Ohmae 1994). Finally, national governments have a role in the attraction of
FDI through setting appropriate domestic economic policy and the provision of
infrastructure.

20
2.5 What has occurred in the international economy
Much of the literature on the most recent period of globalisation discusses what has been
observed or what has occurred within the international economy. There are many and
diverse occurrences. Efforts to describe these have contributed, firstly, to the vast
literature on globalisation and, secondly, to the lack of consensus surrounding what
globalisation means and how the most recent period of globalisation is distinct from other
periods in history. What has occurred from an economic perspective can be broadly
categorised into the areas of overarching effects, national economy impacts, consumer
trends, market trends, production and trade. As referenced earlier in this chapter, there are
also non-economic aspects such as social and political observations, which will be briefly
discussed for completeness.
Overarching effects are those that span and influence a number of the other areas
identified. To provide some context, the overarching effects are largely reflected in the
enablers and drivers that have been previously discussed, but deserve attention because
these trends have not only enabled or driven globalised activity, but have also remained
an integral part of the activity that has been observed. Specifically, there has been
strengthening of private sector activity, and movement of the focus of economic activity
from nations to the firms that operate within nations. Distance has become less relevant
due to developments in transportation and communication. Transaction costs have fallen
and at the same time transaction volumes have increased.

21
There have been a larger number of flows between countries that have participated in the
most recent period of globalisation, which has resulted in greater integration between
these countries. Hoogvelt (2001) refers to this as ‘thickening of the core’. Notably, not all
countries have been able to equally participate in globalisation, specifically some groups
of developing countries have not participated, or at least their participation has been
substantially less than that of other countries. What has resulted from this unequal spread
of activity is greater differences between the countries which have achieved a higher level
of integration and those that have been largely by-passed the processes of integration.
These differences are evidenced in aspects such as income, development and
technological advancement. James (2002) likens participation in globalisation to
Myrdal’s cumulative causation, in terms of setting of a spiralling effect of benefits,
whereas not participating sets off a spiral effect of detrimental impacts. It is a matter of
debate as to whether developing countries deliberately choose not to participate or
whether there are factors beyond their control. This is also explored later in the chapter,
however, it is suffice to say that a country’s ability to engage in the process of
globalisation may be limited by a variety of external factors which the country is unable
to influence. There are domestic factors which are controllable and impact the extent to
which a country is able to participate in international economic activity.
A number of trends pertaining to buying are discussed in the globalisation literature. Such
trends pertain to both consumers and businesses that purchase inputs for production and
to fulfil their value chain activities. Buyers are more aware of what is available due to
communication technologies. They are also able to increasingly source products globally,
22
meaning that they are no longer constrained by, or restricted to, what is available
domestically. Time to market has become increasingly important. A further trend has
been differentiation of previously commodity like products, for example, coffee and some
fruits, whereby, purchasers will seek out products from specific regions. In relation to
consumer markets, there has been convergence of markets globally, as a consequence of
improvements in communications and transportation technologies (Salvatore 1998).
The trends outlined have resulted in greater competition in both domestic and
international markets. Domestic firms need to be internationally competitive in order to
continue to exist. Exposure to international competition has seen the removal of
entrenched domestic monopolies. Within the international arena, MNEs have grown and
strengthened. This in part has been the consequence of mergers and acquisitions, and
alliances, such as joint ventures, between competitors and firms that operate within the
same value chains. There has been intensification of competition and concentration of
power, with smaller firms that are less able to compete with MNEs either being
consumed by larger entities, or being forced out of the market by the competition. As a
consequence of these trends, an oligopolistic market structure has emerged in many
industries (Nayyar 2003). Privatisation has meant that governments are no longer directly
participating in economic activity, while deregulation has meant that government
regulation of activity has significantly lessened. Given that MNEs span several countries,
governments are less able to regulate or influence the activities of these entities, outside
their own jurisdiction.
23
A number of production trends have been evidenced in the most recent period of
globalisation. These trends are discussed prior to trade and investment trends, as they
provide the rationale and context for some of the trade and investment trends that have
been observed. What has been observed in relation to production can be broadly
categorised into the areas of production methods and location related trends. Production
method trends are discussed first, as these are influential on the location trends observed.
One of the frequently discussed trends from the most recent period of globalisation is the
fragmentation of production from total goods and services to the production of
components (Krugman 1995), also referred to as the breakdown of value chains.
Specifically, a firm willl analyse the overall production of a good, and then divide this
into discrete activities, which can either be fulfilled within the firm at a single or multiple
locations, or can be outsourced. Outsourcing of functions that are not core competencies
of a firm has become common over the past two decades because, firstly, outsourcing
may create cost savings or achieve quality benefits, and secondly, it allows firms to
concentrate on the activities that they do best and which are core to their business
achieving competitiveness.
A second trend to emerge is that of flexible production, a concept predicated on achieving
competitive advantage through delivery of customised goods within relatively short time
periods (Oman 1994). Flexible production represents movement away from the mass
production techniques evidenced in earlier decades, which were characterised by
undifferentiated products produced from production lines and significant time to market.

24
It is characterised by economies of scale and scope, high start up costs, high levels of
technological obsolescence and shorter production life cycles. Such characteristics
generally cause higher fixed costs and are therefore aligned to presence in multiple
markets and the attraction of large number of buyers over which to diffuse these fixed
costs. The extent of technology and capital used in production has increased, and, as a
consequence, a decreased proportion of production relies on labour. Both economies of
scale and scope remain important in production, and have influenced the size of firms that
exist.
Globalisation has seen firms face a larger number of production location decisions due to
the competitive advantages that can be achieved through optimally locating production
facilities globally. Additionally, fragmentation of production has increased the number of
location decisions that typically need to be made by an enterprise. Production inputs are
increasingly being sought globally as a means to reduce production costs in order to
improve or sustain competitiveness. The breakdown of value chains lends itself to the
division of production activity at a global level, with owners of the overall production
process locating each aspect of the value chain in a location which enables overall
competitive advantage goals to be achieved. Notably, developed countries have tended to
retain activity that adds relatively high amounts of value within production, while low
value-add activity has tended to be moved to developing countries. The impact of this
trend on developing countries is explored further later in this chapter. As a consequence
of the trends outlined, multi-country production networks have emerged (Yusuf &

25
Stiglitz 2001). Production activity within developed countries has tended to be narrow
due to the increased use of imported inputs (Feenstra 1998).
There is debate as to whether the trend toward production location has been global or
regional. Much of the globalisation literature refers to globalised production networks.
However, Oman (1994) suggests that location of production and sourcing of inputs
predominantly occurs regionally, in response to trading blocs that have been created, such
as the European Union, and the need for proximity between production facilities and
markets due to the production methods which have emerged. Those that refer to global
production networks (for example, Dunning 1998; Gundlach & Nunnenkamp 1994) note
that factors other than proximity are important in determining production location.
Trade is one of the most discussed elements of globalisation, because it represents flows
of goods and services. What has occurred in relation to trade can be broadly classified
into the areas of volume and nature of trade, and then general trends, encompassing
comparative advantage and protection. There has been an increase in the amount of goods
and services traded during the most recent period of globalisation. The volume of goods
and services traded more than doubled between 1988 and 2000, increasing from $2,875bn
to $6,364bn (UNCTAD 2004). Further, the volume of trade has been increasing at a
faster rate than the growth in world Gross Domestic Product (GDP) during the last
quarter of a century (The World Bank 2001). An increasing amount of world output is
entering trade, and an increasing volume of merchandise trade is made up of semi-
manufactured and manufactured goods. The trends evidenced in relation to production
26
have positively influenced the volume of trade, with components as well as finished
goods being exchanged. Intrafirm trade now accounts for about one third of trade in
merchandise (UNCTAD 2002c). Trade is also involving more advanced goods and
services, and highly differentiated goods and services, resulting in commodities
representing a lower proportion of overall trade than they have in the past. Trade has
remained dominated by developed countries, although a few newly industrialised
countries have increased their participation in trade over the past two decades. Developed
countries have consistently represented around 70% of the volume of goods and services
that have been traded over the past two decades (UNCTAD 2004).
Comparative advantage has traditionally been the basis by which nations trade. Within
the most recent period of globalisation comparative advantage has moved from being
considered fixed and based on natural resource endowment, to being alterable and
influenced by technological change and foreign investment (James 2002; Ohmae 1994).
In this way, comparative advantage has moved from being considered a static to a
dynamic phenomena. Further, with the diversification in what buyers are demanding,
trade is increasingly occurring between countries with similar factor endowments (Porter
1990), whereas extensions of comparative advantage theory explained trade as being
driven by different factor endowments. With trends such as the fragmentation of
production, and the emergence of large dominant players in the form of MNEs, both
intra-industry and intra-firm trade has been evidenced (Krugman 1995; Nayyar 2003).
Within MNEs, inputs and components move between divisions and parent companies and

27
subsidiaries. Trade in intermediate products now represents approximately half of the
imports into major countries (OECD 1994).
As discussed under enablers of globalisation, protection levels fell in the four decades
following the Second World War. However, more recently, protectionism by developed
countries has increased and taken forms other than traditional tariff barriers. Specifically,
developed countries have implemented standards and other import restrictions, such as
ADD, which have been detrimental to the exports of developing and newly-industrialised
countries. There is also evidence of dumping by developed countries, in response to the
governments of these countries subsidising their own agricultural industries.
Financial flows have been a significant aspect of the most recent period of globalisation.
FDI has been increasing at a faster rate than trade, with net inflows increasing from
$156bn in 1988 to $884bn 2000 (The World Bank 2001). This represents an annual
growth rate of approximately 15.5% while trade grew at only 7% during the same period
(UNCTAD 2004). Both the volume of funds circulating and the number of transactions
have risen, and financial markets have become increasingly integrated. Notably, financial
flows remain predominantly within the triad of Japan, North America and Europe, and
largely not directed toward developing countries (Crotty, Epstein & Kelly 1998).
Investment has also predominantly been directed toward manufacturing activity (Baker,
Epstein & Pollin 1998). New financial instruments and technologies have been influential
in the changes that have been observed. Additionally, there have been growing and
mutually reinforcing links between trade and investment, for example, firms have made

28
capital investments in foreign countries, and then exported the goods that were produced
from these investments (Falconer & Sauve 1996).
The non-economic components of globalisation can broadly be classified into the areas of
migration, politics and society. While there is reference to specific migration activity (for
example, Pellerin 1996) in the globalisation literature, it receives less attention than other
flows. Wolfe (1995) asserts migration is a means by which to participate in other aspects
of globalisation. Migration largely occurred at a time when other resources were less
mobile, and with the mobility of other resources and the flows that have been observed,
migration has diminished in importance within the international economy (Nayyar 2001).
The political aspects of globalisation have already been briefly touched upon in terms of
enablers. There has been strengthening of free-market ideologies and decreasing support
for non-capitalist ideologies. Democracy has also grown and supranational bodies have
emerged. The social aspects of globalisation have largely been enabled through
developments in communication and include increased common global concern, sharing
of opinions and attitudes and cultural awareness (Goodstein 1998; Inda & Rosaldo 2002;
Scholte 1996). Global concern has emerged for issues such as the environment and
human rights. There have been increased interactions between people in different
locations as a consequence of trade, foreign investment and migration.
29
2.6 Differences between the current period and earlier periods in economic history
The most recent period of globalisation is considered unique for a number of reasons.
Although, these have been touched on in earlier sections of this chapter, they are
referenced here to indicate how the recent period differs from others in economic history.
Some of the differentiating factors are the new players that have emerged, the extent of
technology and innovation, the type of trade that is being observed, the complexity of the
goods and services being traded, the mobility of capital and labour and the intensification
of competition.
In contrast to the period preceding the most recent period of globalisation, what has been
observed within the globalisation period is trade growing faster than production and trade
in manufacturing growing faster than overall trade (Gundlach & Nunnenkamp 1994). The
latter trend is reflective of the fragmentation of production. In relation to financial flows,
FDI has grown more rapidly than trade, and integration of capital markets has deepened
rather than widened, reflecting a larger number of flows between a consistently narrow
range of economies (Hoogvelt 1997). As has already been mentioned, the eventuation of
the most recent period of globalisation occurred through gradual evolution rather than a
quantitative leap from the previous period (Hay & Marsh 2000).
There are parallels between the recent period of globalisation and what occurred in the
thirty years preceding the First World War. Some references to the earlier period suggest
a higher level of integration in the earlier period (for example, Hirst & Thompson 1996;

30
Rodrik 1997), while other references suggest a higher level of integration more recently
(for example, Bordo, Eichengreen & Irwin 1999), and other references draw neither
conclusion (for example, Baldwin & Martin 1999; Sachs & Warner 1995; Williams
1996), noting that both periods represent periods of integration within the international
economy. The earlier period commenced around 1880 and was brought to an end by the
First World War and the subsequent Great Depression. The recent period of globalisation
has been dominated by manufacturing, whereas, the earlier period was dominated by
agriculture and minerals (Bhaduri 1998). Similarly, the earlier period was driven by
falling transportation costs, however the more recent period has been driven by falling
transaction costs (James 2002) and communication (Baldwin & Martin 1999). Labour
mobility was significant in the earlier period, in contrast, capital mobility has become
more important in the recent period (Nayyar 2003). In the earlier period, nations and
governments remained the dominant players, whereas in the more recent period,
corporate entities have become the dominant players (Bairoch & Kozul-Wright 1996).
Despite these differences outlined, there is a common element between the two periods of
divergence between the countries that have been participated in the processes of
globalisation, and those that did not (Milanovic 2003).
2.7 Globalisation and developing countries
In this part of the chapter globalisation as it pertains to developing countries is examined.
There is a divergence of perspectives in relation to the impact of globalisation on
developing countries, with three main views being evidenced: that developing countries
have been by-passed by the processes and benefits of globalisation; that developing
31
countries have been disadvantaged by the processes of globalisation, and lastly, that
globalisation has delivered benefits to developing countries. Each of these views is
explored.
Much of the globalisation literature makes reference to the processes of globalisation
being uneven and unequal (for example, Baker, Epstein & Pollin 1998; Kiely 1998b;
Morris, 1996). The globalisation experience has differed between developing and
developed countries, and among developing countries. Furthermore, the experience has
varied within individual countries (CEPAL 2002). There have been regional differences
with respect to developing countries during the most recent period of globalisation.
Generally speaking, developing countries in the African region have not fared as well as
those in the Asian region (Nayyar 2003; UNCTAD 2001). African countries have
actually reduced their participation in the international economy while Asian countries
have increased theirs (Binswanger & Lutz 2003). In terms of exports, Asian countries
have largely diversified into manufactured goods, while African countries have continued
to predominantly export agriculture and other commodities (Borensztein et al. 1994).
Asian countries have had the benefit of the advancement and development of other
countries in the region in earlier decades, specifically Japan and the East Asian Tiger
economies. African countries have had exports dominated by one or two key
commodities, and have thus suffered by this exposure to a narrow range of exports. These
trends are explored further in Chapter 7.
32
Before examining the perspectives on the impact of globalisation on developing
countries, it is pertinent to mention that there is divergence in views as to how factors
associated with globalisation have impacted developing countries. More specifically, a
factor may deliver both beneficial and detrimental effects. For example, fragmentation of
production is said to benefit developing countries by making it easier for them to
participate in international economic activity because they can concentrate on becoming
competent in a smaller element of production (Arndt 1999). However, the same trend is
said to disadvantage developing countries because it is likely that the parts of the value
chain they have a comparative advantage in will contribute to a low proportion of the
overall value and therefore limited export income and may not enable skill attainment
which is a critical aspect of economic development (Chussodovsky 1997).
2.7.1 Globalisation by-passing developing countries
The first of the three areas pertaining to developing countries to be considered is that
globalisation has largely by-passed these countries. Dollar and Kraay (2001) assert that
developing countries which have not participated in globalisation suffered significant
slowdown in their growth. Similarly, Lindert and Williamson (2001) suggest that
globalisation has been a largely positive experience for many countries, however, the
countries which have become worse off are the countries that have not participated.
Further, the inequality previously noted has been proposed to occur because globalisation
has not spread far enough (Johnson 2002), thus inequality and non-participation are
inextricably linked.

33
Developing countries generally do not participate by choice, but because of occurrences
within the international economy, for example, the low demand for the exports of
developing countries, which makes it virtually impossible for such countries to
participate in international economic activity. Other areas where developing countries
largely do not have a choice pertain to where there are standards or requirements for
certain goods or services which developing countries are not able to meet, in attracting
FDI and in the establishment of production facilities by MNEs. Notably, there are
domestic elements that make developing countries less able to participate in global
trends, for example, economic stability and the quality of infrastructure available to
support industry and production. These elements are explored later in this chapter,
however, it is important to note that while such factors are potentially alterable in the
medium to long-term, countries may not always have the capabilities to bring about such
change.
Hoogvelt (1997) adopts the dependency theorist terminology of core and periphery to
describe the pattern of separation and exclusion that has emerged within the most recent
period of globalisation, where core pertains to developed countries and periphery to
developing countries. Specifically, a small number of relatively advanced developing
countries have been able to move from the periphery to the core, such as Taiwan,
Singapore and South Korea. However, the majority of developing countries have
remained in the periphery, especially those located in the African region. Therefore,
trading patterns within the international economy have remained largely unchanged from
the period prior to globalisation. Additionally, trading patterns are largely similar to what
34
they were at the beginning of the Twentieth Century (Bhaduri 1998) for countries that
have remained in the periphery. Hoogvelt (1997) makes reference to there actually being
less interaction between the core and periphery than in the past. For the developing
countries that have moved into the core, improvements in income and growth have been
observed (Hirst & Thompson 1996), however, for developing countries that have not
moved into the core, their relative position within the international economy has
deteriorated as a consequence of the growth of other countries. Notably, the countries that
have moved into the core represent a small proportion of the overall population of the
developing world.
A number of trends that were discussed previously have contributed to developing
countries being unable to participate in the process of globalisation, and the perpetuation
and strengthening of the core and periphery structure within the international economy.
Relevant trends include the growth of MNEs, the increase in protectionism by developing
countries, and the emerging production trends. Oman (1994) notes that because of the
trends associated with globalisation, the division between developed and developing
countries has been more prevalent than in other periods in economic history.
As was noted earlier in this chapter, one of the key trends of the most recent period of
globalisation has been the expansion of MNE activity. The majority of this expansion has
occurred within the developed countries. As a consequence, associated flows of capital
have also been directed toward developed countries. Trade within MNE groups has
consequently also been concentrated between developed countries (Hirst & Thompson
35
1996). Notably, a limited number of more advanced developing countries in the Asian
region have attracted capital flows. It is essentially this group that has moved from the
periphery to core in terms of Hoogvelt’s analysis.
While tariff barriers have gradually been reduced since the Second World War, the most
recent period of globalisation evidenced the emergence of new forms of non-tariff
barriers by developed countries, for example, standards (Oman 1996). Many of the
emerging non-tariff barriers are in the areas of products exported by developing
countries, such as agriculture and other commodities. This problem is further
compounded by developed countries such a the United States and European Union
countries providing agricultural subsidies to their framers to boost agricultural exports,
which then compete with the agricultural exports of developing countries in world
markets. At the same time, developing countries have had to continue to reduce
protection barriers to quality for assistance from international agencies (Chussodovsky
1997). Further, substantial regional trading blocs have emerged, for example, the
Northern American Free Trade Agreement (NAFTA) and the European Union, which
have reduced export opportunities for developing countries that are not part of such blocs.
The production trends outlined earlier in this chapter have hindered developing countries
from participation in international economic activity. Where developing countries have
diversified from primary sector industries into manufacturing, this has typically been into
labour-intensive manufacturing. With increased use of technology and automation in
production globally, there are fewer opportunities for labour-intensive manufacturing
36
(Kiely 1998a). Trends toward lower levels of supply stocks being held and just-in-time
production translate into an increased need for physical proximity between market and
production sources, which means many developing countries, especially those in the
African region, are not able to be involved. To some extent MNEs have looked to
minimise foreign exchange risk by locating production facilities where there are markets
for products (Oman 1994). Given the small size of domestic markets that typically exist
within developing countries, this trend has reduced the production facilities that are
located within most of the developing countries.
The flexible production methods that have typified the most recent period of globalisation
are outside the reach of developing countries for a number of reasons (Hoogvelt 1997;
Oman 1996). Firstly, such production methods require a minimum efficient level of scale
or size. Secondly, flexible production methods are associated with high start up costs due
to the plant and equipment, and knowledge acquisition, required. The rates of
technological obsolescence are high, with equipment needing to be continuously updated
to remain competitive. This technological obsolescence creates costs which are higher
than developing countries are likely to be able to effectively absorb. The infrastructure
and human resource capability requirements for flexible production methods tend to be
higher than what is generally found in developing countries. Finally, flexible production
methods rely heavily on economies of scope, which are more likely to be achieved in
developed countries where significant manufacturing activity already exists.
37
There are a number of domestic factors which influence the extent to which developing
countries are able to participate in international economic activity (Gundlach &
Nunnenkamp 1996). Resource endowment provides the initial basis of what developing
countries are likely to export, and also what will attract FDI to developing countries. The
quality of human and physical capital is important, with the most basic level of
manufacturing requiring a minimal level of workforce education. Domestic infrastructure
such as transportation networks is important. Infrastructure influences how exporting can
be achieved and also has the potential to attract FDI. The capacity for domestic industry
to adapt imported technologies is important since a developing country that does not have
the ability to adapt to imported technologies may be considered unsuitable for certain
investment opportunities. Macroeconomic and political stability are both important for
FDI, as are well functioning domestic markets, supported by appropriate government
policy around aspects such as trade and industry. Finally, as previously noted, the size of
the domestic market is also crucial, with larger domestic markets more likely to attract
FDI.
In addition to the domestic factors outlined, geographical location and regional linkages
have also proven to be important in influencing participation in international economic
activity (Redding & Venables 2004). This is evidenced by the developing countries that
have successfully integrated within the international economy during the most recent
period of globalisation predominantly being from the Asian region, where there has been
industrialisation within the region in earlier decades with Japan and the Asian tiger
economies.

38
2.7.2 Disadvantages of globalisation for developing countries
A second school of thought is that developing countries have not been by-passed by the
most recent period of globalisation, rather that participation in international economic
activity has largely disadvantaged developing countries, putting them in a worse position
than would otherwise have been the case. The problems faced by developing countries
participating in the international economy are due to the high level of concentration
brought about through specialisation, and to the unattractiveness of the industries being
specialised in, for example, agricultural commodities and simple manufacturing.
Globalisation has brought about developing countries participating in international
economic activity according to comparative advantage. The poorest developing countries
tend to export a narrow range of low value-add products, typically dominated by one or
two key exports which exhibit relatively low growth rates within global export markets.
Such countries therefore lack export diversification. This structure is problematic,
because it creates vulnerability and instability in revenue, arising from any external
shocks. Any number of events could put an export at risk, with severe implications for
export earnings. For example, the introduction of a less expensive substitute could
diminish export earnings considerably. Genetic engineering could also pose a threat to a
narrow export structure (Rifkin 1996). Where there is concentration in agriculture, a crop
failure or natural disaster could adversely impact on export earnings for a given time
period.

39
Much of the criticism pertaining to developing countries and globalisation relates to the
industries that developing countries have a comparative advantage in, and therefore the
goods that are exported by these countries when participating in international economic
activity. Porter (1990) asserts developing countries are largely stuck in unattractive
industries with low scope for growth. The industries that developing countries
predominantly specialise in are primary commodities, and simple manufacturing, often
processing these primary products.
The problems inherent with industry and exports dominated by primary commodities did
not emerge during the most recent period of globalisation, with economists such as
Prebisch (1950) and Singer (1950) warning against such structure several decades earlier.
However, the problems highlighted by these economists have continued to exist, and
have potentially even increased in relevance in recent years, with increasing evidence to
support the initial theories proposed. Over the past four decades, there has been evidence
of the sustained decline in terms of trade for commodities, which Prebisch and Singer
predicted. Additionally, commodities have largely exhibited instability and short-term
price fluctuations (UNCTAD 2001). The relevant economic theories and the empirical
evidence which has emerged are considered in detail in Chapter 4.
In recent periods, including the globalisation period, agriculture has exhibited low, and
for some products, negative growth rates (UNCTAD 2002a). There are a number of
factors that have contributed to the observed trends including population growth rates,
income elasticity of demand for agricultural goods, and the emergence of substitute

40
products (Gwynne 1996; Maizels 2003). Due to low population growth rates in developed
countries, the export market size for agriculture is declining. Agricultural commodities
exhibit low income elasticities of demand relative to manufactured goods, and therefore,
as incomes rise in developed countries there is not a proportionate increase in demand for
agricultural commodities. Agriculture also exhibits low price elasticity of demand, so that
movements in price do not have significant impact on demand. At the same time,
agriculture exhibits high price elasticity of supply, so that when multiple countries export
the same commodity, prices fall. In recent times, a growing number of substitutes for
certain agricultural commodities have been introduced, which has increased the
vulnerability of producers of these commodities. Trends of increased protectionism
toward agriculture and other commodities and the emergence of product differentiation
for agricultural commodities, previously discussed, add to the issues that make
specialising in agriculture problematic for developing countries.
In terms of manufacturing, the trend of breakdown of value chains has provided
opportunities for developing countries to participate in manufacturing, albeit at the lower
end of the value chain where a smaller amount of value is typically added relative to the
total value of the good or service being produced (Krugman 1995). The problems
associated with this kind of participation is that developing countries are not developing
the skills necessary for advancement and export income is minimal, reflective of the
relative value the output of developing countries brings to the overall production process
(Chussodovsky 1997).
41
The growth of FDI and global expansion of MNE activity have been referenced as some
of the key aspects of globalisation. FDI and MNE activity in developing countries is
suggested to disadvantage developing countries in a number of ways. Because MNE
activity is driven by profit motivations of shareholders, their presence in developing
countries potentially leads to surplus extraction with limited benefit to the developing
countries (Chang 1998; Goldsmith, J. 1996). As developing countries compete to attract
FDI, a so-called race to the bottom can emerge, as a consequence of developing countries
lowering and compromising standards to attract FDI (Nayyar 2001; Obstfeld 1998).
Standards that have the potential to be eroded include labour, health and environmental
standards (Crotty, Epstein & Kelly 1998). Another problem associated with FDI and
MNE activity is that governments either provide concessions, thereby reducing income,
or spend to meet the infrastructure requests of MNEs, diverting spending away from
development areas such as health and education. Technologies introduced by MNEs have
displaced local technologies, and the technologies introduced are potentially less aligned
with the resources and skills that exist within developing countries. Finally, the FDI that
is directed toward developing countries may not go toward sectors that are conducive to
economic development, for example, investment may be made in agriculture and mining
(Baker, Epstein & Pollin 1998).
A number of environmental issues have been associated with globalisation and activity
within developing countries. Specialisation has caused excessive use of non-renewable
resources (Goldsmith, E. 1996; Hamilton & Clements 1999). Ecological problems
highlighted throughout the literature include soil erosion and land degradation due to
42
over-farming, and destruction of marine life due to over-fishing of rivers and oceans
(Cole 2000; Daly 1996; Khor 1996). Pollution has been caused by emergence of industry,
and inadequate sanitation to cope with rural-urban migration. Health problems have also
increased as a consequence of rural-urban migration (HWGNRD 1996; Larkin 1998).
There have also been adverse social and cultural impacts of developing countries
participating in globalisation, such as loss of natural cultures and the introduction of
alternative values such as materialism (Scholte 1996).
2.7.3 Advantages of globalisation for developing countries
Despite the exclusion and disadvantages outlined previously, globalisation is proposed to
have had a number of benefits on developing countries. Dollar and Kraay (2001) assert
that where developing countries have been able to participate in globalisation, they have
experienced higher growth rates than developed countries. Some of the benefits of
globalisation to developing countries are based on arguments put forward by free-trade
advocates in earlier periods, while others are driven by the specific trends evidenced
during the more recent period of globalisation.
Globalisation has increased the FDI and MNE activity for some developing countries
(Gundlach & Nunnenkamp 1998), has provided the dynamic benefits outlined by
Harberler (1988), such as access to capital, technology and managerial practices and
production techniques. It also afforded the opportunity for some developing countries to
increase manufacturing outputs, which form part of the critical path towards
development. More generally FDI and MNE activity have brought unemployed or
43
unemployed resources into production and stimulated domestic demand through imports.
A further benefit is that greater exposure to the competitiveness of international markets
should have improved the efficiency and the quality of outputs of domestic industry
within developing countries.
The breakdown of value chains is considered to provide benefits to developing countries
through giving these countries opportunities to get involved in manufacturing activity that
might otherwise not exist (Gundlach & Nunnenkamp 1998). It is more manageable for a
developing country to attain competency in part of a value chain or a component rather
than an overall good. Further, value chain breakdown allows specialisation based on
inherent resource endowment and skills, and therefore is more efficient for developing
countries (Arndt 1999).
As has been discussed, communication and transportation have been important aspects of
globalisation. Developing countries have benefited through these areas, with growing
awareness of the problems faced by the populations of developing countries and
increasing activity to address these problems (Johnson 2002). The result has been
improvements in the lives of people within developing countries evidenced by lower
child mortality rates and higher life expectancy. Some of the specific areas that have been
addressed include access to clean water and food supplies, and provision of medical
treatment including vaccinations.

44
2.8 Conclusion
This chapter has provided an overview of the most recent period of globalisation. It has
presented a view that globalisation is a complex and multifaceted phenomena, that has
been enabled and driven by a number of occurrences within the international economy.
While there is no firm consensus of when the period commenced, much of the literature
analysing the changes observed emerged during the 1990s. There has also been a gradual
evolution of change rather than a distinct cut-over at a given point in time. While the
recent period of globalisation has some commonalities with earlier periods in economic
history, there are also some differentiating factors, specifically, the key players that have
become dominant and the technological changes that have occurred. The main economic
components of globalisation pertain to trade, investment and production. The chapter also
presented three alternative views as to the impact of this period of globalisation on
developing countries, demonstrating the diversity in views in this area. The three views
are that developing countries have been by-passed by globalisation, that developing
countries have been disadvantaged by globalisation and thirdly, that globalisation has
benefited developing countries, largely by the opportunities it has provided. In reality, it
is likely that across individual developing countries different aspects of globalisation
have been observed, with the net result that globalisation has had varying consequences
for different groups of developing countries. Individual country factors are likely to
influence what the experience of globalisation has been, with factors such as geographical
location, domestic economic conditions and infrastructure levels being influential. The
next two chapters considers the relevant economic theory, and how this theory is related
to what has been observed.
45
3 Trade and investment theory
3.1 Introduction
In the previous chapter, the concept of globalisation was examined and more specifically
the most recent period of globalisation, what has influenced this period and how it is
different to other periods in economic history. As has been discussed, the main economic
components of globalisation are trade and investment. The first part of this chapter
reviews classical and neoclassical trade theory to examine its relevance to the current
international economy and more specifically to developing countries. In the second part
of this chapter investment theory is considered, focussing on how the growth in direct
investment over the past four decades has been explained, the role of MNEs, the
relationship between trade and investment, and what investment has meant for
developing countries.
3.2 Trade
3.2.1 Classical and Neo-classical trade theory
One of the earliest references to economists articulating the benefits of trade is that of
Adam Smith, who proposed the theory of absolute advantage in 1776. Specifically, Smith
stated:
“between whatever places foreign trade is carried on, they all of them derive two
distinct benefits from it. It carried out the surplus part of the produce of their land
and labour for which there is no demand among them, and brings back in return

46
for it something else for which there is a demand…… By means of it, the
narrowness of the home market does not hinder the division of labour ….By
opening a more extensive market for whatever part of the produce of their labour
may exceed the home consumption, it encourages them to improve its productive
powers and to augment its annual produce to the utmost, and thereby to increase
the real revenue of wealth and society.” (Smith, 1939 p.446-47)
In summary, the benefits of trade that Smith alluded to are firstly the exchange of surplus
good for something of value, and secondly, being able to obtain goods and services that
are unable to be produced within the domestic economy. The specific benefits of trade
identified by Smith continue to be primarily why nations trade today. Trade is used as a
vent for surplus production that would otherwise be wasted in the domestic economy in
the absence of trade. Additionally, trade widens the market for goods and services and
enables resources to specialise in what they are most efficient at producing.
The theory presented by Smith is referred to as absolute advantage, because it makes
reference to absolute, rather than relative or comparative values. In 1817, David Ricardo,
expanded on the initial theory of Smith to propose that nations could benefit from trade
on the basis of relative efficiency. Specifically, a nation should concentrate production on
what it can produce relatively efficiently and trade the outputs for other goods that are
produced more efficiently by other nations. Ricardo’s theory became known as the theory
of comparative advantage, and it remains one of the most important theories of
economics ever presented.

47
An explanation of comparative advantage is provided by Thirlwall (1999 p.425) :
“Consider the case of two countries, A and B, both with the capacity to produce
commodities X and Y. The simple proposition of classical trade theory is that if
country A has a comparative advantage in the production of commodity X, and
country B has a comparative advantage in the production of commodity Y, it will
be mutually profitable for country A to specialise in the production of X and for
country B to specialise in the production of Y, and for the surpluses of X and Y in
excess of domestic needs to be freely traded, provided that the international rate
of exchange between the two commodities lies between the domestic rates of
exchange.”
Comparative advantage predicts benefits will arise to countries through trade, as a
consequence of each country producing what it is relatively more efficient at and
exchanging this output with other countries. The theory of comparative advantage is
based on a number of assumptions including constant returns to scale, zero transport
costs, factor immobility, full employment of resources, undifferentiated products, perfect
competition and a single factor of production. Such assumptions are important as they
have lead to criticism of the theory both generally and as the theory relates to the present
international economy. Notably, the single factor of production assumption was relaxed
by neoclassical economists, such as Heckscher (1919) and Ohlin (1933), who explained
comparative advantage in terms of the factor endowments of countries.

48
Comparative advantage proposes that a higher total level of output can be achieved by
countries specializing in what they do relatively best. This output translates into increased
consumption. It is significant to note that the theory says nothing about the distribution of
the gains from trade between the countries which participate in trade. Traditional trade
theory did not claim to equalise income, but rather that total income would become
higher through the process of trade (Elkan 1995).
The theory of comparative advantage was originally explained, and continues to be
explained, with a simple two country, two commodity model. What the theory of
comparative advantage predicts will happen to the consumption of the traded goods in
each country within this model is dependent on the international rate of exchange. At
some rates of exchange, it is possible that the consumption of one of the commodities in
one of the countries is less after trade than before trade takes place. Even should the
scenario described occur, the post-trade position is considered more beneficial than the
pre-trade position, if those individuals who have gained through trade can fully
compensate those who have become worse off, and there is still a surplus held by those
who have gained. However, the actual compensation does not need to be fulfilled for the
theory of comparative advantage to be upheld. It is in this arena that the theory is often
misunderstood or criticised, specifically around the unequal trade relationships that may
arise between developed and underdeveloped countries. Harberler, a strong advocate for
the theory of comparative advantage, asserts that trade will benefit every country not that
trade will remove international inequality (Harberler 1959).
49
Neoclassical economists developed further theories based on comparative advantage.
Their main contribution was to explain the occurrence of comparative advantage through
resource endowments or factor proportions. Specifically, in order to achieve gains from
trade, a country should specialise in, and therefore export, goods and services for which
the country has an abundance of the factors that are required inputs. Two of the most
cited economists in relation to this are Heckscher (1919) and Ohlin (1933), referred to
earlier. For developing countries this recommendation has the potential to lead these
countries toward unattractive industries. Most underdeveloped countries have resource
endowments in the areas of land and unskilled labour, and therefore should, according to
neoclassical economists, produce agricultural commodities and simple manufactured
goods. Such industries exhibit more significant fluctuations in prices and there is
considerable discussion of the secular deterioration of terms of trade of agriculture.
Further, the production of primary commodities and similar manufactured goods are not
conducive with economic development. These issues are more fully explored in the next
chapter.
Paul Samuelson (1948; 1949) made an important, albeit controversial, contribution to
neo-classical trade theory by suggesting that free trade could lead to factor-price
equalisation across countries. Specifically, Samuelson predicted free trade would both
reduce the disparities between the prices of a factor of production between countries, but
more significantly reduce the price differences between different factors of production.
Samuelson’s theory suggested equalisation of factor prices is achievable, however,
Samuelson acknowledged that market imperfections and conditions, for example,
50
transportation costs, prevent factor price equalisation from being achieved. The more
likely situation that would result, should the factor price equalisation theorem uphold, is
that differences in factor prices fall as a consequence of trade. Because of factor-price
equalisation, neoclassical economists promoted free trade as a means to bring about
reduction in income differences between countries.
3.2.2 Additional benefits of trade
While the theory of comparative advantage remains one of the most upheld theories of
economics, there are alternative benefits of trade which have been identified by
economists over time. Myint (1955) makes reference to Adam Smith, rather than Ricardo,
in identifying the benefits of trade and the ideas that international trade overcomes
narrowness of the home market and also improves the division of labour and raises
productivity levels.
Comparative advantage and the benefits of trade identified by Adam Smith are referred to
as being static gains from trade. There are three key areas of static gains from trade which
are firstly, a nation being able to obtain what it cannot produce domestically, secondly, a
nation being able to alter its production pattern to produce what it can at relatively low
cost and trade the output for products that it can only produce at a relatively high cost,
and thirdly, the provision of a channel by which a nation can exchange surplus production
which is not required for domestic consumption (Viner 1953).

51
In comparison to the static gains from trade identified by classical economists, other
economists have identified dynamic or ongoing benefits of trade. Such benefits arise from
widening production possibilities frontiers. Participation in international trade provides
access to a range of factors that enhance production including capital, technology,
machinery, tools and equipment, technical knowledge, know-how, skills, managerial
talent and entrepreneurship (Harberler 1961). Many of these factors are highly relevant to
developing countries that would not have access to them in the absence of trade. Further,
participation in international trade reduces market imperfections, for example,
monopolies in domestic markets, through increasing competition. Harberler also ties the
volume of foreign trade to the volume of foreign capital that can be expected. In relation
to capital and direct investments, Boeke (1953) suggests that underdeveloped countries
have become richer because of the knowledge sharing, leadership and co-operation from
developed countries. Boeke also makes reference to developed countries providing
developing countries with infrastructure and the means to exploit resources at a time
when the resources are demanded in the international economy, noting that the time may
not be as opportune if developing countries need to wait until such time as they are in a
position to export independently of any assistance from developed countries.
3.2.3 Criticisms of traditional trade theory
The theory of comparative advantage attracted much support through classical
economists such as Mill (1848) and Marshall (1890) and the neoclassical economists
previously referred to, however, the theory attracted considerable criticism also. Criticism
of classical trade theory is not a recent phenomenon – the theory of comparative

52
advantage has been criticised since first being proposed (Harberler 1959). Some of the
earlier economists that were critical of classical trade theory were List (1966),
Schumpeter (1911; 1952), Young (1928) and Williams (1929). The strongest early
criticisms of the theory of comparative advantage pertain to the theory being static in
nature and the underlying assumptions being unrealistic. In reality the international
economy is dynamic and constantly changing, however, the theory of comparative
advantage looks at resource allocation and trade at a specific point in time, and does not
encapsulate the dynamic and ever-changing nature of the international economy. The
criticism of the theory as being static has been made by several economists including
Baldwin (1955), Myint (1955), Nurske (1961) and Chenery (1968).
Some of the specific assumptions of the theory of comparative advantage that have
attracted criticism for being unrealistic include equal production functions, absence of
economies of scale, full employment of all resources, balanced trade, no capital flows and
perfect competition. Williams (1929) challenged the assumption of fixed elements which
in Williams’ view were highly important to the effects and causes of international trade.
Williams also questioned the assumption of immobility of factors of production, asserting
that the movement of factors of production is at least equal to that of trade. Myint (1955)
also discussed the assumption of factor immobility, while Baldwin (1955) questioned the
assumptions of constant supply of resources and purely competitive domestic markets,
noting such assumptions would not hold in the long-run. Myrdal (1956) was critical of
the assumptions of resource immobility and implicit factor price equalisation and
challenged the assumption of stable equilibrium stating that it has “no correspondence in
53
reality” and that “society does not naturally behave as a pendulum.” Hicks (1959)
questioned the assumption that all factors of production in different countries were
identical, noting that both labour quality and capital quality could vary greatly between
countries.
Singer (1975) was critical of the theory of comparative advantage because it assumed a
tendency to improve terms of trade for primary products against manufactured products
through assuming the existence of a long-run equilibrium state. Singer further noted the
theory implicitly assumed the absence of technical progress by the assumption of a
stationery state. Chenery (1975) considered classical and neoclassical trade theory
overemphasised the benefits of trade without considering the effects such as uncertain
export prices and the need to move resources in response to changing market conditions.
While specialisation creates economic efficiencies, there are issues and potential costs
associated with specialising in one or two main industries, as identified by Lewis (1955).
Firstly, a country that specialises is likely to suffer if the demand for the services being
specialised in diminishes. This point is of importance to developing countries. For
various reasons, including specialising in a product for which a synthetic substitute
emerges, or one that is also produced by developed countries and may be subject to
pricing actions, such as dumping, by these countries. For agriculture there are supply side
issues, for example, crop failure, which would have similar implications. Secondly, if
trade breaks down, for example, due to war, specialisation may mean that countries
cannot access required supplies. A third issue relates to lack of balance, for example,

54
biological imbalances in agriculture due to excessive cropping and associated problems
of soil exhaustion or erosion. Finally, specialisation may lead to the formation of special
interest groups of certain industry within a country, for example mining or fishing, which
generate different opinions and perspectives to those from another country that specialise
in the production of other goods or services. International co-operation becomes more
difficult as a consequence of such special interest groups.
Schultz (1961) raised further concerns about locking underdeveloped countries into the
unattractive industries, specifically the production of raw materials where the demand for
the good is rising at a rate less than that of income growth of developed countries.
Similarly, Linder (1967) made reference to the dilemma faced by underdeveloped
countries, that the goods which they produce efficiently are not demanded by developed
countries, and goods typically demanded by advanced countries tend not to be produced
by developing countries’ domestic markets. A contributing factor to developing countries
not producing what is demanded is the functioning of markets within these countries.
More specifically, in agriculture-producing developing countries, which is what the
majority of the poorer developing countries are, output is typically based on subsistence
farming, which both limits the scope of the market to send appropriate signals and for
producers to respond to such signals.
The neoclassical trade theories which built on the theory of comparative advantage have
also attracted criticism with Samuelson’s Factor Price Equalisation theorem potentially
being the most contentious. Economists that have been critical of this theory include

55
Myrdal (1957), Hicks (1959) and Hirschman (1977). Hicks questioned the underlying
assumptions which in Hick’s view were unrealistic. The criticism of both Myrdal and
Hirchman pertained to the theory not representing what was being observed in the real
world, specifically the growing income disparity between underdeveloped and developed
countries.
3.2.4 Relevance of traditional trade theory to the current international economy
The current international economy is vastly different to the international economy that
existed when the theory of comparative advantage was first published early in the
Nineteenth Century. At that time, commodities dominated trade between nations. In the
current international economy, commodities represent a diminishing share of world trade
with advanced and intermediate goods being increasingly traded. Much of what is
observed in the current international economy cannot be explained by comparative
advantage, for example, dominance of MNEs, intra-industry trade, the break down of
value chains and international sourcing of inputs, the significance of FDI and capital
flows which substantially exceed trade flows (Skarstein 1997).
The criticism of comparative advantage as being static, premised on countries’ fixed
resource endowments have previously been discussed. Within the current international
economy, comparative advantage is increasingly shifting, and is influenced by a range of
factors, for example, targeting of industry by governments and MNEs (Porter 1990). As
stated by Ohmae (1994), wealth is now created in the marketplace rather than in the soil.

56
Porter (1990) asserted that within the present international economy a development
strategy based on basic factor advantages, as was predicted by neo-classical economists,
is no longer sustainable and such a strategy may actually limit the potential standard of
living for a nation. Porter further suggested that a nation without abundant natural factors
has an advantage in economic development as it avoids the temptation of relying too
much on natural advantages. The Japanese economy is an example of an economy that
has succeeded without reliance on natural advantages since the end of the Second World
War.
It is pertinent to consider the relevance of the assumptions of the theory of comparative
advantage to the current international economy. Some of the assumptions which fail to
hold pertain to constant returns to scale, absence of technological change, full
employment of resources, a single factor of production, undifferentiated products, perfect
competition and factor immobility outside of a nation. Returns to scale are rarely constant
and the achievement of increasing returns is a significant reason why countries participate
in international trade. Activities can also be subject to diminishing returns, which is often
the case with the primary sector activities that dominate production in the least developed
countries. Where an economic activity is subject to diminishing returns, further
employment opportunities may be limited. Comparative advantage ignores technological
change, however, technological change in the current international economy is rapid with
technology being a key driver of globalisation through enabling increases in the speed in
which information, goods and payments can be exchanged. Full employment rarely exists
either in developing or developed countries. Due to the rate of technological change in
57
recent decades, resources have been displaced from employment and need to retrain or
reskill for new employment opportunities, thereby resulting in temporary unemployment.
The theory of comparative advantage assumed that labour was the only factor of
production. In reality there are a number of factors of production, and in the current
international economy, labour has a diminishing role due to technology and automation
of production in many industries. Capital has become a critical factor in production.
Notably, neo-classical trade theory did not assume a single factor of production, and
capital was included as a factor of production. Comparative advantage was premised on
immobility of factors of production, and within the current international economy, this is
far from the case with capital moving rapidly around the globe. Labour is also not
immobile and migration patterns over the past two centuries provide evidence of labour
relocating in pursuit of better employment opportunities.
Neoclassical trade theory predicted that trade would occur as a consequence of
differences in factor endowments. What has increasingly been observed within the
second half of the Twentieth Century are countries with similar exports trading with each
other. Linder (1961) explained this by focussing on the demand side rather than the
supply side, as classical and neoclassical theory had. Specifically Linder suggested that
countries with similar patterns of demand traded with each other, as a consequence of
their manufacturing sectors already producing goods that were demanded in other
countries.
58
When trade was based on commodities, as was the case when the theory of comparative
advantage was first presented, products were largely undifferentiated. In the current
international economy, trade increasingly involves advanced manufactured goods and
intermediate goods and services, which can and are likely to be differentiated from
competitive offerings. The theory of comparative advantage assumes perfect competition.
In the present international economy competition is far from being perfect. Much of the
globalisation literature references MNEs as the dominant players in the present
international economy. Such organisations have significant influence on trade patterns
and on nations, which are keen to attract or retain operations of MNEs due to the
perceived benefits they bring to an economy, such as technology, employment,
knowledge and skills. MNE activity is explored in more detail later in this chapter.
Additionally, nations are increasingly participating in trading blocs to gain power and
influence in trade negotiations, and some individual nations carry more weight than
others in establishing and changing international trade regulations through the WTO.
3.2.5 Relevance of trade theory to developing countries
Two of the predominant contemporary issues surrounding comparative advantage and
developing countries pertain to the distribution of gains from trade and that specialising
according to comparative advantage potentially pushes developing countries into
unattractive industries. More specifically, developing countries tend to possess
comparative advantages in commodities and low-skilled labour, which are being used in
lower proportions in production. This was discussed in the previous chapter.
59
The theory of comparative advantage has been criticised because what the theory
proposes developing countries should specialise in to gain in accordance with
comparative advantage may not be conducive to long term development for such
economies. In this light comparative advantage is relatively focussed on short-term
efficiency rather than what the longer term implications of such efficiency gains may be
(Thirlwall 2003). This observation is an extension of the criticism that the theory is static
in nature. In the case of the current international economy, least developed countries
generally have an abundance of unskilled labour and land. Forcing, or encouraging,
developing countries to specialise based on these factors of production may not be
beneficial for these countries in the long-run. Specifically, over-working productive land
can create soil-erosion and make the land less productive in the future, while bringing
marginal land into production may not produce the same crop yields as land that is more
arable. Similarly, building up industry that relies on unskilled labour does not provide
opportunities for labour to attain skills, thereby constraining more advanced industry
from emerging in these economies. More generally, primary production generally has
limited backward and forward linkages.
There is general consensus among economists that gains from specialisation, in
accordance with the theory of comparative advantage, exist. A main area of concern is
the distribution of the gains that arise, specifically the gains from trade are more likely to
be unequally distributed in favour of developed countries. Such arguments are extensions
of those originally proposed by Prebisch (1950) and Singer (1950) which are explored in
the following chapter. It is suggested that changes in the actions and trading policies of
60
developed countries could result in a greater share of the benefits of trade going to
developing countries (Thirlwall 2003).
Factor-price equalisation has not occurred and there is evidence that income differences
between countries have grown (The World Bank 2002). Hence, Samuelson’s neo-
classical Factor Price Equalisation theorem has not been proved. Linder (1967) asserted
neoclassical trade theory is likely to be inapplicable to the world’s poorest countries
because the theory assumes that changing relative prices leads to reallocation of factors of
production, which in reality does not occur in least developed countries. This is perhaps
more a reflection of market imperfections in these areas, or a significant oversupply of
certain factors of production.
3.2.6 Support for Classical and Neo-classical trade theory
In spite of the criticisms outlined, there has been continued support for the theory of
comparative advantage, and the additional benefits that trade creates for countries. Two
example of such support arise from Lewis (1955) and Harberler (1959), both of which
came at a time when a large number of new theories were being developed to shed light
on the uneven development processes which had been observed over the past century.
Lewis (1955) noted that trade stimulates growth in many ways, one of which is
specialisation. The benefits of trade, identified by Lewis, include the introduction of new
goods to a community, thereby stimulating the desire to work to obtain these goods.
Lewis discussed that in some societies work effort is limited due to limited wants and
61
therefore creating desire for new goods may stimulate work and productivity. He further
suggested that trade generated new ideas, specifically in relation to consumption patterns,
techniques and social relationships. The final benefit of trade alluded to by Lewis relates
to specialisation, and in this area Lewis makes reference to the benefits that Adam Smith
originally identified from specialisation.
According to Harberler (1959), international trade had made a large contribution to the
development of underdeveloped countries in the 19th and Twentieth centuries. Harberler
believed participation in international trade had benefits for every country and that trade
had contributed significantly to the productive capacity of underdeveloped countries.
Harberler acknowledged that the theory of comparative advantage had attracted criticism
but indicated that it remained important for understanding the international economy.
Further, trade brought about a number of dynamic benefits including providing the means
for economic development through capital goods and raw materials and facilitating the
transfer and dissemination of knowledge, ideas, know-how, skills, managerial talent and
entrepreneurship. Trade also provides a vehicle to move capital from developed to
underdeveloped areas and it promotes competition and discourages monopolistic
behaviour.
3.3 Investment
As was discussed in Chapter 2, one of the aspects of globalisation has been strong growth
in direct investment or FDI. This type of investment emerged following the Second
World War (Aliber 1970). Prior to this, the majority of investment undertaken was

62
portfolio based. This new type of investment was distinct in that investors had control of
assets, whereas with portfolio investment there was not a direct level of involvement
(Casson 1990). To provide some context around growth, FDI inflows have increased
from $9 billion in 1970 to $884 billion in 1999 (The World Bank 2001). Hand in hand
with the growth of FDI has been the growth of MNEs, the vehicle by which FDI is
carried out. With regard to MNE activity, foreign affiliates now represent approximately
one third of world exports. It is notable in the context of the current research, FDI is
largely a developed country phenomenon with approximately 68 per cent of FDI stock
located within developed countries. Only 0.5 per cent of FDI stock is located in Least
Developed Countries (UNCTAD 2002c). The reasons for this are explored later in this
chapter.
The emergence of FDI and MNE activity is not explained by trade theory. The
assumptions on which trade theory is based and their applicability to the current
international economy have been discussed earlier in this chapter. More specifically,
good and factor markets are not perfect, as assumed by trade theory, and in the absence of
perfect markets, free trade is replaced by second best factors such as MNEs internalising
market functions (Rugman 1980). The growth of oligopolistic market structures, which
typify MNEs, is further evidence of market imperfections (Knickerbocker 1973). Trade
theory also assumes immobile factors of production, however, factors of production are
mobile and movement of factors of production is a substitute for trade in final products
(Markusen 1983; Vernon 1974). FDI pertains to movement of capital, and MNE activity
63
also gives rise to movement of other factors of production, such as managerial
experience.
A number of theories have been put forward to explain growth in both FDI and MNEs.
These broadly fall into the areas of theories that assume perfect markets, those based on
imperfect competition which encompasses internalisation of market functions, theories
which examine oligopolistic market structures, models which take into account multiple
factors, life cycle models and theories based on other factors. The emergence of multiple
theories is explained by Caves (1971) as due to there being different types of FDI and
reasons why MNEs undertake foreign investment. It is notable that there is some overlap
between theories, with one area is overlap relating to firms being motivated by profit.
3.3.1 Theories of FDI
Perfect competition theories
The first group of theories to be examined assume perfect competition. As has been
mentioned, one of the reasons proposed for MNE growth has been market imperfections,
therefore, theories based on perfect competition have generally failed when tested
empirically. There are three main theories within this group, which pertain to differential
rates of return, portfolio diversification and market size.
The theory of differential rates of return proposes that capital will flow from countries
with a low rate of return to countries with a high rate of return, to eventually equalise the
rate of returns between all countries. One of the main issues associated with the theory is

64
its failure to explain cross movements in investment flows between countries, such as US
investment in Europe and European and Japanese investment in the US (Buckley &
Casson 1976; Kindleberger 1969; Moosa 2002). The theory assumes no risk, uncertainty
or barriers to movement, which has been criticised for being unrealistic (Hymer 1976).
The theory also fails to explain why it is MNEs that undertake investment, when capital
flows purely based on rates of return could be made by financial companies or
shareholders. That firms are making these decisions would suggest some link to the
activities of the firm. Agarwal (1980) noted the theory of differential returns assumes
profit maximisation on investment, which may not necessarily be the objective of
investors, for example, a firm may look to maximise profit across all of its entities.
The portfolio diversification hypothesis built upon differential rates of return but also
encompassed risk, such that investment decisions are based on rate of return and risk. The
origins of this theory are associated with Tobin (1958) and Markowitz (1959). In
applying the theory to the international economy, it also fails to explain why MNEs are
the greatest contributors to FDI, and why FDI is preferred over portfolio investment.
Additionally, it does not account for the differences in investments observed across
industries (Agarwal 1980).
A third theory group that assumes perfect competition encompasses output and market
size. Output hypothesis assumes a positive relationship between FDI and a firm’s sales,
while market hypothesis assumes a positive relationship between FDI and the size of the
market, usually measured by Gross National Product (GNP) or GDP of a country. While
65
there is some empirical support for the positive correlation of these factors, the
association is questionable (Agarwal 1980).
Imperfect competition theories
In recognition that markets are not perfect, and theories that assumed perfect markets
failed to adequately explain the activity being observed around FDI and MNEs, a number
of theories emerged based on imperfect competition. This group of theories commenced
with the work of Hymer (1976), whose main contribution was recognition that a firm
investing in a foreign country must have advantages that would overcome the
disadvantages of operating in a foreign country. There are a number of forms of
advantage that a firm may possess including access to capital, management, technology,
marketing, raw materials, economies of scale or bargaining or political power. Hymer
explained profit as the main motivator of foreign investment, which MNEs sought to
achieve through advantage exploitation. Hymer saw motivation for vertical integration as
ensuring supply and protection against input price movement. Empirical research
undertaken by Hymer supported his theory, and identified that American foreign
operations were concentrated in a few industries with a comparatively small number of
firms. Also, within the industries in which these foreign operations occur, there are also
foreign entities investing in the United States.
Kindleberger, who was Hymer’s doctoral research supervisor, extended the work of
Hymer. Kindleberger (1969) proposed that advantages possessed by firms may be the
result of imperfect competition in either goods or factor markets, or economies of scale.
Kindleberger also introduced the concept of defensive investment, which pertains to

66
earning a less than optimal return abroad, but where the difference between the gross
return and the loss that would have resulted from not participating in a market provides
an acceptable rate of return on a marginal basis.
While a number of the other theories proposed to explain FDI and MNE activity have
stemmed from the work of Hymer-Kindleberger, their theories have attracted some
criticism. Aliber (1970) asserts they are more theories of firm growth applied to the
international economy rather than theories of foreign investment. Buckley and Casson
(1976) assert that Hymer-Kindleberger theories take the advantages of the firm as given
and ignore the costs of acquisition, and therefore do not fully explain the growth of firm-
specific advantages in the post-war period.
A sub-group of theories that emerged based on imperfect markets focussed on
internalisation of market functions as a response to imperfections in market functions.
Internalisation theory was initially proposed by Coase (1937) not within the context of
the international economy, but in order to explain why firms were created and function in
general. Coase suggested the main reason why firms were established was because there
were cost advantages over utilising markets or the price mechanism, and that in forming
an organisation and allowing some authority to direct resources, certain marketing costs
were saved. Internalisation on an international scale results in MNE activity and FDI.
Buckley and Casson (1976) acknowledge their work as an extension of the work of Coase
and application of it to the international economy. They assert it is the difficulty in
67
organising markets in certain intermediate markets which has changed business
organisation and lead to the growth of MNEs. Firms internalise markets for intermediate
products such as human capital, knowledge, marketing and management expertise, in
order to avoid the imperfections of external markets. Buckley and Casson studied MNEs
and noted that multinationality tend to be greater the larger the firm, and MNEs are
concentrated in industries that are characterised by high concentration and high research
and skill intensity. Further, most MNEs are diversified horizontally and large MNEs are
vertically diversified, although few are conglomerately diversified.
McManus (1972) undertook analysis to explain both why FDI occurred and why it
existed in only some industries, which resulted in the development of a theory of the
internal firm. McManus noted that there must be organisational advantages in operating
as a firm, in comparison to operating individually. These advantages are likely to relate to
cost or efficiency. McManus undertook empirical research on FDI in Canada, which
supported his theory. Hennart (1982) followed the approach of McManus, and proposed
that for FDI to take place, exchanges must be more efficiently organised within firms
than across markets. Hennart noted that transaction costs, information costs and
bargaining costs are reduced within a MNE in comparison to open markets.
Caves (1982) attributed the level of MNE activity in an industry to the importance of
intangibles in that industry, specifically R&D, advertising, marketing and distribution.
Caves asserted that the MNE is explained as a multiplant firm that spreads across national
boundaries and a transactional approach explains why decentralised plants fall under
68
common ownership. A single ownership structure enables attainment of lower costs or
higher revenues. Caves proposed that vertical integration occurs in order to internalise the
market for an intermediate product, just as horizontal integration internalises the market
for intangible assets. Diversified investments are utilisation of a parent’s R&D activities.
Markusen (1984) suggested that MNEs deliver increased technical efficiency by
eliminating the duplication of joint input that would occur with independent firms. One
example of a function which would be duplicated across firms is R&D. Markusen noted
that production facilities may need to be geographically dispersed, but functions such as
marketing and R&D are able to be centralised. Rugman (1980) integrated internalisation
with other theories of FDI in order to produce what he termed as a general theory of
internalisation. Rugman suggested that while the existence of market imperfections is the
reason for formation of an internal market, it is the firm specific advantages that enable
the market structure to be maintained.
Theories have been proposed which focus on MNEs operating in oligopolistic market
structures. Knickerbocker (1973) developed what has come to be known as the
oligopolistic reactions hypothesis, which states that if one firm in an oligopolistic market
structure engages in FDI, its competitors will undertake a similar action in order to
maintain market share. Knickerbocker noted that product pioneering firms compete in
foreign markets to protect the advantages they acquired within home markets and seek to
optimise corporate-wide returns from their core capabilities rather than returns from
individual foreign operations. Knickerbocker studied United States MNEs in the post
Second World War period and found that industrial concentration caused oligopolistic

69
reaction amongst MNEs except at very high levels of concentration, where there may be
collusion. The main criticism of Knickerbocker’s theory is that it does not explain what
the initial cause of FDI is (Buckley & Casson 1976).
Lall and Streeten (1977) also contributed to the theory on oligopolistic market structures,
noting that in such a structure, no firm can ignore the actions of its rivals. Lall and
Streeten explored the sources of oligopolistic advantages, which include access to
cheaper sources of capital, exchange rates, management capability, process technology,
product differentiation technology, market capability encompassing market research,
advertising and promotion and distribution, access to raw materials, economies of scale,
and bargaining and political power. They noted that these advantages have a cumulative
and dynamic effect, and are more important the more the monopolistic a market structure
is. The decisive factors are marketing and technology, and marketing superiority is a
more fundamental precondition for expansion than technological superiority, however the
other factors add to and reinforce these factors. Flowers (1976) suggested that the
industrial concentration of industries may explain the strength and timing of up to half of
all FDI. Further, FDI tends to occur in clusters, in response to the actions of a first firm
investing and reactive FDI generally occurs within three years of the initial investment.
Dunnings OLI Theory
Dunning (1973) introduced a theory which is referred to as OLI or eclectic theory, with
OLI referring to ownership, location and internalisation. This theory combined earlier
theories of FDI that focussed on market imperfections, industrial organisation,
70
industrialisation and location, in order to explain why demand is met by foreign
production and why investment is chosen as a means of business expansion. Dunning
noted that industrial organisation explained why firms could successfully compete,
however, it was the locational determinants that explained why FDI is utilised as the
means to service foreign markets. Dunning identified three conditions for FDI to occur,
firstly, a comparative advantage due to ownership of intangible assets, secondly, a benefit
to the firm to use advantages directly, and thirdly, a benefit to the firm to use the
advantages with factor inputs located in the country that investment occurs within. The
OLI model is more of a framework for analysing determinants of international production
rather than a predictive theory of multinational activity. Dunning noted that FDI is both a
means of exploiting ownership advantages and of growing these advantages, for example,
using strategic alliances to capture technological or marketing synergies offered by firms
in other countries.
Dunning later extended the initial OLI model to apply it to explain the changing
international position of countries as they passed through different stages of development
(Dunning 2001). The resultant theory, Investment Development Path (IDP), stated that as
a country develops, the OLI advantages faced by the foreign owned firms that invest in
the country, and the firms within the country that invest overseas, change. The IDP
application of the OLI model provided a dynamic element to the model, which was a
response to earlier criticisms that the OLI model was static. Rugman (1982) noted that
there is no substantial difference between Dunning’s eclectic theory and internalisation
theory, once an assumption is made that market imperfections are exogenous.
71
Casson (1990) produced a theory of FDI that bought together other theories and referred
to this theory as an integrated theory of FDI. In developing his theory, Casson noted the
theory of FDI is a ‘logical intersection’ of the theory of international capital trade, the
theory of the international firm and the theory of international trade. Casson asserted the
integration of the theory of international capital markets with the theory of theory of trade
is less problematic than integrating the theory of the firm with the theory of trade. One of
the main areas of difficulty in integration is that the theory of the firm assumes imperfect
markets, whereas the theory of trade assumes efficient markets.
Product Life Cycle
Vernon (1966) proposed products go through life cycles that create opportunities for both
exporting and FDI. The model developed by Vernon became known as Product Life
Cycle (PLC) and focussed on the timing of innovation. The main purpose of Vernon’s
model was to explain United States foreign investment abroad in the post Second World
War period. There are three phases in the model. In the first phase production occurs
within the home country, predominantly due to demand being largely domestic and a
need for greater control, monitoring over, and coordination, between activities. In the
second phase, the product is more mature and exporting from the home country to other
countries may occur. FDI may also be used to meet demand in countries other than the
home country. The third phase pertains to product standardisation and within this phase,
foreign production may be established as a means of achieving cost advantages over
competitors. This phase may also involve production techniques which are no longer

72
proprietary to the innovating firm. Hirch (1976) generalised Vernon’s model to relax the
rigid sequential phases.
There is some empirical support for the PLC theory, and it is aligned to the foreign
expansion of US manufacturing enterprises during the 1950s and 1960s (Knickerbocker
1973), however, more recent trends in FDI have outdated it (Vernon 1979). Petrochilos
(1989) noted that the model applies well to manufacturing. PLC has been criticised for
simplifying the decision-making firms go through and does not account for the increasing
proportion of FDI which is not export-substituting (Buckley & Casson 1976). The theory
also does not explain ownership and fails to consider the determinants of FDI (Hennart
1982). It has also been suggested that the theory is only relevant to innovative industries
(Solomon 1978).
Magee (1977) developed a technology cycle that paralleled Vernon’s PLC. The stages of
Magee’s cycle are invention, innovation and standardisation. The first stage occurs before
the product is commercially observable while the next stage is equivalent to the Vernon’s
first two stages. The third stages of the two cycles are largely equivalent. Magee’s theory
recognised that new information is created in the early stages of a new product and less as
the product matures. There is considerable variation across products and processes in the
extent to which a private firm can appropriate returns from investments in information.
Magee also developed a theory of appropriability, which he acknowledged to be an
extension of the work of Hymer. This proposed that MNEs are specialists in the
production of information which is more efficient to transmit through firms than markets,

73
and therefore is a theory of internalisation. Magee asserted that appropriability is more
significant early in the life cycle of a product and appropriability costs are lower in an
oligopolistic market structure.
Other theories of FDI
There are other theories of FDI that do not fall into the areas discussed previously. One
such theory, proposed by Barlow and Wender (1955), suggests that FDI will occur as a
consequence of reinvestment of profits. Specifically, a MNE will make a limited initial
investment in a foreign subsidiary, and then will invest a proportion of the profits
generated by the subsidiary back into it. While there is some empirical support for the
theory, the empirical evidence is mixed (Agarwal 1980).
Cyert and March (1963) developed a model that suggested the process of decision
making in a firm is consistent with behavioural theory of the firm. They concluded that
the firm has multiple, changing and aspiration-level goals and that within firms, problems
in different decision areas tend to be solved independently and decisions are based on
previous learnings and experience and may be altered based on feedback. Drawing on the
work of Cyert and March, Aharoni (1966) proposed that there must be an initiating force
for foreign investment to occur, which may come from either within or external to the
firm. Within the firm, there may be strong interest by one or more executives, or
underutilised resources. An example of a catalyst outside the firm would be proposal
from a foreign government. A notable aspect of Aharoni’s work is that goals by different

74
decision-makers may be conflicting and not be about profit-maximisation. Agarwal
(1980) noted that the work of Aharoni does not lead to a testable hypothesis.
Aliber (1970) explained FDI by currency differences, and that firms from countries with
strong currencies would undertake FDI in countries with weak currencies. Agarwal
(1980) cautioned that exchange rates are only one factor influencing FDI decisions, and it
is likely that exchange rates influence when an investment is made rather than the actual
decision of whether to invest. Buckley and Casson (1976) noted that currency differences
do not explain the post-war expansion of MNEs, capital flows within currency areas or
cross-investment between currency areas. Hennart (1982) also recognised that Aliber’s
theory did not explain the continued growth of both American and British investment in
spite of weakness in their currencies.
In addition to the theories that have been outlined, a number of general factors have been
proposed to influence FDI, including political and country risk, tariffs and taxation and
government policies and incentives. Moosa (2002) noted these factors are secondary
factors, and will influence where a MNE choose to make investments, rather than
influencing the decision by a MNE to utilise FDI as a means of expansion.
3.3.2 Decisions about investment or trade
Now that the main theories on FDI have been reviewed, it is pertinent to consider the
relationship between trade and investment, and how firms make decisions about one vis-

75
a-vis the other. The importance of intrafirm trade has already been noted. A proportion of
trade is driven by the location decisions made by MNEs.
Hymer (1976) noted that the industries in which international operations occur are those
in which trade was or is important. Further, patterns of international operations will be
determined by patterns of trade. Where countries do not trade, international operations
are unlikely to eventuate. International operations may be established to replace exports
or produce imports. Kindleberger (1969) proposed that investment will be used rather
than trade, when there is no excess capacity within production facilities in the home
country. Consideration was also given to the lower production costs that may be incurred
through foreign production. Further Kindleberger made reference to trade barriers as an
important factor in the decision to trade or undertake foreign investment. Both
Knickerbocker (1973) and Lall and Streeten (1977) also noted the importance of cost and
discussed avoidance of barriers to trade. Horst (1972) and Caves (1982) also highlighted
avoidance of barriers to trade. Hirch (1976) elaborated on cost, suggesting that the
decision to invest or export will be made in favour of exporting where the market is a
high cost country, and in favour of investing when the market is a low cost country. He
commented that this was consistent with US investment patterns. Hirch further noted that
investment would be more prevalent in industries where capital was important.
Other reasons for foreign production rather than trade noted by Knickerbocker (1973)
include management of the exploitation of special capabilities, achieving closer contact
between the producer and seller, adaptation to foreign taste or local technical

76
requirements, or the existence of an important customer that has established a foreign
presence. If any of these factors are important to a firm, it is likely to consider foreign
production as an alternative to trade. Lall and Streeten (1977) also noted the importance
of government policies, the prominence of marketing in the industry operating and
anticipated oligopolistic reaction. Marketing encompasses product differentiation, model
changes, advertising and retailing, and where these factors are important there is more
impetus to establish foreign operations. Horst (1972) noted the importance of the size of
the firm in the investment decision and suggested that larger firms were more likely to
undertake FDI, specifically, due to their ability to spread fixed costs, to manage risks and
access to finance. The size of the foreign market is also an important consideration. There
may also be strategic motivations that come into play in the decision between investment
and trade such as pre-empting competitors or trying to increase market power (Jovanovic
2001).
Dunning (1973) used his OLI paradigm to explain the trade and investment decision,
asserting that firms may service foreign markets from their home country due to the
location advantages of the home market, whereas investment is the means by which firms
draw on the locational advantages of foreign countries. Life cycle models explain the
decision to trade or invest being influenced by where a product is at in its life cycle.
Preference for direct investment over licensing
When a firm decides there is benefit from participating in a foreign market rather than
servicing the market through trade, it still has a decision of operating directly or entering
77
the market utilising into a licensing agreement with another firm. In general, the lower
the domestic competition, the more attractive the market, the newer the technology being
utilised and the larger and more internationally involved the company making the
decision, the more direct investment will be favoured over licensing. Licensing may be
used when a host government establishes barriers to foreign operation.
3.3.3 FDI in developed and developing countries
As has been discussed, the majority of FDI flows occur between advanced countries. One
of the main reasons for inward FDI flows to developing countries is due to cheap labour,
which is a locational advantage. Agarwal (1980) noted that ownership advantages tend to
be more important than locational advantages for FDI, and therefore, attraction to cheap
labour should not be overemphasised as a reason for FDI.
FDI is strongest among comparable, mainly highly developed countries (Jovanovic
2001). The industries which receive the largest proportion of FDI are those that utilise
advanced technology and skilled human resources, which are more aligned with
developed rather than developing countries. Other reasons why MNEs locate in
developed countries are the size and growth prospects of the markets, access to
technology and communication, resource availability and local suppliers. Empirical
research indicates there are certain factors that dispose countries to attract MNEs,
including short cultural distances to host countries, strong innovative performance, large
market size and availability of raw materials (Caves 1982). Other than the last factor,
most of these factors are not strongly present in developing countries.

78
3.4 Conclusion
This chapter considered the relevance of classical and neoclassical trade theory to the
most recent period of globalisation. The theory of comparative advantage remains one of
the most upheld tenets of economics and certainly the most accepted one pertaining to
trade. It has attracted considerable criticism because of its static perspective and due to
the assumptions on which it is based. Criticisms have arisen since the theory was first
proposed, and there have been specific criticisms pertaining to the present international
economy and the implications of the theory for developing countries. In addition to the
benefits of trade proposed by the theory of comparative advantage, other more dynamic
benefits of trade arise, specifically relating to the expansion of production possibilities,
increased competition and access to elements that can improve production but were not
previously available. By and large, classical and neo-classical trade theory promote that
trade has clear and obvious benefits for all countries, including developing countries.
Traditional trade theory does not explain a key phenomenon of globalisation, the
importance of FDI and MNE activity. This chapter reviewed the various theories that
have been put forward to explain the growth in activity observed since the end of the
Second World War. There are a number of theories, the majority of which focus on
market imperfections and the profit motivations of firms. The reasons why firms
undertake foreign investment rather than trade were also considered, and again profit
motivations are important with much of the literature focussing on the attainment of cost
benefits and the avoidance of barriers to trade, which add cost to production. Finally, it
was discussed how FDI flows have largely occurred in developed countries, and the
79
reasons for this, which largely relate to underdeveloped countries, in particular least
developed countries like Bangladesh and Tanzania, being under equipped to deal with the
technological and resource skill requirements of MNEs.
Within the next chapter, theories pertaining to disparities that have arisen within the
international economy between developed and underdeveloped countries are examined.
These theories largely attribute the unevenness of development to trade.

80
4 Theory pertaining to trade and developing countries
4.1 Introduction
The previous chapter discussed trade and investment theory, encompassing the theory of
comparative advantage which is perhaps the most prominent trade theory and one that has
been upheld for the past two centuries. The relevance of comparative advantage is that it
predicts the benefits that arise to countries through participation in trade. From the middle
of the Twentieth Century economists became increasingly focussed on the income
disparity between underdeveloped and developed countries, noting that despite the
predictions of neo-classical trade theory, there was an absence of evidence that the
disparity was reducing, and many economists were reporting instances where income
disparity was actually increasing (United Nations 1964). Further, economists were
questioning how the benefits of trade were being distributed, specifically focussing on
what went to developing countries. Schools of thoughts emerged that developing
countries did not get their fair share of benefits from trade and that perhaps developing
countries were actually worse off from participating in trade than they might otherwise
be. A large number of theories and models were developed to explain what was observed
and perceived to be occurring.
The initial theories focussed on uneven relationships between developed and
underdeveloped countries. Such theories are largely associated with Prebisch (1950),
Singer (1950) and Lewis (1955). Economists that went beyond the uneven distribution of
gains to suggest that underdeveloped countries could actually become worse off through
81
participation in trade with developed countries include Myrdal (1956), Hirchman (1958)
and Bhagwati (1958). A third area of theory focussed on exploitative relationships
between developed and underdeveloped countries, with Baran (1957) and Frank (1969)
contributing most prominently to this school of thought. This chapter explores the
theories proposed by these economists, their subsequent developments, their criticisms,
and the empirical evidence which supports or refutes them.
4.2 Trade and development theory
4.2.1 Uneven development
Raul Prebisch and Hans Singer are generally credited with being the founding
contributors to the school of thought surrounding uneven development, and their names
continue to be associated with principles of adverse economic relationships between
developed and underdeveloped countries. At around the same time, in the late 1940s and
early 1950s, Prebisch and Singer independently devised similar theories which have since
been collectively referred to as the Prebisch-Singer doctrine. Both economists were
associated with the United Nations Economic Commission for Latin America (ECLA).
The significance of the Prebisch-Singer doctrine is that it establishes that gains from trade
will be unequally distributed between those exporting predominantly primary products
and those exporting mainly manufactured products, and that the inequalities between
developed and underdeveloped countries will increase as a consequence of trade. The
negative effects on terms of trade of primary producers are influenced by differences in
product and factor markets and the accrual of benefits from technical progress.

82
Before reviewing the Prebisch-Singer doctrine in detail, it should be considered how the
doctrine relates to the neoclassical and classical theories of trade that were discussed in
the previous chapter. Singer (1984b) asserted that through his work and that of Prebisch,
the validity of doctrine of comparative advantage was not questioned, rather the equality
in distribution of gains that resulted and the impact on developing countries of
specialising according to the comparative advantage. That being said, specific ideas
raised by classical and neo-classical economists were challenged by the group of
economists that examined uneven development. For example, classical economists
predicted that the value of manufactured goods relative to agriculture would fall. Neo-
classical economists, such as Samuelson (1949), predicted convergence of factor prices.
Prebisch and Singer asserted that the price of agricultural commodities would fall relative
to the price of manufactured goods, and considered that factor-price equalisation would
not come about.
Prebisch (1950) proposed that terms of trade move against underdeveloped countries in a
free trade situation, due to the nature of the products underdeveloped countries produce
and export to other countries. The approach adopted by Prebisch involved classifying
economies as belonging to either the centre and or the periphery, where centre was the
industrialised economies and periphery the underdeveloped economies. Prebisch
proposed that terms of trade moved against periphery economies due to both demand and
supply side factors alike. On the demand side, income elasticities of demand differ
markedly between the imports of the centre and periphery. The primary commodity
imports to the centre have low income elasticity, whereas the industrial imports to

83
periphery economies have higher income elasticity. Therefore, as incomes rise in the
centre economies, demand for the exports of the periphery countries do not increase at the
same level. However, as incomes rise in periphery economies, demand for the exports of
centre economies rise at a higher rate than income. Further, demand for the periphery’s
exports is price inelastic, whereas the demand for exports from centre economies is price
elastic. Thus, when output levels in periphery economies are raised, large price declines
result. Because the exports of centre economies are price-elastic they do not experience
the same price movements when production is increased. Technological progress that
raises output levels in periphery countries’ export industries results in reductions in
exports prices and deterioration in terms of trade. The benefits of technological progress
in the periphery are transferred to centre economies because of the deterioration in terms
of trade. On the supply side, factor incomes rise more slowly in periphery countries due
to higher population growth rates and the surplus labour resources that tend to exist in
these countries. The absence of such factors in the centre creates upward pressure on
factor incomes and thereby final good prices, which then become exports to periphery
countries. As a result, periphery countries pay more for the goods and services they need
to import from the centre.
Prebisch (1950) conducted empirical research to support his theory. This research was
based on the UK commodity terms of trade over the time period of 1870 to 1938.
Prebisch used the UK terms of trade as being representative of all developed countries
and the inverse movement of the terms of trade as being representative of all
84
underdeveloped countries. This approach attracted significant criticism, which will be
explored later in this chapter.
Singer (1950) explored structural differences between industrial countries and exporters
of primary commodities and noted the tendency of terms of trade for primary products to
decline relative to manufactured goods, which in turn unequally distributed income in
favour of the producers of manufactured goods. Singer found that since the 1870s there
had been a trend for prices to move against sellers of food and raw materials in favour of
sellers of manufactured articles, noting “industrialised counties have had the best of both
worlds, both as consumers of primary commodities and as producers of manufactured
articles, whereas the underdeveloped countries had the worst of both worlds, as
consumers of manufactures and as producers of raw materials.” Singer suggested that
specialisation by underdeveloped countries in the export of food and raw materials has
been detrimental to these countries for three reasons. Firstly, secondary and cumulative
benefits were transferred back to the investing country. Secondly, there was concentration
of activities that offered less scope for technical progress. Thirdly, adverse terms of trade
movements have lessened the benefits that would accrue. Singer also identified that
foreign trade tends to be more important proportionately to an economy when incomes
are low, and that fluctuations in the volume and value of trade tend to be proportionately
more violent for underdeveloped countries.
Other economists of the same period provided support for the theories of Prebisch and
Singer, including Baldwin (1955, pp.262-3), who noted
85
“A major reason for the declining export prices of the peripheral countries relative
to the export prices of the centre would seem to be a high price and income
demand elasticity for manufactured products and a low price and income elasticity
for primary commodities. The peripheral countries together with the industrial
nations helped to keep up the process of industrial commodities by their
comparatively large increase in demand for these goods as real income rise."
Lewis (1955) acknowledged the contribution that participation in trade could make to an
economy, however highlighted the cost of specialisation to an economy. The first issue
referred to by Lewis pertained to the impact on an economy if demand for the commodity
being specialised is significantly diminished. This is analogous to putting all of one’s
eggs in the same basket. The second issue identified by Lewis pertained to the breakdown
of trade, for example, in the event of war, which meant that supplies could not be
accessed. A third issue raised by Lewis related to the lack of balance within the domestic
economy, for example, increased pressure on the agricultural industry could give rise to
biological imbalances due to excessive cropping and associated problems of soil
exhaustion or erosion. A further issue highlighted by Lewis pertained to development of
special interest groups surrounding the industry which is being specialised in, and the
added complexity this brings to international co-operation. Nurske (1961) also warned
against extreme specialisation for less developed countries in primary commodities and
raw materials describing issues of deteriorating terms of trade and potential for
displacements by synthetics or alternative products.
86
4.2.2 Increasing inequality
Myrdal (1956) asserted that the economic inequalities between developed and
underdeveloped countries had been increasing and traditional economic theory failed to
account for this inequality and its tendency to increase. Myrdal was specifically critical of
the classical economic theory assumption of a stable equilibrium state, and proposed that
rather than this occurring in the real world, an economic system was likely to move in the
same direction as an initial change but much further, resulting in a process which was
cumulative and moving with accelerating speed. Myrdal made reference to variables
being locked into a causal mechanism, with one change triggering further changes, and
termed this phenomenon as “cumulative causation”. He asserted that cumulative
causation moves underdevelopment away from traditional economic theory, stating that
“if left to take its own course, economic development is a process of circular and
cumulative causation which tends to award its favours to those who are already well
endowed and even to thwart the efforts of those who happen to live in regions that are
lagging behind.” Myrdal asserted that trade exhibits the same bias in favour of richer and
progressive regions and that freeing up markets would provide benefits more to the
countries that are already established than to the less developed countries. Myrdal
discussed back setting effects and that trade and capital movements were the channels by
which economic progress in developed countries have back setting effects on
underdeveloped countries, which triggered the process of cumulative causation. Myrdal
also introduced spread effects, which were the means by which economic activity
transferred between countries. He attributed expansionary activity in developing
countries not impacting developing countries to weak spread effects.

87
Both Singer and Myrdal highlighted concerns about comparative advantage forcing
underdeveloped countries to operate in unattractive industries, with Myrdal elaborating in
relation to the large labour supplies in underdeveloped countries causing technological
improvements to translate into lower prices for outputs or exports, rather than higher
wages.
Hirchman (1958) proposed a country should focus on one or two key sectors in order to
develop centres of economic growth, stating that “once growth takes a firm hold in one
part of the national territory, it obviously sets in motion the certain forces that act on the
remaining parts.” Hirchman noted that growth in one economy could have numerous
impacts on other economies some of which will be favourable and others adverse. The
key favourable impacts related to trickling down effects on the other economies, for
example, the purchasing of inputs from these economies and the provision of advanced
goods and services to the economies. There may also be some absorption of hidden
unemployment. In relation to the adverse effects that growth in one economy may have
on other economies, referred to by Hirschman as polarization effects, advanced or
industrial activities in the economies which are not developing may become depressed
and skilled labour may migrate to the economies that are advancing. Hirchman asserted
his belief that trickling down effects will be stronger than the polarization effects,
however, acknowledged that where advanced countries develop their own agricultural
sectors or means to supply primary products, underdeveloped countries could be left
worse off. Notably, Hirchman considered that in the long run market forces of supply and
demand will correct this situation. Further, trickling down effects will be more powerful

88
in countries that have resources that are valued by industrialised countries. Where a
country had nothing essential or attractive to trade with industrialised countries, it is
likely to experience less of the beneficial trickling down effects. Hirchman echoed similar
sentiments to Myrdal but made reference to polarization effects rather than backwash
effects and tricking down effects rather than spread effects.
Bhagwati (1958) proposed that the deterioration in terms of trade articulated by Prebisch
could result in a loss of welfare in excess of any increase in wealth achieved by higher
production and export levels, thereby resulting in a net decline in a nation’s welfare.
Bhagwati termed this net loss in welfare as immiserizing growth.
4.2.3 Exploitative relationships
According to Baran (1957), underdeveloped countries were largely exploited by
developed countries, specifically "the underdeveloped world as a whole has continually
shipped a large part of its economic surplus to more advanced countries on account of
interest and dividends.". Baran focussed his criticism on the colonial arrangements that
had been created by developing countries and noted that while there were some benefits
from foreign capital in the underdeveloped countries, these benefits were largely
outweighed by the detrimental consequences of such arrangements, making reference to
“exploitation and stagnation” as the prevailing rule. He also suggested that the activities
of the developed countries making the investments were at odds with the development
needs of the underdeveloped countries. The empirical evidence utilised by Baran to
support his statements pertained to the world income over the two centuries preceding the

89
1940s, and the lack of change in the condition of underdeveloped countries during this
time period. Baran suggested that domestic conditions in underdeveloped countries
prevented advancement, for example, lack of infrastructure, lack of innovation and
fragmented property ownership. Domestic factors within underdeveloped countries that
constrained development were also referred to by Myrdal (1956; 1957).
Frank (1969) also focussed on the exploitative relationships between developed and
underdeveloped countries, referring to the underdeveloped countries as satellites and
developed countries as the metropolis. The concepts introduced by Frank can be aligned
to the centre and periphery, respectively, as introduced by Prebisch. Frank claimed
developed countries extract the economic surplus from the underdeveloped countries and
use such surpluses for their own economic development. Frank attributed the lack of
development in underdeveloped countries to not having access to their own surpluses.
Frank considered underdevelopment was caused not from the isolation of underdeveloped
countries from capitalist or developed economies, but rather as a consequence of the
economic and political relationships underdeveloped countries have with developed
countries. Staelin (1974) also referred to a potentially exploitative relationship between
developed and underdeveloped countries, however more focussed on developed countries
capturing productivity gains of underdeveloped countries, and preventing underdeveloped
countries from harnessing the benefits associated with such gains.
More than two decades after the original Prebisch-Singer hypothesis, Singer continued to
demonstrate conviction for his original view of underdevelopment, writing that
90
underdeveloped countries are poor because they have no industry and have no industry
because they are poor, concluding that “one thing leads to another, but nothing leads to
nothing” (Singer 1975). At that stage Singer indicated support for Myrdal’s concept of
backwash effects, the harmful effects that developed countries have on underdeveloped
countries. Specific examples of backwash and adverse effects on underdeveloped
countries cited by Singer include high consumption due to the introduction of unsuitable
technology and training methods, developed countries economising on the use of raw
materials that are abundant in developing countries, the development of synthetics and
substitutes to compete with the exports of developing countries, limited research and
development expenditure specifically for poor countries contributing to inappropriate
production methods or disparity in production methods across industries within
underdeveloped countries, brain drain, harmful policies and aid conditions, creation of
expectations of a welfare state within underdeveloped countries, creation of elite classes
in underdeveloped countries, and demonstration effects. Singer asserted that rapid
development of advanced countries were “doubtfully helpful and possibly positively
harmful” to the development of underdeveloped countries.
Beyond the initial theories developed during the 1950s and 1960s to explain the uneven
relationships between developed and underdeveloped countries, the subsequent decades
saw the development of further theories and models to explain the observed phenomena
and also the conduct of empirical and theoretical studies to support, expand upon, or
disprove the initial theories developed. Specific models that were developed include

91
those by Findlay (1981), Brecher and Choudhri (1982), Krugman (1990) and Redding
and Venables (2004).
Findlay (1981) developed a simple dynamic model which used terms of trade as the
variable that made the growth rate of underdeveloped countries conform to the
exogenously given growth rate of developed countries. He concluded that under certain
conditions the model was consistent with secular deterioration in terms of trade for
underdeveloped countries. Findlay cautioned his findings by noting the existence of a
long-run equilibrium level to which terms of trade movements converge, from either
direction, and therefore concluded that in the long-run there are no significant variations
in terms of trade.
Brecher and Choudhri (1982) developed a model to demonstrate that the international
flow of capital caused a decline in the terms of trade of the country which is the recipient
of the investment. The model provided analytical support for the Prebisch-Singer
doctrine, in relation to analysis of terms of trade deterioration. A notable aspect of the
Brecher and Choudhri analysis was the incorporation of foreign investment, which is
more relevant to the patterns of economic activity which have more recently emerged.
Krugman (1990) presented a theoretical model to explain uneven development. The
model predicted that if a nation had a small head start with an industrial sector, this
pattern would cumulate over time, giving rise to the creation of an industrial centre within
that nation, at the expense of industry development in another nation. Krugman claims
92
the model captures “the essence of the argument that trade with developed nations
prevents industrialisation of less developed country.”
Using a structural model of economic geography, Redding and Venables (2004)
conveyed the importance of geography to development, highlighting the reluctance of
firms to move production to low wage countries because of issues associated with market
remoteness. Redding and Venables asserted that even if institutional and other trade
barriers can be removed geographically remote countries are unlikely to be drawn into
trade relationships, which may have beneficial development implications.
4.3 Alternative perspectives on trade and developing countries
The theories presented in this section are distinct because they neither provide support for
the theory of comparative advantage nor contribute to the school of thought surrounding
uneven development, commenced by Prebisch and Singer. Specifically, these theories
propose alternative relationships between trade and development.
Kindleberger (1956) undertook empirical research into terms of trade and concluded the
reverse relationship to that of Prebisch and Singer, specifically that poverty had adverse
implications for terms of trade because of the inflexibility and lack of adaptability it
created. Essentially, Kindleberger found that poor countries were poor because they did
not produce what the world wanted, and had an inability to alter production to respond to
market demands. Kindleberger noted that favourable terms of trade came about from
flexibility and capacity to enter new industries and leave old ones, while poor terms of
93
trade resulted from inflexibility and being unable to change production. Specifically then,
developing countries suffer from a lack of structural adjustment.
Linder (1967) considered factors other than trade that affect the prospects of developing
countries. Linder proposed that when these other factors disappeared, the country
becomes an advanced country and the role of trade is one as set out in conventional trade
theory. Implicit in Linder’s theory is the role that domestic and other factors play in a
country’s development, and further, that trade is not a factor which causes development
or keeps a country from attaining development.
Oniki and Uzawa (1965) formulated a dynamic model of international trade in order to
analyse the interactions between trade and capital accumulation. The model suggested the
dynamic path of capital accumulation tended to be stable and the capital to labour ratio of
each country converged to a long-run stationary ratio. This ratio was specific to each
country and depended on factors such as the propensity to save and technological change.
The implication of the work of Oniki and Uzawa is that developing countries can do little
to influence their capital to labour ratio beyond a certain level, without changing the
domestic economy. Hence it is the domestic economy which will ultimately influence the
capital to labour ratio, often associated with economic development, and trade is less
relevant than the domestic economy.
94
4.4 Alternative schools of thought pertaining to underdevelopment
An alternative school of thought to those already presented is that countries develop
independently of trade activity, and the problems associated with underdevelopment are
unrelated to trade. A number of contributions to this school of thought have been made
since the middle of the Twentieth Century. Some of them are briefly reviewed in order to
complete the picture that there are views that trade and development might not be related
at all.
Rosenstein-Rodan (1943) noted the need for industry to be of sufficient size for
industrialisation to occur. This became interpreted as the need for a “big push” or rapid
investment, or virtuous circles, whereby underdeveloped countries could not develop
until they got the circle moving (Krugman 1981). The implication of this school of
thought is that there is a distinct hurdle for underdeveloped countries to get over in order
to commence development, and the initial need for large scale industry is beyond the
capability of the poorest countries. The concept of a big push was criticised in later years,
for example, by Hirchman (1981) who advocated that developing countries could focus
on few key sectors to achieve development.
Rostow (1960) proposed that there is a set path for economic development and all
countries follow the same path. Rostow’s theory predicted that it was a matter of time
before underdeveloped countries passed through the stages, and development occurred as
countries passed through the relevant phases. The theory was criticised for being
“excessively deterministic” and not recognising the issues of late starters as being distinct

95
from developed countries (Kuznets 1953a; Streeten 1981). In contrast to Rostow,
Gerschenkron (1966), suggested there could be multiple paths to achieve development,
and therefore underdeveloped countries were not as constrained as Rostow initially
suggested, albeit there were still paths by which underdeveloped countries achieved
development.
Kuznets (1953b) noted the importance of scale for many industries which is often
unattainable for developing countries with small domestic markets for the output of such
industries. Similarly, Hicks (1959) proposed new enterprises will prefer to locate in an
area in which there is already industry and trade established. While such centres may lose
their geographical advantage over time they will continue to grow because of the
concentration that exists. The implication of Hicks’ theory is that underdeveloped
countries are disadvantaged from attracting new enterprises because they have less
industry and trade than developed countries. Hicks also referred to a tendency for the
world to fall into two groups based on what countries produce, specifically manufacturing
countries and primary producing countries, because of the tendency for new enterprises to
locate in areas where there is already industry. More generally, Hicks found the existence
of external economies of scale and economies of scope are influential in industry
location.
Nurske (1961) emphasised the need for developing countries to simulate expansion
domestically, in order to develop, rather than being reliant on trade. Nurkse considered
the principles of comparative advantage were valid, however acknowledged doubts that
96
comparative advantage could provide all the guidance underdeveloped countries need for
development. Similarly, Lewis (1980) asserted that developing countries should follow
their own development path irrespectively of what happened in advanced countries. Prior
to this Nurske (1952) had attributed underdevelopment to domestic market conditions and
related economic development to capital accumulation, asserting less developed areas had
less capital. Nurske proposed that capital formation had both supply and demand sides
and that in underdeveloped countries circular relationships existed on both these sides
which kept capital formation low. On the supply side, due to low incomes, there was
small capacity to save, which reflected low productivity, caused by low capital levels due
to low savings levels. On the demand side, the small buying power of people caused low
inducement to investment, but this was due to small real incomes which were influenced
by productivity. Productivity was low because of low capital levels. Hence low income
and productivity were common to both the supply and demand side of the situation. The
inducement to invest for domestic industries in underdeveloped countries was low due to
the size of the market. Nurske was critical of the adverse implications of conspicuous
consumption on capacity to save in underdeveloped countries. Notably, this is something
that Lewis (1955) considered stimulated demand and desire to work.
Viner (1953) attributed the issues of underdeveloped countries to poverty and
backwardness, and noted the existence of a number of obstacles to economic
development in underdeveloped countries, including an unfavourable physical
environment, the quality of the working population, scarcity of capital, low savings rates
97
and problematic inflation. Meier (1958) also attributed underdevelopment to issues
associated with domestic conditions.
4.5 Comparison of the development process of the Nineteenth and Twentieth Centuries
Some economists who examined the gap between developed and underdeveloped
countries in the Twentieth Century tended to look at the differences that existed between
the international economy in the first half of the Twentieth Century and the one that
existed in the previous century. Such economists have suggested that the Twentieth
Century had less favourable conditions for underdeveloped countries than the earlier time
periods. For example, Myrdal (1956) noted that the 1950’s presented more significant
challenges to development than earlier time periods. Some of the specific challenges
referred to by Myrdal include commencement from a lower level of development, less
open capital markets, fewer underdeveloped countries to utilise as sources of raw
materials and larger populations reliant upon resources. Myrdal also made reference to
the loss of human resources and other scarce factors and the deterioration of handicrafts
and industry within underdeveloped countries.
There has been consensus amongst economic historians that trade has acted as an engine
of growth with countries such as Canada, Argentina, Australia and New Zealand having
benefited from trade participation (Thirlwall 2003). Nurske (1961) asserted that the
“forces making for growth transmission from advanced to less developed countries are
not as powerful in the trade field” as they had been in the past and the contribution of
98
trade to the development of the present-day poor countries had been positive but
considerably less than in the nineteenth century when trade acted as an “engine of
growth”. By the term “engine of growth” Nurske meant that trade was the vehicle by
which the economic growth being experienced in advanced countries was transmitted to
less developed countries.
4.6 Criticisms of Prebisch-Singer and associated theories
The Prebisch-Singer doctrine, while having many supporters, has attracted significant
criticism since being proposed in the early 1950s. Criticisms have been made on both
theoretical and statistical grounds. Most criticism from a statistical perspective focuses on
the fact that the empirical evidence provided by Prebisch was for a single country over a
relatively short time period. More generally, economists have criticised the Prebisch-
Singer doctrine and the theories which followed as being excessively pessimistic for
underdeveloped countries (see for example, Chenery 1975). Notably, the majority of
criticisms were raised within two to three decades following the original publications by
Prebisch and Singer, and from the 1980s renewed support for the original doctrine
emerged, as a consequence of the continued gap between the incomes of developed and
underdeveloped countries and economists taking a renewed interest in exploring this gap.
Viner (1953) was critical of the Prebisch-Singer doctrine for a number of reasons. From a
theoretical perspective, Viner asserted the doctrine was based on improbable postulates,
and from an empirical perspective, Viner noted there was no uniform trend of secular
decline in the terms of trade between agricultural and manufactured goods, with some
99
researchers in fact having identified the opposite trend. Viner was critical of the linking
of agriculture to poverty which is implicit within the doctrine, noting that
underdevelopment is associated with the domestic conditions that exist within
underdeveloped countries. He acknowledged that primary commodities do exhibit a
wider fluctuation in price than manufactured goods, however suggested higher prices
were achieved on upward swings of the cycle which primary exports can benefit from.
Baldwin (1955) pointed out that terms of trade represents only one part of the overall
picture as to how international trade has impacted on a country. Baldwin was critical of
over-reliance on terms of trade, noting that terms of trade only translated into income
change if all other things remain the same which is highly improbable in the long run.
According to Myint (1958), Prebisch and Singer overly focussed on attacking classical
theory without acknowledging what has occurred within the international economy, and
that more recent performance of underdeveloped countries was specific to the
international economy of the time. Meier (1958) was critical of Myrdal for over-
emphasising the significance of international trade as a mechanism for inequality and
questioned the empirical and analytical bases of Myrdal’s criticism of classical theory.
Harberler was one of the strongest critics of the Prebisch-Singer-Myrdal theories, writing
a number of articles during the 1950s and 1960s. Harberler initially stated the theories
were based on “grossly insufficient empirical evidence” and “the attempted explanation
of the alleged facts is fallacious” (Harberler 1959). In relation to the empirical evidence
provided by Prebisch, Harberler asserted that there was no evidence that the trends

100
described in the theories would continue in the future. He also noted that the time period
of the study was relatively short, and acknowledged the analysis over a longer time
period may have presented different results, and secondly, the specific events that
transpired during that time period, such as the Great Depression, influenced the results
that were observed.
From a theoretical perspective, Harberler (1968) claimed that Prebisch-Singer confused
absolute and relative prices, and focussed on absolute prices when relative prices were
more relevant to the study. A further criticism was that the Prebisch-Singer analysis
failed to consider real world influences such as innovation. Harberler asserted that a
decline in terms of trade would not necessarily translate into a change in welfare and that
the changes proposed by Prebisch-Singer, should they occur, would come about gradually
and countries and producers would have time to adjust, and therefore there would not be
the severity of adverse consequences proposed. There was also criticism by Harberler for
ignoring the benefits that trade could bring to developing countries.
In addition to being critical of Prebisch and Singer, Harberler (1968) was also critical of
Myrdal for discounting the favourable effects of trade relative to the unfavourable ones,
asserting capital flows have occurred from rich to poor countries. Harberler was also
critical of other aspects of Myrdal’s theory, such as demonstration effects and disguised
unemployment. Notably, Schultz (1961) was also critical of disguised unemployment,
stating “The doctrine that a part of the labour working in agriculture in poor countries has
a marginal productivity of zero… rests on shaky theoretical presumptions.”
101
Harberler identified a number of economists that presented theories that directly
contradicted Prebisch and Singer, but asserted that neither school was entirely correct,
because terms of trade tend not to move in a single direction, but change direction
depending on the factors present within the international economy. Further, the terms of
trade for different commodities are likely to exhibit different behaviours, rather than there
being a uniform movement for terms of trade pertaining to different commodities.
Flanders (1964) asserted that there were logical weaknesses in the arguments of Prebisch
pertaining to market structures and productivity gains. Streeten (1974) thought that the
empirical evidence supporting the Prebisch-Singer doctrine was based on the arbitrary
selection of base year, and was therefore dubious. Streeten suggested the deterioration of
agricultural terms of trade relative to industrial products was overstated by Prebisch and
Singer for three reasons. Firstly, product innovations occur in industrial products, so that
worsening terms of trade reflects better industrial products. Secondly, new industrial
products tend to be initially high in price and decrease as they become more widely
utilised. Thirdly, export prices of agricultural products are based on commodity market
prices which are free on board, and therefore lower transport costs will not be reflected in
prices.
Macbean and Balasubramanyam (1976) asserted the arguments of Prebisch were based
on “dubious empirical evidence and rather imprecise theorising”. Further, that the poor
price performance of commodities in the period studied by Prebisch was utilised to
support a theory of long-term price deterioration of primary commodities. Macbean and

102
Balasubramanyam asserted that demand for primary products has not proven to be as
price-inelastic or income-inelastic as proposed by Prebisch and other economists that
followed the same school of thought, and that the experiences of developing countries
have been significantly more diverse than would be expected by the Prebisch theory.
Morgan (1963) reviewed the empirical research conducted around the same time as that
of Prebisch and noted that there was contrast in the findings that emerged. Morgan
asserted the British terms of trade appreciation would be exaggerated due to
technological innovation and transportation costs not being taken into account in terms of
trade analysis. Kindleberger (1956) conducted a study which indicated none of several
other European countries researched experienced a significant trend in their net barter
terms of trade in the same way that Britain did. Research conducted by Martin and
Thackeray (1948) also concluded that the British experience was not replicated across
other countries, and more specifically that there was no regularity in the movements of
terms of trade during the trade cycles between 1870 and 1938. Similarly, Lipsey (1963)
studied the net barter terms of trade for the United States for the same period and found
that no trend could be established in relation to terms of trade movement.
Spraos (1980) conducted research into terms of trade movement of primary commodities
relative to manufactured goods, and concluded that while Prebisch had the direction of
movement correct, that if there was indeed a deterioration in the terms of trade of
commodities relative to manufactured goods, this movement was exaggerated by

103
Prebisch by a factor of three. Grilli and Yang (1988), based on their own empirical
research, also asserted Prebisch exaggerated the deterioration in terms of trade.
In addition to providing empirical evidence that did not support the Prebisch-Singer
doctrine, Kindlberger (1956) warned against overemphasising terms of trade in economic
analysis, noting that trade volumes were a significant factor in international trade.
Similarly, Wilson et. al. (1969) recommended that attention should be paid to exports and
their impact on income rather than to terms of trade. From an empirical perspective, Patel
(1959) studied the Indian economy and noted that its growing trade imbalance was
caused by export volumes declines rather than any terms of trade change.
It is notable that some of the economists that have criticised the Prebisch-Singer doctrine
also provided support for some of the ideas implicit within the doctrine. Harberler (1968)
acknowledged the rewards of technological progress have been retained by producers in
the form of higher prices rather than being passed onto consumers in the form of lower
prices. However, Harberler questions whether this has genuinely hurt underdeveloped
countries. Streeten (1974) noted that despite all of the criticism aimed at the theory, the
core of the Prebisch Singer theory, namely that there are unequal forces at work that have
lead to uneven distribution of gains from trade and economic progress, has survived.
Macbean and Balasubramanyam (1976) acknowledged that prices and earnings from
exports are more volatile for developing countries, but suggested this is less important
than the lack of growth of export proceeds. The research of Spraos (1980) previously
104
referred to, indicated that Prebisch and Singer did have the direction of movement
correct, albeit exaggerated the impact.
4.7 Empirical evidence relating to the Prebisch-Singer doctrine
There have been considerable empirical studies relating to primary commodities and to
the experience of developing countries over the past half a century. As has been
discussed, the empirical evidence used to support the original Prebisch-Singer analysis
was based solely on the UK over the period 1870 to 1938, when there were significant
international events that had the potential to influence findings. The criticisms of this
approach and the empirical studies that supported these criticisms were considered
previously. Hence the focus of this section is on the additional empirical studies that have
been conducted.
By and large there is a large amount of empirical evidence to support the deterioration of
the terms of trade of primary commodities from developing countries. Sarkar (1986)
refers to a number of empirical studies that were conducted in the 1980s that support
deteriorating terms of trade for primary products. Sarkar noted that the empirical basis to
support the Prebisch-Singer hypothesis was much stronger in the 1980s than in the early
years. Similarly, Elkan (1995) noted that while the Prebisch thesis has been open to many
objections, the post Second World War period indicates Prebisch was right to warn
underdeveloped countries against relying on primary product exports.

105
Yates (1959) studied the forty year period between 1913 and 1953 and noted
deterioration in the terms of trade of primary products relative to manufactured goods
during the interwar period, and improvement in the post-war period, albeit not restoring
terms of trade to their original 1913 level. Lewis (1980) researched the relationship
between the growth in industrial production and primary commodities between 1873 and
1913 and concluded that growth in primary products was 0.87 times the growth of
industrial production. The implication of the findings of Lewis was that growth in
developing countries was strongly tied to growth in industrial countries, albeit that the
growth experienced by developing countries was likely to be less than that experienced
by industrialised countries. The findings of Lewis reinforce the trickling down effects
identified by Hirschman. Bairoch (1972) studied the developing and less developed
countries of Europe in the late 19th century and found that the effects of participating in
trade were negative for less developed countries.
A report by the United Nations (United Nations 1964) on economic development pointed
to a buoyant international economy existing in the late Nineteenth and early Twentieth
Centuries, during which time industrialised countries demanded primary commodity
imports from developing countries. The report noted the import coefficient (that is,
imports divided by domestic consumption) of the United Kingdom rose from around 18
per cent in 1850 to around 36 per cent in 1880-84, and the rest of Europe exhibited a
similar phenomenon but not to the same extent. This level of activity was broken by the
Great Depression which resulted in contractions in exports and a slow down in growth
rates, and thereby, persistent trade imbalances for underdeveloped countries. The primary

106
sectors of industrialised countries had advantages over the primary sectors of
underdeveloped countries due to the technological advancements that could be availed of
and because of the protectionism afforded to primary sectors in developed countries.
Following the Second World War industrialised countries increased their share of world
trade, whereas underdeveloped countries reduced their share of the world. There was
deterioration in both terms of trade of primary commodities relative to manufactured
goods, and of underdeveloped countries relative to developed countries.
Singer (1975) noted a chronic tendency of weakness in terms of trade for agricultural
goods relative to manufactured goods in recent years, at the time of writing. Singer
explained terms of trade for underdeveloped countries had been relatively favourable
during the 1950s, which meant that theories of pessimism in relation to underdeveloped
countries had not been proven during that decade. Singer noted that there was not the
strong improvement in terms of trade forecast by Lewis (1955) or Clark (1960), and that
Myint (1958) was incorrect in his analysis. Singer noted that by the 1970s it had become
quite apparent that there was not a homogeneous third world, with some countries
showing significant development and others becoming poorer. The growth of developing
countries during the 1950s and 1960s was also noted by Chenery (1975), however
Chenery highlighted the persistence of structural issues in underdeveloped countries,
including the inability to absorb growing labour forces and inequality in income
distribution. Wilson et.al. (1969) conducted empirical analysis for the period of 1950 to
1965 and concluded that the terms of trade for underdeveloped countries deteriorated
during this time.

107
Singer (1984a) noted that the terms of trade of least developed countries’ exports relative
to manufacture exports deteriorated during the period of 1957 and 1982 in the commodity
areas of food, beverages, agricultural raw materials and metals. Additionally, the terms of
trade of the world’s poorest countries deteriorated in comparison to middle and higher
income developing countries between the period of 1960 to 1973, thus indicating that any
improvement in developing country terms of trade was not achieved by the poorest
countries. Further, Singer noted that while world trade volumes increased between 1948
and 1970, the export volumes of the least developed countries increased by a smaller
amount than world trade itself, indicating a diminishing role for these countries in
international trade.
Empirical research by Grilli and Yang (1988) found that non-fuel commodity prices fell
between 1900 and 1986 by approximately 40 per cent. On average the relative prices of
all primary commodities fell by 0.5 per cent a year and those of non-fuel primary
commodities by 0.6 per cent annum. This supports the findings of Prebisch, at least in
terms of direction of trend, although the magnitude is slightly less than the empirical
research of Prebisch revealed. The study found the decline in relative prices of non-fuel
commodities has not been uniform across commodity groups. Metal and non-food
agricultural commodities showed a larger decline, and in some cases a real appreciation
was evidenced. Non-food agricultural commodities experienced a strong and steady
decline relative to internationally traded manufactured goods, which makes sense because
this group consisted of commodities in which there had been synthetic product
substitutions introduced since the 1950s. Regional and country differences in experiences

108
were also noted. Grilli and Yang asserted that immiserising growth may have occurred
for specific commodities or in specific time periods, but its existence cannot be assumed.
Notably, Grilli and Yang warned against concluding that trade has been detrimental for
developing countries on this basis, as there are compensating effects, such as productivity
growth that need to be considered in determining the overall effect of trade on
underdeveloped countries.
Thirlwall (2003) reviewed a number of studies that had emerged after the work of
Prebisch, that had put the rate of terms of trade deterioration at between 0.5 and 1.2 per
cent annum. This is consistent with Prebisch, who had originally established a rate of
deterioration of 0.9 per cent per annum. Thus, these additional studies provide general
support for the work of Prebisch. As previously mentioned, Spraos (1980) had found a
rate of deterioration of only 0.3.
More recently there has been an emergence of literature that points to long-run
deterioration in commodity prices from the 1960s. For example, the 2002 report on Least
Developed Countries refers to the long-term downward trend in real non-fuel commodity
prices since the 1960s (UNCTAD 2002b). The report notes that “the adverse influences
on developing countries that Prebisch and Singer warned against 50 years ago are at work
in almost all of the worlds poorest commodity exporting countries”. Similarly, a study by
the IMF (Borensztein et al. 1994) in the 1990s into non-oil commodity prices concludes
that there has been secular and persistent weakness in real commodity prices over the
preceding three decades.

109
4.8 Conclusion
This chapter has reviewed the literature that emerged from the middle of the Twentieth
Century pertaining to the impact of trade on developing countries. The basis for the
emergence of this literature was the persistence in income disparity between developing
and developed countries. The early contributors to this school of thought were Prebisch
and Singer, who proposed that trade perpetuated an uneven relationship between
developed and underdeveloped, or developing, countries. Extensions of the work of
Prebisch and Singer referred to the inequality being cumulative and growing. There was
consideration given to the negative effects of trade outweighing any positive effects, from
which the term immiserising growth was coined. Baran and Frank moved from uneven
development to proposing the relationship between developed and underdeveloped
countries could be exploitative. Later economists, such as Krugman and Venables and
Redding, delivered theories to explain how situations of unevenness developed.
Alternative theories suggested that trade had little to do with underdevelopment and that
underdeveloped countries were unable to participate in trade due to structural constraints
and because they could not produce what was being demanded.
This chapter also considered the criticisms of these new theories. Criticisms were largely
based on theoretical and statistical grounds. Despite the original empirical evidence to
support the theories that emerged being limited and the subject of significant criticism,
the subsequent empirical evidence that has emerged has provided a reasonable level of
support for deterioration of developing countries’ terms of trade relative to developed
countries, so much so that it has been noted in the reports of international agencies such
110
as the United Nations and the IMF. It has also been noted that terms of trade is just one
factor within the relationship between developing and developed countries, albeit a very
important factor. Other aspects include the volume of what is exchanged, and the other
benefits that may be transferred to developing countries, such as investment and technical
knowledge.
There are strong similarities between the arguments reviewed in this chapter and those
put forward about developing countries participating in the current international
economy, which were discussed in Chapter 2. To provide some examples, Singer claimed
developing countries were stuck in unattractive industries and discussed the
inappropriateness of production methods of developed countries for developing countries.
Lewis highlighted the disadvantages of a high level of specialisation. Hicks noted that
industry was likely to locate where other industry was already located, and this trend
directly disadvantage developing countries. Myrdal discussed that the growth going on in
developed countries was unlikely to spread to developing countries, thus giving rise to
patterns of exclusion. Baran asserted that the low levels of infrastructure in developing
countries impeded development. Kindleberger asserted underdevelopment was a
consequence of not producing what the world was demanding, and being unable to alter
production patterns.
This chapter completes the review of the literature on economic theory and globalisation.
The following chapter presents a review on the literature pertaining to measuring
development.

111
5 Measuring Development
5.1 Introduction
One of the key aspects of this research is the creation of a composite index by which to
measure development. The index created will be aligned to the overall research objectives
established in the first chapter of this thesis. The purpose of this chapter is to review the
literature on the measurement of development, in order to understand how development
has been measured historically, as this will influence the index created for the current
research. The chapter commences with a brief definition of development and an overview
of the approaches to measuring development and then goes on to examine one of the
simplest ways development has been measured, which is via standard income measures
such as GNP or GDP. Around the middle of the Twentieth Century, economists started to
look for alternative ways to measure development, and the various measures that were
proposed are examined. One of the measures proposed was the HDI, by the UNDP. This
measure, originally proposed in 1990, has become the most enduring measure of
development, and is the one that the index created in the current research is based upon.
To better understand this measure of development and to assist in determining how it
should be modified for the purposes of the current research, consideration is given to
criticisms and suggestions for improvement, and how the UNDP has altered the HDI
since its original inception.
112
5.2 Defining and measuring development
In the most general sense, development refers to progression from a simpler or lower
level to a more advanced, mature, or complex form or stage. Thus, economic
development can be considered as the progression of an economy, and human
development as the advancement of the people within an economy. One perspective is
that an economy does not progress unless the lives of its people are made better, and
therefore economic development is intrinsically linked to human development. Such a
perspective is supported by McGranhan (1972) who suggested that economic and social
development are integrated aspects of the same thing and therefore cannot be separated.
For the purposes of this research the term development is used on the understanding that
the overall goal is improvement in the lives of people.
There are a number of approaches to measuring development, including single indicators,
multiple indicators, composite indices and normative models. An example of a single
measure is GDP, or adjusted GDP, which was the approach followed by Nordhaus and
Tobin (1973) in creating the Measure of Economic Welfare (MEW). The MEW
transformed GDP by changing the treatment of non-market activities, leisure time,
government expenditure, consumer durable goods, defence expenditure and
environmental damage. Multiple indicators refer to taking a number of different measures
but considering progress against each individually without attempting to combine the
indicators into a single index. This approach has been followed by the United Nations
(1954) and the OECD (1976). Composite indices involve representing multiple indicators
by a single value. Examples of composite indicators include the Human Development
113
Index and the Physical Quality of Life Index (Morris, 1979). Normative models involve
establishing a minimal desired level of development and estimating the resources
required to bring all countries to this level. Leontief (1963) developed a normative model.
5.3 Measuring development through measures of income
Interest in development can be traced back to Karl Marx and Adam Smith (Basu 2001).
Prior to the middle of the Twentieth Century, development was predominantly measured
by economic output, specifically by GDP or GNP. This view is reinforced in the writings
of Pigou (1932), who suggested income could be utilised as a measure of wellbeing.
Around the 1950s, consistent with the emergence of development economics as a field of
study, economists began to express dissatisfaction with measuring development by
income and started to explore other measures. In 1953 Kuznets wrote that "investigators
interested in quantitative comparisons will have to take greater cognizance of the aspects
of economic and social life that do not now enter national income measurement” and
“national income concepts will have to be either modified or partly abandoned, in favour
of more inclusive measures" (Kuznets 1953a, p.178).
There are a number of criticisms of utilising GDP or national income in order to measure
development. Perhaps most significantly, GDP is a measure of output, not of
consumption nor living standards (Nordhaus & Tobin 1973). More generally, economic
indicators are not considered adequate for analysing social conditions or as objectives for
development planning (Drewnowski 1972) and GNP is not a measure for “the rate or the
level of combined social, political, and economic process on which sustained

114
development depends" (Morris, 1979). Measures of economic growth, such as those
based on GDP, omit important aspects of changes in living standards (Crafts 1999). Seers
(1972) pointed out that GDP can change without any improvement in poverty,
unemployment or inequality. Anand and Sen (2000) noted that income is not a good
indicator of achievements in health and survival, as it depends on how resources are
utilised, while Yeh (1976, p.70) stated “Basic to the social indicator movement is the
recognition that economic aggregates such as the GNP and related monetary accounts
were not intended to, and do not provide adequate measures of the level of living or
welfare, and that the important dimensions of society and the people’s well-being should
be subjected to monitoring as a basis for policy and planning.”
GDP includes what economists have termed ‘regrettable necessities’(Morris, 1979), such
as defence spending, which may not directly improve the living standards of people. This
point can be debated, as defence spending may actually make people feel more secure.
GDP does not measure qualities of life such as health and literacy, and more subjective
considerations such as freedom and happiness, and fails to consider damaging aspects
such as pollution and environmental degradation (Moss 1973). Numerous activities
within an economy escape monetary measurement and this tends to be more prevalent in
undeveloped countries than developed countries.
5.4 Alternative measures of development
In the late 1940s, economists started to search for alternative and more comprehensive
measures of development than income based measures. One of the earliest interests in
115
alternative measures of welfare or development was Davis (1945), whose approach was
theoretical and involved the concept of a plane or content of living, which he referred to
as a “complex combination of consumption, working conditions, possessions, freedoms,
and atmosphere”. Davis asserted differences in planes of living were not proportional to
differences in consumption levels and consumption was merely to sustain life.
The first attempt to produce a composite indicator was undertaken by Bennett (1951),
who devised a composite index based on consumption incorporating nineteen indicators.
He employed a hundred point scale on which to measure countries for each component in
the composite index, and weighted the components in the construction of the overall
index. Notably, limited justification was provided by Bennett for the unequal weighting
of components.
The United Nations (UN) established a committee in 1954 to report on “the most
satisfactory methods of defining and measuring standards of living and changes therein in
various countries, having regard to the possibility of international comparison” (United
Nations 1954). In its findings, the committee recommended that the problem of levels of
living must be approached in a pluralistic manner by analysis of various components and
by the use of various statistical indicators, and emphasised the need for quantitative
indicators of welfare in order to establish objective standards by which levels of living in
countries could be measured (United Nations 1954).

116
Also in 1954, a working party was formed by a number of UN agencies, including the
International Labour Office (ILO), the Food and Agricultural Organisation (FAO), the
United Nations Educational, Scientific and Cultural Organisation (UNESCO), and the
World Health Organisation (WHO), in order to progress the systems of components and
indicators recommended in the earlier UN report. The findings of the working committee
were published in 1961 in a report titled “International Definition and Measurement of
Levels of Living: An Interim Guide” (United Nations 1961). The main contribution of
this working party was to narrow, and further articulate, the components of levels of
living proposed by the UN committee established in 1954. The 1961 report proposed the
components of level of living to be health, food consumption and nutrition, education,
employment and conditions of work, housing, social security, clothing, recreation and
human freedom. The working party did consider income and expenditure as important,
but recommended these be part of a general category of “basic information” rather than
directly considered as part of the level of living. The report proposed the specific
indicators that should be considered for each component of level of living. Notably, this
consideration of indicators was the limit of the report and there was no attempt to
combine indicators into a single measure or composite index. The United Nations formed
the United Nations Research Institute of Social Development (UNRISD) in 1962 for the
purpose of research into the social dimensions of problems affecting development. This
institution is associated with much of the subsequent research conducted in the areas of
measuring development and levels of living, including the research of McGranahan
(1972,1985) and Drewnowski (1972,1974), which are explored later in this chapter.
117
Harbison and Myers (1964) constructed a composite index to measure the relative level
of educational development in different countries. The Harbison-Myers index
encompassed the sum of secondary school unadjusted enrollment rates plus an arbitrary
weight of five times the third level enrollment rate. The significance of the Harbison-
Myers index is that it was one of the earliest composite indices to measure a facet of
human resource and educational development. The index formed the basis for future
work by Harbison to classify and compare countries on the basis of indicators of
development.
Adelman and Morris (1967) contributed to the empirical knowledge of the
interdependence of economic and non-economic aspects of the development process
through the utilisation of social, political and economic indicators. The research of
Adelman and Morris focussed specifically on underdeveloped countries, rather than the
general development experience of all countries. Their approach involved forty one
indicators that encompass both quantitative variables and indicators of qualitative
characteristics. Seventy four underdeveloped countries were classified for each indicator,
for the period of 1957 to 1962. Factor analysis was utilised to derive systematic
underlying associations. The rationale for utilising factor analysis was that it “reduces a
complex, unclear phenomenon to its basic components and provides insights into the
relative importance of the forces that each component represents”. Sheldon and Moore
(1968) published an approach to social well-being that involved indicators being divided
into structural, distributive and aggregative features.

118
Harbison, Maruhnic et.al. (1972) proposed means to classify and compare countries or
regions on the basis of indicators of development and modernization. This involved a
synchronic data matrix which used forty indicators, representing the broad categories of
economic, cultural, health and nutrition, human resource development and demographic
factors. One hundred and twelve countries were analysed, grouped by regions. These
regions represented the main developing regions of the world with a group of developed
countries also being included in the analysis. A taxonomic method was utilised for
ranking, classifying and comparing countries. This approach involved the construction of
seven indices representing specific aspects of development and the construction of a
composite index drawing together most of data of the individual indices. The composite
index was utilised as a proxy for overall development and modernization. A notable
aspect of the work of Harbison, Maruhnic et.al. was the exclusion of variables that had
low correlations with other variables, which is unusual as researchers generally look for
variables that are not highly correlated with one another.
Hellwig (1972a) proposed mathematical models for the purpose of analysing human
resource indicators. More specifically, Hellwig (1972a) proposed the Wroclaw
Taxonomy, as a means to measure a country’s development level with respect to Human
Resources. This approach was adopted by Harbison, Maruhnic et.al (1972) in research
published the same year.
UNRISD commissioned a study to analyse and measure development in its combined
economic and social aspects, which was lead by McGranahan. The initial report of this
119
study was published in 1972. McGranahan, Richard-Proust et.al. (1972) formed an index
with eighteen variables. Indicators were transferred to a common scale, which involved
assigning zero points as the lowest potential outcome and one hundred as the highest, and
then weighting each country according to where it lay between these extremes for the
indicator. A system of shifting weights was used in index construction, based on the
development levels of individual countries.
Drewnowski (1972) attempted to measure social conditions through a methodology that
involved scaling of indicators and assigning weights to indicators in order to reflect
preferences. Drewnowski indicated support for indicators to be individualised to
countries to reflect country preferences. Drewnowski’s most significant contribution to
measuring social conditions came about in his 1974 publication, ‘On Measuring and
Planning the Quality of Life’ (Drewnowski 1974), which presented outcomes of research
conducted at UNRISD from 1964 to 1969. In this publication, Drewnowski constructed a
Level of Living Index to measure the flow of welfare. The Level of Living was defined
by Drewnowski as "the level of satisfaction of (its) needs attained per unit of time as a
result of the goods, services and living conditions which the population enjoys in that unit
of time." The Level of Living index was similar to the HDI in terms of transformation of
indicators and formation of a composite index, however Drewnowski utilised twenty
seven indicators, representing nine categories, that fell into three broad groups.
Drewnowski also developed a State of Welfare Index that was designed to measure where
an individual or population was at a specific point in time in response to needs

120
satisfaction, as opposed to the Level of Living index, which measured the flow of welfare
over time.
Chenery and Syrquin (1975) undertook research within the World Bank on patterns of
development between 1950 to 1970. Their objective was to provide a comprehensive
description of the structural change that accompanied the growth of developing countries
and to analyse their interrelations. In response to the objective, a uniform statistical
procedure was developed to measure variations in different aspects of economic structure
in relation to income level and other factors. Twenty seven variables were utilised that
described ten basic processes relating to accumulation, resource allocation and income
distribution. The ten processes were considered to describe the dimensions of the
structural transformation from a poor country to a rich country. While Chenery and
Syrquin were more focussed on economic variables, they did consider a number of social
indicators, including indicators relating to education, mortality and income distribution.
In response to growing concern about social well-being and desirability of economic
growth, the OECD formed the Social Indicator Programme in 1970. The initial objective
of the programme was to identify the social concerns of common interest to OECD
governments. The list was published in 1973 (OECD 1973) with twenty four concerns
being identified and grouped into eight primary goal areas. A second phase of the
programme was then instigated to develop a set of social indicators to reveal the level of
wellbeing for each social concern and to monitor changes in the level over time (OECD
1976). The outcomes of this phase were published in 1976. Notably, the OECD perceived

121
the 1976 publication as a step toward the measurement of quality of life, rather than an
end solution in itself. The OECD approach involved the analysis of individual indicators,
as opposed to the formation of a composite index. Since the OECD comprises the more
advanced countries of the world, the primary purpose of the analysis was to assist OECD
members, and its approach did not focus on the development efforts of the
underdeveloped countries.
In 1979 Morris presented the Physical Quality of Life Index (PQLI) (Morris, 1979).
Morris’ team, the Overseas Development Council within the United Nations, determined
three criteria on which development policy could be assessed for effectiveness - fewer
deaths among infants, longer lives and literacy as a surrogate for individual capacity for
effective social participation. These criteria lay the foundations for the three indicators
included in PQLI which were infant mortality, life expectancy at age one, and basic
literacy. The PQLI was limited as it only reflected health and education, and did not
measure command over resources, which could have been represented through the
inclusion of a measure of income (Chowdhury 1991). Morris emphasised the purpose of
the PQLI was not to measure “total welfare” but to provide an index that complements
GNP.
Humana (1986) published the World Human Rights Guide, which was essentially a
country-by-country survey of human rights. Its aim was to demonstrate how members of
the United Nations honoured their human rights obligations. The current analysis relies
on Humana’s work, firstly, because human rights and personal freedom are key aspects of

122
development, and, secondly, because Humana’s index is a composite index, which is
what will be produced. The work of Humana assessed the human rights performance of
one hundred and twenty countries. Forty questions were asked about ninety of the one
hundred and twenty countries, and for the remaining countries a summary was utilised
due to inability to collect responses to the questions during the survey period. The
responses were graded and questions were weighted according to their significance to
human rights. From this, countries were assigned a percentage score based on a how
close they came to the maximum standard established, and ratings of fair, bad or poor
were assigned to each individual country based on their percentage score.
Estes (1984) led a project of the International Council on Social Welfare (ICWS) which
was commissioned out of concern for the widening development gap between rich and
poor nations, and the lack of emphasis many development assistance organisations were
placing on social problems. The associated research commenced in 1974, and involved
the construction of world social welfare development index, referred to as the Index of
Social Progress (ISP). The ISP is multidimensional in that it included social, economic
and political factors, represented by forty-four indicators and eleven sub-indices. All
components were assigned equal statistical weight in the overall index. In 1988, Estes
published an updated version of the ISP, referred to ISP83, recognising when the
subsequent research commenced, which incorporated thirty-six indicators divided into ten
sub-indexes (Estes 1988). The differences between the two indices were fewer items and
one less sub-index, thus supporting more simplistic indices. Estes noted the ISP measured
the “changing capacity of nations to provide for the basic social and material needs of
123
their populations as a whole”. In the 1988 publication Estes presented a weighted index,
the Weighted Index of Social Progress (WISP), which encompassed differing
contributions of the ten sub-indexes. For the WISP, varimax factor analysis was utilised
to derive statistical weights for the sub-indexes of the ISP. The rationale provided for the
weighting was enablement of more precise estimates of national social development gains
over time and realignment in comparative development rankings of countries. One
hundred and twenty four countries were included in the 1988 study.
In 1985 McGranahan published a report with two other colleagues from UNRISD,
Pizzaro and Richard (McGranahan, Pizarro & Richard 1985), titled “Measurement and
Analysis of Socio-Economic Development”. This report focussed more on methods of
analysis, rather than the generation of an index. The associated research involved
conducting extensive testing and experimenting with methods of analysis. Some of the
areas explored include correlation, analytic line-fitting, data transformation and
linearisation of pattern analysis, typological analysis and causality analysis over time.
The work was more exploratory in the application of these methods and did not make any
firm recommendations in the measurement of development. The report recommended the
use of development profiles rather than indices, but recognised the need and purpose of
indices.
In the early 1980’s, The Economic Commission for Latin America and the Caribbean
(ECLAC), a division of the United Nations, devised an approach to measure poverty,
referred to as dissatisfaction of basic needs (DBN). The DBN approach focussed on
124
housing quality and basic education. If a household failed to meet any of seven criteria, it
was considered poor. The underlying philosophy of the DBN is summarised as “Poverty
is thus a state in which any one of the several basic needs is unsatisfied” (Desai 1995a).
In 1995, Desai (1995b) proposed a social progress index (SPI) that was based on
longevity, consumption of private goods and access to public goods. The SPI for an
individual country was measured as the difference between lifetime deprivation and
lifetime well-being.
The HDI was first produced in 1990, and from that point, research in the area of
development measurement has predominantly been aimed at refining and building upon
the HDI. The HDI is extensively presented in the next section, so at this stage it is enough
to note that it only utilises three indicators. Thus, despite the vast number of indices and
approaches to development that preceded the HDI, most of which included large numbers
of variables and more complex construction methods, none have been more enduring and
more widely accepted than the HDI. That being noted, the HDI does clearly draw on
many of the earlier measures of development, in both construction and the indicators
utilised.
A composite index that has been more recently developed is the Economic Freedom of
the World Index (Gwartney et al. 2002) which measures economic freedom, rather than
development, and comprises twenty three components. It is constructed similarly to the
HDI in that countries are assigned a ranking for each component based on progress
against set maximum and minimum values. The addition of the components differs from

125
the HDI by utilising weighting based on principal component analysis. This index was
first produced in 2000 but is yet to receive the acceptance of the HDI.
5.5 The Human Development Index
The HDI was first published in 1990, as part of the Human Development Report (HDR)
by the UNDP, and has been recalculated for each country and published on an annual
basis as part of the HDR. It is a composite index, which measures deprivation of
indicators of development. The HDI since inception has contained the three elements of
longevity or health, education and income. These elements are the most basic human
capabilities and support for their inclusion is provided in the first HDR:
“Human development is a process of enlarging people’s choices. The most
critical of these wide-ranging choices are to live a long and healthy life, to be
educated and to have access to resources needed for a decent standard of living.”
(UNDP 1990 p.10)
The longevity / health and education components of the index are measures of wellbeing,
while income is a surrogate or catch-all for aspects of well-being not reflected in the other
components. Income, therefore, serves as an indirect indicator for other capabilities for
which data is not available, such as access to land or credit (UNDP 1990). Anand and Sen
(2000), in reviewing the HDI, note that education and longevity are aspects of good life
and reflective of the “capability to do other things”, while GDP is reflective of command
over resources or an “instrument to do other things.”
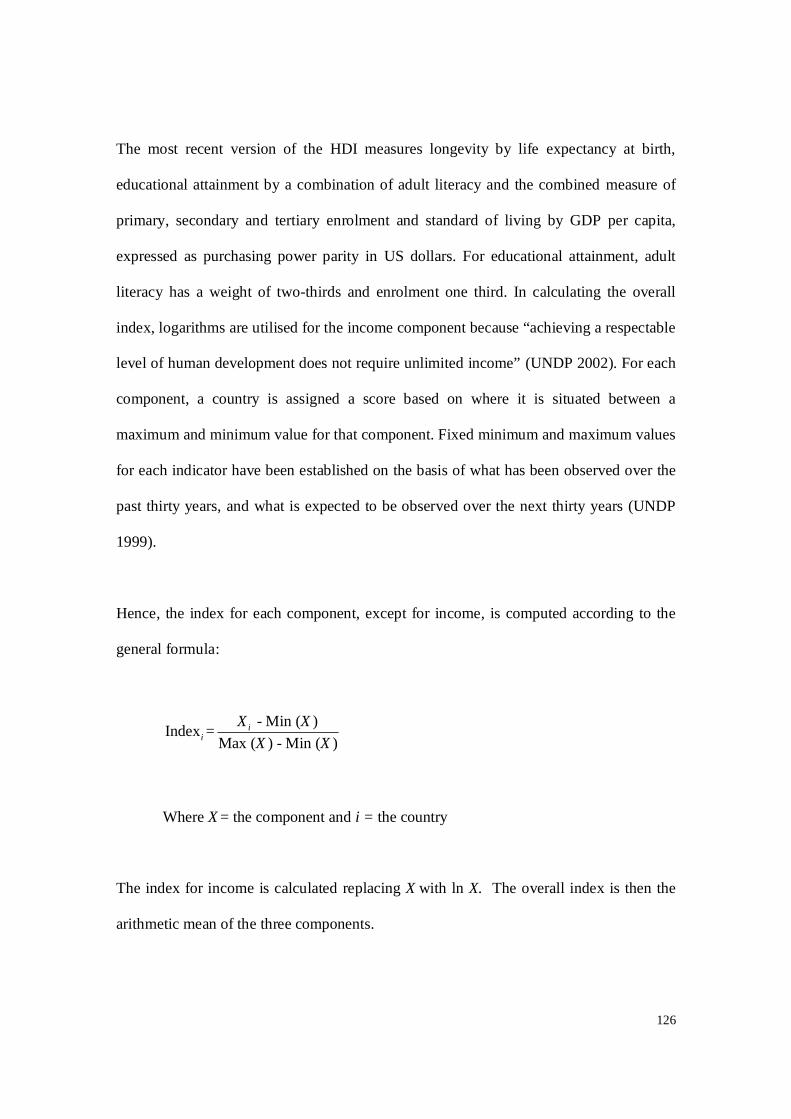
126
The most recent version of the HDI measures longevity by life expectancy at birth,
educational attainment by a combination of adult literacy and the combined measure of
primary, secondary and tertiary enrolment and standard of living by GDP per capita,
expressed as purchasing power parity in US dollars. For educational attainment, adult
literacy has a weight of two-thirds and enrolment one third. In calculating the overall
index, logarithms are utilised for the income component because “achieving a respectable
level of human development does not require unlimited income” (UNDP 2002). For each
component, a country is assigned a score based on where it is situated between a
maximum and minimum value for that component. Fixed minimum and maximum values
for each indicator have been established on the basis of what has been observed over the
past thirty years, and what is expected to be observed over the next thirty years (UNDP
1999).
Hence, the index for each component, except for income, is computed according to the
general formula:
- Min ( ) Index =Max ( ) - Min ( )
ii
X XX X
Where X = the component and i = the country
The index for income is calculated replacing X with ln X. The overall index is then the
arithmetic mean of the three components.

127
5.5.1 Acceptance of the HDI
Since its inception, the HDI has received widespread acceptance as a useful measure of
development. Cahill and Sanchez (2001) assert that the HDI has become the standard
way to compare levels of development, while Sagar and Najam (1998) indicate that the
HDI is an “important alternative to the traditional unidimensional measure of
development”.
While other development and composite indices have been produced, none have been
more enduring than the HDI. Notably, no other index has continued to be produced on an
annual basis nor has attracted the interest that the HDI has. Khusro (1999) states:
“The methodology of preparing the HDI goes a long way towards removing
many of the limitations which other indicators have and turns out to be the best
used until now for assessing an aggregate level of development for each country
and meaningful comparison with levels of other countries ….” (Khusro 1999 p.
88)
Crafts (1999) notes that the HDI has been “established as an important contribution to the
measurement of living standards” and embraced by economic historians who focus on
changes in welfare rather than production measures. Crafts (1999) used the HDI to
examine changes in living standards since 1870. Floud and Harris (1996) and Costa and
Streckel (1995) both utilised the HDI in empirical studies related to health. Eusufzai
(1996) utilised the HDI to examine the relationship between openness, economic growth
and development. Notably, openness in this study pertained to the elimination of trade
128
barriers rather than participation in the international economy. Further, Mazumdar (2002)
utilised the HDI to measure convergence in living standards between 1965 and 1995.
5.5.2 Criticisms of the HDI, subsequent changes and alternative indices
Despite its high level of acceptance as a means to measure development, the HDI has
received a large amount of criticism and recommendations for improvements. These
criticisms and suggestions for change fall into three main areas, specifically, construction
of the index, the components used, and the data collection methods employed. The
HDRO have responded to some criticisms, through modifying the HDI in subsequent
years, however, there are a number of criticisms that have not been addressed, some of
which are contradicted by various critics, and others which it would seem the HDRO
does not perceive a need to address.
Before examining the criticisms, it is notable that some broad statements of defence have
been made in response to criticisms of the HDI and development indices generally. For
example, Basu (2001) indicates that critics of the HDI have not appreciated the enormity
and ambition of generating a development index and “that some vagueness in target is
inevitable” for such a task, while Fukada-Parr (2001) states the HDI is representative of
development and is not intended to be totally representative of all aspects of
development, and the HDI and other development indices “are by no means the final
word on measuring human development.”
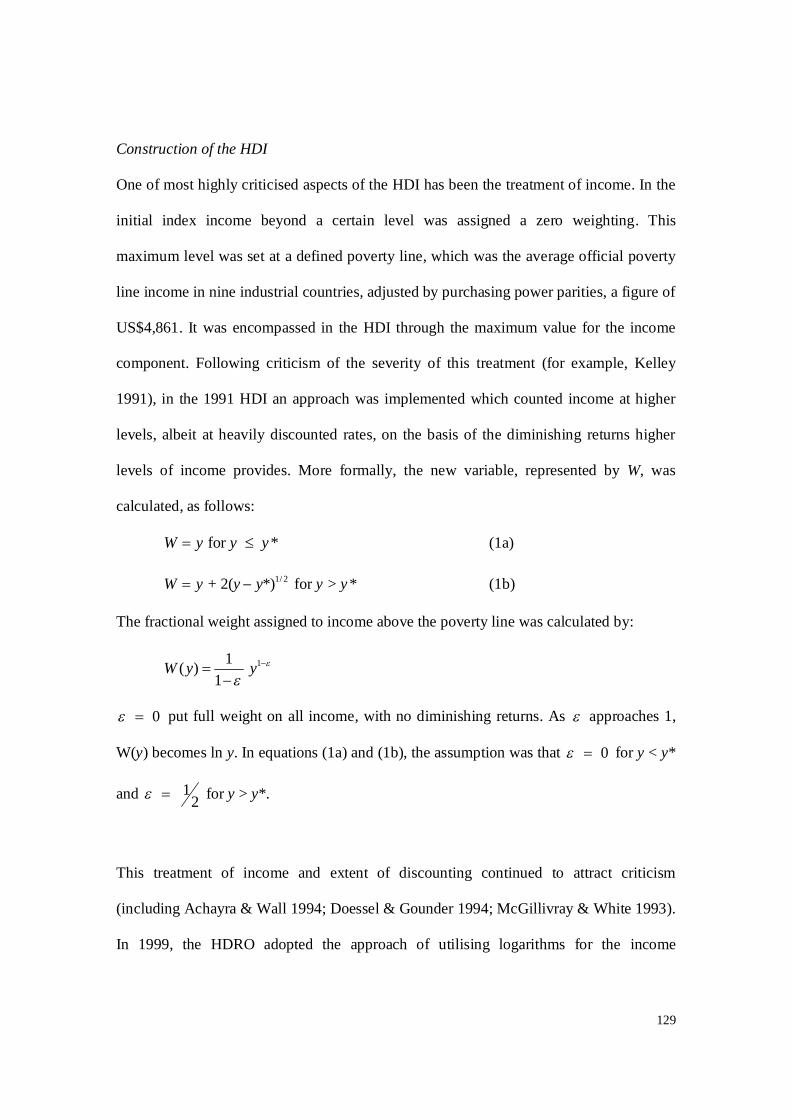
129
Construction of the HDI
One of most highly criticised aspects of the HDI has been the treatment of income. In the
initial index income beyond a certain level was assigned a zero weighting. This
maximum level was set at a defined poverty line, which was the average official poverty
line income in nine industrial countries, adjusted by purchasing power parities, a figure of
US$4,861. It was encompassed in the HDI through the maximum value for the income
component. Following criticism of the severity of this treatment (for example, Kelley
1991), in the 1991 HDI an approach was implemented which counted income at higher
levels, albeit at heavily discounted rates, on the basis of the diminishing returns higher
levels of income provides. More formally, the new variable, represented by W, was
calculated, as follows:
for *W y y y (1a)
1/ 2 + 2( *) for > *W y y y y y (1b)
The fractional weight assigned to income above the poverty line was calculated by:
11( ) 1
W y y
0 put full weight on all income, with no diminishing returns. As approaches 1,
W(y) becomes ln y. In equations (1a) and (1b), the assumption was that 0 for y < y*
and 1 2 for y > y*.
This treatment of income and extent of discounting continued to attract criticism
(including Achayra & Wall 1994; Doessel & Gounder 1994; McGillivray & White 1993).
In 1999, the HDRO adopted the approach of utilising logarithms for the income
130
component. This practice has continued in subsequent years. While the application of
logarithmic values is still a form of diminishing returns, its treatment to higher levels of
income is not as severe as previous treatments.
The second issue that attracted much attention in the early stages of the index, which has
since been remedied, is the selection of maximum and minimum values for each
component of the index. Initially, these values were determined on an annual basis based
on the highest and lowest values observed during that period. This practice was criticised
because it resulted in “moving goal posts” and it meant that a country’s HDI ranking
could change over time with the change unrelated to any actual changes in development
in that country (Kelley 1991). In 1994 the HDRO acknowledged the approach prevented
“meaningful comparisons over time” (UNDP 1994) and established fixed goal posts for
maximum and minimum values, based on the recommendations of Anand and Sen
(1993). The maximum and minimum values established were noted as not observed
values in the best or worst-performing countries but extreme values observed over the
past thirty years for minimum values, or expected to be observed over the next thirty
years for maximum values.
Another highly criticised aspect of the HDI has been the simple averaging utilised in the
construction of the index and the equal weighting applied to the components. A number
of reviews have suggested that weighting of the components is arbitrary and there is
limited justification for equal weighting (for example, Hicks, D. 1997; Khusro 1999;
Murray 1991; Palazzi & Lauri 1998). Hopkins (1991) stated that there is no a priori

131
rationale for adding the components that measure different aspects of development. It has
been acknowledged that subjective decisions tend to be required with such an index, but
is recommended that the subjectivity be made explicit to enable technical improvements
to the index (Noorbakhsh 1998a). In the 1993 HDR, the HDRO utilises principal
component analysis (PCA) to provide justification for equal weighting of components
(UNDP 1993). Noorbakhsh (1998b) also undertook analysis using PCA and concluded
“the equal weighting of the components is not very inappropriate.” Despite the HDRO
applying equal weights to the components of the HDI, this equal weighting is not
necessarily achieved due to the selection of the minimum and maximum values and the
application of diminishing returns to the income component.
A further criticism related to the construction of the HDI is that arithmetic averaging runs
counter to the notion of the components being essential and hence non-substitutable
(Chowdhury 1991; Kelley 1991; Sagar & Najam 1998). The implication is that a country
can mask a deficiency in one component with achievement in another component. This
issue is not only problematic but contrary to the UNDP’s own explanations of
development (Fukada-Parr 2001). In response to this problem, Sagar and Najam (1998)
suggested the overall index should be the product of the three composite indices, that is,
the index should be the geometric rather than the arithmetic mean of the components, in
order to reduce the impact of performance in one indicator offsetting performance in
another.
132
Some researchers have attempted to apply more complex techniques for constructing a
development index but the results have been highly correlated with the HDI. Bhatnagar
(2001a) utilised an alternative multi-step formulation of the utility function, but found
correlation between the existing HDI ranks and the corresponding revised ranks to be
very high. Del Valle Irala (1999) utilised multifactor analysis and weighted PCA to
calculate a new index but concluded “this analysis gives us an order very similar to the
(Tweeten & McGlelland)”. Nissan and Shahmoon (2001) proposed a metric based on
axioms of Euclidian distance, establishing an anchor point in three dimensional space
which becomes the standard against which countries are measured, but found “the
rankings are somewhat similar” (to the HDI) with the correlation between the two sets of
rank at 0.99.
An exception where an attempt to produce a modified index achieved some notable
difference to the original HDI was by Palazzi and Lauri (1998), who used a modified
development index to rank 175 countries in a single year. Their conclusion stated
“change in ranking is in many cases striking, and in our view significant”. The basis for
this conclusion was not a low correlation between indices, but rather that 93 of the 175
countries examined changed rank for the year (1997) examined, and for 30% of these
countries, rank changed by more than five places. The approach of Palazzi and Lauri
involved complex mathematical techniques and utilisation of PCA to define a line that
interpolated country points.
133
Other researchers who have developed alternative indices have continued to use
arithmetic averaging in the construction of indices, but have changed other index aspects,
such as the weighting of components. Paul (1996) developed a modified HDI which gave
achievements in the longevity / health and education components larger weightings at
higher levels, on the basis that an increase in the value of an indicator at a higher level
represents a greater achievement than an equal increase at a lower level. Kelley (1991)
proposed that income should receive a higher weighting in the index than the other
component on the basis that it increases people’s choices and achieves improvements in
the other components.
Adjusting only the income component of the HDI to reflect diminishing returns has
attracted criticism on the basis of suppressing differences in this component relative to
the other components in the index (Achayra & Wall 1994). Noorbakhsh (1998a) asserted
that diminishing returns applies to the educational components as well, since early units
of education are more valuable than later ones.
In defence of the criticisms made in relation to construction of the HDI, the simple
construction is one of the benefits of the HDI and one of the main reasons why it has
been widely accepted. As noted by Doraid (1997) the HDI has “the advantage of being
simple requiring basic statistical data and mathematical knowledge” and is easily
understood by non-specialists. Applying some of the more complex construction methods
discussed or introducing further weighting of components jeopardises the simple

134
construction of the index, and there is yet to be strong empirical evidence that would
justify such changes.
Index components
The second aspect of the HDI that has attracted some level of criticism is the components
included in the index. In defence of the three components utilised, they have been noted
as being the most important aspects of human development (Murray 1991) and “basic,
desirable elements irrespective of national heritage, wealth or religion” (Nissan &
Shahmoon 2001).
According to Smith (1991), it is more appropriate for countries to set their own standards
and objectives for development, based on relevant and specific measures, rather than
being measured by the indicators in the HDI. The obvious disadvantage to this approach
is that progress against other countries cannot be easily compared when countries set their
own standards. McGillivray and White (1993) suggest the physiological limits on life
expectancy and one hundred percent ceiling on literacy restrict the disparity that these
variables can display. The comparability of the indicators between countries has also
been questioned, when, for example, literacy standards involve learning different
languages, and schooling is vastly different amongst countries (Hopkins 1991; Murray
1991; Srinivasan 1994).
There is a group of economists that suggests human development can be represented by a
single indicator, such as GDP. The benefits of allowing development to be represented by

135
a single element, rather than a multidimensional index, are that data is more readily
available and issues related to construction of an index, such as use and weighting of
components, do not arise. Chowdhury (1991) found that the HDI is highly correlated with
its components, and can therefore be represented by any one of them including GDP per
capita. However, Khusro (1999) considered the correlation between the HDI and its
components as providing realism and acceptability to the index, rather than indicating it
is not required. More generally, McGillivray (1991) found “a systematic and positive
relationship” between GNP per capita and social and human welfare, and subsequently
concluded that development indices such as the HDI are not required. Kelley (1991)
suggested the HDI offers limited insights beyond those obtained by small modifications
to simple measures of economic output.
Ogwang (1994) supported measuring development by a single indicator rather than a
composite index such as the HDI, however, recommended identifying and utilising one
component which is most reflective of what is trying to be measured in order to avoid
many of the problems of the HDI. When Ogwang undertook analysis of the three
components of the HDI to determine a single variable to measure development by, it was
life expectancy rather than income which was identified as the most appropriate variable.
Calculations of correlations between the HDI and its components by critics of the HDI
have mainly been performed across many countries for a single time period, rather than
for a single country over an extended period. The high correlation between the HDI and
GDP per capita across several countries does not account for the experience of a single
136
country. There may be divergences for a single country based on how GDP is distributed
and utilised within that country and the priority the country places on social goals.
Anand and Sen (2000) stress the importance of how income is utilised in developing
countries. The 1999 HDR (UNDP 1999) indicated the correlation between GDP per
capita rank and human development rank is lowest for low human development countries,
the countries most likely to be the focus of development studies. This is consistent with
the findings of Islam (1995).
There have also been suggestions for the inclusion of additional components, which have
the potential to make the HDI more comprehensive and meaningful. Possibly, the most
recommended inclusion is a measure for distribution and equity (Anand & Sen 1993;
Hicks, D. 1997; Sagar & Najam 1998). Desai (1995) suggests the inclusion of social and
political freedom. There is also support for encompassing environmental aspects, such as
degradation and sustainability (Desai 1995a; Neumayer 2001; Sagar & Najam 1998).
Notably, there is divergence as to how environmental aspects could be added into the
index, which is explored further in Chapter 8.
The HDRO have noted the trade-off that exists between providing multi-faceted
representation of development, which potentially removes focus from the most critical
aspects of development and creating an index which is easy to interpret and use (Doraid
1997). This trade-off is recognised by Anand and Sen (2000):
137
“In so far as more variables are added… the already-included ones decline in
significance and emphasis. There is thus a real dilemma in choosing what to
include in the list.”
The difference to the index that the inclusion of additional indicators makes is also
questionable. Cahill and Sanchez (2001) calculated an alternative development index
which included thirty six indicators and concluded that the results were highly correlated
with the HDI and that “the HDI captures most of the information in the larger set of
indicators.” The evolution of composite measures of development over the past sixty
years further supports the inclusion of a lower number of indicators.
Data utilised within the HDI
The third area of criticism of the HDI pertains to the actual data utilised by the HDRO.
Much of the values are estimates, necessitated on the basis of censuses only taken in
many countries only every seven years (Murray 1991). Rates of mortality decline for
many countries are based on assumed models rather than actual data, with the result that
countries for which models are applied demonstrate similar levels of improvement.
Additionally, changes in education data are often estimations derived from income
changes. With respect to the income component, local estimates of GNP and GDP have
been shown to vary substantially from UNDP estimates. Srinivasan (1994) also makes
reference to the weakness of data, especially in developing countries due to incomplete
coverage, measurement errors and biases and indicates the extent of these problems are
not comparable across countries. Also problematic, is data capture and collection
138
methods employed in developing countries. Cahill and Sanchez (2001) state “Data for
developing countries in particular are often suspect, and using only a few series increases
the possibility that any given country is depicted incorrectly.” Hopkins (1991)
recommends spending financial resources and effort on improving the quality of data
than working on computational problems of the HDI.
5.6 Conclusion
This chapter has reviewed measures of development. It commenced with providing a
definition of development and an overview of the main ways in which development could
be measured. It then looked at the criticisms of utilising income to measure development,
before going on to examine the various multidimensional approaches that have been
implemented to measure development. The HDI is one such multidimensional approach.
Many of the approaches that preceded the HDI involved complex construction methods
and large numbers of variables. The HDI was first introduced in 1990 and has since
become a widely accepted composite index measure of development. One of the reasons
for acceptance of the HDI is its simplicity and ease of understanding. Despite this
acceptance, the HDI has attracted criticism and suggestions for improvement within the
areas of construction of the index, components included in the index and the data utilised.
These criticisms aside, the HDI has now been produced by the HDRO for almost two
decades, making it the most enduring measure of development. It has been noted that the
HDI provides the most value in comparing similar groups of countries, in terms of
development levels (McGillivray & White 1993), which aligns it with the purposes of the
current research. In Chapter 8, a modified development index will be created, based on
139
the HDI but taking into account some of the criticisms and suggestions identified in this
chapter. The next chapter discusses the methodology that will be followed in order to
further contribute to the body of knowledge pertaining to the experience of the poorest
developing countries in the international economy.
140
6 Methodology
6.1 Introduction
The previous chapters have reviewed the literature on globalisation, trade and investment
and measuring development. The purpose of this chapter is to present how the current
research contributes to the body of knowledge on the impact of globalisation on
developing countries. The actual analysis which will be undertaken contains a number of
components, for example, selection of countries, selection of a time period, and most
significantly determining how development should be measured. Each of these issues is
discussed in detail. A considerable part of this chapter is devoted to describing how
development will be measured, the decisions that need to be made and factors taken into
consideration in order to arrive at a useful measure of development.
6.2 Research design
6.2.1 Country selection
In light of the conflicting views within the literature on globalisation, this research sought
to understand the experience of two of the world’s poorest countries. The rationale for
choosing the world’s poorest countries is that through them, this research is able to
consider the experience of the world’s most disadvantaged people. The United Nations
designates world’s poorest countries as “Least Developed Countries” (LDCs). The vast
majority of these countries are in Africa and Asia.
141
Two countries, one from each of Africa and Asia were selected to be the focus for this
research. This made it possible to compare and contrast their experience. With the
countries being from different geographical areas, the implications of regional trends and
developments can be also considered. The two countries selected for research are
Bangladesh and Tanzania. These countries selected are vastly different in terms of
production and exports. Chapter 7 examines these countries in detail, with specific regard
to the transition they went through during the globalisation period. The chapter also
explores regional differences and trends observed for the LDCs as a group.
6.2.2 Period of study
After selecting countries, the next step of research design was to determine the period
over which data would be collected and analysed. Much of the literature points to the late
1980s as the commencement of the most recent period of globalisation. In light of this,
for the purposes of the current research the commencement for the most recent period of
globalisation was set at 1988. There is no indication that the most recent period of
globalisation has ended, although literature on the subject tapered off early in the new
millennium. Because the current research aims to understand if there has been a
difference in the experience of the subject countries during the globalisation period, the
end of the research period is set at the end of the Twentieth Century, or 1999. Thus, the
globalisation period for this research is defined as 1988 to 1999. This period captures
more than the first decade of the most recent globalisation period, and therefore will
enable comparison and contrast of the experience of the two countries to the period
preceding globalisation. The period preceding globalisation has been set at 1960 to 1987,
142
mostly because of the lack of reliable data prior to 1960. This period is considered large
enough to compare and contrast the globalisation period to.
6.2.3 Measuring globalisation
The first aspect of data collection involved determining how participation in the global
economy should be measured. In selecting a measure it was paramount to bear in mind
that the main economic components of globalisation are trade and investment. It was
considered that participation in international economic activity should be measured by
openness. Various models of openness have been developed, two commonly cited being
Leamer (1988) and Syrquin and Chenery (1989). These models, however, have largely
been designed to examine trade policies and the extent of protectionism, while the
purpose of this research is to measure participation in the international economy.
Additionally, as was discussed in Chapter 2, a significant part of globalisation is
investment flows, which are excluded from measures of trade.
In light of the absence of formally developed models that suit the specific purposes of the
current research, it was decided to adopt the same methodology as United Nations
Conference on Trade and Development (UNCTAD) in the World Investment Report (see
e.g., UNCTAD 2000). UNCTAD measures trade as the total of the values of export flows
plus import flows as a percentage of GDP, and investment as the total of the values of
FDI inflows plus FDI outflows as a percentage of GDP. Given that both trade and
investment are components of globalisation, the total of both will be used for this

143
research, though, analysis will be also undertaken as to how each of these changed during
the globalisation period, compared to the pre-globalisation period.
Trade data was sourced from the Penn World Tables (PWT) which were originally
developed by Summers and Heston (1991). The PWT is a set of national accounts
economic series covering a large number of countries. Efforts on the PWT commenced in
1954 and the version utilised for this research, Version 6.1, was published in October
2002 (Heston, Summers & Aten). The PWT are “the standard database on which
researchers around the world test their hypotheses concerning growth” (Dowrick 1994).
By 1994 the annual citation rate for the PWT was more than one hundred and increasing
on an annual basis. In addition to being utilised for measuring growth, the PWT has been
adopted for similar research to the current research, for example, Dina, Coondoo, et al.
(2000) utilised the PWT in their analysis of the relationship between environmental
degradation and per capita real income. Investment data was sourced from the UNCTAD
Foreign Direct Investment Database (UNCTAD).
6.2.4 Measuring the impact of globalisation on selected countries
The subject of this thesis is the impact of globalisation on human lives, or development,
in two of the world’s least developed countries.

144
Measuring Development
While one way to measure development is to use income as a proxy, there is a vast body
of knowledge referring to the inadequacy of utilising income to measure development,
along with the construction of models that are based on more relevant data, and / or
alternative measurements of development. A comprehensive literature review was
undertaken, along with considerable research into the most enduring means by which to
measure development, which the measure devised for this research was based on. This
literature review was presented in Chapter 5. A brief synopsis of the findings is presented
here, as these findings have defined the methodology for measuring development.
At the most elementary level, development could be measured by a single indicator,
adjusted versions of a single indicator, a group of indicators without combining the
individual indicators into a single indicator, or a composite index so that a number of
indicators are brought together into a single indicator.
Development, or the improvement of people’s lives, is very much a multi-faceted
phenomena. Prior to the emergence of development literature in the 1940s and 1950s, it
was measured with income as a proxy for advancement. As was discussed in Chapter 5,
this approach has attracted much criticism because although income is a means by which
the lives of people can be improved, there is not a direct correlation between income and
development, as the way income is distributed and spent also determines whether or not
the lives of people improve. Similarly, it is not appropriate to use one aspect of
development, such as health, as a proxy, because improvements in this single factor could

145
have been made at the expense of other factors. That there have been numerous attempts
to measure development by multiple factors provides further support for measuring
development by a single factor being an inferior approach. Moreover, measuring
development by an adjusted version of a single indicator does not capture the multi-
faceted nature of development, either.
The selection of a group of indicators without combining these indicators into a single
index is also problematic for measuring development. While selecting a group of
indicators acknowledges the multi-faceted nature of the development process, it is not
possible to determine if the population of a country is better or worse from examining a
group of statistics, unless all of the statistics move in the same direction, and researchers
that have adopted this approach, for example, the United Nations (1954), have not
attempted to draw such conclusions. Thus such an approach is not appropriate for the
current research which seeks to understand at an aggregate level if the lives of the
populations of the subject countries have been made better, worse or remained the same.
The third approach to measuring development is to produce a composite index, whereby
a number of different components representing aspects of development are combined into
a single index. Although the majority of approaches to measuring development and
associated factors, such as social well-being or quality of life, over the past forty years
have involved the construction of composite indices of some sort, the production of a
composite index has been criticised for various reasons, including that too many arbitrary
146
decisions must be made in constructing an index (for example, Gostkowski 1972). It is
the approach of a composite index which will be followed in this research.
Constructing a composite index
In constructing a composite index, the first decision to make is what factors should be
included to reflect the overall goal or purpose of the index. In the case of development,
two of the most fundamental factors are health and education. Health may be reflected in
the current state of health but also longevity of life. The UNDP use the term “to live a
long and healthy life” in referring to the health component of the HDI. Some researchers
have extended the number of factors to include other aspects such as political freedom,
however all researchers who have constructed composite indices have included measures
for both health and education. For the index constructed as part of this research, health
and education will be included, along with income, as a ‘catch all’ for other factors that
are difficult to measure. This approach is consistent with that of the UNDP in
constructing the HDI.
Following selection of the components that will be included in the index is the selection
of the actual indicators that will be used to measure these factors. A number of elements
are influential in this selection, including, the availability of data series that most
accurately reflect the purpose of the research and reliability of data in terms of
consistency of definition between countries and accuracy. Clearly, data must be available
– there is no point in selecting indicators for which data cannot readily be obtained for the
period of the study. Further, any indicator that is included must reflect the purpose of the

147
study. As an example, the World Development Indictors includes in the category of
health the total population. It is virtually impossible to infer anything about the quality of
health in a country purely by looking at changes in the number of people residing in a
country. Consistency of definition between countries is also significant if the index is
going to be used to compare countries, which is most relevant with education definitions
and how literacy is measured in different countries with different languages and what
constitutes primary and secondary education. Accuracy of data is also critical,
specifically, there should be confidence that data has been properly collected and
recorded and that an indicator is an accurate reflection of how a country is performing
with respect to what is being measured.
In light of the factors that need to be considered in including an indicator within a
composite index, it makes sense to keep the number of components to a minimum and to
only include time series that are clearly indicative of a change in the level of
development. For the purposes of the index used in this research, it was decided to select
only one indicator for each component. This is largely consistent with the HDI approach
of a small number of indicators, and also consistent with another composite indicator
commonly referred to in the literature, the Physical Quality of Life (PQLI) (Morris,
1979).
In selecting each component in the composite index the factors previously referred to
were considered, however, an additional element of responsiveness to change was also
considered. One criticism of the HDI is that the components are slow to change over time
148
(Doraid 1997) and given the purpose of this research is to examine the impact of
globalisation which has been defined by a relatively short time period of twelve years, it
was critical to review potential indicators to ascertain which were most responsive to
change.
After selection of appropriate indicators, consideration was given to how the components
would be represented in the index and how the index will be constructed. A fundamental,
and contentious, issue that arises with respect to index construction is how each
component will be weighted. In indices prior to the HDI, various weighting approaches
were tried, and the equal weighting of the components of the HDI has been criticised for
being arbitrary (for example, Chowdhury 1991). This being said, more complex models
of weighting have not produced conclusively superior results. Upon review of the equal
weighting of the HDI components, (Noorbakhsh 1998b) found that the equal weighting of
the components was not inappropriate. As an example of an attempt to develop a more
complex model of weighting, Hellwig (1972b) proposed mathematical models in
constructing a composite index to measure human resource development, and after
testing five different approaches to weighting concluded that weighting should be based
on the purpose of the analysis being conducted, which is to say that there is no “best”
approach to the issue of weighting.
Weighting comes into play for both the components of the index and the indicators used
to represent these components. That is to say, for example, if there were four
components, with each of these represented by four indicators, decisions would need to
149
be made as to the weight that is assigned to each component in the overall index, and also
to the weight each indicator had for its relevant component. This issue is simplified for
the current research, because each component of the composite index will only be
represented by a single indicator. Consistent with the approach of the HDI, each
component of the modified development index produced in this research will be assigned
equal weighting, which is essentially saying that the given measures of health, education
and income are equally important.
Before each component is weighted, it is necessary to convert each component into a
measure that can be encompassed within the overall index. This is necessary because
different raw data series cannot be aggregated, for example, the average years of
schooling for a nation cannot readily be combined with the nation’s mortality rate. An
approach to this issue is to establish “critical points” that represent key aspects of
accomplishment or otherwise for the series, and measure where individual countries sit
between these points for an indicator. The approach of critical points was pioneered by
Drewnowski (1970) and has been utilised in the most recent HDI. Drewnowski defined
critical points as representing characteristic levels of satisfaction of needs expressed by
an indicator, and defined the lowest point as a level whereby the need is not satisfied at
all, a middle point where the minimum accepted level is comparable to a poverty line,
and finally, the full satisfaction point where the level of satisfaction is fully adequate. The
HDI approach uses only two critical points of minimum and maximum levels for an
indicator. For the current version of the HDI, these amounts are fixed values based on
previously observed values and on values that are expected to be observed over an
150
extended time period. The rationale for this approach is that it provides fixed goal posts
to measure a country’s movement between. A similar approach has been adopted for the
current research, with the fixed values taken from observed values of the chosen
indicators. Each country is ranked between zero and one for each component based on
where it lies between the established critical points.
The most basic way to construct an index is to derive an unweighted arithmetic average,
to enable each country’s rating to be a value between zero and one. This approach has
been criticised for its simplicity, and because it enables positive movement in one
indicator to offset negative movement in another (for example, Kelley 1991). Despite
these criticisms and attempts to develop more complex models, there is an absence of
accepted alternatives. One element that is considered in the current research is the impact
of constructing the composite index via geometric rather than arithmetic mean. The
rationale for calculating the geometric mean is that it reduces the impact of performance
in one indicator offsetting performance in another (Sagar & Najam 1998). In response to
some of the criticisms of the HDI, which are explored in Chapter 7, inclusion of a
measure of inequality into the index being constructed was investigated. Similarly, given
that some of the globalisation arguments focus on adverse environmental impact,
consideration was also given to including an environmental indicator within the
composite index.

151
6.2.5 Data analysis
Following the construction of indices via both arithmetic and geometric means, the
correlation coefficients between the two indices are examined to determine if it is
acceptable to proceed using only one of resultant indices. If there is a high level of
correlation, then only the index constructed via arithmetic mean for each country will be
further analysed. Secondly, the correlation coefficients between the components of the
index and the index itself are calculated to ascertain the correlation between components,
and the correlation of the components to the overall index. The rationale for this analysis,
firstly, is to understand how the components have moved in relation to each other, and
secondly, because the components of the HDI are highly correlated with the composite
index (Chowdhury 1991) and it will be interesting to establish if the same trend exists
with the composite index that has been produced within this research. This analysis will
be further broken down to ascertain if different trends were observed during the
globalisation period, to what was observed within the globalisation period.
Following the analysis of the structure of the resultant development index, analysis will
be undertaken as to how the index moves over time in comparison with the measure of
openness for each country. Widely utilised econometric techniques will be utilised in the
analysis, including tests for cointegration and Granger causality. The purpose of this
analysis is to ascertain, firstly, if there is any relationship between openness and
development, and secondly, if a relationship exists, the nature of the relationship, and
more specifically whether openness precedes development. This will shed light on
whether the impact of participating in a globalised economy has been positive or negative
152
for development, while consideration of openness will shed light on whether the two
countries that are the subject of this research have been impacted or by-passed by the
most recent period of globalisation.
6.3 Conclusion
This chapter has presented the methodology for this research. It has explained the
relevance of the literature reviewed in the past three chapters and provided an
understanding of the analysis which will be undertaken and discussed within the
remaining chapters. In summary, the design of this research has encompassed selection of
how globalisation will be measured and the time period over which globalisation will be
measured. It has also involved establishing a period of time prior to globalisation so that
what is observed during the globalisation period can be better understood as either being
distinct or a continuation of earlier trends. A second aspect of the research design has
been the selection of subject countries. Bangladesh and Tanzania have been chosen,
largely because of the regions that these two countries are located in, and because both
countries are recognised as being amongst the world’s poorest countries. Finally, a major
component of this research is the generation of a new means by which to measure
development. This chapter has presented the stages to generate this new measure of
development, and how it will be utilised to assist in the understanding of the impact of
globalisation on the selected countries. It has also outlined how the measures of openness
and development will be analysed for the purposes of achieving the research objectives,
set in Chapter 1. In the next chapter Bangladesh and Tanzania are examined in detail.
153
7 Bangladesh and Tanzania
7.1 Introduction
The purpose of this chapter is to review the two countries which are the subject of this
study. The chapter commences with a brief overview of LDCs and their performance
during the late Twentieth Century. The chapter then moves on to consider the regions in
which each of the countries is located, and differences in the economic and trade
performance of the regions is discussed and explored. Following on from this, the
countries are examined in detail. Some of the factors that are considered pertain to
economic performance in the period prior to globalisation, changes during globalisation,
domestic reform programmes undertaken, changes in export patterns in terms of volume,
value, specific exports and trading partners, and foreign investment. The experience of
each country is compared and contrasted. Understanding each country, the regions in
which they are located and the broader economic group in which they are designated will
assist in interpreting results of the quantitative research which is undertaken in
subsequent chapters of this thesis. It also provides some empirical evidence to support or
contradict the literature that has been reviewed in earlier chapters, in relation to economic
theory and globalisation.
7.2 Least Developed Countries
The LDCs are, put simply, the world’s poorest countries. There are currently fifty LDCs
of which thirty-four are located in Africa, fourteen in Asia and the Pacific region and one
154
in each of Western Asia and the Caribbean (United Nations). LDCs are designated by the
United Nations. These countries are characterised by low income, weak human assets and
economic vulnerability (UNCTAD 2007). LDCs are reasonably well integrated in the
international economy. During 1997-1998 exports and imports represented on average
43% of GDP for these countries, which is comparable to the world average (UNCTAD
2002b).
The poorest LDCs suffer from primary commodity dependence. Since 1960 there has
been a long-term downward trend in non-oil commodity prices, which means that
incomes for the LDCs with primary commodity dependence have declined (UNCTAD
2002b). The situation is further exacerbated because these LDCs typically have a narrow
range of exports, and therefore any movement in the prices of the commodities which are
exported are severely felt. Globalisation has adversely affected LDCs though reinforcing
exposure to a narrow range of commodities and making it difficult for LDC producers to
participate in global markets. The trends that have been evidenced during the most recent
period of globalisation, as outlined in Chapter 2, have made it increasingly difficult for
producers from LDCs to participate in international economic activity. Between 1980 and
2000, the group of LDCs lost ground both in terms of their contribution to overall world
exports, and to the exports of developing countries, as depicted in Figure 7.1. LDC
exports fell from 0.75% of world exports to 0.59% between 1980 and 1999, but fell to a
low of 0.44% in 1992 and 1993. During the same period, LDC exports fell from
representing 2.56% to 1.83% of developing country exports.
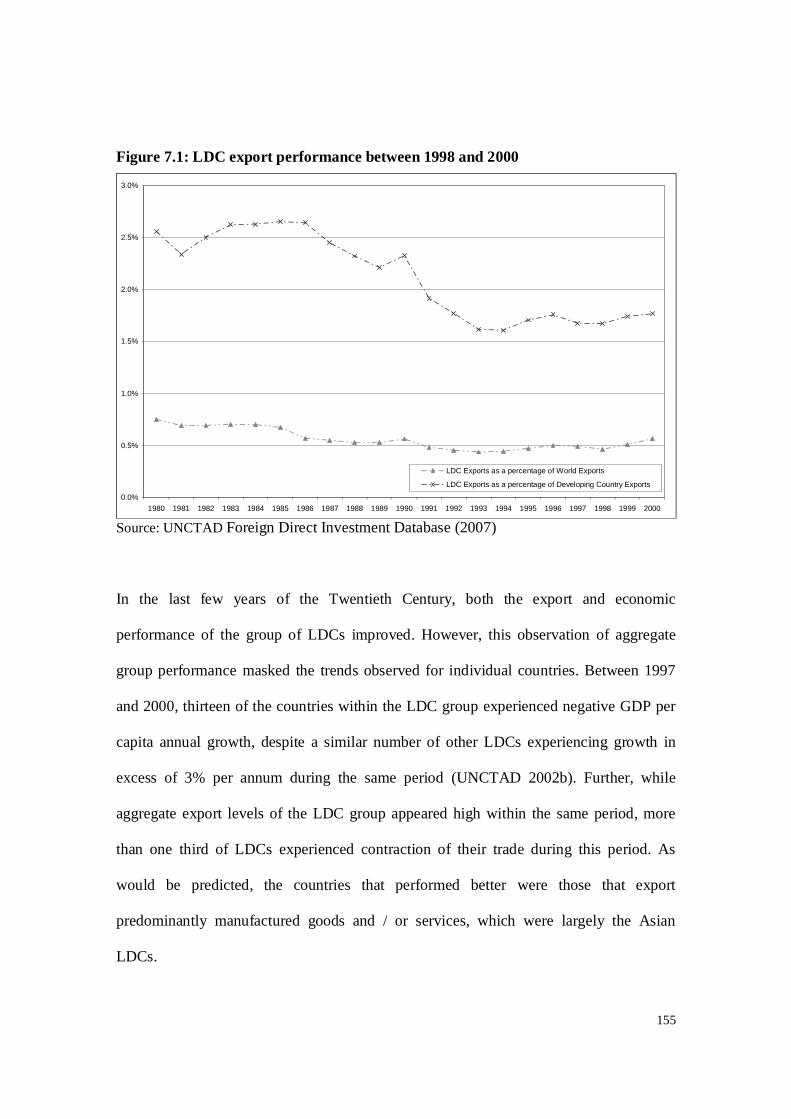
155
Figure 7.1: LDC export performance between 1998 and 2000
0.0%
0.5%
1.0%
1.5%
2.0%
2.5%
3.0%
1980 1981 1982 1983 1984 1985 1986 1987 1988 1989 1990 1991 1992 1993 1994 1995 1996 1997 1998 1999 2000
LDC Exports as a percentage of World Exports
LDC Exports as a percentage of Developing Country Exports
Source: UNCTAD Foreign Direct Investment Database (2007)
In the last few years of the Twentieth Century, both the export and economic
performance of the group of LDCs improved. However, this observation of aggregate
group performance masked the trends observed for individual countries. Between 1997
and 2000, thirteen of the countries within the LDC group experienced negative GDP per
capita annual growth, despite a similar number of other LDCs experiencing growth in
excess of 3% per annum during the same period (UNCTAD 2002b). Further, while
aggregate export levels of the LDC group appeared high within the same period, more
than one third of LDCs experienced contraction of their trade during this period. As
would be predicted, the countries that performed better were those that export
predominantly manufactured goods and / or services, which were largely the Asian
LDCs.
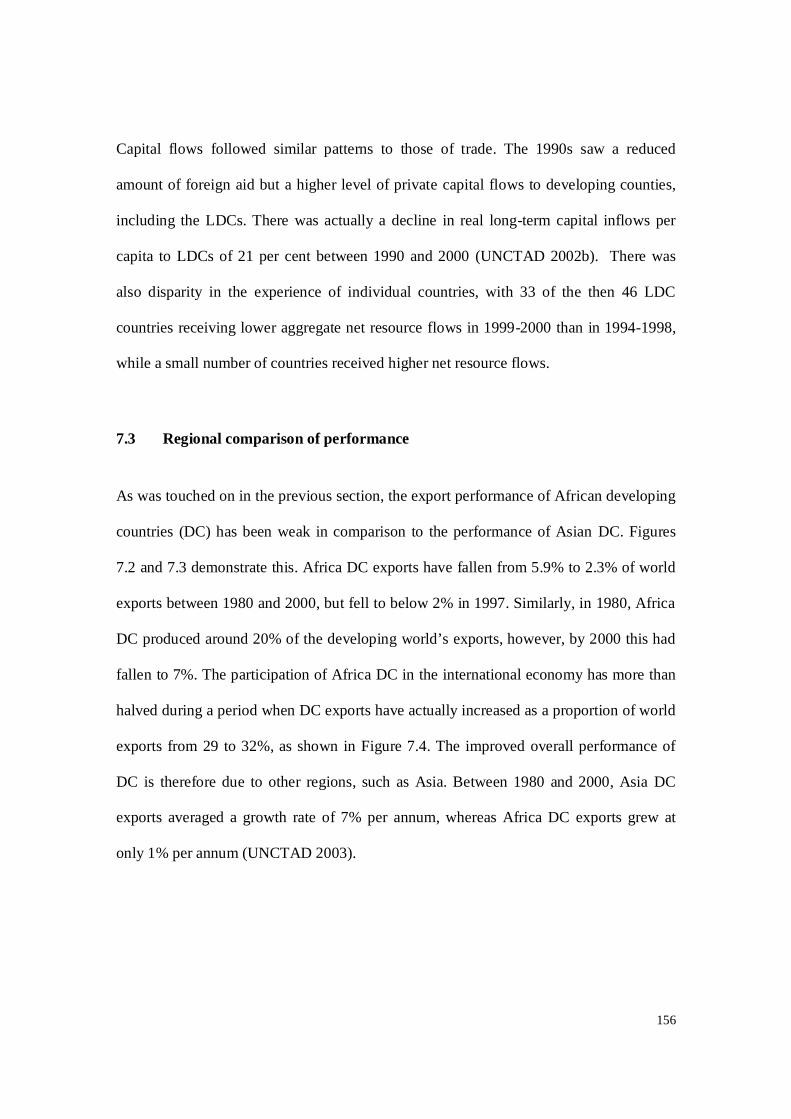
156
Capital flows followed similar patterns to those of trade. The 1990s saw a reduced
amount of foreign aid but a higher level of private capital flows to developing counties,
including the LDCs. There was actually a decline in real long-term capital inflows per
capita to LDCs of 21 per cent between 1990 and 2000 (UNCTAD 2002b). There was
also disparity in the experience of individual countries, with 33 of the then 46 LDC
countries receiving lower aggregate net resource flows in 1999-2000 than in 1994-1998,
while a small number of countries received higher net resource flows.
7.3 Regional comparison of performance
As was touched on in the previous section, the export performance of African developing
countries (DC) has been weak in comparison to the performance of Asian DC. Figures
7.2 and 7.3 demonstrate this. Africa DC exports have fallen from 5.9% to 2.3% of world
exports between 1980 and 2000, but fell to below 2% in 1997. Similarly, in 1980, Africa
DC produced around 20% of the developing world’s exports, however, by 2000 this had
fallen to 7%. The participation of Africa DC in the international economy has more than
halved during a period when DC exports have actually increased as a proportion of world
exports from 29 to 32%, as shown in Figure 7.4. The improved overall performance of
DC is therefore due to other regions, such as Asia. Between 1980 and 2000, Asia DC
exports averaged a growth rate of 7% per annum, whereas Africa DC exports grew at
only 1% per annum (UNCTAD 2003).
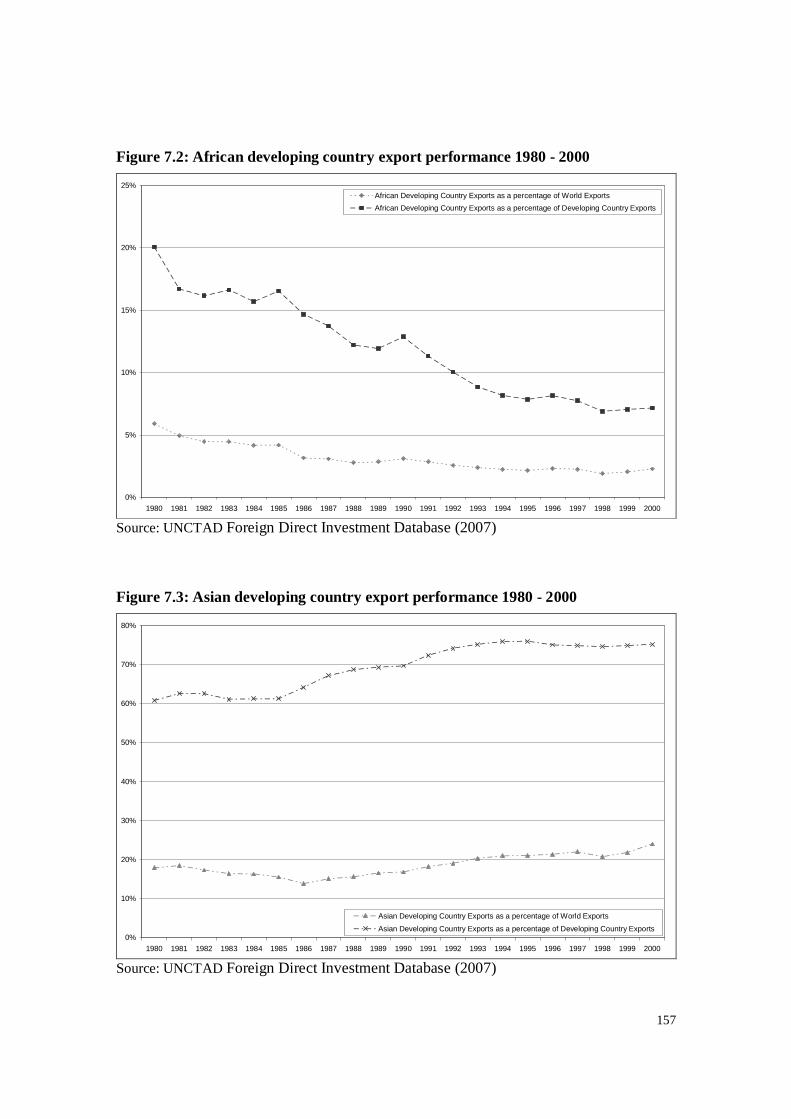
157
Figure 7.2: African developing country export performance 1980 - 2000
0%
5%
10%
15%
20%
25%
1980 1981 1982 1983 1984 1985 1986 1987 1988 1989 1990 1991 1992 1993 1994 1995 1996 1997 1998 1999 2000
African Developing Country Exports as a percentage of World ExportsAfrican Developing Country Exports as a percentage of Developing Country Exports
Source: UNCTAD Foreign Direct Investment Database (2007)
Figure 7.3: Asian developing country export performance 1980 - 2000
0%
10%
20%
30%
40%
50%
60%
70%
80%
1980 1981 1982 1983 1984 1985 1986 1987 1988 1989 1990 1991 1992 1993 1994 1995 1996 1997 1998 1999 2000
Asian Developing Country Exports as a percentage of World Exports
Asian Developing Country Exports as a percentage of Developing Country Exports
Source: UNCTAD Foreign Direct Investment Database (2007)
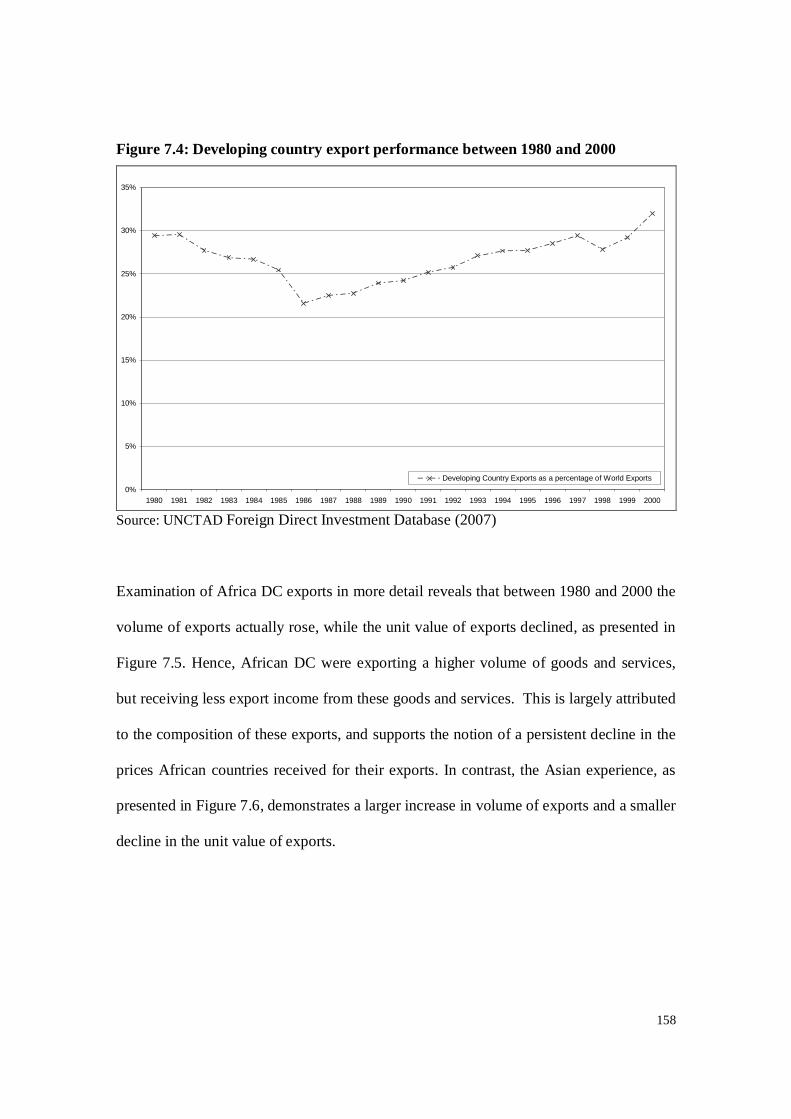
158
Figure 7.4: Developing country export performance between 1980 and 2000
0%
5%
10%
15%
20%
25%
30%
35%
1980 1981 1982 1983 1984 1985 1986 1987 1988 1989 1990 1991 1992 1993 1994 1995 1996 1997 1998 1999 2000
Developing Country Exports as a percentage of World Exports
Source: UNCTAD Foreign Direct Investment Database (2007)
Examination of Africa DC exports in more detail reveals that between 1980 and 2000 the
volume of exports actually rose, while the unit value of exports declined, as presented in
Figure 7.5. Hence, African DC were exporting a higher volume of goods and services,
but receiving less export income from these goods and services. This is largely attributed
to the composition of these exports, and supports the notion of a persistent decline in the
prices African countries received for their exports. In contrast, the Asian experience, as
presented in Figure 7.6, demonstrates a larger increase in volume of exports and a smaller
decline in the unit value of exports.

159
Figure 7.5: African developing countries – value and volume of exports (base year 2000)
0
20
40
60
80
100
120
140
1980 1981 1982 1983 1984 1985 1986 1987 1988 1989 1990 1991 1992 1993 1994 1995 1996 1997 1998 1999 2000
African Developing Countries Unit Value Index of Exports
African Developing Countries Volume Index of Exports
Source: UNCTAD Foreign Direct Investment Database (2007)
Figure 7.6: Asian developing countries – value and volume of exports (base year 2000)
0
20
40
60
80
100
120
140
1980 1981 1982 1983 1984 1985 1986 1987 1988 1989 1990 1991 1992 1993 1994 1995 1996 1997 1998 1999 2000
Asian Developing Countries Unit Value Index of Exports
Asian Developing Countries Volume Index of Exports
Source: UNCTAD Foreign Direct Investment Database (2007)
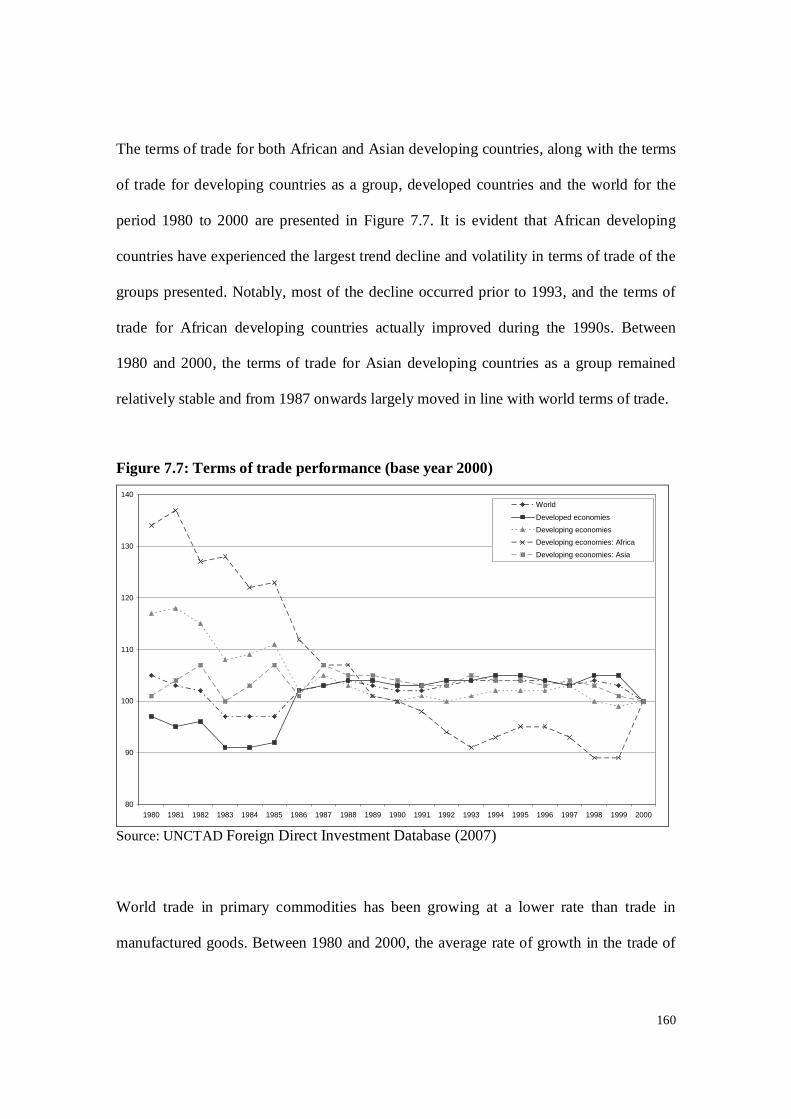
160
The terms of trade for both African and Asian developing countries, along with the terms
of trade for developing countries as a group, developed countries and the world for the
period 1980 to 2000 are presented in Figure 7.7. It is evident that African developing
countries have experienced the largest trend decline and volatility in terms of trade of the
groups presented. Notably, most of the decline occurred prior to 1993, and the terms of
trade for African developing countries actually improved during the 1990s. Between
1980 and 2000, the terms of trade for Asian developing countries as a group remained
relatively stable and from 1987 onwards largely moved in line with world terms of trade.
Figure 7.7: Terms of trade performance (base year 2000)
80
90
100
110
120
130
140
1980 1981 1982 1983 1984 1985 1986 1987 1988 1989 1990 1991 1992 1993 1994 1995 1996 1997 1998 1999 2000
World
Developed economiesDeveloping economiesDeveloping economies: AfricaDeveloping economies: Asia
Source: UNCTAD Foreign Direct Investment Database (2007)
World trade in primary commodities has been growing at a lower rate than trade in
manufactured goods. Between 1980 and 2000, the average rate of growth in the trade of

161
primary commodities was only one-third of the annual growth rate of world trade in all
products (UNCTAD 2003). In 1980, 75% of developing country exports were agricultural
commodities. During the following twenty years, the pattern changed such that by the
turn of the century developing country exports comprised 70% of manufactured goods
(UNCTAD 2003). African developing countries, however, did not follow this pattern,
with their manufacturing exports increasing from 20 to only 30% of total exports between
1980 and 2000. Exports of this group remained predominantly primary commodities. In
2000, Africa produced less than 1% of the world’s manufactured exports, and had a
growth rate of manufactured goods which was less than half the growth rate of Asia’s and
Latin America’s growth rate for manufactured goods (UNCTAD 2003).
In the trade of agricultural commodities, Africa lost market share to producers in both
developed and other developing countries during the last decade of the Twentieth
Century. For example, market share of cocoa, tea and coffee was lost to producers in Asia
and Latin America and market share of cotton and sugar was lost to producers in the US
and Europe (UNCTAD 2003). Some of the lost market share can be attributed to
subsidies and other protectionist policies implemented by competitors and importing
countries. A further issue was a change to the type of agricultural commodities which
were being traded, with non-traditional commodities such as fish and seafood and some
types of fruit and vegetables being increasingly demanded. Such commodities typically
have higher income elasticities of demand than traditional commodities and lower rates
of protection in developed countries. Traditional commodity exports also faced
competition from the introduction of substitutes, for example, the introduction of
162
synthetic fabrics reduced demand for cotton. Finally, commodities were increasingly
differentiated in terms of quality, country of origin and environmental and social
conditions of production. All of these changes in the nature of commodity exports were
disadvantageous for African commodity producers. Thus, Africa lost ground in
traditional exports, combined with an inability to diversify according to global demand.
Part of the reason why African countries were unable to diversify was due to structural
constraints. Agricultural productivity remained low as a consequence of land tenure,
small-scale farming, low levels of technology and government investment, and the lack
of promotion of innovation. Infrastructure in African countries was typically poor with
underdeveloped road and rail networks, unreliable communication systems and
information technology not readily available. Agricultural producers were unable to
obtain access to finance, logistics, capital resources and skills that producers in other
continents were able to access. Further, the private sector in many African economies was
not well developed and as a consequence, domestic producers did not face the same
competitive pressures as producers in other economies. A further problem was that the
narrow range of exports each African country tended to be reliant upon, resulted in
exposure to instability of commodity prices and supply-side shocks, such as weather
conditions. These constraints meant that inroads to changing commodity exports to meet
the changing nature of global demand were largely not been able to be made. Some of the
other problems experienced by African countries pertained to poor health, as a
consequence of AIDS and Malaria, and high levels of external debt, which required
servicing and repayment.
163
7.4 Country review
7.4.1 Geography and population
Geography
Bangladesh is located in South Asia, on the northern coast of the Bay of Bangal and has a
land area of approximately 147 square kilometres. It is surrounded by India with a small
common border with Myanmar in the southeast. Tanzania is located on the east coast of
Africa and has a land area of 886 square kilometres, with a coastline of 1,424 km. It
includes mainland and the islands of Mafia, Pemba, and Zanzibar. Neighbouring African
countries are Uganda, Kenya, Burundi, Rwanda, Congo, Mozambique, Zambia, and
Malawi.
Population
Bangladesh is one of the world’s most densely populated countries. Between 1988 and
1999, population density increased from 720 people per square kilometre to around 880
people per square kilometre. During the same period the annual population growth fell
from 2.28% to 1.61% (The World Bank 2001). These growth rates were lower than the
years preceding the study and were a consequence of government efforts to control
population growth. During the period of the study, population rose from 106 to 128
million people. The proportion of the population under 15 fell from 45% to 39%, with
this change being picked up by the age group between 15 and 64. The proportion of the
population over 65 remained static for the period, at 3%.
164
In comparison to Bangladesh, Tanzania has a much lower population density, which
increased from 27 to 37 people per square kilometre between 1988 and 1999 (The World
Bank 2001). The annual population growth rate decreased from 3.14% to 2.44% during
the period of study. The fall in population growth rate was largely attributed to disease
prevalence, specifically AIDs and Malaria, rather than conscious actions by the
government to control population growth. During the period of study, the Tanzanian
population rose from 24 to 33 million. For Tanzania, the population under 15 remained
static at 46% of the population, as did the proportion of the population over 65 at only 2%
of the population.
7.4.2 Health and education
Health
Table 7.1 presents changes of some of the main health indicators for each country during
the period of study. These indicators assist in explaining the population trends observed
in the previous section. The crude death rate fell in Bangladesh between 1990 and 1999,
from 12.4 to 9.1 deaths per 1,000 people, reflecting an improvement in health. During the
same period, the crude death rate rose in Tanzania from 13.6 to 16.7 deaths per 1,000
people (The World Bank 2001), due largely to AIDS and Malaria. The crude birth rate
fell in each country. In Bangladesh this can be attributed to the increased prevalence of
contraception. Infant mortality and under 5 mortality rates fell in both countries, although
the decrease was much larger in Bangladesh than in Tanzania. Adult mortality rates fell
in Bangladesh, but rose in Tanzania, during the period of study, largely reflecting
mortality attributable to the diseases mentioned previously. Life expectancy rose by 6

165
years for Bangladesh, however, fell by 5 years for Tanzania, from a lower starting
position. Adverse economic conditions and balance of payment constraints adversely
affected the provision of health services in Tanzania during the 1990s (EIU 2001b).
Table 7.1: Bangladesh and Tanzania health indicators
Bangladesh Tanzania
1990 1999 1990 1999
Death rate, crude (per 1,000 people) 12.4 9.1 13.6 16.7
Birth rate, crude (per 1,000 people) 32.7 28.0 43.8 40.0
Mortality rate, adult, female (per 1,000 female adults) 308.2 290.0 373.3 500.0
Mortality rate, adult, male (per 1,000 male adults) 321.7 276.0 444.3 542.0
Mortality rate, infant (per 1,000 live births) 90.6 61.2 114.8 94.8
Mortality rate, under-5 (per 1,000 live births) 136.0 89.0 175.0 152.0
Life expectancy at birth, total (years) 54.7 60.7 50.1 45.0
Education
The adult illiteracy rate in both Bangladesh and Tanzania declined during the period of
the study. For Bangladesh, the adult illiteracy rate fell from 65.8% to 59.2% between
1989 and 1999. Similarly, in Tanzania, the adult illiteracy rate fell from 37.5% to 25.3%
(The World Bank 2001). Hence, Tanzania started with a much lower adult illiteracy rate
than Bangladesh, and made a larger improvement during the period.
In Bangladesh, there are large disparities in literacy rates between urban and rural and
male and female populations (EIU 2001a). The government is the main provider of

166
educational services in the primary sector, while secondary education is largely provided
by private schools. Since 1993, education has been universal, compulsory and free.
Primary school enrolment increased markedly during the 1990s with the number of
primary school children growing from 12 million in 1990 to 17.7 million in 2000 (The
World Bank 2001). Notably, however, less than half of children complete five years or
more of primary education.
Tanzania has placed a high priority on education since the 1960s, as part of the socialist
philosophy. Education has been free and officially compulsory (EIU 2001b). Due to
economic conditions total primary school enrolment fell during the 1980s and early
1990s, but increased in the second half of the 1990s. Government spending on education
increased during the second half of the 1990s.
7.4.3 Resources
Natural resources
Bangladesh has rich and fertile soil. In 1999, 61.4% of land was arable, down from
70.6% in 1989 (The World Bank 2001). The amount of arable land in 1999 was slightly
less than 8 million hectares. Around 30% of arable land in Bangladesh is subject to
serious flooding (EIU 2001a). The proportion of cropland that was irrigated in
Bangladesh increased from 29% to 46% between 1989 and 1999. Urbanisation reduced
the land available for cultivation, and by 2000 there was limited additional land which
could be brought into production. Bangladesh is poor on non-energy minerals, and the
main energy resource is natural gas.
167
Despite Tanzania having a much larger land area than Bangladesh, it has had a smaller
amount of arable land. The percentage of land considered to be arable increased from just
3.94% to 4.24% of land between 1989 and 1999. The total amount of arable land in 1999
was 3.75 million hectares, less than half that of Bangladesh. The proportion of this land
that was irrigated remained static at around 3.3% between 1989 and 1999. Tanzania has
substantial mineral resources including nickel, iron, coal, gold, diamonds and other
gemstones. It also has petroleum deposits and natural gas.
Infrastructure
In the late 1980s, infrastructure was relatively underdeveloped in Bangladesh.
Throughout the 1990s considerable improvement was made on the infrastructure
especially the road network. Between 1991 and 2000, the road network grew from 14,104
km to 20,958 (EIU 2001a). The use of rail transport declined during the period of study
as freight and passengers were increasingly transported by road. Waterways, the main
means of organised transport in 1990, diminished in use for transportation during the
period of study, but remained important for some of the remote parts of the country. In
1990 Bangladesh had two major sea ports and a number of smaller ones.
Telecommunications and postal services remained underdeveloped throughout the period
of the study, and in 2000 Bangladesh had one of the lowest telephone densities in the
world. Local press was reasonably well developed in the late 1980s, and did not change
much during the period of study.

168
The infrastructure of Tanzania was largely underdeveloped during the period of study.
Historically, there has been underinvestment in infrastructure in Tanzania, although in the
1990s donor-led investment resulted in improvement to infrastructure, including the road
network. In 2000, the country had 10,000 km of main roads, but was in the process of
creating a further 3,000 km of new main roads. In addition, there were a further 70,000
km of minor roads. In comparison in 1990, there was 55,900 km of roads of which only
2,660 were bitumised. In 1999 Tanzania had approximately 2,600 km of rail network
which had not changed during the period of study. The rail network was considered to be
in relatively poor condition (EIU 2001b). Also in 1999 Tanzania had three international
airports and four major harbours, which was the same as in 1990. The ports of Tanzania
serviced cargo for land-locked African countries, in addition to servicing cargo for
Tanzania. Postal and telecommunication services were poor for the duration of the study.
A number of newspapers emerged during the 1990s, and a television service was
introduced. Radio was the predominant means of mass communication.
Energy
In Bangladesh in 1999, there was a lack of reliable electricity supply, which was a
deterrent to foreign investment. Gas is the main energy resource in Bangladesh and there
are large natural reserves. In 1999 approximately half of the gas extracted was used for
power generation, with the remainder being used for fertiliser production, household
cooking and other industrial uses. Commercial energy consumption was among the
lowest in the world throughout the period of study. Around 85% of households had no
electricity in 2000, less than 60% of electricity was being paid for and system losses were

169
around 37% of electricity generated. In 2000 some 3.23 million tonnes of oil was
imported, in comparison to just under 2 million tonnes in 1989. Households without
access to other energy supplies relied on fuelwood (EIU 2001a).
Tanzania met around 90% of its energy needs by biomass fuels, particularly wood in
2000. Petroleum and electricity accounted for 8% of energy needs and coal and other
energy sources for less than 1%. This pattern was consistent throughout the period of
study. Households predominantly used biomass fuels, while the commercial sector
utilised the other fuel types. Some hydroelectric power was generated, which was
dependent on erratic rainfall. Tanzania was able to meet around 35% of its demand for
petroleum from domestic sources, while importing the remainder. Coal was also
produced domestically.
7.4.4 The economy
Recent economic history including reform programs
Both Bangladesh and Tanzania undertook economic reform during the 1980s. This
section reviews the circumstances that led to the programs being introduced and the
reforms that were introduced. The following section examines the economic performance
of each country after implementation of reforms.
Bangladesh became independent from Pakistan in 1971. The war of independence
resulted in a period of economic instability, however recovery occurred toward the end of
the 1970s, along with both economic and political stability. A significant reform program

170
was implemented from the 1980s in order to foster market-lead, export-oriented growth
(Muqtada, Singh & Ali Rashid 2002). The key reforms implemented pertained to
macroeconomic stabilisation, fiscal control, balance of payment control, structural
adjustment reforms, productivity growth in agriculture and improving the business
environment (ODI 2005). Macroeconomic stability involved controlling inflation and
inflationary expectations, and limiting government borrowing. Domestic revenue and
public expenditure were kept low. The balance of payments improved as a consequence
of success of non-traditional exports in the form of ready-made garments. Remittance
receipts also grew. Bangladesh only made use of concessional lending, which assisted in
avoiding debt problems. Controls were removed on domestic prices and investment, and
foreign investment was encouraged in the areas of telecommunication and natural gas.
State-based monopolies in financial services and agricultural input supply and marketing
were abolished. Productivity in agriculture rose through improved seed and fertiliser
technology and irrigation, which increased the cropping intensity of land. Improvements
in the business environment enabled the garment industry to grow, for example, through
factor markets channelling capital, business skills and labour supplies to the industry.
New enterprises grew as a consequence of low barriers to entry. Export Process Zones
(EPZs) were established in order to encourage foreign investment (EIU 2001a).
Tanzania became independent from the UK in 1961. At the time of independence, the
economic policies which were implemented during colonialism continued to be followed.
In the late 1960s Tanzania implemented a socialist strategy, with the government taking
control of most aspects of economic activity, including finance, trade and price setting. A
171
key aspect of the socialist strategy was the establishment of villages to promote co-
operative agriculture. This was a significant step as the majority of Tanzania’s population
worked in subsistence farming. Economic performance deteriorated during the 1970s and
the first half of the 1980s, and by the mid 1980s, economic performance was at its lowest
since independence. The cause of the crisis was considered to be the macroeconomic
environment and central control of economic activity (Government of the United
Republic of Tanzania & The World Bank 2002). The crisis was evidenced across a
number of aspects of the economy including production and output, the agricultural
sector, balance of payments, foreign exchange, inflation, infrastructure, interest rates and
the public sector. More specifically, between 1980 and 1985 GDP growth averaged 1 per
cent per annum, and GDP per capita growth was negative. Poor agricultural sector
performance resulted in food shortages and declining volumes of traditional commodity
exports. Balance of payments issues arose as a consequence of declining export volumes
and export prices, rising import prices and debt-servicing obligations. The currency was
overvalued and there was shortage of foreign exchange. Inflation was rising, as was the
budget deficit, the latter caused by government borrowing. Social and physical
infrastructure declined as the government was financially unable to maintain it. Aid flows
declined or foreign aid donors withdrew support, largely because of the socialist reforms
which had been implemented and the government’s refusal to compromise on these
reforms.
In response to the crisis, the Tanzanian government implemented two successive internal
stabilisation programs in 1981 and 1982, to restore growth and improve agricultural
172
output. These programs were of limited success, because they did not address the
structural issues of the economy, or achieve a satisfactory level of foreign exchange. In
1986 a more comprehensive reform program was put in place with the assistance of the
World Bank and the international Monetary Fund (IMF). One of the key aspects of the
program was dismantling the state-controlled enterprises. By 1989, some improvements
were evidenced, GDP growth improved to around 4% per annum, which was largely the
result of improvements in agriculture, but also improvements in industrial output and
trade. Manufacturing utilisation improved and exports increased. Despite the
improvements evidenced, economic growth continued to be limited by a number of
factors including inadequate investment in infrastructure, high inflation, weak balance of
payments, a declining trend in the provision of social services, and weakness in the
systems that supported agricultural production. A subsequent program was commenced to
continue the progress that was being made and address some of the gaps that remained.
The result of this program was also mixed, for example, inflation improved but
agricultural performance declined. Reform programs continued throughout the 1990s
with the assistance of the IMF, with the objectives of macroeconomic stabilisation,
increased production, efficient resource allocation, growth of the private sector and
poverty reduction.
Overview of economic performance during the period of study
As discussed in the previous section, both countries implemented reform programs during
the 1980s. While Bangladesh was able to successfully implement a number of reforms,
the success of Tanzania was more constrained. In 1998, the GDP of Bangladesh was
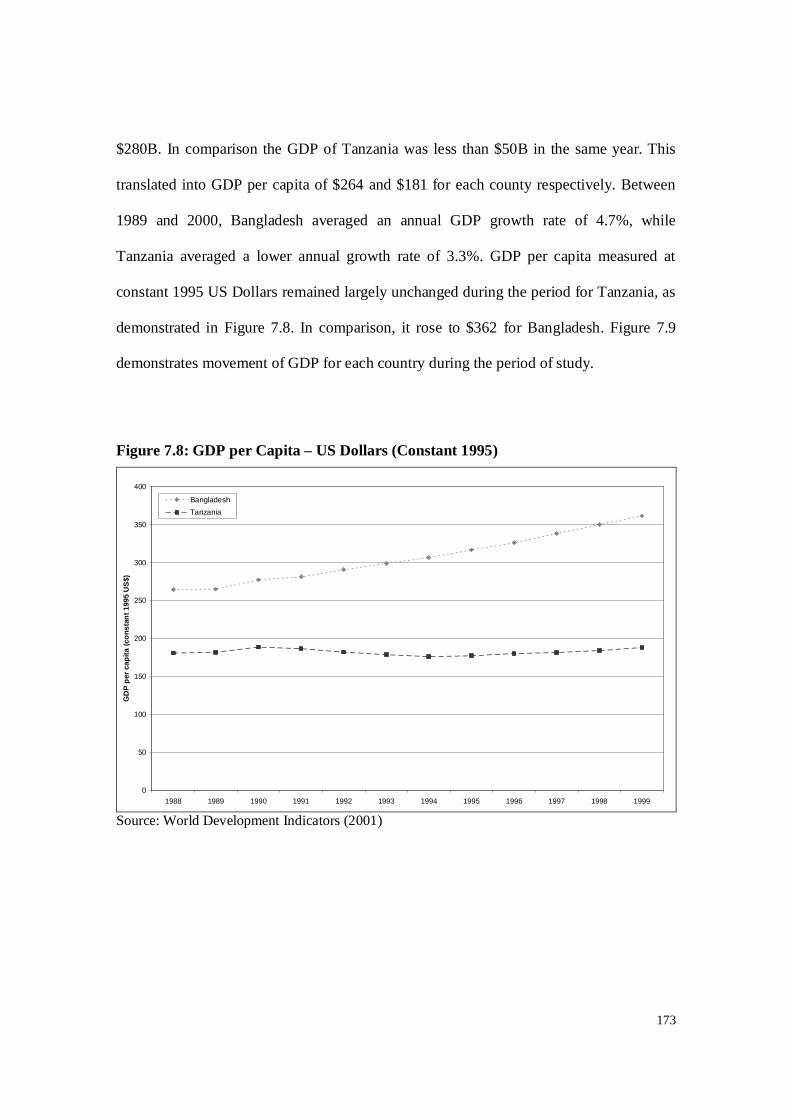
173
$280B. In comparison the GDP of Tanzania was less than $50B in the same year. This
translated into GDP per capita of $264 and $181 for each county respectively. Between
1989 and 2000, Bangladesh averaged an annual GDP growth rate of 4.7%, while
Tanzania averaged a lower annual growth rate of 3.3%. GDP per capita measured at
constant 1995 US Dollars remained largely unchanged during the period for Tanzania, as
demonstrated in Figure 7.8. In comparison, it rose to $362 for Bangladesh. Figure 7.9
demonstrates movement of GDP for each country during the period of study.
Figure 7.8: GDP per Capita – US Dollars (Constant 1995)
0
50
100
150
200
250
300
350
400
1988 1989 1990 1991 1992 1993 1994 1995 1996 1997 1998 1999
GD
P pe
r cap
ita (c
onst
ant 1
995
US$
)
BangladeshTanzania
Source: World Development Indicators (2001)

174
Figure 7.9: Gross Domestic Product – US $Billion (Constant 1995)
0
50
100
150
200
250
300
350
400
450
500
1988 1989 1990 1991 1992 1993 1994 1995 1996 1997 1998 1999
US$
Bill
ion
(Con
stan
t 199
5 Pr
ices
)
BangladeshTanzania
Source: World Development Indicators (2001)
In reviewing the sectoral composition of GDP for each country, for Tanzania there was
limited change during the period of study. Agriculture declined in importance by slightly
from 46% to 42% of GDP between 1988 and 2000, with services increasing in
importance the same amount, largely as a consequence of tourism. Industry remained
static. In comparison, agriculture became less important to the economy of Bangladesh,
as the manufacturing sector grew during the period of study. Agriculture fell from 37% of
GDP in 1988 to 26% of GDP in 2000, while manufacturing rose from 15% to 24% of
GDP. The sectoral composition of the two economies for each year of study is presented
in Figures 7.10 and 7.11.
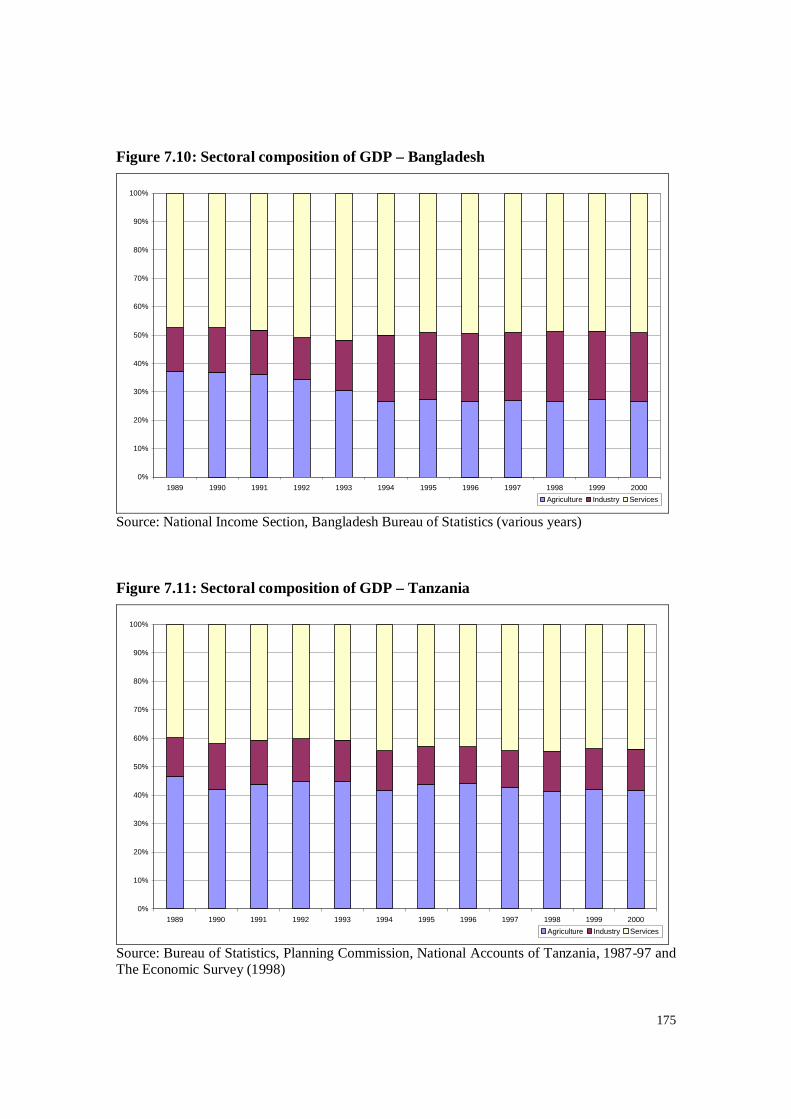
175
Figure 7.10: Sectoral composition of GDP – Bangladesh
0%
10%
20%
30%
40%
50%
60%
70%
80%
90%
100%
1989 1990 1991 1992 1993 1994 1995 1996 1997 1998 1999 2000Agriculture Industry Services
Source: National Income Section, Bangladesh Bureau of Statistics (various years)
Figure 7.11: Sectoral composition of GDP – Tanzania
0%
10%
20%
30%
40%
50%
60%
70%
80%
90%
100%
1989 1990 1991 1992 1993 1994 1995 1996 1997 1998 1999 2000Agriculture Industry Services
Source: Bureau of Statistics, Planning Commission, National Accounts of Tanzania, 1987-97 and The Economic Survey (1998)

176
Overview of Bangladesh economy during the period of study
The Bangladesh economy has historically been vulnerable to natural disaster and heavily
reliant upon annual rain fall. In 1990, the Bangladesh economy was largely agrarian, with
the majority of the population engaged in farming and fishing. Agriculture produced a
large proportion of national product and the industrial sector largely involved processing
of agricultural raw materials. Most non-agricultural raw materials, machinery and
equipment were imported. Large quantities of fuel were imported and there was a heavy
reliance on aid assistance. Despite its reduced contribution to GDP by 2000, agriculture
continued to have a large role in the economic activity of Bangladesh, employing around
60% of the labour force, providing for food requirements and inputs into manufacturing
and agro-processing sectors (EIU 2001a). By the year 2000, Bangladesh had achieved
food self-sufficiency and a diversified crop base.
The role of aid diminished in the economy of Bangladesh during the period of the study,
largely due to Bangladesh achieving self-sufficiency in food production. More
specifically, foreign aid as a percentage of GDP fell from 7.6% in 1990 to around 2% in
2000 (The World Bank 2001). Similarly, the incidence of poverty fell, although poverty
remained prevalent in rural areas, where agricultural production contributed to both
seasonal and disguised unemployment.
Throughout the 1990s Bangladesh continued the economic liberalisation programs it had
commenced in the 1980s, reducing the role of the government, encouraging the private
sector and attracting foreign investment. Bureaucratic control over private investment
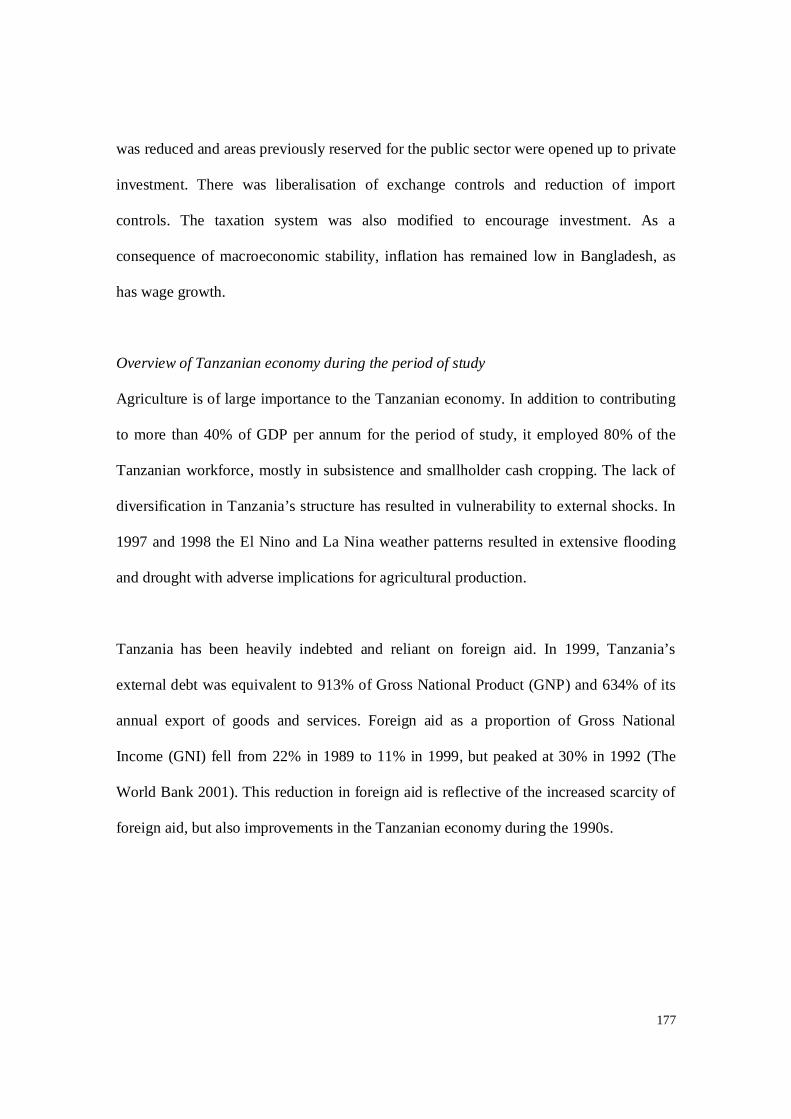
177
was reduced and areas previously reserved for the public sector were opened up to private
investment. There was liberalisation of exchange controls and reduction of import
controls. The taxation system was also modified to encourage investment. As a
consequence of macroeconomic stability, inflation has remained low in Bangladesh, as
has wage growth.
Overview of Tanzanian economy during the period of study
Agriculture is of large importance to the Tanzanian economy. In addition to contributing
to more than 40% of GDP per annum for the period of study, it employed 80% of the
Tanzanian workforce, mostly in subsistence and smallholder cash cropping. The lack of
diversification in Tanzania’s structure has resulted in vulnerability to external shocks. In
1997 and 1998 the El Nino and La Nina weather patterns resulted in extensive flooding
and drought with adverse implications for agricultural production.
Tanzania has been heavily indebted and reliant on foreign aid. In 1999, Tanzania’s
external debt was equivalent to 913% of Gross National Product (GNP) and 634% of its
annual export of goods and services. Foreign aid as a proportion of Gross National
Income (GNI) fell from 22% in 1989 to 11% in 1999, but peaked at 30% in 1992 (The
World Bank 2001). This reduction in foreign aid is reflective of the increased scarcity of
foreign aid, but also improvements in the Tanzanian economy during the 1990s.

178
As a consequence of the reform programs implemented, by the end of the period of study,
Tanzania had largely achieved macroeconomic stability and had progressed privatisation
and liberalisation.
The primary sector in each economy
As has been discussed, both Bangladesh and Tanzania had a strong reliance on
agriculture during the period of study. In Bangladesh, agriculture has a diminished albeit
still significant role within the economy. Crops are the most important aspect of
agriculture for Bangladesh, although fisheries, livestock and forestry also contribute to
the sector. As at 2000 crop yield were below attainable levels. Use of chemical fertilisers
has been uneven and sporadic (EIU 2001a). The land area under cultivation reduced as a
consequence of population growth, urbanisation and river erosion during the 1990s.
Fragmented ownership of land and uncertainty of land tenure adversely impacted long-
term investment in the land. Smaller farmers came under threat of those able to afford to
implement technology. Flooding has also adversely impacted crop yields.
The major crops produced in Bangladesh during the 1990s were rice, wheat and jute.
Rice production increased from 17.8 million tonnes on 1990/91 to 24.4m tonnes in
2000/01 (EIU 2001a). This increase was the consequence of the introduction of high-
yielding varieties of rice, increased irrigation and fertiliser use. Wheat output also grew
rapidly, and around 2 million tonnes were produced in 2000/01, as a consequence of new
varieties that were introduced. The land area under jute cultivation declined as a
consequence of more land being used for rice production. In 2000/01 400,000 ha of land
179
were under jute cultivation, compared with 570,000 ha in 1997/98. Other important crops
are tea, sugarcane, tobacco and cotton.
In relation to other aspects of agriculture, the livestock sector of Bangladesh grew
strongly in the 1990s. Its main purpose was the provision of non-human farm energy and
fertiliser. Forests constituted around 17% of the total land area of Bangladesh.
Commercial felling of timber was limited, and what was produced was used
predominantly as sawn timber and pulp for the paper and newsprint industries. Forestry
provided the major source of firewood for the rural population. The fisheries sector
exhibited growth during the 1990s, with the total catch rising from 848,000 tonnes in
1989/90 to 1.67 million tonnes in 1999/2000. Mining accounted for less than 1% of the
GDP of Bangladesh.
Tanzania’s primary sector consists of agriculture, livestock, forestry, fishing and mining.
As at 2000, Tanzania’s agricultural sector was highly labour-intensive, with land being
largely underutilised. The land that was in use was dominated by small-scale subsistence
farmers. The main subsistence crops were maize, sorghum, millet, cassava, rice,
plantains, wheat and pulses. Food crops were produced without technology or fertilisers,
and were highly vulnerable to drought. Cash crops included coffee, cotton, tobacco,
cashew nuts, sisal and tea. The first three cash-crops were grown mainly by small
landholders, whereas sisal and tea were grown mainly on large estates. Coffee and cotton
were traditionally the most important export crops, but declined in importance toward the
end of the period of study, with cashew nuts becoming the most important from 1997.

180
Livestock in Tanzania encompassed cattle, goats, sheep and poultry. The cattle herd is
predominantly short-horn Zebu which numbered around 13 million in 2000, according to
government estimates (EIU 2001b). There were also dairy and beef herds. Goats
numbered 10.7 million, sheep 3.5 million and poultry 27 million in 2000. Meat
production totalled 268,000 tonnes in 1989/99, an increase on the 219,000 tonnes
produced in 1993/94. Milk production also rose substantially during the same period from
555,000 litres to 687,000 litres. Exports of forest products remained relatively constant
during the period of study. Fishing produced a total catch of 310,000 tonnes in 1999,
comprising of 260,000 tonnes from fresh water and 50,000 tonnes from the sea. The
capacity of the fish catch is estimated at 730,000 tonnes, however, production has been
constrained by lack of infrastructure.
The role of manufacturing in each economy
As reflected in contribution to GDP, manufacturing was more important to Bangladesh
than it was for Tanzania during the period of study. During the 1990s the manufacturing
sector of Bangladesh grew at an annual rate of 6.9%. Prior to the period of study, the
manufacturing sector was largely involved processing of domestically produced
agricultural produce. In the late 1980s, there was expansion into the areas of ready-made
garments (RMG) and fertiliser manufacturing. The sector was dominated by state owned
enterprises during most of the period of study, however, toward the end of the period
there was private sector investment within the industry. By the year 2000, there were
around 1.4 million workers employed in the RMG sector and clothing accounted for
around 70% of the export earnings of Bangladesh. The chemical industry was established
181
due to the abundance of natural gas and it largely produced urea fertiliser for domestic
demand. Toward the end of the period of study, the government allowed investment in
the industry in order to facilitate exports. Bangladesh is the world’s second largest
producer and largest exporter of manufactured jute products. Export earnings from jute
products fell during the 1990s, as a consequence of decline in production of jute and
competition from synthetic substitutes. Specific items produced from jute include carpet
backing, twine and sacking. In addition to the industries already outlined, a number of
small manufacturing enterprises emerged in Bangladesh during the 1990s, producing
goods like matches, cigarettes, bicycles, tyres, tubes, batteries, pumps, motors and
engines, radios and television sets. There was also some expansion into electronics.
Export processing zones (EPZs) are a significant part of encouraging manufacturing in
Bangladesh. The first EPZ was opened in the early 1980s, and was dominated by garment
manufacturing. A second EPZ opened in Dhaka in 1993 that focussed on high-
technology. By 2000, an additional three EPZs were being developed and a further two
were being planned. By the beginning of 2000, EPZs had accumulated investment of
US$453M and export income of US$891M. In 1999/2000, exports from EPZs accounted
for 15.5% of total exports and firms within EPZs employed more than 100,000 workers.
Investors in EPZs have mainly been other Asian countries. In 2000, South Korea and
Japan were the largest investors in EPZs, while other Asian countries that had invested
included China, Malaysia and India, and non-Asian investor countries that had invested
included the United States and the United Kingdom.
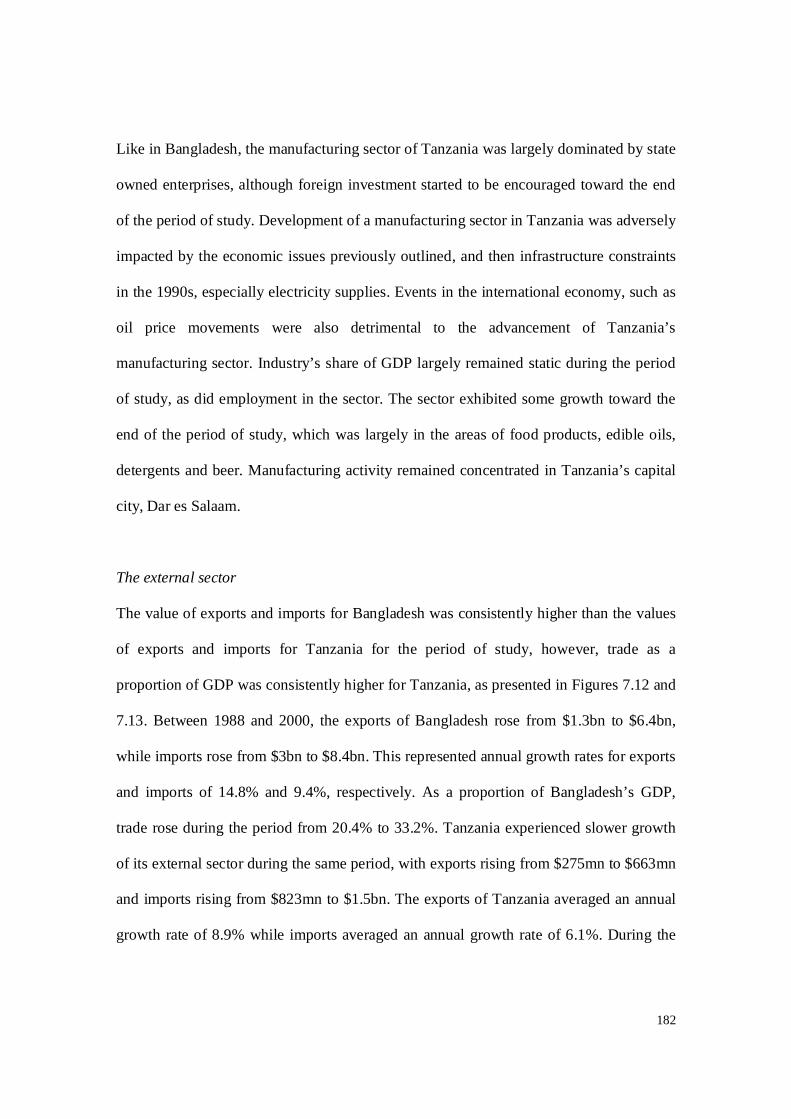
182
Like in Bangladesh, the manufacturing sector of Tanzania was largely dominated by state
owned enterprises, although foreign investment started to be encouraged toward the end
of the period of study. Development of a manufacturing sector in Tanzania was adversely
impacted by the economic issues previously outlined, and then infrastructure constraints
in the 1990s, especially electricity supplies. Events in the international economy, such as
oil price movements were also detrimental to the advancement of Tanzania’s
manufacturing sector. Industry’s share of GDP largely remained static during the period
of study, as did employment in the sector. The sector exhibited some growth toward the
end of the period of study, which was largely in the areas of food products, edible oils,
detergents and beer. Manufacturing activity remained concentrated in Tanzania’s capital
city, Dar es Salaam.
The external sector
The value of exports and imports for Bangladesh was consistently higher than the values
of exports and imports for Tanzania for the period of study, however, trade as a
proportion of GDP was consistently higher for Tanzania, as presented in Figures 7.12 and
7.13. Between 1988 and 2000, the exports of Bangladesh rose from $1.3bn to $6.4bn,
while imports rose from $3bn to $8.4bn. This represented annual growth rates for exports
and imports of 14.8% and 9.4%, respectively. As a proportion of Bangladesh’s GDP,
trade rose during the period from 20.4% to 33.2%. Tanzania experienced slower growth
of its external sector during the same period, with exports rising from $275mn to $663mn
and imports rising from $823mn to $1.5bn. The exports of Tanzania averaged an annual
growth rate of 8.9% while imports averaged an annual growth rate of 6.1%. During the
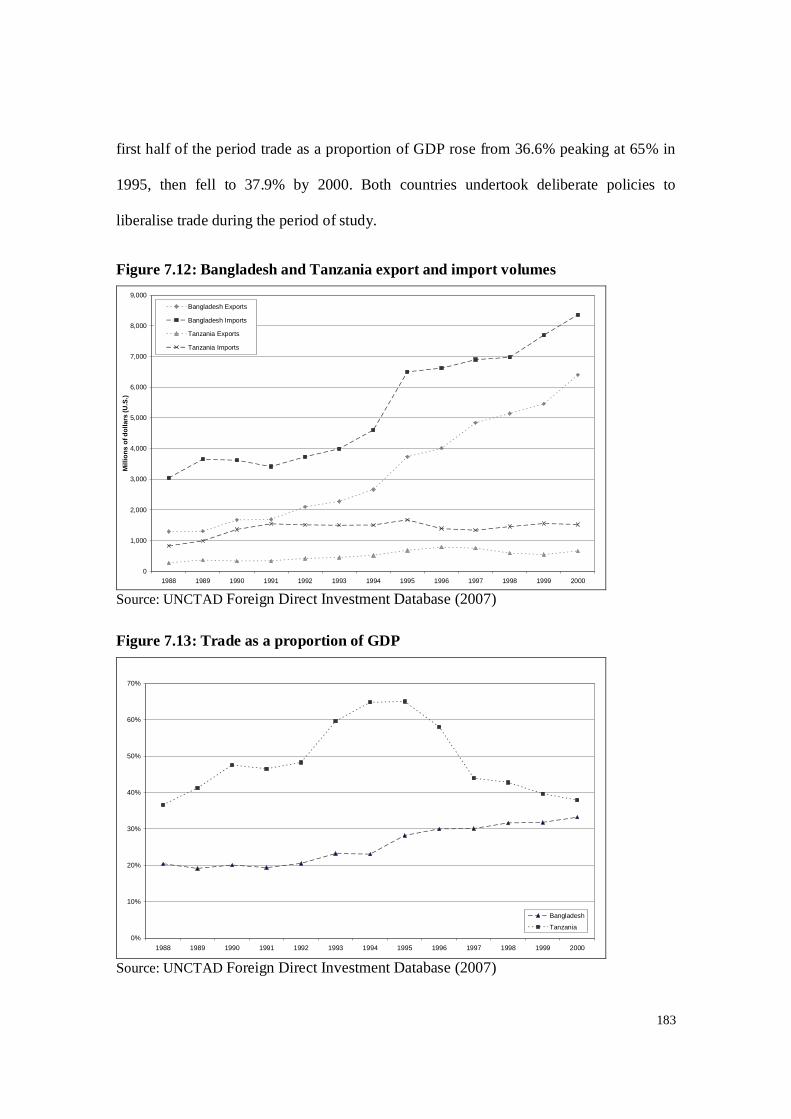
183
first half of the period trade as a proportion of GDP rose from 36.6% peaking at 65% in
1995, then fell to 37.9% by 2000. Both countries undertook deliberate policies to
liberalise trade during the period of study.
Figure 7.12: Bangladesh and Tanzania export and import volumes
0
1,000
2,000
3,000
4,000
5,000
6,000
7,000
8,000
9,000
1988 1989 1990 1991 1992 1993 1994 1995 1996 1997 1998 1999 2000
Mill
ions
of d
olla
rs (U
.S.)
Bangladesh Exports
Bangladesh Imports
Tanzania Exports
Tanzania Imports
Source: UNCTAD Foreign Direct Investment Database (2007)
Figure 7.13: Trade as a proportion of GDP
0%
10%
20%
30%
40%
50%
60%
70%
1988 1989 1990 1991 1992 1993 1994 1995 1996 1997 1998 1999 2000
Bangladesh
Tanzania
Source: UNCTAD Foreign Direct Investment Database (2007)
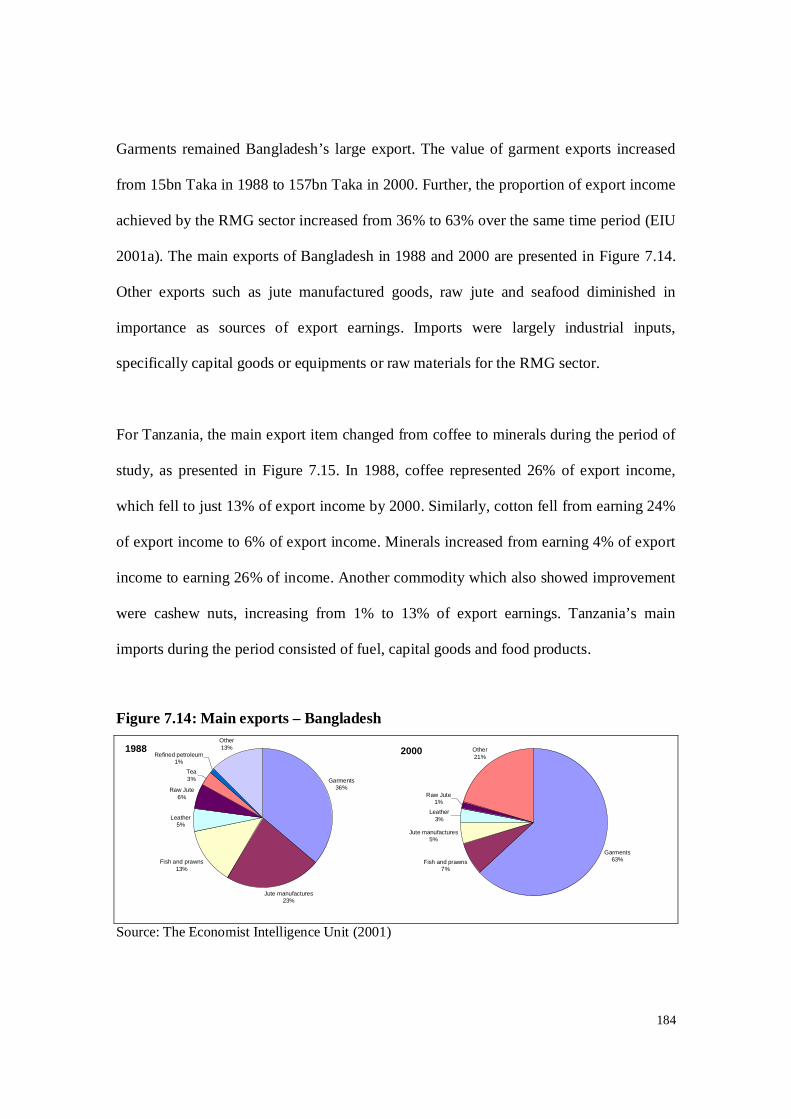
184
Garments remained Bangladesh’s large export. The value of garment exports increased
from 15bn Taka in 1988 to 157bn Taka in 2000. Further, the proportion of export income
achieved by the RMG sector increased from 36% to 63% over the same time period (EIU
2001a). The main exports of Bangladesh in 1988 and 2000 are presented in Figure 7.14.
Other exports such as jute manufactured goods, raw jute and seafood diminished in
importance as sources of export earnings. Imports were largely industrial inputs,
specifically capital goods or equipments or raw materials for the RMG sector.
For Tanzania, the main export item changed from coffee to minerals during the period of
study, as presented in Figure 7.15. In 1988, coffee represented 26% of export income,
which fell to just 13% of export income by 2000. Similarly, cotton fell from earning 24%
of export income to 6% of export income. Minerals increased from earning 4% of export
income to earning 26% of income. Another commodity which also showed improvement
were cashew nuts, increasing from 1% to 13% of export earnings. Tanzania’s main
imports during the period consisted of fuel, capital goods and food products.
Figure 7.14: Main exports – Bangladesh
1988
Garments36%
Jute manufactures23%
Fish and prawns13%
Leather5%
Raw Jute6%
Tea3%
Refined petroleum1%
Other13% 2000
Garments63%Fish and prawns
7%
Jute manufactures5%
Leather3%
Raw Jute1%
Other21%
Source: The Economist Intelligence Unit (2001)
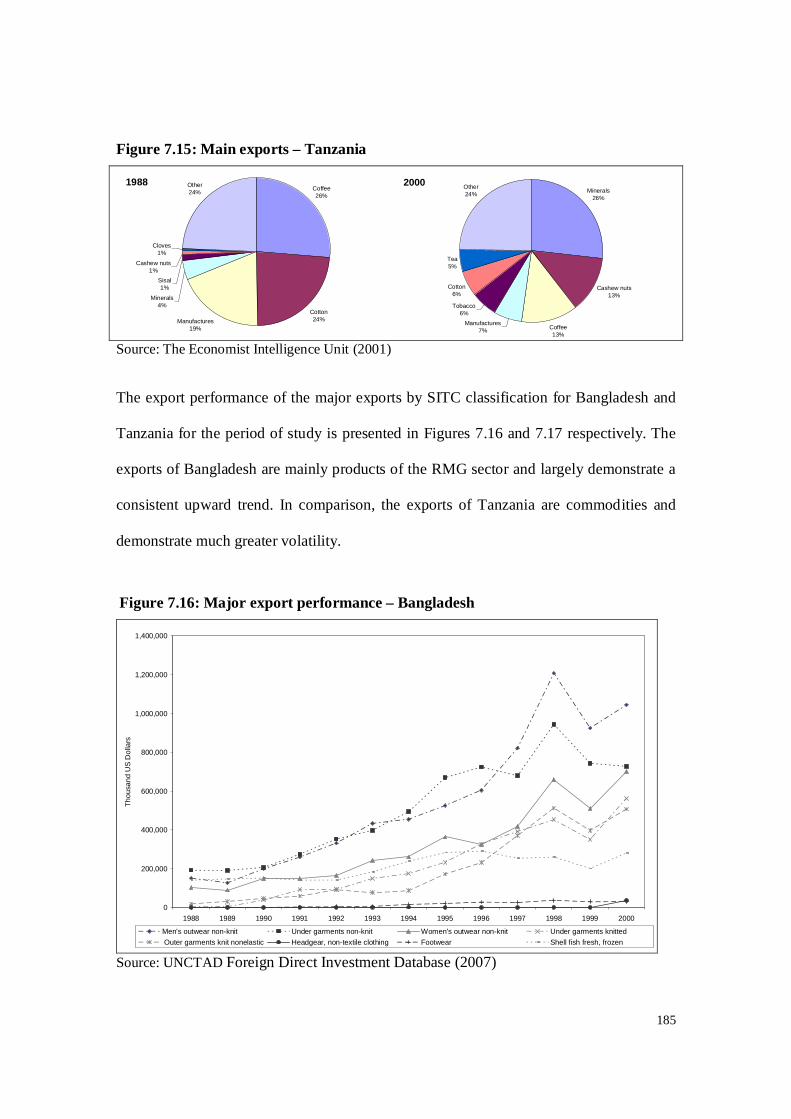
185
Figure 7.15: Main exports – Tanzania
1988Coffee26%
Cotton24%Manufactures
19%
Minerals4%
Sisal1%
Cashew nuts1%
Cloves1%
Other24%
2000Minerals
26%
Cashew nuts13%
Coffee13%
Manufactures7%
Tobacco6%
Cotton6%
Tea5%
Other24%
Source: The Economist Intelligence Unit (2001)
The export performance of the major exports by SITC classification for Bangladesh and
Tanzania for the period of study is presented in Figures 7.16 and 7.17 respectively. The
exports of Bangladesh are mainly products of the RMG sector and largely demonstrate a
consistent upward trend. In comparison, the exports of Tanzania are commodities and
demonstrate much greater volatility.
Figure 7.16: Major export performance – Bangladesh
0
200,000
400,000
600,000
800,000
1,000,000
1,200,000
1,400,000
1988 1989 1990 1991 1992 1993 1994 1995 1996 1997 1998 1999 2000
Thou
sand
US
Dol
lars
Men's outwear non-knit Under garments non-knit Women's outwear non-knit Under garments knitted Outer garments knit nonelastic Headgear, non-textile clothing Footwear Shell fish fresh, frozen
Source: UNCTAD Foreign Direct Investment Database (2007)

186
Figure 7.17: Major export performance – Tanzania
0
20,000
40,000
60,000
80,000
100,000
120,000
140,000
160,000
1988 1989 1990 1991 1992 1993 1994 1995 1996 1997 1998 1999 2000
Thou
sand
US
Dol
lars
Gold, non-monetary nes Fruit, nuts, fresh, dried Coffee and substitutes Fish, fresh, chilled, frozenPearl, prec, semi-prec stones Tobacco, unmanufactd, refuse Cotton Tea and mate
Source: UNCTAD Foreign Direct Investment Database (2007)
In relation to the direction of trade, for Bangladesh the proportion of exports that went to
developed countries increased from 71% to 76% between 1988 and 2000, although
peaked at 87% in 1988, as presented in Table 7.2. The major export recipient countries at
the end of the period of study were the United States, Germany, the United Kingdom and
France. These countries were also the main export markets at the beginning of the period
of study. Japan declined in importance as a recipient of imports. The proportion of
exports that went to developing countries declined from 24% in 1988 to 9% in 2000,
which is largely a consequence of the change in the nature of production, and the demand
for garments by developed countries. The opposite pattern was observed for imports.
Specifically, imports from developed countries fell from 46% to 26% from 1988 to 2000,
while imports from developing countries rose from 34% to 56%. The increase in imports

187
from developing countries is largely accounted for by imports from other Asian countries,
predominantly imports for use in the garment industry.
Table 7.2: Direction of imports and exports (%) – Bangladesh 1988 1989 1990 1991 1992 1993 1994 1995 1996 1997 1998 1999 2000
Exports Developed economies 71 68 75 77 79 79 81 83 86 84 87 76 76 Developed economies: Europe 35 32 37 45 38 41 42 45 49 43 47 41 41 EU 25 33 28 35 43 37 40 41 45 48 43 46 40 40 United States and Canada 27 29 32 28 37 35 35 34 33 37 38 33 34 Japan 6 4 4 3 3 3 3 3 3 2 2 2 1 Developed economies: Other 3 2 2 1 1 1 1 1 1 1 1 0 0 South-East Europe and CIS 5 7 5 2 0 1 1 1 0 1 0 0 0 Developing economies 24 25 20 20 19 18 18 15 14 15 12 9 9 OPEC 4 4 3 5 4 3 2 2 2 3 2 2 2 Developing economies: America 1 1 0 1 2 2 1 1 1 1 1 0 0 Developing economies: Africa 5 6 4 3 2 2 2 2 2 2 1 1 1 Developing economies: West Asia 6 5 5 5 6 4 4 3 3 4 3 2 3 Developing economies: Other Asia 11 13 10 11 10 10 10 9 8 9 7 5 5 Unallocated 1 0 0 0 1 1 1 0 0 0 0 15 15 Total 100 100 100 100 100 100 100 100 100 100 100 100 100
Imports Developed economies 46 41 44 37 34 36 32 31 29 29 25 28 26 Developed economies: Europe 19 16 21 17 14 16 12 14 13 15 12 12 11 EU 25 16 14 19 15 13 14 10 12 12 13 11 10 10 United States and Canada 9 10 8 9 10 5 7 7 4 6 4 6 3 Japan 16 13 13 9 8 13 11 9 10 7 6 7 9 Developed economies: Other 2 2 2 2 2 2 2 1 2 2 3 3 2 South-East Europe and CIS 2 3 1 1 1 1 2 1 2 1 1 1 1 Developing economies 34 37 41 42 48 47 50 58 54 60 58 53 56 OPEC 8 9 6 6 7 5 4 4 4 6 4 6 7 Developing economies: America 1 1 2 2 1 1 2 2 2 1 2 2 1 Developing economies: Africa 0 0 0 0 0 0 1 1 1 1 1 1 1 Developing economies: West Asia 7 8 5 6 6 4 3 3 3 4 2 4 5 Developing economies: Other Asia 25 27 34 34 40 41 44 52 49 52 53 47 48 Unallocated 17 19 13 20 17 16 16 9 15 10 16 18 17 Total 100 100 100 100 100 100 100 100 100 100 100 100 100
Source: UNCTAD Foreign Direct Investment Database (2007)

188
Table 7.3: Direction of imports and exports (%) – Tanzania 1988 1989 1990 1991 1992 1993 1994 1995 1996 1997 1998 1999 2000
Exports Developed economies 80 70 54 60 51 52 49 47 45 53 55 49 59 Developed economies: Europe 69 60 43 50 42 40 38 35 34 43 44 38 52 EU 25 68 60 41 49 42 40 37 34 33 38 42 37 50 United States and Canada 6 5 7 4 3 3 3 4 3 2 2 3 2 Japan 5 5 4 5 6 8 8 8 8 7 8 7 5 Developed economies: Other 0 0 0 0 0 1 0 1 1 1 1 1 0 South-East Europe and CIS 0 0 1 1 0 0 0 0 0 0 0 0 1 Developing economies 19 29 43 37 46 45 47 50 52 47 45 50 40 OPEC 5 3 2 2 4 6 7 7 4 7 2 3 2 Developing economies: America 0 0 0 0 0 1 0 0 0 0 0 0 0 Developing economies: Africa 5 4 9 11 16 17 16 16 15 15 14 18 19 Developing economies: West Asia 2 2 2 1 1 3 4 5 1 1 1 2 2 Developing economies: Other Asia 12 23 32 25 28 25 27 29 35 30 29 29 19 Unallocated 0 0 3 3 3 3 3 3 3 0 0 1 0 Total 100 100 100 100 100 100 100 100 100 100 100 100 100
Imports Developed economies 83 81 73 57 50 49 41 36 34 46 49 49 45 Developed economies: Europe 65 64 61 43 39 37 31 25 25 32 33 26 24 EU 25 61 59 59 42 37 35 30 24 24 29 31 24 22 United States and Canada 6 6 4 4 3 3 4 4 4 6 6 8 6 Japan 12 11 8 9 8 8 6 6 5 7 8 11 9 Developed economies: Other 0 0 1 1 0 1 0 0 1 2 2 5 6 South-East Europe and CIS 1 1 1 1 1 0 0 0 0 1 0 0 1 Developing economies 16 18 24 40 47 48 56 61 63 52 50 51 54 OPEC 0 0 12 16 15 15 12 10 12 10 11 11 10 Developing economies: America 1 1 1 1 2 0 1 0 0 2 3 3 2 Developing economies: Africa 1 4 4 7 5 10 20 27 26 17 19 19 21 Developing economies: West Asia 1 1 12 15 15 18 15 14 16 9 11 12 11 Developing economies: Other Asia 14 13 6 18 25 20 20 20 20 25 17 18 20 Unallocated 0 0 2 2 2 2 3 3 3 1 1 0 0 Total 100 100 100 100 100 100 100 100 100 100 100 100 100
Source: UNCTAD Foreign Direct Investment Database (2007)

189
For Tanzania, the proportion of exports that went to developed countries fell during the
period of study from 80% in 1988 to 59% in 2000, and in the middle of this period fell to
less than 50% of exports, as presented in Table 7.3. In 1988, Tanzania’s main export
markets were West Germany and the United Kingdom. By 1999, India had become the
largest recipient of exports. Exports to other developing countries also increased during
the period, with exports largely going to developing countries in the African and Asian
regions. Imports from developed countries fell from 83% of imports in 1988 to just 45%
of imports in 2000. As with exports, imports from developing countries rose, largely from
the African and Asian regions. In 1988, the two largest sources of imports were the UK
and Japan, whereas in 1999, South Africa became the largest supplier of imports to
Tanzania.
Foreign direct investment
For both Bangladesh and Tanzania, FDI was negligible during the first half of the period
of study, as demonstrated in Figure 7.18. FDI rose rapidly from 1993 in Tanzania and
from 1996 in Bangladesh. In 2000, both countries attracted around $180mn in FDI. In
Bangladesh, foreign investment was directed toward gas exploration and the construction
of power plants. In Tanzania foreign investment occurred in the tourism sector and the
mining industry.
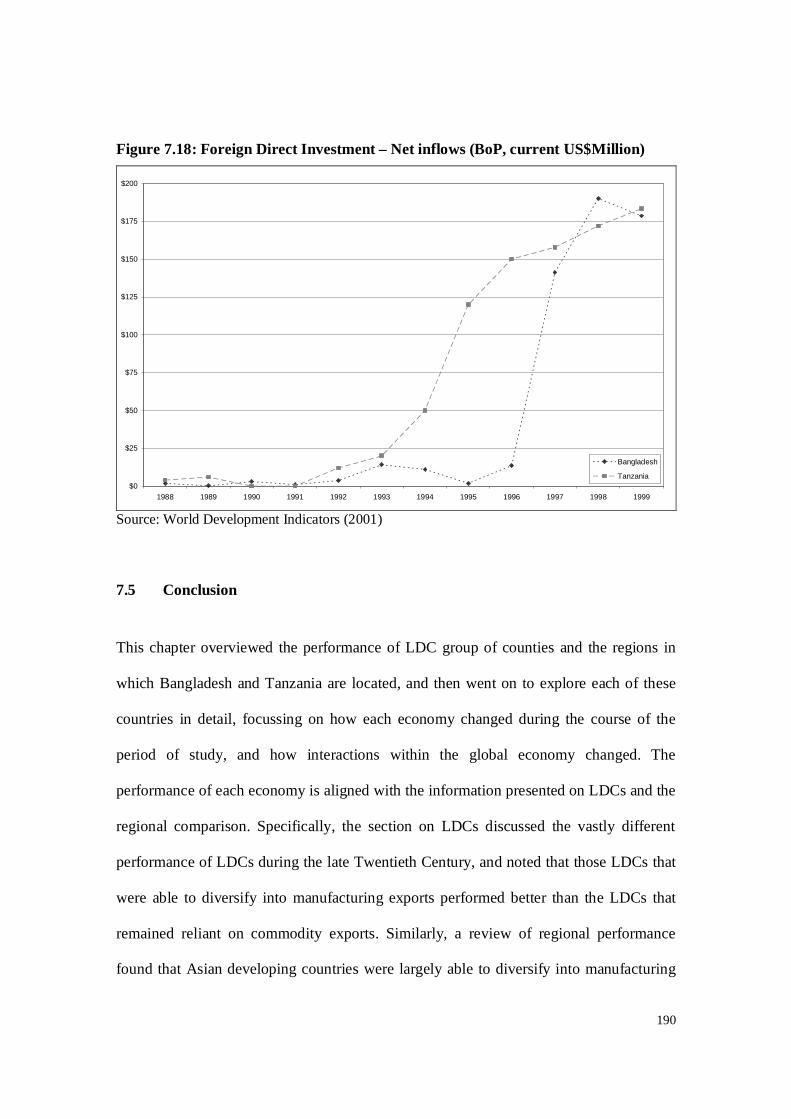
190
Figure 7.18: Foreign Direct Investment – Net inflows (BoP, current US$Million)
$0
$25
$50
$75
$100
$125
$150
$175
$200
1988 1989 1990 1991 1992 1993 1994 1995 1996 1997 1998 1999
Bangladesh
Tanzania
Source: World Development Indicators (2001)
7.5 Conclusion
This chapter overviewed the performance of LDC group of counties and the regions in
which Bangladesh and Tanzania are located, and then went on to explore each of these
countries in detail, focussing on how each economy changed during the course of the
period of study, and how interactions within the global economy changed. The
performance of each economy is aligned with the information presented on LDCs and the
regional comparison. Specifically, the section on LDCs discussed the vastly different
performance of LDCs during the late Twentieth Century, and noted that those LDCs that
were able to diversify into manufacturing exports performed better than the LDCs that
remained reliant on commodity exports. Similarly, a review of regional performance
found that Asian developing countries were largely able to diversify into manufacturing
191
and performed better than African countries that remained highly dependent on primary
commodities. In examining each of the individual countries, it is evident that Bangladesh
achieved higher GDP growth and export earnings growth during the period of study than
Tanzania. Bangladesh was also more successful in implementing reform programs,
largely because of the foundations that were set in the earlier period.
192
8 Modified Development Index
8.1 Introduction
Chapter 5 reviewed measures of development including the vast number of composite
indices developed during the past six decades. It also considered the HDI, which has
been the most enduring and widely accepted development index to date. The purpose of
this chapter is to produce and calculate a modified development index, based upon the
HDI, however taking into account criticisms of the HDI, recommendations for
improvement and the objectives of the current research.
The modified index will include the three original components of the HDI, in terms of
income, longevity or health, and education. However, alternative indicators for these
components will also be reviewed to identify indicators that are more relevant to the
goals of this research. Where suitable alternative indicators are identified, and data are
available, these indicators will replace the indicators utilised in the original HDI. Support
for the substitution of variables within the HDI and the inclusion of additional variables is
provided by Doraid (1997), who states:
“To reflect country-specific priorities and problems and to be more sensitive to a
country’s development level, the basic components of the HDI appearing in the
global HDRs could be supplemented or replaced by other more relevant
components”
and
193
“… the usefulness and versatility of the HDI as an analytical tool for human
development... would be enhanced if countries choose components that reflect
their priorities and problems and are sensitive to their development levels.”
For the current research that compares and contrasts the development of two different
countries, common indicators need to be identified and utilised for both countries. In
addition to changing the indicators utilised to represent the components of the HDI,
consideration is given to including other indicators in the modified index. In the early part
of the chapter, a measure for inequality is considered, although abandoned later, due to
lack of data. After the modified index has been produced, consideration is given to
further modification to include an environmental indicator, however, this also is not
progressed, largely due to lack of a suitable indicator for which data are available.
8.2 The modified index
8.2.1 Construction of the index and potential inclusion of additional components
As discussed in Chapter 5, the outcomes of alternative calculations do not provide
compelling justification for adding complexity to the construction of the original HDI.
Therefore, the same construction approach as used by the UNDP is used for the modified
index, in terms of assigning a ranking for each component based on where the country is
situated between a maximum and minimum value. Maximum and minimum values are
set as the observed maximum and minimum value for each component over the period of
the study across all countries for which data is available. For each component, the
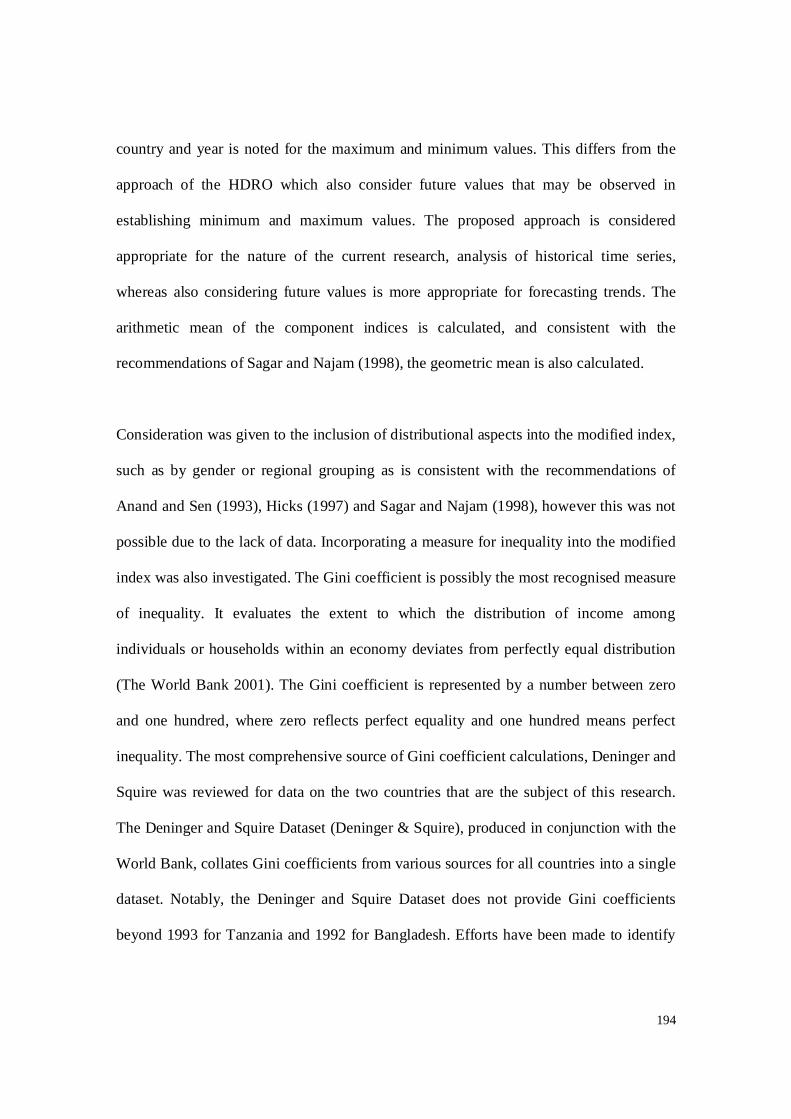
194
country and year is noted for the maximum and minimum values. This differs from the
approach of the HDRO which also consider future values that may be observed in
establishing minimum and maximum values. The proposed approach is considered
appropriate for the nature of the current research, analysis of historical time series,
whereas also considering future values is more appropriate for forecasting trends. The
arithmetic mean of the component indices is calculated, and consistent with the
recommendations of Sagar and Najam (1998), the geometric mean is also calculated.
Consideration was given to the inclusion of distributional aspects into the modified index,
such as by gender or regional grouping as is consistent with the recommendations of
Anand and Sen (1993), Hicks (1997) and Sagar and Najam (1998), however this was not
possible due to the lack of data. Incorporating a measure for inequality into the modified
index was also investigated. The Gini coefficient is possibly the most recognised measure
of inequality. It evaluates the extent to which the distribution of income among
individuals or households within an economy deviates from perfectly equal distribution
(The World Bank 2001). The Gini coefficient is represented by a number between zero
and one hundred, where zero reflects perfect equality and one hundred means perfect
inequality. The most comprehensive source of Gini coefficient calculations, Deninger and
Squire was reviewed for data on the two countries that are the subject of this research.
The Deninger and Squire Dataset (Deninger & Squire), produced in conjunction with the
World Bank, collates Gini coefficients from various sources for all countries into a single
dataset. Notably, the Deninger and Squire Dataset does not provide Gini coefficients
beyond 1993 for Tanzania and 1992 for Bangladesh. Efforts have been made to identify

195
more recent coefficient calculations from alternative sources, such as World Bank
databases and publications, but these efforts were relatively unsuccessful. The most
recent calculation for Bangladesh that was identified was for 1995-6 in the World
Development Indicators 2001 print edition (The World Bank 2001), but there were no
more recent Gini coefficient calculations for Tanzania beyond 1993. Additionally, the
Deninger and Squire Dataset does not list coefficients for every year of the present
research (1960 to 2000) and there are no clear trends by which estimates can be made for
the missing values. Finally, there is a difference of up to twenty-seven between
coefficient estimates for single years from different sources. Figure 8.1 demonstrates the
difficulty with incorporating a distributional element based on Gini coefficients. Because
of the lack of availability of data, incorporating inequality into the modified index could
not be progressed.
Figure 8.1: Gini coefficient estimates – Bangladesh and Tanzania
0
10
20
30
40
50
60
70
80
90
100
1955 1960 1965 1970 1975 1980 1985 1990 1995 2000
BangladeshTanzania
Source: Deninger and Squire (2007)

196
8.2.2 The components of the modified index
The approach for developing a modified index commenced with the question “What
value do the components of the current HDI provide and should these be utilised in the
modified index or discarded for more relevant components?” Although the HDI contains
an indicator of longevity, the HDRO relates this to “living long and well” (UNDP 1990
p.11) and describes health as a key factor in being able to live a long life. Therefore, the
current research considers health and longevity fit into the same broad category. Support
for the inclusion of longevity / health and education in a development index has been
provided by Murray (1991) and Nissan and Shahmoon (2001). It would be difficult to
argue that these are not critical aspects of development. Further, other development
indices, such as the PQLI discussed in the Chapter 5, also contain these indicators,
signifying their fundamental importance to development. Therefore, these components
are retained in the modified index.
Doraid (1997) notes that the indicators of longevity/health and education used in the HDI,
namely life expectancy and adult literacy, respectively, are slow to change. In light of this
criticism and given that the period that has been defined as that of globalisation for the
purposes of this research is relatively short (twelve years), alternative indicators for these
components are examined with the objective of identifying alternative indicators that are
still representative of the overall component but which are more responsive to change in
the short term.

197
Income
The income component is also retained in the modified index, recognising that it
represents “command over resources” and is a catch-all for a broad range of other
indicators for which there is insufficient data to include in the index (UNDP 1990). There
is no evident alternative to income and GDP per capita estimates are taken from the Penn
World Tables as this source contains estimates for both countries for the entire period of
the study. Notably, the source of health / longevity and education data, the World
Development Indicators (WDI) database of the World Bank, does also provide income
and purchasing power statistics. However, for the countries that are the focuses of this
research, the WDI does not provide data for all years of the study, specifically, data series
for GDP per capita based on Purchasing Power Parity (PPP) for Bangladesh commences
in 1975 and Tanzania in 1988. Notably, the calculation of GDP per capita differs between
the PWT and WDI, as different purchasing power parity (PPP) formulae and base years
are utilised by the different sources.
In the HDI, the UNDP transforms income by utilising logarithms of observed values. The
purpose of this transformation is to reduce higher income values, recognising that
marginal income at higher income levels is relatively less valuable than at lower income
levels. Given that both of the countries that are the subject of the current research are
amongst the world’s poorest countries and have relatively low income per capita levels,
this transformation was not considered necessary, and is therefore not undertaken.

198
Health
In order to ascertain what alternatives could be provided for health / longevity and
education, the WDI database produced by the World Bank (2001) was consulted. This is
the most comprehensive database of international information available, drawing together
information from many other sources, including United Nations bodies, such as United
Nations Education, Scientific and Cultural Organisation (UNESCO) and the World
Health Organisation (WHO). For many indicators for the countries that are the subject of
this research, there are several years that data is not provided. In light of lack of data
availability for the selected countries, data availability for other LDCs was examined,
however, other LDCs had similar levels of data availability.
WDI allows searching by category. For longevity and health, a search was undertaken for
the categories of ‘Population’ and ‘Health’. From this, thirty-seven series were returned,
with relatively good data availability at 53% however, for ‘Health’ alone this diminished
to 23%. From this list, a number of series could immediately be removed as not providing
a clear indication of health or longevity. The removed indicators predominantly related to
population. Indicators related to gender were also removed. While inequality based on
gender is an important aspect of development, it is not addressed in the research due to
insufficient data being available across all index components. Twenty one indicators
remained, as presented in Table 8.1.
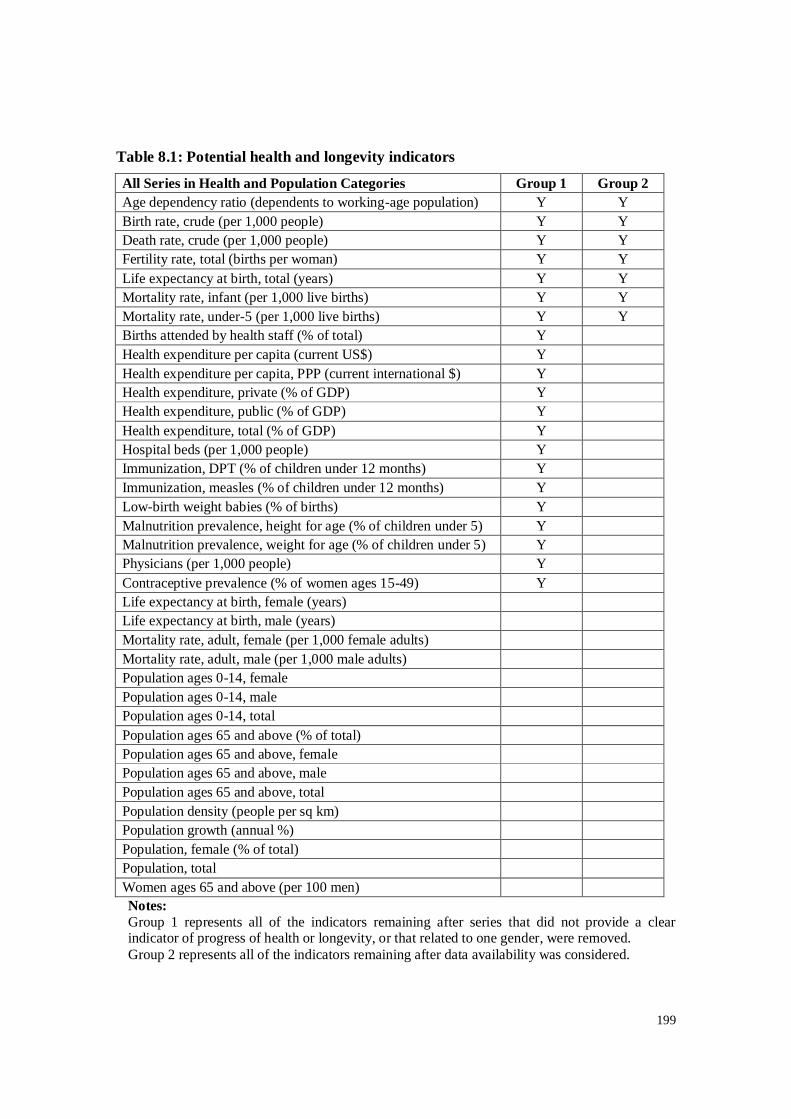
199
Table 8.1: Potential health and longevity indicators
All Series in Health and Population Categories Group 1 Group 2 Age dependency ratio (dependents to working-age population) Y Y Birth rate, crude (per 1,000 people) Y Y Death rate, crude (per 1,000 people) Y Y Fertility rate, total (births per woman) Y Y Life expectancy at birth, total (years) Y Y Mortality rate, infant (per 1,000 live births) Y Y Mortality rate, under-5 (per 1,000 live births) Y Y Births attended by health staff (% of total) Y Health expenditure per capita (current US$) Y Health expenditure per capita, PPP (current international $) Y Health expenditure, private (% of GDP) Y Health expenditure, public (% of GDP) Y Health expenditure, total (% of GDP) Y Hospital beds (per 1,000 people) Y Immunization, DPT (% of children under 12 months) Y Immunization, measles (% of children under 12 months) Y Low-birth weight babies (% of births) Y Malnutrition prevalence, height for age (% of children under 5) Y Malnutrition prevalence, weight for age (% of children under 5) Y Physicians (per 1,000 people) Y Contraceptive prevalence (% of women ages 15-49) Y Life expectancy at birth, female (years) Life expectancy at birth, male (years) Mortality rate, adult, female (per 1,000 female adults) Mortality rate, adult, male (per 1,000 male adults) Population ages 0-14, female Population ages 0-14, male Population ages 0-14, total Population ages 65 and above (% of total) Population ages 65 and above, female Population ages 65 and above, male Population ages 65 and above, total Population density (people per sq km) Population growth (annual %) Population, female (% of total) Population, total Women ages 65 and above (per 100 men) Notes: Group 1 represents all of the indicators remaining after series that did not provide a clear indicator of progress of health or longevity, or that related to one gender, were removed. Group 2 represents all of the indicators remaining after data availability was considered.

200
The next step was to determine data availability for the remaining indicators over the
period of the study. There were a number of indicators that had limited data available
before 1990 for either country. When these indicators were removed from consideration,
the potential indicator list diminished to seven indicators, as presented in Table 8.1.
The coefficient of variation was calculated for each of the remaining indicators for the
period of the study for Bangladesh and Tanzania, in order to ascertain responsiveness
which of these indicators changed most during the period of study. The arithmetic mean
of the coefficients for the two countries was then taken to obtain an overall value. The
results are presented in Table 8.2, in descending order of the value of the coefficient of
variation.
Table 8.2: Coefficients of variation for health indicators
Indicator Coefficient Mortality rate, under-5 (per 1,000 live births) 0.262697 Death rate, crude (per 1,000 people) 0.225899 Mortality rate, infant (per 1,000 live births) 0.189778 Fertility rate, total (births per woman) 0.181977 Birth rate, crude (per 1,000 people) 0.134948 Life expectancy at birth, total (years) 0.100080 Age dependency ratio (dependents to working-age population) 0.049302
Mortality rate, under-5 (per 1,000 live births) was the most responsive to change, and is
therefore utilised as the health indicator in the modified index. It makes sense that this
indicator is relatively responsive to change, as many health programs in developing
countries are targeted at infant and child illnesses. Support for inclusion of this indicator
is provided by Paul (1996), who included infant mortality in a modified development
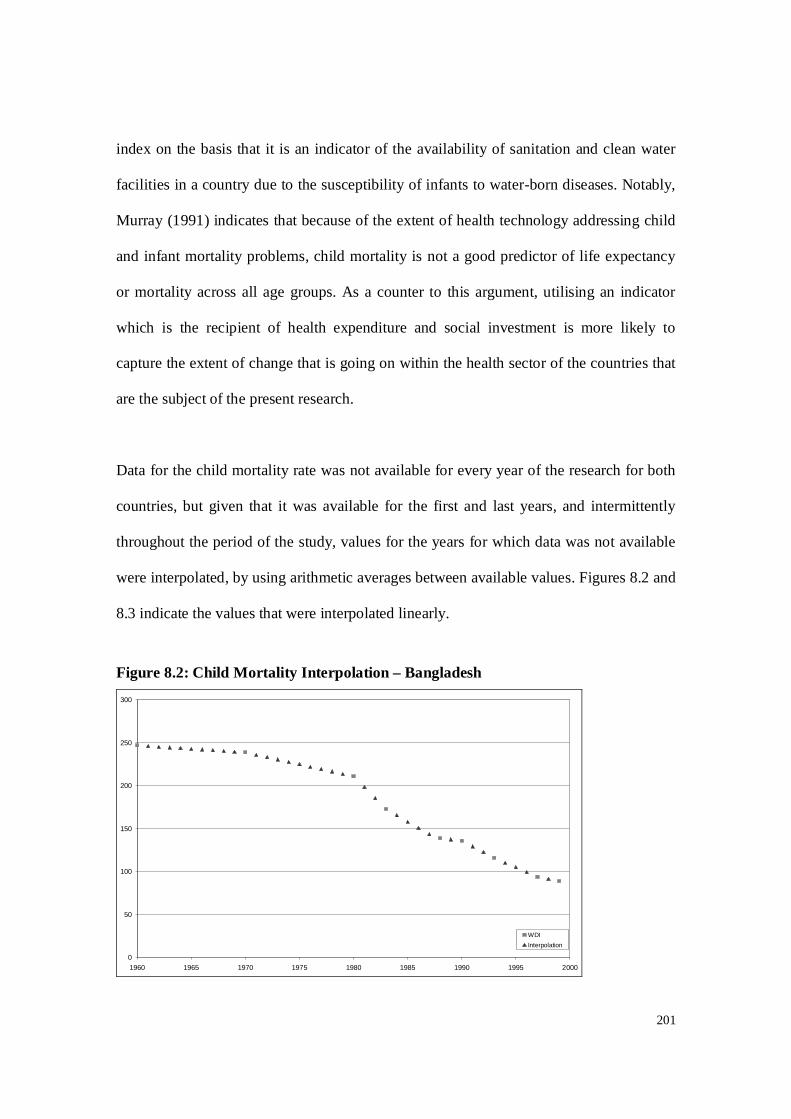
201
index on the basis that it is an indicator of the availability of sanitation and clean water
facilities in a country due to the susceptibility of infants to water-born diseases. Notably,
Murray (1991) indicates that because of the extent of health technology addressing child
and infant mortality problems, child mortality is not a good predictor of life expectancy
or mortality across all age groups. As a counter to this argument, utilising an indicator
which is the recipient of health expenditure and social investment is more likely to
capture the extent of change that is going on within the health sector of the countries that
are the subject of the present research.
Data for the child mortality rate was not available for every year of the research for both
countries, but given that it was available for the first and last years, and intermittently
throughout the period of the study, values for the years for which data was not available
were interpolated, by using arithmetic averages between available values. Figures 8.2 and
8.3 indicate the values that were interpolated linearly.
Figure 8.2: Child Mortality Interpolation – Bangladesh
0
50
100
150
200
250
300
1960 1965 1970 1975 1980 1985 1990 1995 2000
WDIInterpolation
202
Figure 8.3: Child Mortality interpolation – Tanzania
0
50
100
150
200
250
300
1960 1965 1970 1975 1980 1985 1990 1995 2000
WDI
Interpolation
Education
The same approach that was applied to health was applied to education to determine the
indicator that would be included in the composite index. WDI was searched for the
category of ‘Education’. Forty-three series were returned, with data availability at only
31%. This dropped to only 27% when Bangladesh was examined solely, reflecting the
low level of data availability for Bangladesh.
The next step undertaken was to determine data availability for these indicators over the
period of the study. The rationale was that it was important only to consider series for
which data would largely be available. No single indicator was available for Bangladesh
from 1960 to the present. The series relating to illiteracy rates only contained data back as
far as 1970. Other indicators did have data for some years, but this was relatively
infrequent and inadequate for the purposes of the current research. Eleven indicators had
203
reasonable data available (more than 35%) for both countries for the period of the study,
and had results for the commencement of the research period. From this list, all indicators
that related to gender were removed, consistent with the approach for the health /
longevity indicator, leaving only five indicators. The indicators and the two rounds of
selection process are shown in Table 8.3.
Of the five series that remained, both ‘Primary education, pupils’ and ‘Primary education,
teachers’ which reflected the number of pupils and teachers, respectively, were
considered not meaningful without reference to population changes for the relevant age
groups, for which data was not available. Gross school enrollment refers to capacity of an
education system, not to the actual proportion of children who attend school or receive
education. Therefore, the Pupil-Teacher Ratio for Primary Education is utilised as the
education indicator in the modified index, as it is considered the most meaningful of the
indicators for which a reasonable amount of data was available. Support for inclusion of
an indicator related to primary education is provided by Tweeten (1997) who emphasises
the importance of elementary schooling in broad-based development and Murray (1991)
who indicates adult literacy rates are not reflective of the current social investment in
education. A potential problem with the utilisation of an indicator related to primary
education is the inconsistency of meaning between countries as what constitutes primary
school. Notably, with the indicator chosen, the pupil to teacher ratio, this issue is less
pronounced than with other education indicators, such as net school enrollment rates.
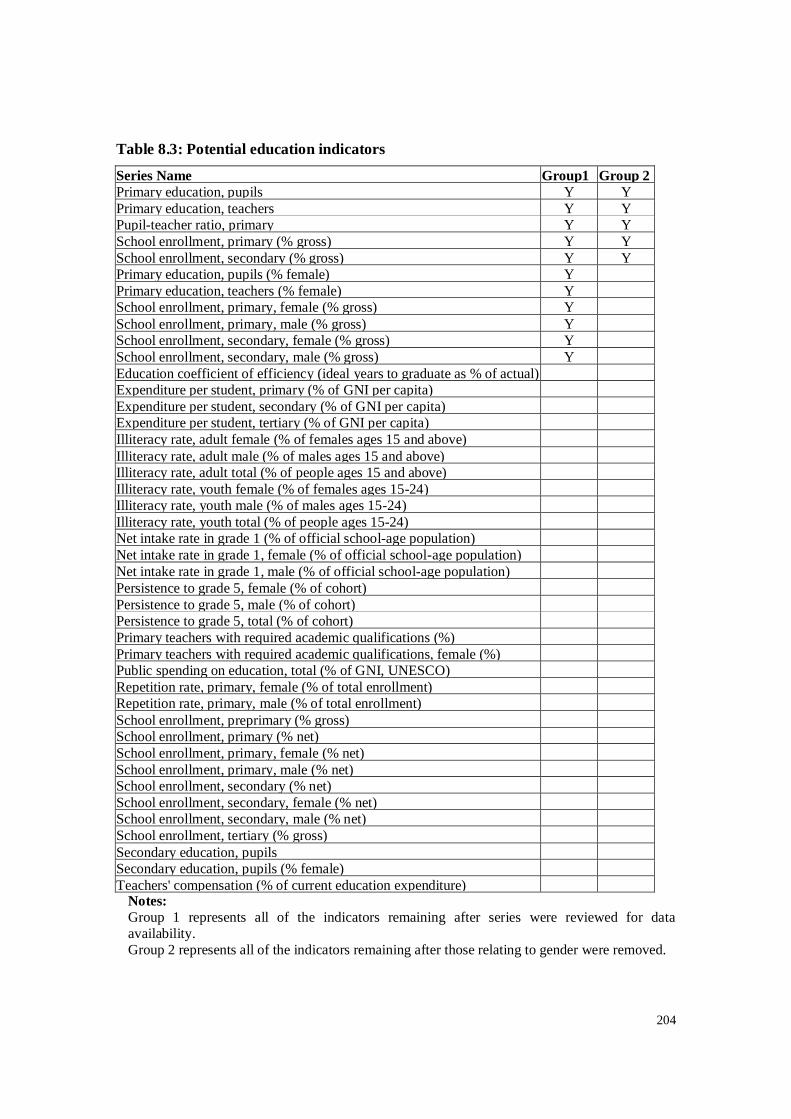
204
Table 8.3: Potential education indicators
Series Name Group1 Group 2 Primary education, pupils Y Y Primary education, teachers Y Y Pupil-teacher ratio, primary Y Y School enrollment, primary (% gross) Y Y School enrollment, secondary (% gross) Y Y Primary education, pupils (% female) Y Primary education, teachers (% female) Y School enrollment, primary, female (% gross) Y School enrollment, primary, male (% gross) Y School enrollment, secondary, female (% gross) Y School enrollment, secondary, male (% gross) Y Education coefficient of efficiency (ideal years to graduate as % of actual) Expenditure per student, primary (% of GNI per capita) Expenditure per student, secondary (% of GNI per capita) Expenditure per student, tertiary (% of GNI per capita) Illiteracy rate, adult female (% of females ages 15 and above) Illiteracy rate, adult male (% of males ages 15 and above) Illiteracy rate, adult total (% of people ages 15 and above) Illiteracy rate, youth female (% of females ages 15-24) Illiteracy rate, youth male (% of males ages 15-24) Illiteracy rate, youth total (% of people ages 15-24) Net intake rate in grade 1 (% of official school-age population) Net intake rate in grade 1, female (% of official school-age population) Net intake rate in grade 1, male (% of official school-age population) Persistence to grade 5, female (% of cohort) Persistence to grade 5, male (% of cohort) Persistence to grade 5, total (% of cohort) Primary teachers with required academic qualifications (%) Primary teachers with required academic qualifications, female (%) Public spending on education, total (% of GNI, UNESCO) Repetition rate, primary, female (% of total enrollment) Repetition rate, primary, male (% of total enrollment) School enrollment, preprimary (% gross) School enrollment, primary (% net) School enrollment, primary, female (% net) School enrollment, primary, male (% net) School enrollment, secondary (% net) School enrollment, secondary, female (% net) School enrollment, secondary, male (% net) School enrollment, tertiary (% gross) Secondary education, pupils Secondary education, pupils (% female) Teachers' compensation (% of current education expenditure)
Notes: Group 1 represents all of the indicators remaining after series were reviewed for data availability. Group 2 represents all of the indicators remaining after those relating to gender were removed.
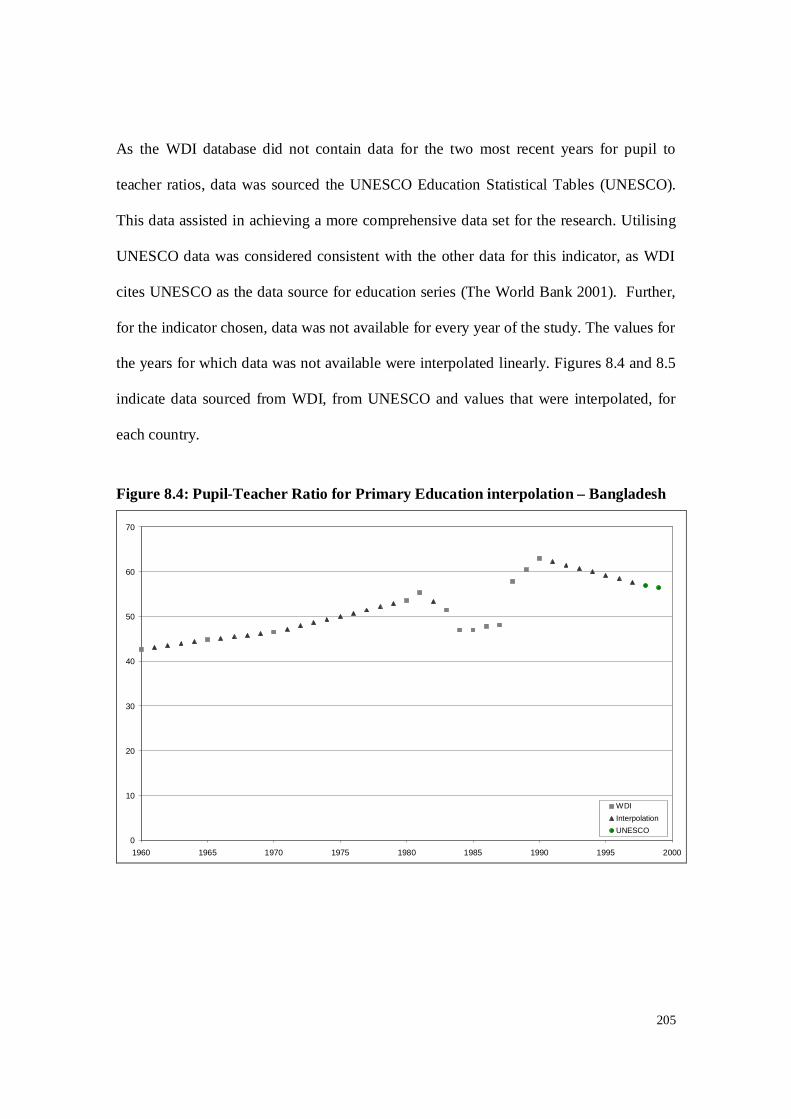
205
As the WDI database did not contain data for the two most recent years for pupil to
teacher ratios, data was sourced the UNESCO Education Statistical Tables (UNESCO).
This data assisted in achieving a more comprehensive data set for the research. Utilising
UNESCO data was considered consistent with the other data for this indicator, as WDI
cites UNESCO as the data source for education series (The World Bank 2001). Further,
for the indicator chosen, data was not available for every year of the study. The values for
the years for which data was not available were interpolated linearly. Figures 8.4 and 8.5
indicate data sourced from WDI, from UNESCO and values that were interpolated, for
each country.
Figure 8.4: Pupil-Teacher Ratio for Primary Education interpolation – Bangladesh
0
10
20
30
40
50
60
70
1960 1965 1970 1975 1980 1985 1990 1995 2000
WDIInterpolationUNESCO

206
Figure 8.5: Pupil-Teacher Ratio for Primary Education interpolation – Tanzania
0
10
20
30
40
50
60
1960 1965 1970 1975 1980 1985 1990 1995 2000
WDIInterpolationUNESCO
8.2.3 End points for indicators
The next step undertaken was to establish end points for each of the three indicators, by
which the progress of each of the countries that are the subject of this research can be
measured. The HDI refers to these endpoints as maximum and minimum values. Given
that for two of the three indicators in the modified development index, a lower value
indicates an improvement in the standard, to avoid confusion, the end points are referred
to as “best” and “worst”, with best indicating the way the time series should move for
improvement. Therefore the calculation of the value of each component is:

207
- Worst ( ) Index =Best ( ) - Worst ( )
ii
X XX X
Where X = the component and i = the country
The value of the end points chosen had to be relevant to the observations over the forty
year span of the research. Therefore, the approach was to execute a query over all
countries for which data was held for the time period 1960 to 1999 for each indicator to
identify the most extreme values observed, both best and worst. For income the PWT
database was utilised, for the health indicator the WDI database was utilised, and for
education the WDI database and UNESCO statistics were utilised.
For income, the worst observation was US$107 that occurred for Tanzania in 1961 and
the best US$44,322 that occurred for Luxemburg in 1999. For child mortality, the worst
observation was Mali in 1960 at 517 per 1,000 live births, however, the next worst
observation was 391 for Mali in 1970. The latter observation was utilised as the 1960
figure was not consistent with observations for other countries and would have impacted
on ratings assigned. The best observation of child mortality of 4 per 1,000 live births was
observed for Japan, Norway and Singapore in 1999. For pupil teacher ratio the worst
observation of 91.56 (rounded to 92) pupils per teacher was observed for Chad in 1960
and the best of 5.23 (rounded to 5) pupils per teacher was observed for San Marino in
1996.

208
8.3 Calculation of index for Bangladesh and Tanzania
As it has been determined how each indicator will be measured and what the end points
will be, the next step was the calculation of the index for Bangladesh and Tanzania. The
calculated values of the indices for both countries for the period of study, constructed via
arithmetic and geometric mean, are presented in Table 8.4. The index based on the
arithmetic mean is referred to as ‘AHDI’ while the index based on the geometric mean is
referred to as ‘GHDI’.
For completeness, the value of each index is also presented graphically, with Figure 8.6
demonstrating the modified development index for each country constructed via
arithmetic mean, AHDI, and Figure 8.7 demonstrating the value of the modified
development index for each country constructed via geometric mean, GHDI. On these
graphs, the globalisation period is differentiated from the earlier period by a vertical line.
It is pertinent to note that for both countries, the value of AHDI is relatively similar.
Bangladesh exhibits slightly higher values between 1960 and 1971, and from 1992
onwards, although Tanzania exhibits higher values in the middle period. GHDI reveals a
similar picture, albeit Tanzania takes over much later and for a shorter period.
Additionally, with GDHI, Tanzania starts in a much worse position than Bangladesh
around 1960.
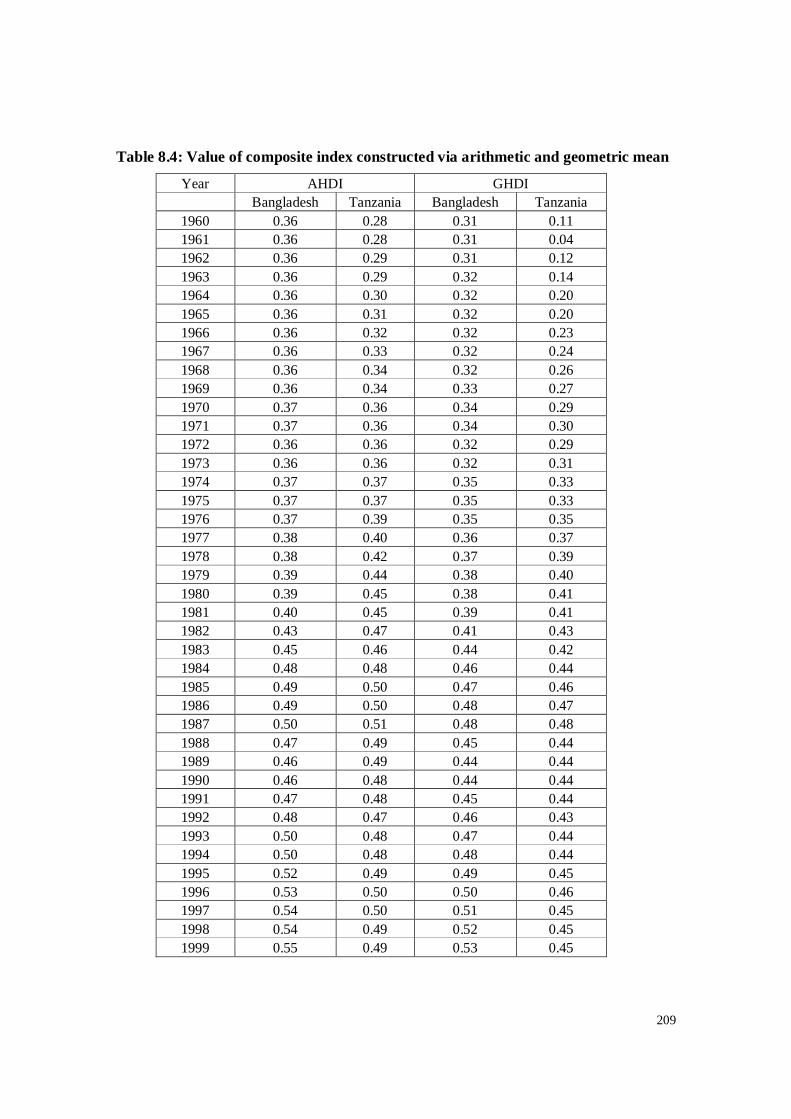
209
Table 8.4: Value of composite index constructed via arithmetic and geometric mean
Year AHDI GHDI Bangladesh Tanzania Bangladesh Tanzania
1960 0.36 0.28 0.31 0.11 1961 0.36 0.28 0.31 0.04 1962 0.36 0.29 0.31 0.12 1963 0.36 0.29 0.32 0.14 1964 0.36 0.30 0.32 0.20 1965 0.36 0.31 0.32 0.20 1966 0.36 0.32 0.32 0.23 1967 0.36 0.33 0.32 0.24 1968 0.36 0.34 0.32 0.26 1969 0.36 0.34 0.33 0.27 1970 0.37 0.36 0.34 0.29 1971 0.37 0.36 0.34 0.30 1972 0.36 0.36 0.32 0.29 1973 0.36 0.36 0.32 0.31 1974 0.37 0.37 0.35 0.33 1975 0.37 0.37 0.35 0.33 1976 0.37 0.39 0.35 0.35 1977 0.38 0.40 0.36 0.37 1978 0.38 0.42 0.37 0.39 1979 0.39 0.44 0.38 0.40 1980 0.39 0.45 0.38 0.41 1981 0.40 0.45 0.39 0.41 1982 0.43 0.47 0.41 0.43 1983 0.45 0.46 0.44 0.42 1984 0.48 0.48 0.46 0.44 1985 0.49 0.50 0.47 0.46 1986 0.49 0.50 0.48 0.47 1987 0.50 0.51 0.48 0.48 1988 0.47 0.49 0.45 0.44 1989 0.46 0.49 0.44 0.44 1990 0.46 0.48 0.44 0.44 1991 0.47 0.48 0.45 0.44 1992 0.48 0.47 0.46 0.43 1993 0.50 0.48 0.47 0.44 1994 0.50 0.48 0.48 0.44 1995 0.52 0.49 0.49 0.45 1996 0.53 0.50 0.50 0.46 1997 0.54 0.50 0.51 0.45 1998 0.54 0.49 0.52 0.45 1999 0.55 0.49 0.53 0.45
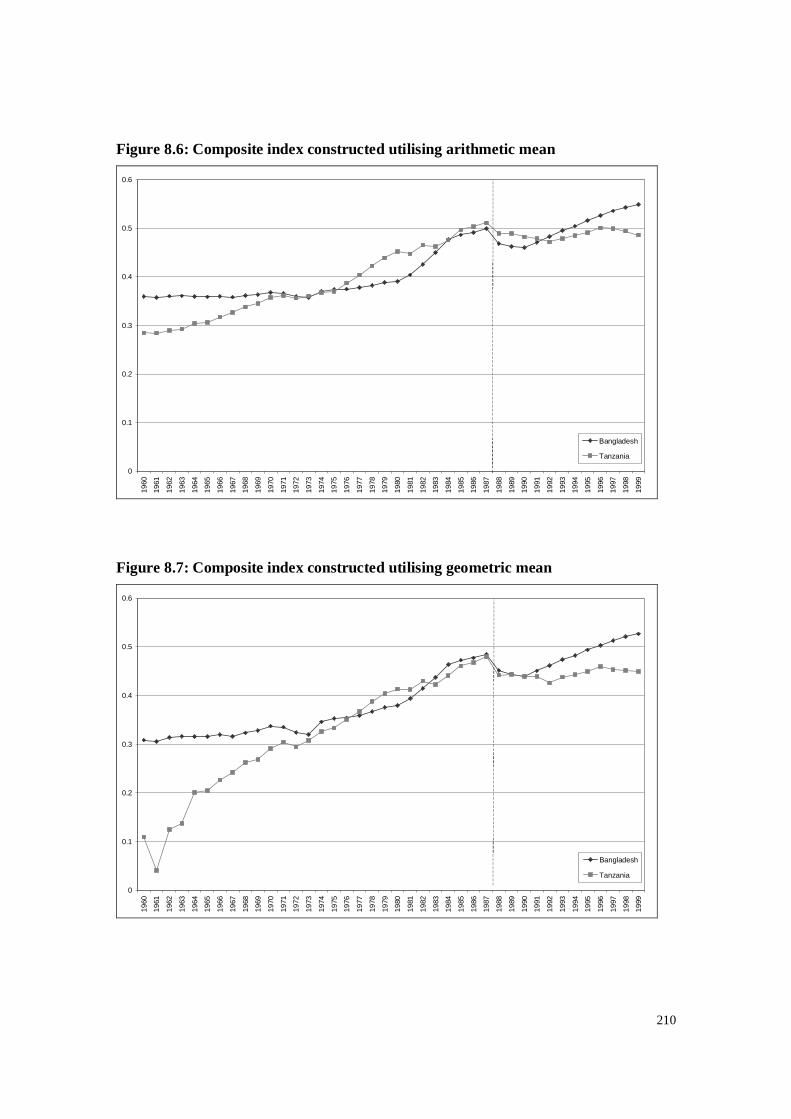
210
Figure 8.6: Composite index constructed utilising arithmetic mean
0
0.1
0.2
0.3
0.4
0.5
0.6
1960
1961
1962
1963
1964
1965
1966
1967
1968
1969
1970
1971
1972
1973
1974
1975
1976
1977
1978
1979
1980
1981
1982
1983
1984
1985
1986
1987
1988
1989
1990
1991
1992
1993
1994
1995
1996
1997
1998
1999
Bangladesh
Tanzania
Figure 8.7: Composite index constructed utilising geometric mean
0
0.1
0.2
0.3
0.4
0.5
0.6
1960
1961
1962
1963
1964
1965
1966
1967
1968
1969
1970
1971
1972
1973
1974
1975
1976
1977
1978
1979
1980
1981
1982
1983
1984
1985
1986
1987
1988
1989
1990
1991
1992
1993
1994
1995
1996
1997
1998
1999
Bangladesh
Tanzania

211
What is observed for each country can largely be explained by the investment that
Tanzania undertook in development as part of its socialist philosophy, and the external
borrowings it made to facilitate development in the 1970s and early 1980s. As Tanzania’s
economic performance deteriorated in the 1980s and through the 1990s, and less donor
funds were made available, Tanzania became less able to fund development. Income,
which is part of the modified development index, was also adversely affected by the
economic crisis evidenced by Tanzania in the mid 1980s. In contrast, Bangladesh
deliberately chose not to undertake extensive foreign borrowings during the middle
period, which slowed its efforts in development. However, due to the success of reforms
implemented, which saw income grow, and conscious development policies
implemented, the performance of Bangladesh with respect to development exceeded that
of Tanzania during most of the 1990s.
8.4 Analysis of development indices
8.4.1 Correlation of AHDI and GHDI
Correlation measures the strength or degree of linear association between two variables
or time series. The rationale for examining the correlation between AHDI and GHDI was
that if the two indices are highly correlated then it is sufficient to undertake the remaining
analysis with just one of the indices.
Correlation coefficients were calculated between AHDI and GHDI for both Bangladesh
and Tanzania from 1960 to 1999 inclusive. The results were 0.989 for Bangladesh and

212
0.968 for Tanzania. They indicate that AHDI and GHDI are strongly correlated for each
of the two countries. Given the degree of correlation between the indices for both
countries, it was decided that examining GHDI as well as AHDI was unlikely to provide
largely different insights to only examining AHDI. Therefore, only AHDI was utilised for
the remainder of the analysis.
8.4.2 Correlation of AHDI and its components
The correlation coefficients between the components of AHDI and the overall index were
calculated for each country. Given that the modified development index has already been
constructed, the outcomes of this analysis will not influence whether the overall index or
one of its components will be used going forward. The analysis serves to understand the
association between the components for the period studied. A further purpose of the
analysis is to provide evidence to support, or otherwise, earlier findings that the
components of the HDI are highly correlated with the original index (for example,
Chowdhury 1991; Khusro 1999).
Based on previous research and the construction of the index by arithmetic mean, it
would be expected that the individual components of the index be highly correlated with
each other and the overall index. This is because each component represents an aspect of
development. More generally, it is expected that development improves over the period
of the study. The rationale for this is that international agencies, such as the United
Nations, have instigated numerous programmes aimed at improving development in the
LDCs. Additionally, governments of these countries have also allocated expenditures to

213
key development areas, such as health and education. The correlation matrices for each
country from 1960 to 1999 inclusive are presented in Tables 8.5 and 8.6.
Table 8.5: Correlation matrix – Bangladesh AHDI and its components
Bangladesh 1960 to 1999 Education Health Income
AHDI -0.69521 *** 0.979347 *** 0.965755 *** Education -0.818353 *** -0.847049 ***
Health 0.988801 *** Note: *** denotes significance at the 1% level, ** denotes significance at the 5% level and * denotes significance at the 10% level
Table 8.6: Correlation matrix – Tanzania AHDI and its components
Tanzania 1960 to 1999
Education Health Income
AHDI 0.928888 *** 0.968245 *** 0.975377 ***
Education 0.834820 *** 0.844266 ***
Health 0.954255 ***
Note: *** denotes significance at the 1% level, ** denotes significance at the 5% level and * denotes significance at the 10% level
As was determined earlier in this chapter, income is represented by GDP per capita (PPP
adjusted), education by the pupil-to-teacher ratio and health by the child mortality rate
(per 1000 births). For income, the higher the value of the indicator the better, whereas for
the education and health indicators, the lower the value of the indicator, the better. For
Bangladesh, the education component of the index has a negative association with the
other components, while the health and income components are highly correlated. For

214
Tanzania, the income and health components are also highly correlated. In contrast to
Bangladesh, the education component for Tanzania does have a positive association with
the two other components, however, the strength of association is less than between the
income and health components. The most interesting aspect of this analysis is the
education indicator for Bangladesh, which justifies further analysis.
From Figure 8.4 it is apparent that the Bangladesh education time series has a breaking
trend component. From 1960 up until around 1980, the Pupil-Teacher Ratio increases,
then decreases between 1980 and 1984 before rising sharply to peak at 63 in 1990. The
ratio then decreases for the remaining period of the study. Notably, with this indicator, a
decrease in the value, that is, less pupils per teacher, indicates an improvement, and
alternately, an increase in the value indicates deterioration, that more students need to
share a teacher. As previously mentioned, it is expected that the indicators of
development exhibit an improvement over time, which does not occur with this indicator.
In summary then, up until 1980 the education indicator declines, but then improves
sharply, before declining again, but improves beyond 1990.
The trends observed in the Pupil-Teacher Ratio are explained by a large increase in
primary education pupils between 1960 and 1980 from 3.4 to 8.2 million, without a
corresponding increase in teachers, as the number of teachers less than doubled over the
same period from 80,000 to 153,000 (The World Bank 2001). As broad reforms were
introduced in the Bangladesh economy in the 1980s, education increased in priority and
both public sector funding and foreign aid was directed toward the sector (The World
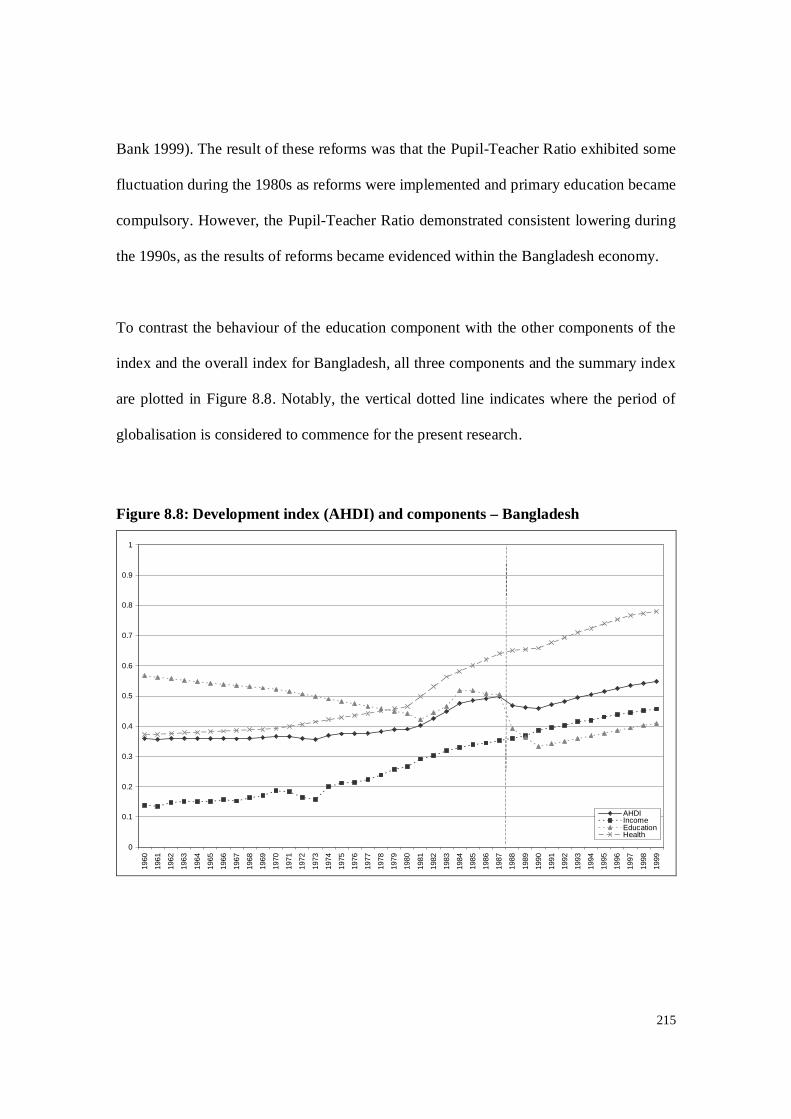
215
Bank 1999). The result of these reforms was that the Pupil-Teacher Ratio exhibited some
fluctuation during the 1980s as reforms were implemented and primary education became
compulsory. However, the Pupil-Teacher Ratio demonstrated consistent lowering during
the 1990s, as the results of reforms became evidenced within the Bangladesh economy.
To contrast the behaviour of the education component with the other components of the
index and the overall index for Bangladesh, all three components and the summary index
are plotted in Figure 8.8. Notably, the vertical dotted line indicates where the period of
globalisation is considered to commence for the present research.
Figure 8.8: Development index (AHDI) and components – Bangladesh
0
0.1
0.2
0.3
0.4
0.5
0.6
0.7
0.8
0.9
1
1960
1961
1962
1963
1964
1965
1966
1967
1968
1969
1970
1971
1972
1973
1974
1975
1976
1977
1978
1979
1980
1981
1982
1983
1984
1985
1986
1987
1988
1989
1990
1991
1992
1993
1994
1995
1996
1997
1998
1999
AHDIIncomeEducationHealth
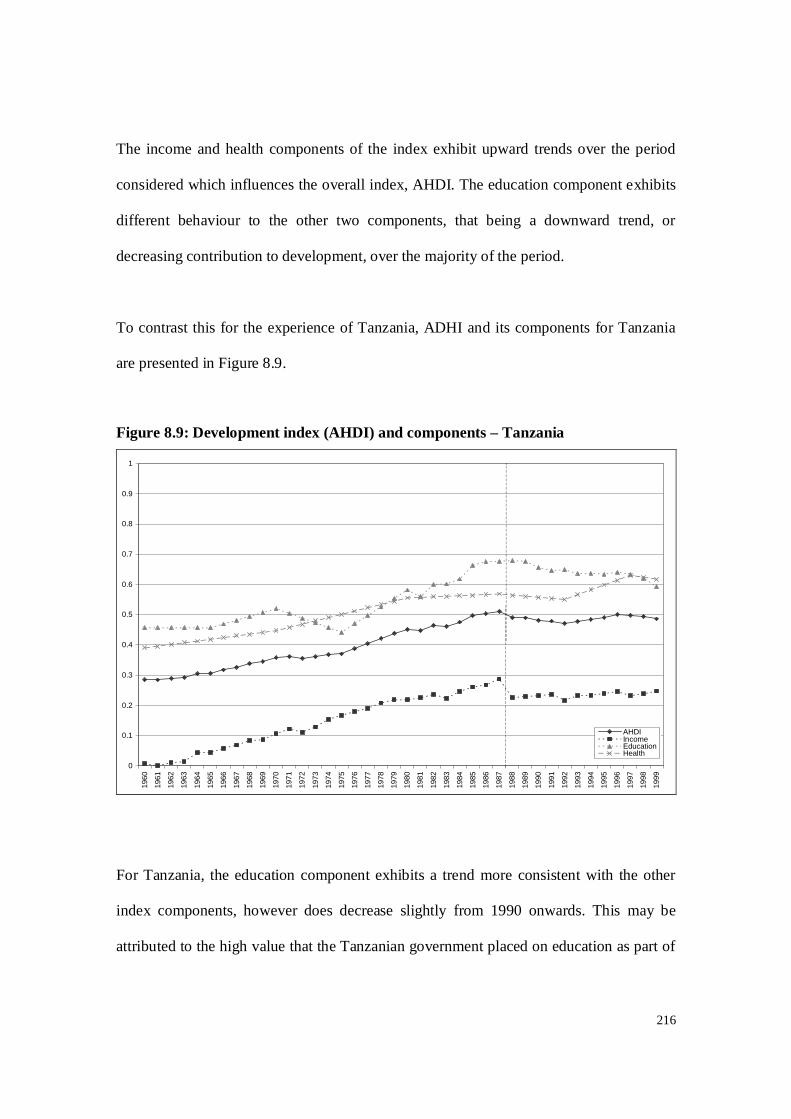
216
The income and health components of the index exhibit upward trends over the period
considered which influences the overall index, AHDI. The education component exhibits
different behaviour to the other two components, that being a downward trend, or
decreasing contribution to development, over the majority of the period.
To contrast this for the experience of Tanzania, ADHI and its components for Tanzania
are presented in Figure 8.9.
Figure 8.9: Development index (AHDI) and components – Tanzania
0
0.1
0.2
0.3
0.4
0.5
0.6
0.7
0.8
0.9
1
1960
1961
1962
1963
1964
1965
1966
1967
1968
1969
1970
1971
1972
1973
1974
1975
1976
1977
1978
1979
1980
1981
1982
1983
1984
1985
1986
1987
1988
1989
1990
1991
1992
1993
1994
1995
1996
1997
1998
1999
AHDIIncomeEducationHealth
For Tanzania, the education component exhibits a trend more consistent with the other
index components, however does decrease slightly from 1990 onwards. This may be
attributed to the high value that the Tanzanian government placed on education as part of
217
its Socialist policies between 1960 and 1990. However, as economic performance
deteriorated during the 1980s and remained weak during the 1990s, the Tanzanian
government was less able to invest in the education sector.
8.4.3 Changes in the development index during the globalisation period
The purpose of this section is to compare and contrast how the development index and its
components changed for each country during the pre-globalisation and globalisation
periods. The pre-globalisation time period is defined as 1960 to 1987, and globalisation
as 1988 to 1999. To commence the analysis, a time trend was fitted onto the development
index for each country to determine if the slope was the same during the two periods.
Chow tests for structural break were undertaken for each country, with the breakpoint set
at 1988, the commencement of the globalisation period. The Chow test is used to
determine the occurrence of a structural change in a time series at the point specified
(Quantitative Micro Software 1999). The results indicated that at the 5% significance
level, there is no break in case of Bangladesh, but there is a break in the case of Tanzania.
This suggests that the same trends observed for the development index in the pre-
globalisation period carried forward to the globalisation period for Bangladesh, but for
Tanzania, the trends differed during the two periods. As a consequence of this finding, if
analysis was only being carried out on the overall index, for Bangladesh it would be
unnecessary to study each period separately. For Tanzania, there would be merit in
studying the two periods separately. Given that the analysis encompasses not only the
overall index but also the components of the index, consideration of the time periods will
be included.
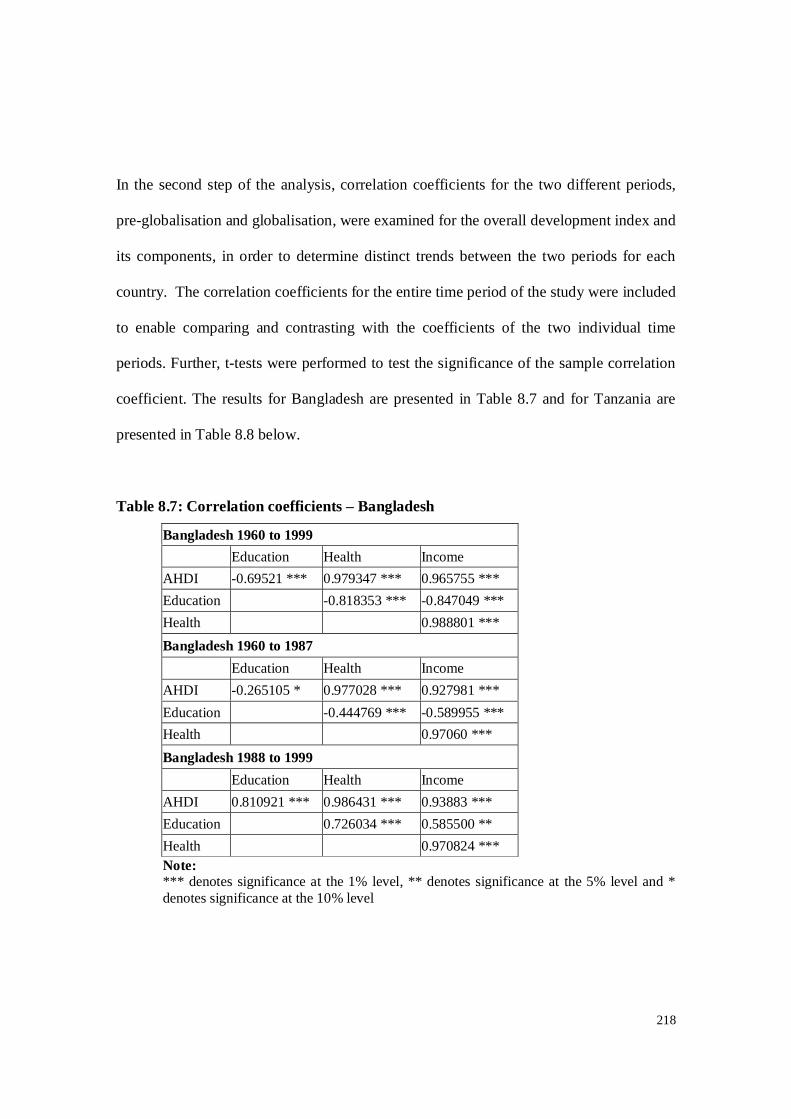
218
In the second step of the analysis, correlation coefficients for the two different periods,
pre-globalisation and globalisation, were examined for the overall development index and
its components, in order to determine distinct trends between the two periods for each
country. The correlation coefficients for the entire time period of the study were included
to enable comparing and contrasting with the coefficients of the two individual time
periods. Further, t-tests were performed to test the significance of the sample correlation
coefficient. The results for Bangladesh are presented in Table 8.7 and for Tanzania are
presented in Table 8.8 below.
Table 8.7: Correlation coefficients – Bangladesh
Note: *** denotes significance at the 1% level, ** denotes significance at the 5% level and * denotes significance at the 10% level
Bangladesh 1960 to 1999 Education Health Income AHDI -0.69521 *** 0.979347 *** 0.965755 *** Education -0.818353 *** -0.847049 *** Health 0.988801 *** Bangladesh 1960 to 1987 Education Health Income AHDI -0.265105 * 0.977028 *** 0.927981 *** Education -0.444769 *** -0.589955 *** Health 0.97060 *** Bangladesh 1988 to 1999 Education Health Income AHDI 0.810921 *** 0.986431 *** 0.93883 *** Education 0.726034 *** 0.585500 ** Health 0.970824 ***
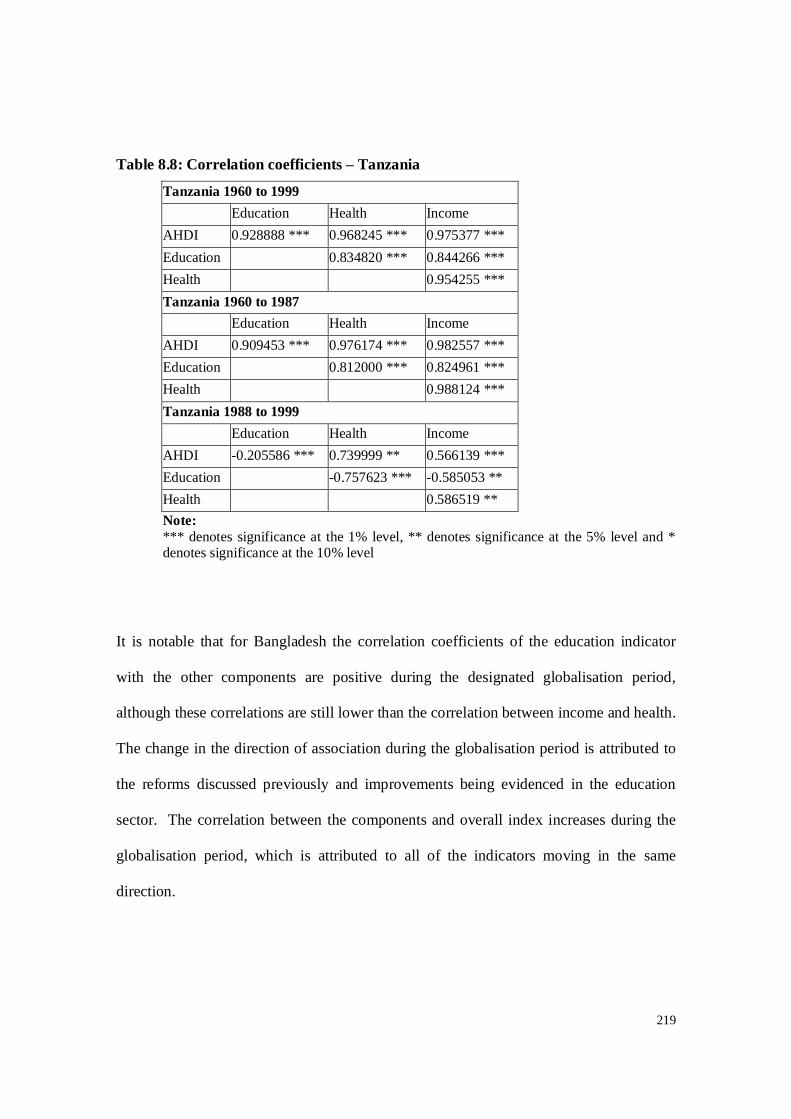
219
Table 8.8: Correlation coefficients – Tanzania
Tanzania 1960 to 1999 Education Health Income AHDI 0.928888 *** 0.968245 *** 0.975377 *** Education 0.834820 *** 0.844266 *** Health 0.954255 *** Tanzania 1960 to 1987 Education Health Income AHDI 0.909453 *** 0.976174 *** 0.982557 *** Education 0.812000 *** 0.824961 *** Health 0.988124 *** Tanzania 1988 to 1999 Education Health Income AHDI -0.205586 *** 0.739999 ** 0.566139 *** Education -0.757623 *** -0.585053 ** Health 0.586519 ** Note: *** denotes significance at the 1% level, ** denotes significance at the 5% level and * denotes significance at the 10% level
It is notable that for Bangladesh the correlation coefficients of the education indicator
with the other components are positive during the designated globalisation period,
although these correlations are still lower than the correlation between income and health.
The change in the direction of association during the globalisation period is attributed to
the reforms discussed previously and improvements being evidenced in the education
sector. The correlation between the components and overall index increases during the
globalisation period, which is attributed to all of the indicators moving in the same
direction.
220
Interestingly, for Tanzania in the globalisation period the association between education
and the other components of the index becomes negative, reflecting the decreasing value
of the education component of the index noted previously. Additionally, the strength of
correlation between the other two components, health and income, weakens in the
globalisation period. The income component, while fluctuating, exhibits neither a clear
upward nor a downward trend during the globalisation period. The health indicator
exhibits an upward trend. As the overall index is the arithmetic mean of the three
components, it is influenced by the different directions of the components during the
globalisation period, and is therefore less highly correlated with the components in this
period than in the pre-globalisation period when all components generally moved in the
same direction.
8.5 Inclusion of an environmental indicator
In the final section of this chapter, consideration is given to including an environmental
indicator in the modified index that has been created. Inclusion of an environmental
indicator is one aspect that has been raised as a potential enhancement to the HDI. For
example, Sagar and Najam (1998) recommend to incorporate sustainability concerns into
the HDI. Sagar and Najam point out that if a country is destroying its natural capital to
achieve a certain level of development, then the development achievements are not
necessarily sustainable. Similarly Neumayer (2001) suggests linking the HDI with
sustainability would enable the UNDP to check whether a country is ‘mortgaging the
choices of future generations’.
221
Environmental aspects that could be considered for inclusion in a development index fall
into the broad categories of sustainability and quality. Sustainability refers to preserving
environmental resources for future generations, while quality pertains to the standard of
environmental resources available to the present inhabitants of an area. In this sense,
quality is about the now, whereas sustainability is about the future. Quality is desirable
both in its own right and because of the detrimental effects impairment of environmental
quality gives rise to. Clean water and fresh air are desirable by-products of an unspoiled
environment, while lower levels of human health and reduced economic productivity are
adverse consequences of environmental damage (The World Bank 1992).
There are two economic issues associated with the consumption of environmental
resources. The first is undervaluation of resources, so that they are consumed in such a
way that does not reflect their true cost. Not taking into account resource depletion for
future generations is an example of this. A second issue for economists is that of
environmental externalities, whereby those creating the adverse effects do not pay for
them, or that those that are negatively impacted by an activity are not compensated. An
example of an externality is manufacturing industries generating pollution.
In the context of globalisation, one of the adverse environmental implications for
developing countries discussed in Chapter 2 pertained to overexploitation of natural
resources, for example, overworking agricultural land or undertaking excessive fishing
practices. Such activities reduce the natural resources available for future generations,
and are therefore issues of sustainability. A further problem in developing countries is

222
urbanisation without adequate infrastructure reducing environmental quality, for
example, through water pollution because of poor sanitation. Manufacturing activity also
has a tendency to generate pollution. For most developing countries that are keen to
develop manufacturing sectors or attract foreign investment, the external costs of
manufacturing are not taken into consideration.
There have been prior attempts to consider environmental implications within the HDI.
The approach taken by Desai (1995a) was to construct a second index broadly utilising
the same methodology as the HDI, referring to this index as the Ordinal Green Index
(OGI). Notably, Desai constructed the OGI for a single year with the purpose of
comparing the rankings of countries. In linking the OGI with the HDI, Desai proposed
calculating either the arithmetic or geometric mean of the rankings for the two indices.
Further, Desai utilised different sets of variables for rich and poor countries, providing
the following justification:
It can be argued… that the environment problem is a very different one for rich
and poor countries…. Thus, it may make sense to measure the environmental state
of a country by variables appropriate to its income and overall development
level.”
For poor countries, the indicators used by Desai are population with access to safe
drinking water, annual rate of deforestation, change in fuelwood since 1979, greenhouse
emissions and energy efficiency. Poor data availability, however, prohibits this approach
for measuring change in a nation’s environmental well-being over time.
223
Neumayer (2001) also proposed a means to incorporate environmental considerations
with the HDI. The approach of Neumayer involved producing an index to be used in
conjunction with the HDI, to reflect the sustainability of a country’s achieved level of
human development. Neumayer provided four reasons why environmental issues should
not be directly integrated within the HDI. Firstly, there is no direct relationship between
resource exploitation, environmental degradation and the level of human development.
Secondly, the existing variables in the HDI provide an unambiguous indication of
improvement whereas environmental goals do not provide the same clarity (for example,
reducing pollution to zero is not an achievable goal). Thirdly, including a new variable
that attempts to measure environmental issues would strengthen the claims of critics of
the HDI that components should be separately examined. Finally, without recalculating
the index with the new formula for preceding years, structural comparison of earlier years
would be impossible. Neumayer also pointed out that constructing a green HDI along
side the standard HDI, as Desai proposed, would not find a lot of interest. This is
supported by the fact that Neumayer’s contribution occurred six years after Desai’s and
there had been no attempt to build on Desai’s work in that time period.
The contribution of Neumayer focussed on sustainability, whereas Desai’s approach
incorporated aspects of both environmental quality and sustainability within the index
developed. Neumayer analysed for which countries depreciation of natural resource stock
should be calculated. The criteria established involved both positive net savings rates and
resource rents large enough to influence genuine savings rates. Less than twenty countries
met the criteria.

224
The 1992 edition of the World Development Report (The World Bank 1992) was
dedicated to exploring the links between economic development and the environment,
and was therefore reviewed in anticipation of providing some basis for incorporation of
environmental indicators into the modified development index being created in the
current research. The Report summarises the environmental issues faced by developing
countries as being unsafe water, inadequate sanitation, soil depletion, indoor smoke from
cooking fires and outdoor smoke from coal burning and indicates these problems are
different, and more life threatening than the environmental problems faced by developed
countries, such as carbon dioxide emissions and depletion of the ozone layer (The World
Bank 1992). This synopsis of issues is largely aligned to the analysis of Desai.
Data availability for measuring changes to the environment is extremely poor. The WDI
lists sixty eight potential environment indicators, however, data was available for only
twenty six of these indicators for the period of the study for Bangladesh and Tanzania,
and these indicators, although categorized under environment, were not such that
meaningful indication of change in environmental conditions could be gauged. To
support this statement, the list of indicators is provided in Table 8.9.
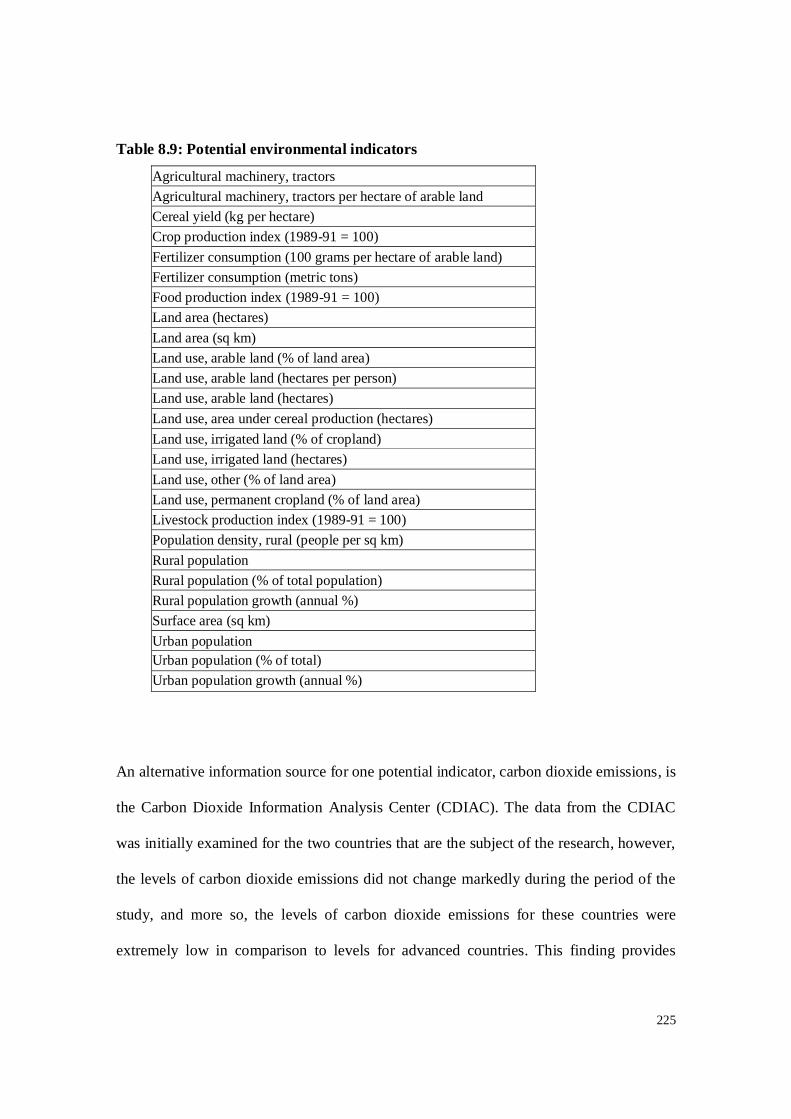
225
Table 8.9: Potential environmental indicators
Agricultural machinery, tractors Agricultural machinery, tractors per hectare of arable land Cereal yield (kg per hectare) Crop production index (1989-91 = 100) Fertilizer consumption (100 grams per hectare of arable land) Fertilizer consumption (metric tons) Food production index (1989-91 = 100) Land area (hectares) Land area (sq km) Land use, arable land (% of land area) Land use, arable land (hectares per person) Land use, arable land (hectares) Land use, area under cereal production (hectares) Land use, irrigated land (% of cropland) Land use, irrigated land (hectares) Land use, other (% of land area) Land use, permanent cropland (% of land area) Livestock production index (1989-91 = 100) Population density, rural (people per sq km) Rural population Rural population (% of total population) Rural population growth (annual %) Surface area (sq km) Urban population Urban population (% of total) Urban population growth (annual %)
An alternative information source for one potential indicator, carbon dioxide emissions, is
the Carbon Dioxide Information Analysis Center (CDIAC). The data from the CDIAC
was initially examined for the two countries that are the subject of the research, however,
the levels of carbon dioxide emissions did not change markedly during the period of the
study, and more so, the levels of carbon dioxide emissions for these countries were
extremely low in comparison to levels for advanced countries. This finding provides
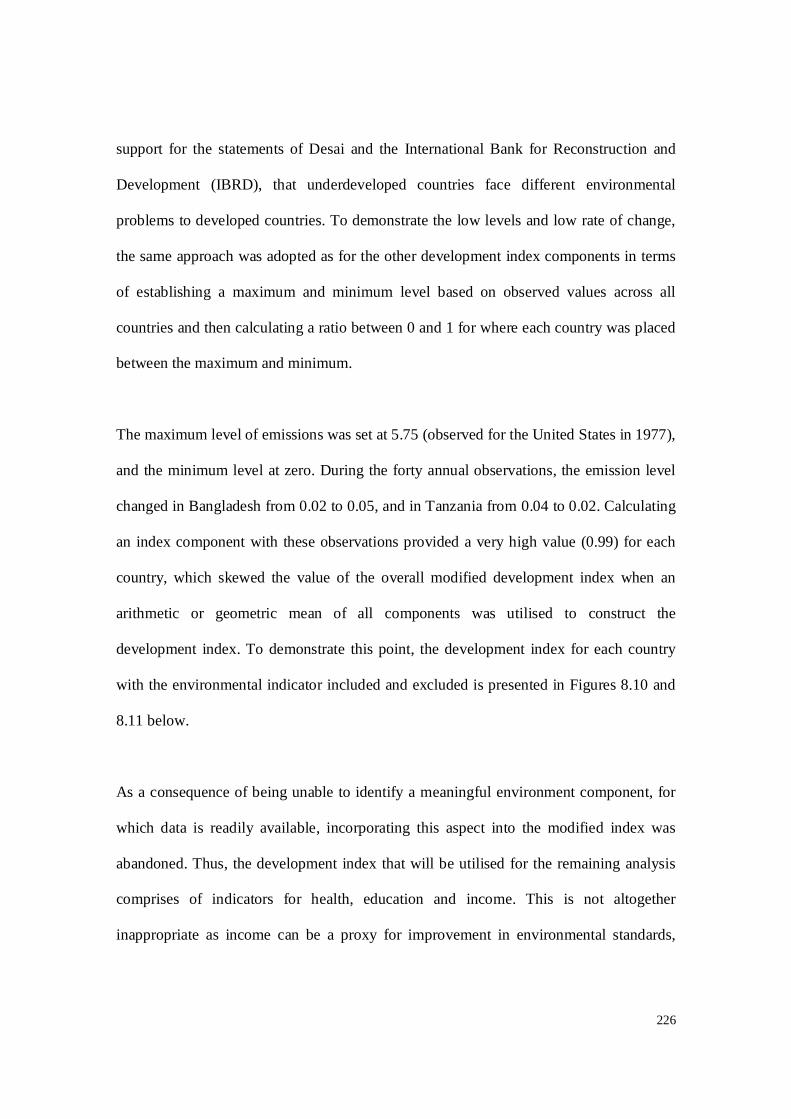
226
support for the statements of Desai and the International Bank for Reconstruction and
Development (IBRD), that underdeveloped countries face different environmental
problems to developed countries. To demonstrate the low levels and low rate of change,
the same approach was adopted as for the other development index components in terms
of establishing a maximum and minimum level based on observed values across all
countries and then calculating a ratio between 0 and 1 for where each country was placed
between the maximum and minimum.
The maximum level of emissions was set at 5.75 (observed for the United States in 1977),
and the minimum level at zero. During the forty annual observations, the emission level
changed in Bangladesh from 0.02 to 0.05, and in Tanzania from 0.04 to 0.02. Calculating
an index component with these observations provided a very high value (0.99) for each
country, which skewed the value of the overall modified development index when an
arithmetic or geometric mean of all components was utilised to construct the
development index. To demonstrate this point, the development index for each country
with the environmental indicator included and excluded is presented in Figures 8.10 and
8.11 below.
As a consequence of being unable to identify a meaningful environment component, for
which data is readily available, incorporating this aspect into the modified index was
abandoned. Thus, the development index that will be utilised for the remaining analysis
comprises of indicators for health, education and income. This is not altogether
inappropriate as income can be a proxy for improvement in environmental standards,
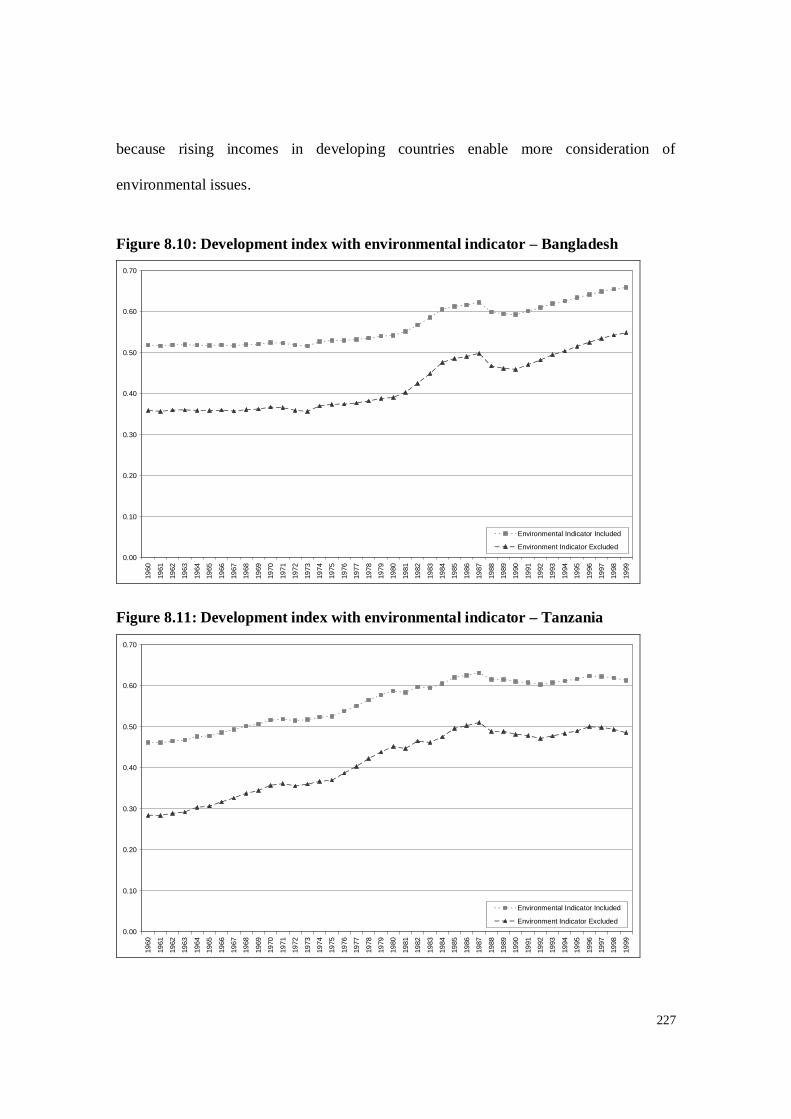
227
because rising incomes in developing countries enable more consideration of
environmental issues.
Figure 8.10: Development index with environmental indicator – Bangladesh
0.00
0.10
0.20
0.30
0.40
0.50
0.60
0.70
1960
1961
1962
1963
1964
1965
1966
1967
1968
1969
1970
1971
1972
1973
1974
1975
1976
1977
1978
1979
1980
1981
1982
1983
1984
1985
1986
1987
1988
1989
1990
1991
1992
1993
1994
1995
1996
1997
1998
1999
Environmental Indicator Included
Environment Indicator Excluded
Figure 8.11: Development index with environmental indicator – Tanzania
0.00
0.10
0.20
0.30
0.40
0.50
0.60
0.70
1960
1961
1962
1963
1964
1965
1966
1967
1968
1969
1970
1971
1972
1973
1974
1975
1976
1977
1978
1979
1980
1981
1982
1983
1984
1985
1986
1987
1988
1989
1990
1991
1992
1993
1994
1995
1996
1997
1998
1999
Environmental Indicator Included
Environment Indicator Excluded
228
8.6 Conclusion
This chapter presented the generation of an alternative or modified development index,
based on the widely accepted Human Development Index. In creating the new index,
criticisms and suggestions of the HDI were taken into consideration. The purpose and
objectives of the current research were also taken into consideration, and therefore one of
the criteria for the components of the modified index was responsiveness to change.
Some of the areas explored for inclusion in the modified index were inequality and the
environment, however, largely due to data constraints and lack of suitable indicators
within these categories, the new index continues to utilise the three broad components
utilised by the HDI, that is, income, health and education. Different indicators were
identified for health and education, to those presently utilised within the HDI.
Consideration was given to constructing the modified index utilising a geometric rather
than arithmetic mean of the components, however, upon doing so, the two indices were
highly correlated for both of the subject countries. Therefore, the index was constructed
using the arithmetic mean of the values of the three components, which is consistent with
the approach of the HDI. The three components of the index were assigned equal
weighting, as there has been limited justification for more complex weighting systems. In
order to avoid criticism of arbitrariness of determining the minimum and maximum
values for indicators, upon which progress or change would be measured, values for end
points for each index component were examined across all countries for the entire period
of study. The end points were fixed for the duration of the study, in order to avoid an
issue of shifting goals posts, which was one of the early criticisms of the HDI.
229
The modified development index was calculated for each country between the period of
1960 and 1999. As would be expected, there was improvement in the development of
each country over time. Bangladesh started and ended at a higher level of development
than Tanzania, based on the modified index, although Tanzania did rise above
Bangladesh between 1977 and 1991. In contrasting the globalisation and pre-
globalisation periods, Bangladesh exhibited a consistent level of improvement during the
pre-globalisation and the globalisation periods, whereas Tanzania exhibited stronger
improvement during the pre-globalisation period, but there was little change in the value
of the development index during the globalisation period.
In examining the correlation of components within the composite index, for Bangladesh
the health and income indicators were correlated for both the overall period studied, the
pre-globalisation and the globalisation period. The education indicator moved in the
opposite direction to the other components during the pre-globalisation period, however,
this changed during the globalisation period, which is likely to be attributed to the
progressive reforms of the Bangladesh education sector that were implemented during the
1980s. For Tanzania, there was positive correlation between all components for the
overall period studied, and for the pre-globalisation period. However, the correlation
between the education component and the other components was negative during the
globalisation period, which could be attributed to the economic performance issues
experienced by Tanzania in the 1980s, discussed in Chapter 7, the impact of which would
carry over onto development during the 1990s.
230
In the next chapter the modified index will be analysed with a measure of openness in
order to provide some understanding of the impact of globalisation on development in
Bangladesh and Tanzania.
231
9 Openness and Development
9.1 Introduction
In the previous chapter a modified development index was created, based on the Human
Development Index, with the purpose of measuring the development of Bangladesh and
Tanzania, over designated globalisation and pre-globalisation periods. In this chapter, the
modified development index is compared to a measure of openness, with the objective of
determining if a relationship between openness and development exists, and if so, what
that relationship is. This will shed some light on whether the impact of globalisation on
development has been positive or negative, or whether there has been no impact on the
subject countries. Because there are arguments in the literature to support each of the
three possible outcomes, it is difficult to predict what the relationship will be, however,
given the extent of debate within the literature it is likely that there are both positive and
negative factors that come into play and these may well counterbalance one another.
Additionally, factors specific to the countries being studied are likely to be influential to
the results observed, which may mean that different outcomes are observed for each
country.
The chapter commences with measuring openness for the two countries, and looks at how
openness has changed in both the pre-globalisation and globalisation periods for each
country. Should the countries not have become more open during the globalisation
period, this could be indicative that the countries have been unable to participate in the
most recent period of globalisation.
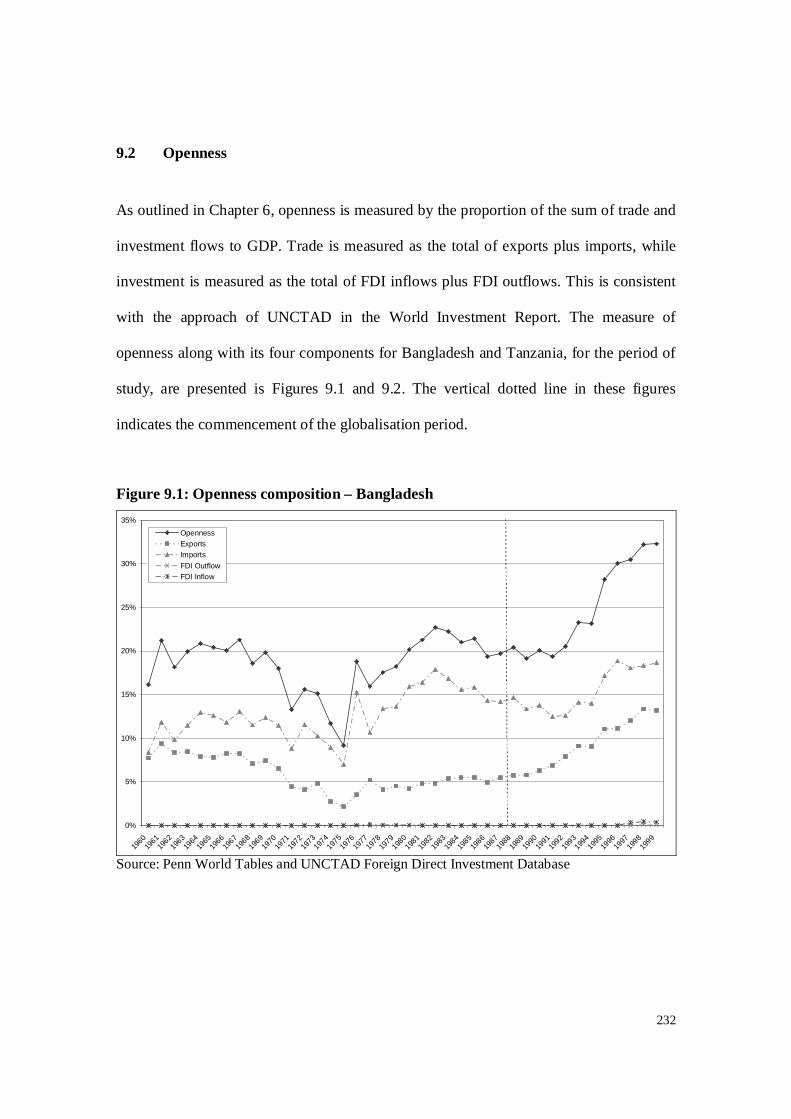
232
9.2 Openness
As outlined in Chapter 6, openness is measured by the proportion of the sum of trade and
investment flows to GDP. Trade is measured as the total of exports plus imports, while
investment is measured as the total of FDI inflows plus FDI outflows. This is consistent
with the approach of UNCTAD in the World Investment Report. The measure of
openness along with its four components for Bangladesh and Tanzania, for the period of
study, are presented is Figures 9.1 and 9.2. The vertical dotted line in these figures
indicates the commencement of the globalisation period.
Figure 9.1: Openness composition – Bangladesh
0%
5%
10%
15%
20%
25%
30%
35%
1960
1961
1962
1963
1964
1965
1966
1967
1968
1969
1970
1971
1972
1973
1974
1975
1976
1977
1978
1979
1980
1981
1982
1983
1984
1985
1986
1987
1988
1989
1990
1991
1992
1993
1994
1995
1996
1997
1998
1999
OpennessExportsImportsFDI OutflowFDI Inflow
Source: Penn World Tables and UNCTAD Foreign Direct Investment Database

233
Figure 9.2: Openness composition – Tanzania
0%
10%
20%
30%
40%
50%
60%
70%
80%
1960
1961
1962
1963
1964
1965
1966
1967
1968
1969
1970
1971
1972
1973
1974
1975
1976
1977
1978
1979
1980
1981
1982
1983
1984
1985
1986
1987
1988
1989
1990
1991
1992
1993
1994
1995
1996
1997
1998
1999
OpennessExportsImportsFDI OutflowFDI Inflow
Source: Penn World Tables and UNCTAD Foreign Direct Investment Database
It is notable that both countries were more open in the globalisation period than the
preceding thirty year period. More specifically, the export levels of each country actually
fell during the pre-globalisation period. Openness in the globalisation period was largely
driven by trade rather than investment in each country, with FDI inflows and outflows
only really occurring in the last few years of the study, and their levels being relatively
small in comparison to trade for both countries.
Given the change in openness experienced by each of the two countries especially in the
early part of the globalisation period, it is evident that neither country has entirely been
by-passed by the most recent period of globalisation. Somewhat interesting is the decline
in openness experienced by Tanzania between 1995 and 1999, by around 26% of GDP.
234
This decline is mainly accounted for by a fall in imports. The country analysis conducted
in Chapter 6 demonstrated a decline in import volumes from 1995 and export volumes
from 1997. These declines occurred despite continued growth in Tanzania’s GDP.
Summarily then, what has been evidenced with respect to Tanzania’s openness during the
latter part of the globalisation period can be accounted for by the fact that GDP of
Tanzania has continued to grow while trade volumes have declined. In contrast to
Tanzania, Bangladesh exhibited a continuous, albeit volatile, increase in openness during
the globalisation period.
9.3 Analytical approach
The overall objective of the analysis undertaken is to test for Granger causality, or
precedent, to determine if openness has preceded development. Prior to being able to test
for Granger causality, the properties of the time series being dealt with need to be
established to reduce the likelihood of spurious results. In order to do this, unit-root and
cointegration tests are performed. The econometric software package EViews1 is used,
which influences the specific tests performed. The analysis is undertaken for the total
period of the study, 1960 to 1999, and then the period prior to the designated
globalisation period, 1960 to 1987, and the designated period of globalisation, 1988 to
1999, in order to compare and contrast the results for the different time periods and
identify any differences in the results for the period of globalisation.
1 Full outputs of all EViews tests are available upon request.

235
As mentioned, the techniques selected for the analysis are among the most common
econometric techniques for analysing time series. Correlation was used in analysing the
development index in the previous chapter, however, as noted in the EViews V3.1 User
Guide:
“Correlation does not necessarily imply causation in any meaningful sense of that word.
The econometric graveyard is full of magnificent correlations, which are simply
spurious or meaningless.”
Therefore, alternative analytical techniques are required to understand if a relationship
exists between the development index and openness.
Unit root testing is utilised to ensure that stationary time series are being dealt with, as
spurious regressions can result from the use of non-stationary variables (Thomas 1997).
Unit root tests will be performed on the levels and first differences of the time series in
order to find out whether they are stationary or have at most two unit roots. Two unit root
tests will be utilised, the Augmented Dickey-Fuller (ADF) test (Dickey & Fuller 1979)
and the Elliott-Rothenberg-Stock (ERS) DF-GLS test (Elliott, Rothenberg & Stock
1996). The ADF is the most commonly used unit root test, although the test has been
criticised by Maddala and Kim (1998) and others for lacking power. The Elliott–
Rothenberg–Stock (ERS, 1996) is similar to the ADF but has better performance in terms
of small sample size and power (Baum 2003), and is therefore considered superior to the
ADF. This is specifically relevant to the globalisation period in the current research
which contains a small number of observations for each country.

236
Cointegration occurs when two time series are not stationary, but their linear combination
is stationary. The presence of cointegration allows the analysis to progress as if the time
series are stationary (Halcoussis 2005). If time series are cointegrated, causality tests are
undertaken on their level. For cointegration testing, the VAR-based cointegration test
developed by Johansen (1995) is utilised, as this is the standard cointegration test
performed by EViews.
The final test performed is for Granger causality. Granger (1969) approached causality by
identifying how much of the current variable can be explained by past values of the
variable and then seeing whether adding lagged values of a second variable can improve
the explanation. Granger causality therefore does not indicate causality in the usual sense
of the term, but is more of a test of precedence.
9.4 Analysis
9.4.1 Correlation coefficients
The first part of the analysis of the development index and measure of openness involved
calculating the correlation coefficients. Prior to calculating correlation coefficients, the
time series were plotted, using 1980 as a base year, in order to assist in understanding the
correlation coefficients. The results of this plotting are presented in Figures 9.3 and 9.4.

237
Figure 9.3: Openness and development index – Bangladesh
0.0
0.2
0.4
0.6
0.8
1.0
1.2
1.4
1.6
1.8
1960
1961
1962
1963
1964
1965
1966
1967
1968
1969
1970
1971
1972
1973
1974
1975
1976
1977
1978
1979
1980
1981
1982
1983
1984
1985
1986
1987
1988
1989
1990
1991
1992
1993
1994
1995
1996
1997
1998
1999
Openness
0.9
1.0
1.1
1.2
1.3
1.4
1.5
Development Index
OpennessDevelopment Index
`
Figure 9.4: Openness and development index – Tanzania
0.0
0.5
1.0
1.5
2.0
2.5
3.0
1960
1961
1962
1963
1964
1965
1966
1967
1968
1969
1970
1971
1972
1973
1974
1975
1976
1977
1978
1979
1980
1981
1982
1983
1984
1985
1986
1987
1988
1989
1990
1991
1992
1993
1994
1995
1996
1997
1998
1999
Openness
0.6
0.7
0.8
0.9
1.0
1.1
1.2
1.3
1.4
1.5
Development Index
OpennessDevelopment Index
`
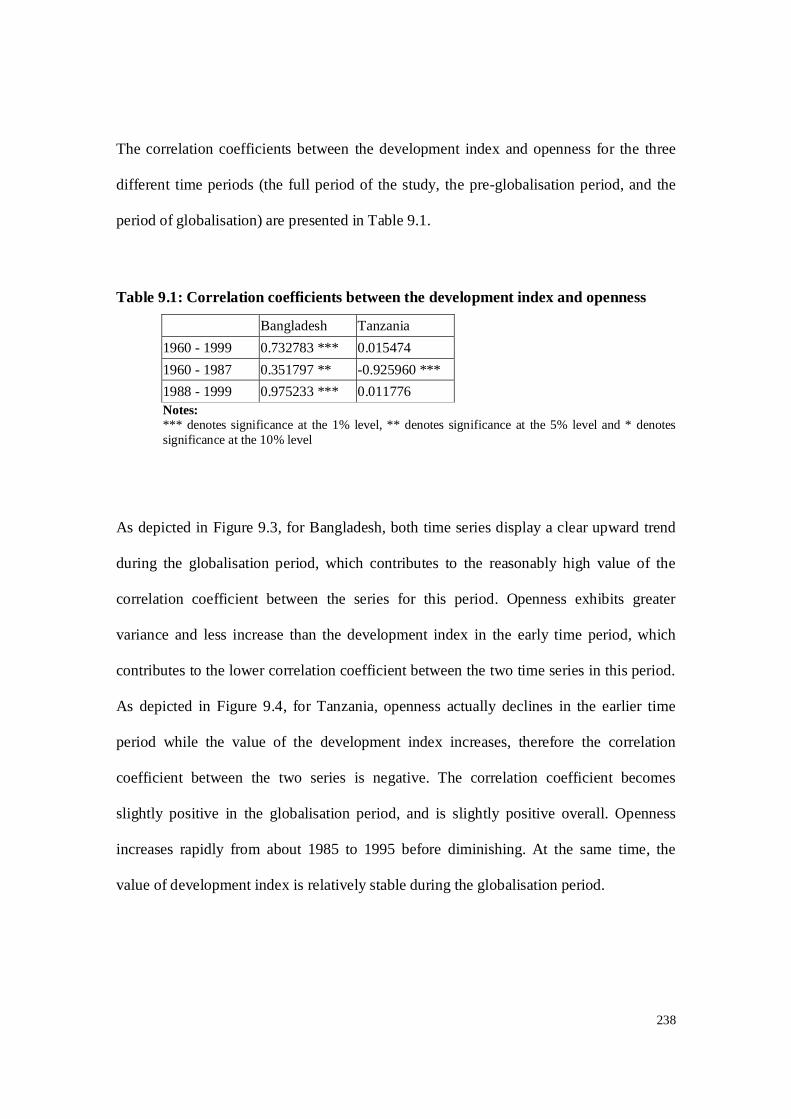
238
The correlation coefficients between the development index and openness for the three
different time periods (the full period of the study, the pre-globalisation period, and the
period of globalisation) are presented in Table 9.1.
Table 9.1: Correlation coefficients between the development index and openness
Bangladesh Tanzania 1960 - 1999 0.732783 *** 0.015474 1960 - 1987 0.351797 ** -0.925960 *** 1988 - 1999 0.975233 *** 0.011776 Notes: *** denotes significance at the 1% level, ** denotes significance at the 5% level and * denotes significance at the 10% level
As depicted in Figure 9.3, for Bangladesh, both time series display a clear upward trend
during the globalisation period, which contributes to the reasonably high value of the
correlation coefficient between the series for this period. Openness exhibits greater
variance and less increase than the development index in the early time period, which
contributes to the lower correlation coefficient between the two time series in this period.
As depicted in Figure 9.4, for Tanzania, openness actually declines in the earlier time
period while the value of the development index increases, therefore the correlation
coefficient between the two series is negative. The correlation coefficient becomes
slightly positive in the globalisation period, and is slightly positive overall. Openness
increases rapidly from about 1985 to 1995 before diminishing. At the same time, the
value of development index is relatively stable during the globalisation period.
239
9.4.2 Unit root testing
The second step of the analysis was to test for unit roots. As previously discussed, the
two tests utilised for unit root testing were the ADF and the ERS test. Lag lengths were
selected utilising Schwartz Information Criteria (SIC). The results of the ADF test are
presented in Table 9.2 and the results of the ERS test are presented in Table 9.3. A
summary of the test results are presented in Table 9.4. According to at least one of the
tests performed each pair of time series are integrated of the same order, and there was
consistency with the time periods, specifically, for the globalisation period the time series
of both countries were stationary at their levels, whereas for the full period of study and
the pre-globalisation period, the time series were stationary at the first difference.
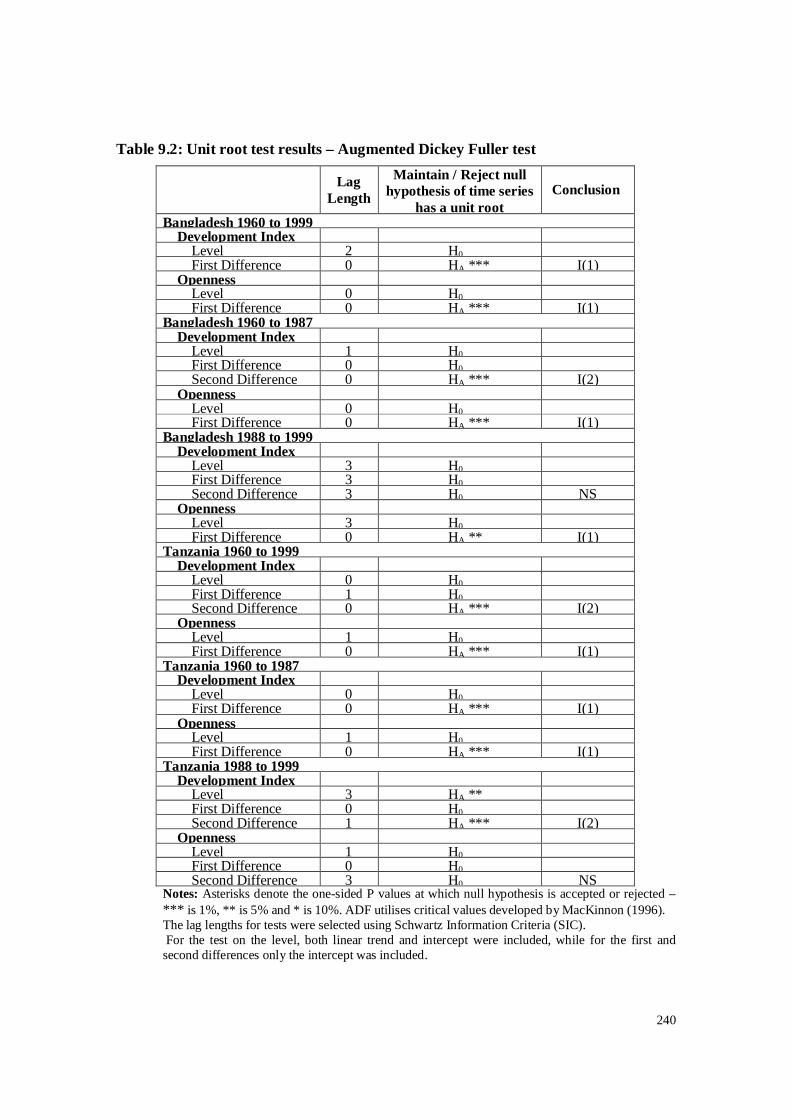
240
Table 9.2: Unit root test results – Augmented Dickey Fuller test
Lag Length
Maintain / Reject null hypothesis of time series
has a unit root Conclusion
Bangladesh 1960 to 1999 Development Index
Level 2 H0 First Difference 0 HA *** I(1)
Openness Level 0 H0 First Difference 0 HA *** I(1)
Bangladesh 1960 to 1987 Development Index
Level 1 H0 First Difference 0 H0 Second Difference 0 HA *** I(2)
Openness Level 0 H0 First Difference 0 HA *** I(1)
Bangladesh 1988 to 1999 Development Index
Level 3 H0 First Difference 3 H0 Second Difference 3 H0 NS
Openness Level 3 H0 First Difference 0 HA ** I(1)
Tanzania 1960 to 1999 Development Index
Level 0 H0 First Difference 1 H0 Second Difference 0 HA *** I(2)
Openness Level 1 H0 First Difference 0 HA *** I(1)
Tanzania 1960 to 1987 Development Index
Level 0 H0 First Difference 0 HA *** I(1)
Openness Level 1 H0 First Difference 0 HA *** I(1)
Tanzania 1988 to 1999 Development Index
Level 3 HA ** First Difference 0 H0 Second Difference 1 HA *** I(2)
Openness Level 1 H0 First Difference 0 H0 Second Difference 3 H0 NS
Notes: Asterisks denote the one-sided P values at which null hypothesis is accepted or rejected – *** is 1%, ** is 5% and * is 10%. ADF utilises critical values developed by MacKinnon (1996). The lag lengths for tests were selected using Schwartz Information Criteria (SIC). For the test on the level, both linear trend and intercept were included, while for the first and second differences only the intercept was included.
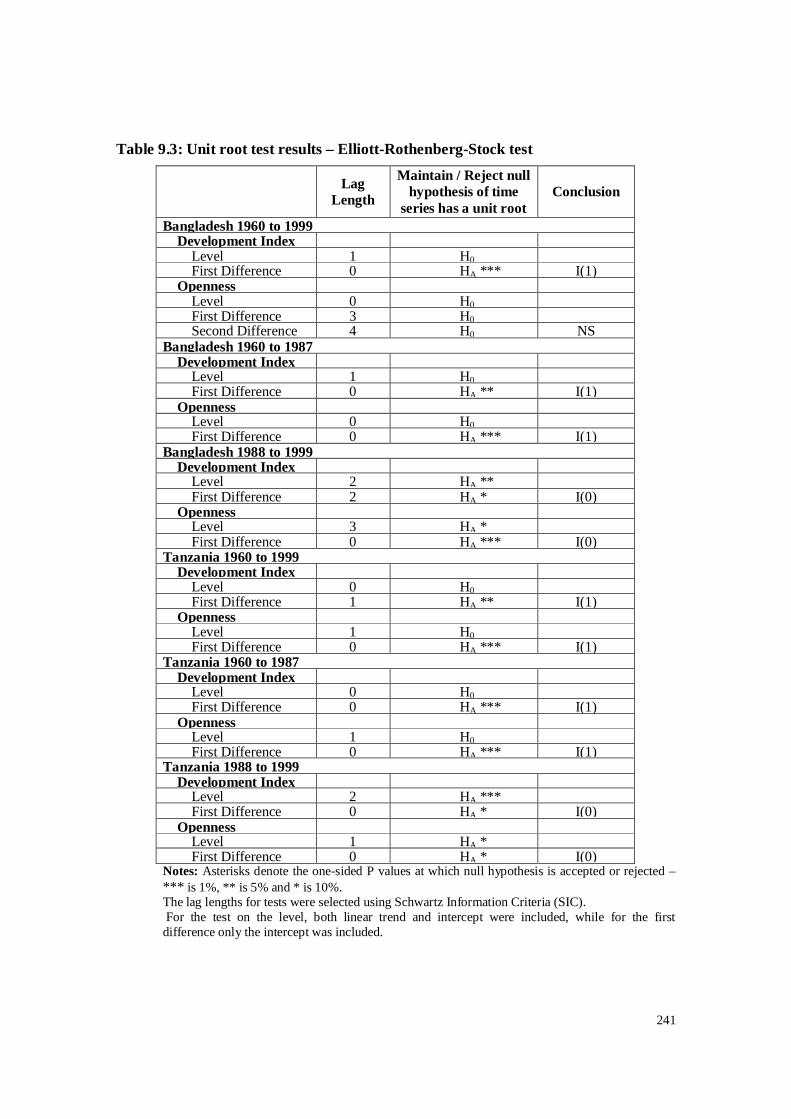
241
Table 9.3: Unit root test results – Elliott-Rothenberg-Stock test
Lag Length
Maintain / Reject null hypothesis of time
series has a unit root Conclusion
Bangladesh 1960 to 1999 Development Index
Level 1 H0 First Difference 0 HA *** I(1)
Openness Level 0 H0 First Difference 3 H0 Second Difference 4 H0 NS
Bangladesh 1960 to 1987 Development Index
Level 1 H0 First Difference 0 HA ** I(1)
Openness Level 0 H0 First Difference 0 HA *** I(1)
Bangladesh 1988 to 1999 Development Index
Level 2 HA ** First Difference 2 HA * I(0)
Openness Level 3 HA * First Difference 0 HA *** I(0)
Tanzania 1960 to 1999 Development Index
Level 0 H0 First Difference 1 HA ** I(1)
Openness Level 1 H0 First Difference 0 HA *** I(1)
Tanzania 1960 to 1987 Development Index
Level 0 H0 First Difference 0 HA *** I(1)
Openness Level 1 H0 First Difference 0 HA *** I(1)
Tanzania 1988 to 1999 Development Index
Level 2 HA *** First Difference 0 HA * I(0)
Openness Level 1 HA * First Difference 0 HA * I(0)
Notes: Asterisks denote the one-sided P values at which null hypothesis is accepted or rejected – *** is 1%, ** is 5% and * is 10%. The lag lengths for tests were selected using Schwartz Information Criteria (SIC). For the test on the level, both linear trend and intercept were included, while for the first difference only the intercept was included.
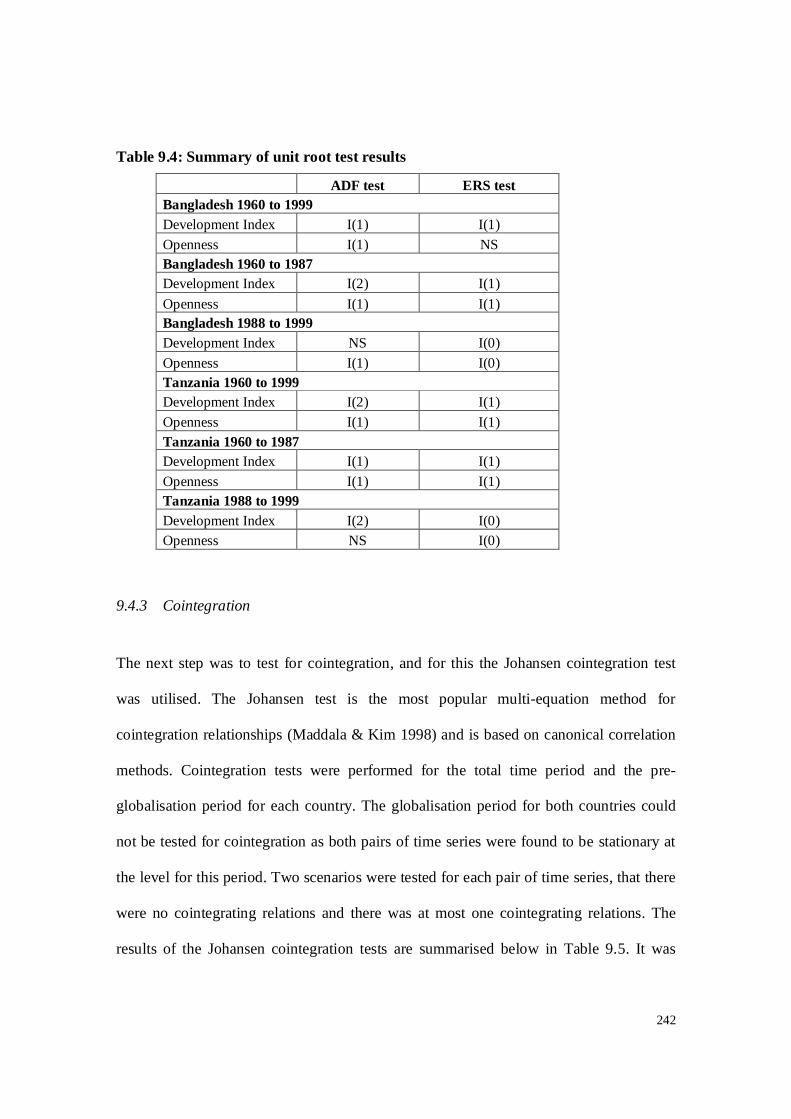
242
Table 9.4: Summary of unit root test results
ADF test ERS test Bangladesh 1960 to 1999 Development Index I(1) I(1) Openness I(1) NS Bangladesh 1960 to 1987 Development Index I(2) I(1) Openness I(1) I(1) Bangladesh 1988 to 1999 Development Index NS I(0) Openness I(1) I(0) Tanzania 1960 to 1999 Development Index I(2) I(1) Openness I(1) I(1) Tanzania 1960 to 1987 Development Index I(1) I(1) Openness I(1) I(1) Tanzania 1988 to 1999 Development Index I(2) I(0) Openness NS I(0)
9.4.3 Cointegration
The next step was to test for cointegration, and for this the Johansen cointegration test
was utilised. The Johansen test is the most popular multi-equation method for
cointegration relationships (Maddala & Kim 1998) and is based on canonical correlation
methods. Cointegration tests were performed for the total time period and the pre-
globalisation period for each country. The globalisation period for both countries could
not be tested for cointegration as both pairs of time series were found to be stationary at
the level for this period. Two scenarios were tested for each pair of time series, that there
were no cointegrating relations and there was at most one cointegrating relations. The
results of the Johansen cointegration tests are summarised below in Table 9.5. It was
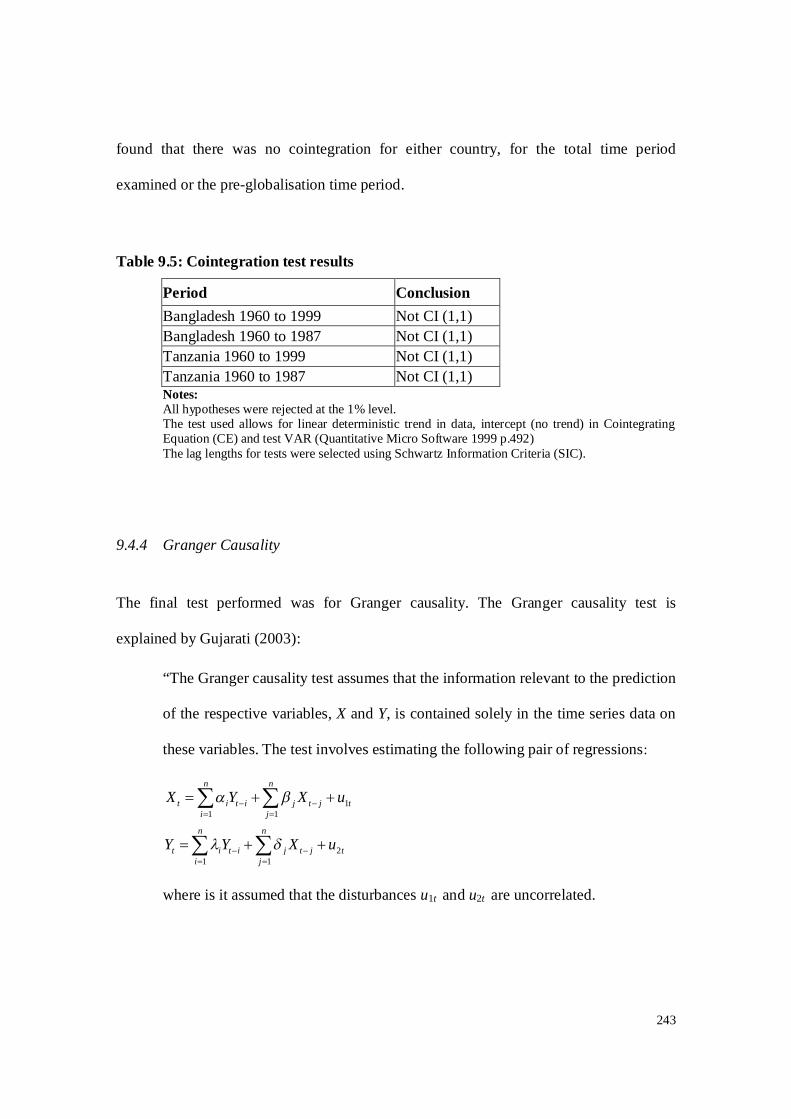
243
found that there was no cointegration for either country, for the total time period
examined or the pre-globalisation time period.
Table 9.5: Cointegration test results
Period Conclusion Bangladesh 1960 to 1999 Not CI (1,1) Bangladesh 1960 to 1987 Not CI (1,1) Tanzania 1960 to 1999 Not CI (1,1) Tanzania 1960 to 1987 Not CI (1,1) Notes: All hypotheses were rejected at the 1% level. The test used allows for linear deterministic trend in data, intercept (no trend) in Cointegrating Equation (CE) and test VAR (Quantitative Micro Software 1999 p.492) The lag lengths for tests were selected using Schwartz Information Criteria (SIC).
9.4.4 Granger Causality
The final test performed was for Granger causality. The Granger causality test is
explained by Gujarati (2003):
“The Granger causality test assumes that the information relevant to the prediction
of the respective variables, X and Y, is contained solely in the time series data on
these variables. The test involves estimating the following pair of regressions:
11 1
21 1
n n
t i t i j t j ti j
n n
t i t i j t j ti j
X Y X u
Y Y X u
where is it assumed that the disturbances u1t and u2t are uncorrelated.

244
The first equation above postulates that X is related to past values of itself as well
as that of Y while the second equation postulates a similar behaviour for Y.
Since the future cannot predict the past, if variable X (Granger) causes variable Y,
then changes in X should precede changes in Y. Therefore, in a regression of Y on
other variables, including its own past values, if past or lagged values of X are
included, and it significantly improves the prediction of Y, then it can be said that
X Granger-causes Y. A similar definition applies if Y Granger-causes X.”
Within this explanation, Y or X are levels, first differences or second differences
depending on the order of integration. If both time series are stationary at the level or they
are cointegrated, Granger causality is tested using levels. Otherwise, Granger causality is
tested using the difference at which the time series becomes stationary.
Granger causality was tested both ways, that is whether openness Granger-causes
development, and whether development Granger-causes openness. Because of the
differences in the results for the two unit root tests, Granger causality was tested based on
the results for each unit root test type. Because of the relatively small sample sizes, the
lag length was set at two lags for all pairs of time series.
The results of the Granger causality tests are summarised in Table 9.6. They show that
openness Granger-causes development in Bangladesh in the pre-globalisation period and
in Tanzania during the globalisation period, but development Granger-causes openness in
245
Bangladesh during the globalisation period. All of these results occur at the 10% level
and are based on the ERS unit root test results. No other instances of Granger-causality
are observed.
9.5 Summary of test results
For Bangladesh, correlation between the development index and openness during the
globalisation period is higher than during the pre-globalisation period. For Tanzania,
there is no correlation between the development index and openness in the globalisation
period or the total period studied, however, the negative correlation observed in the pre-
globalisation period ceases in the globalisation period.
Both pairs of time series for the globalisation period were found to be stationary at the
level, whereas all other pairs of time series were stationary at the first difference,
according to at least one of the tests performed. When cointegration was tested for all
pairs of time series for the full period of study and the pre-globalisation period it was
found that there was no cointegration between any of the pairs.
For Bangladesh, there was no Granger-causality for the total period of study, however
during the pre-globalisation period it was found that openness did weakly Granger-cause
development and during the globalisation period that development did weakly Granger-
cause openness. The only evidence of Granger-causality for Tanzania was during the
globalisation period, whereby, openness Granger-caused development.
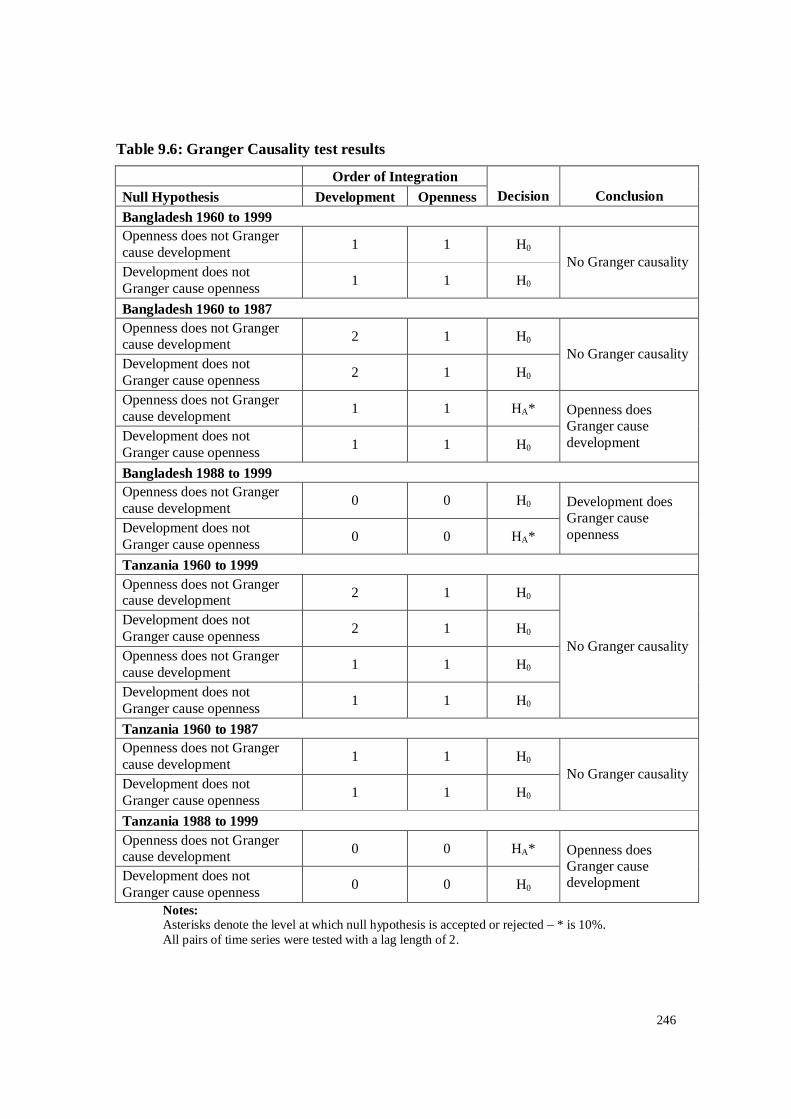
246
Table 9.6: Granger Causality test results
Order of Integration Null Hypothesis Development Openness Decision Conclusion Bangladesh 1960 to 1999 Openness does not Granger cause development 1 1 H0
Development does not Granger cause openness 1 1 H0
No Granger causality
Bangladesh 1960 to 1987 Openness does not Granger cause development 2 1 H0
Development does not Granger cause openness 2 1 H0
No Granger causality
Openness does not Granger cause development 1 1 HA*
Development does not Granger cause openness 1 1 H0
Openness does Granger cause development
Bangladesh 1988 to 1999 Openness does not Granger cause development 0 0 H0
Development does not Granger cause openness 0 0 HA*
Development does Granger cause openness
Tanzania 1960 to 1999 Openness does not Granger cause development 2 1 H0
Development does not Granger cause openness 2 1 H0
Openness does not Granger cause development 1 1 H0
Development does not Granger cause openness 1 1 H0
No Granger causality
Tanzania 1960 to 1987 Openness does not Granger cause development 1 1 H0
Development does not Granger cause openness 1 1 H0
No Granger causality
Tanzania 1988 to 1999 Openness does not Granger cause development 0 0 HA*
Development does not Granger cause openness 0 0 H0
Openness does Granger cause development
Notes: Asterisks denote the level at which null hypothesis is accepted or rejected – * is 10%. All pairs of time series were tested with a lag length of 2.

247
9.6 Discussion
The results of the analysis conducted in this chapter do not shed any conclusive evidence
that globalisation, measured by openness, has had either positive or adverse effects on the
subject countries, nor that either country has been by-passed by the process of
globalisation. In the pre-globalisation period, openness was found to weakly Granger-
cause development for Bangladesh, however, this reversed during the globalisation
period, such that development Granger-caused openness, albeit only weakly also. The
experience for Tanzania during the globalisation period was the opposite to that of
Bangladesh, with openness weakly Granger-causing development.
It is interesting that in the pre-globalisation period openness weakly Granger-caused
development for Bangladesh, because during this period there was not much change in
the level of openness. Specifically openness fluctuated around 20% of GDP except in the
1970s when it fell down to below 10% of GDP. Development showed strong increase
from the early 1970s to the end of the pre-globalisation period. Bangladesh exhibited
much more openness in the globalisation period, especially from about 1992 onwards, as
shown in Figure 9.1. A potential explanation for the experience of Bangladesh during the
globalisation period is that as a consequence of a higher standard of living, its people
were more able to participate in international economic activity, both through purchasing
a higher level of imports and having the capability exporting more.
That openness weakly Granger-caused development for Tanzania during the globalisation
period is also interesting. As demonstrated in Figure 9.2 Tanzania’s openness rose

248
quickly during the early part of the globalisation period, but then fell just as quickly
during the second half of the period, while the level of development largely stagnated. It
could be interpreted that the rise in openness was beneficial for development, as
development did improve slightly between 1991 and 1996, although given this was only
observed for a short period of time, any such interpretation should be made with caution.
9.7 Conclusion
In this chapter the modified development index that was created in the previous chapter
was compared to a measure of openness, in order to ascertain whether there is a
relationship between openness and development for the period of globalisation, and
whether this differed from the relationship in the period preceding the globalisation
period. The objective was to ascertain if a statement could be made to the effect that
globalisation has had either positive or negative implications for the subject countries, or
whether the countries have been by-passed by the process of globalisation. A number of
common quantitative techniques were utilised in the analysis, from correlation and co-
integration through to Granger causality.
Both countries experienced a higher level of openness during the globalisation period
than the preceding period, despite that Tanzania exhibited some decline in openness in
the latter part of the globalisation period. Thus, neither country experienced the non-
participation referenced in the literature on globalisation.
249
From the analysis, there could be no clear conclusion drawn that development in either
country had been positively or negatively impacted by globalisation. This could be
because the positive and negative forces of globalisation are counterbalancing each other.
The analysis undertaken indicated that openness preceded development for Tanzania
during the globalisation period, and despite their being some initial increase in openness,
the increase in development was relatively small. Similarly, it was found that openness
preceded development for Bangladesh during the pre-globalisation period, however, there
was no marked change in the level of openness during this period. This relationship
ceased during the globalisation period when Bangladesh became more open. What was
also observed when Bangladesh did become more open was that development caused
openness, which could be broadly interpreted that the economy was better able to afford
imports and had the capability to produce a higher level of exports.
In the next chapter, the findings of this chapter are evaluated in light of the overall
objectives of the research. Consideration is given to the limitations of the current
research, the contribution to the body of knowledge that has been made, and areas for
future research are proposed.
250
10 Research findings and contribution
10.1 Introduction
This chapter concludes the current research and draws together the results and
implications of what has been learned. In the introduction an overall research objective
was set, along with a number of specific objectives to assist in achieving the research
objective. In this final chapter, the achievement of each of these objectives is reviewed
and discussed. The contribution to knowledge that has been made is presented. The
chapter concludes with proposing areas for future research.
10.2 Research objectives
The overall objective of this research was to provide an empirical study into the impact of
globalisation on development in two of the world’s Least Developed Countries,
Bangladesh and Tanzania, and in doing so, draw some conclusion as to whether the
impact has been positive, negative or neutral, or whether it is accurate that the world’s
poorest countries have largely been by-passed by the most recent period of globalisation.
In order to achieve this overall objective, a number of more specific research objectives
were set, that were outlined in Chapter 1.
The first objective set was to select a measurement of development that was responsive to
change and reflective of the current issues facing developing countries. A large
proportion of this research involved looking at how development has been measured
251
historically, at the accepted measures of development and how one very accepted
measure of development could be further refined based on recommendations and
criticisms from the literature and the needs of the current research. Eventually a modified
version of the Human Development Index was created. Although consideration was given
to additional modifications and the inclusion of more factors, such as inequality and the
environment, due to a lack of suitable indicators and data, these were unable to be
progressed. Hence, the modified development index includes the same three broad
categories of income, heath and education as the original HDI, albeit with different
measures for health and education that are more appropriate to purpose.
The second objective was to select a measure of openness reflective of participation in
the international economy. Following the approach by UNCTAD in the World
Investment Report, openness was measured as the sum of exports, imports, FDI inflows
and FDI outflows, as a percentage of GDP. While more complex measures of openness
have also been developed, they largely measure changes in protection levels and do not
encompass investment. As investment flows have become increasingly important during
the globalisation period, and the need for a measure in the current research centred on
participation in the international economy, the UNCTAD approach was considered the
most appropriate measure to utilise.
The third objective was to select a time period representative of the current period of
globalisation. As has been discussed throughout this thesis, there is no firm consensus as
to when the most recent period of globalisation occurred. As the literature largely
252
identifies many of the globalisation trends emerging in the late 1980s, the start date for
the globalisation period was set at 1988. While it is acknowledged that there is no
evidence that the globalisation period has ended, for the current study, the end date was
set at 1999, as this provided more than ten years to observe what has occurred.
The fourth objective was to analyse the movement of the measure of openness and the
measure of development over the globalisation period, and in the period preceding the
globalisation period, in order to ascertain differences between the two time periods. The
period preceding globalisation was set from 1960 to 1987, providing a total of almost 40
years to analyse movements in the measures of openness and development. Bangladesh
became much more open during the globalisation period than in the earlier period,
especially from about 1992 onwards. Tanzania experienced a higher level of openness
during the first half of the globalisation period, however, it became less for the second
part of the globalisation period. Despite this decline, Tanzania was still more open in the
globalisation period than in the pre-globalisation period. In the pre-globalisation period,
the openness of Bangladesh fluctuated around the same level, whereas, the openness of
Tanzania exhibited decline up to the mid 1980s. On the basis of the measure utilised,
Tanzania was considerably more open than Bangladesh during the globalisation period.
In relation to development, Bangladesh exhibited a steady increase in development
during the globalisation period, while the development of Tanzania largely stagnated over
this period. In the period preceding globalisation, Bangladesh experienced stagnating
levels of development up until the mid 1970s, and then exhibited growth, albeit with a

253
slight decline around the late 1980s. In comparison Tanzania experienced a steady growth
in development during the pre-globalisation level. Based on the development index, both
countries measured comparable levels of development, with Bangladesh exhibiting a
higher result at the beginning and end of the study, but Tanzania exhibiting a higher
result for a large part of the middle period.
The fifth objective was to analyse the relationship between the measure of development
and openness during the globalisation period, the period prior to the globalisation period
and the total period of study, to understand the relationship and any differences between
the time periods. A number of common econometric techniques were utilised,
culminating in a test for Granger causality, a test of precedence. The main objective of
this test was to ascertain if openness preceded development, although Granger causality
was tested for in both directions. The findings were that openness did precede
development for Tanzania during the globalisation period, but that development preceded
openness for Bangladesh during the same period. It is also notable that openness
preceded development for Bangladesh in the period prior to globalisation. There were no
other observations of precedence.
The sixth objective was to identify and consider factors that influenced development
within Bangladesh and Tanzania during the globalisation period. As has been discussed,
for Bangladesh development increased steadily during the globalisation period, whereas
for Tanzania it stagnated. Chapter 6 of this thesis examined each of the two individual
countries in detail, and noted that Tanzania experienced poor economic performance
254
throughout the 1980s, and while there was some recovery in the 1990s, performance was
much weaker than that of Bangladesh, as evidenced by GDP growth. Tanzania also has
had high levels of foreign debts, which have required servicing. Hence, Tanzania was not
only earning lower levels of income but it also had large amounts of foreign debt to
service from this income. This adversely impacted development, not only through
lowering GDP per capita, but also through constraining government spending in areas
such as education and health.
The seventh objective was to consider factors that have influenced openness in
Bangladesh and Tanzania during the globalisation period. Bangladesh experienced strong
and consistent growth in openness during the globalisation period. This may be attributed
to the growth in its garment industry, which resulted in exports, but also necessitated
imports. The government of Bangladesh also set up export processing zones and provided
other incentives to foster foreign manufacturers establishing operations within
Bangladesh. As has been discussed, Tanzania exhibited strong openness growth in the
first part of the globalisation period, however, this fell during the second half. While there
was some improvement in exports contribution, most of the rise in openness was caused
by imports. This may be explained by the slight recovery in economic performance
experienced, and the arrangements made in relation to foreign aid and economic
assistance, during the late 1980s, plus pent up import demand from the period of
recession, fuelled demand for imports. The decline in imports during the second part of
the period could be explained by a lack of purchasing power, associated with the
255
continuance of stagnating economic performance. The increase in exports and then
decline can largely be attributed to world commodity price movements.
The final objective was a comparison of the findings for each country to ascertain
similarities and dissimilarities. This has largely been done with each objective, but to
recapitulate, the openness of Bangladesh steadily increased during the globalisation
period. For Tanzania, it increased during the first half of the period before falling.
Bangladesh experienced consistent improvement in development, as measured by the
modified development index, while the development level of Tanzania stagnated during
the globalisation period. The openness of Bangladesh has been influenced by the growth
of its garment sector and proactive government policies to establish a manufacturing
sector. Tanzania’s openness and improvement in development have largely been
hampered by its lower economic performance, and absence of diversification of exports
into manufactured goods.
10.3 Contribution to knowledge
This thesis has provided an empirical study into the impact of globalisation on two of the
world’s poorest countries. In doing so, it contributed to fill a gap in the current literature
on globalisation, where there is an absence of empirical studies that consider the totality
of effects of globalisation on individual countries.
The overall research objective was to establish whether the impact of globalisation has
been positive or negative, or whether two countries, Bangladesh and Tanzania, have been
256
by-passed by the most recent period of globalisation. These are the three main themes
that have emerged in the literature in relation to globalisation and developing countries.
Neither country has been by-passed by the most recent period of globalisation activity.
Both countries experienced a higher level of openness during the specified globalisation
period, than in the preceding period. It was largely trade that caused these higher levels of
openness in each country. Additionally, both countries started to receive FDI during the
globalisation period. For Bangladesh, foreign investment was directed toward exploration
for natural gas and power plant construction. For Tanzania, foreign investment occurred
in the tourism sector and mining industry.
No clear causality between openness and development could be established for either
country. As such, it could not be concluded that the net effects of globalisation have been
positive or negative for either country. It is likely that there have been both positive and
negative effects, as predicted by the literature, and that these effects have
counterbalanced each other.
10.4 Areas for future research
This research has contributed to an area where there is an apparent knowledge gap, that
being empirical evidence in relation to the impact of globalisation on developing
countries. In the current study, impact was measured by development and a modified
measure of development was created and utilised. Only two countries were studied,
which are both part of the group recognised as the poorest countries in the world.
257
One of the recommended areas for future research is widening the number of countries
studied, both in terms of other LDCs, and also developing countries that are more
advanced such as Malaysia or Thailand, and comparing and contrasting the findings.
Studying other LDCs, both within the same and within different regions may shed some
light on the implications of geographical location and regional developments or
institution development. Further analysis on the two countries that are the subject of this
research could be undertaken, to ascertain the specific factors that did influence the trends
observed for development. Such analysis could then be expanded to additional
developing countries.
The observation that in Tanzania openness preceded development could also be explored
in more depth, especially given the change in levels of openness observed during the
globalisation openness. Similarly the finding that development caused openness in
Bangladesh could be further explored. Given the conclusion that was arrived at was that
the positive and negative effects of globalisation are likely to have counterbalanced one
another, further examination and separation of these effects is a further area of future
research.
One of the largest constraints for the current research was the availability of data, for
example, choice of indicators to include in the development index created was largely
constrained by the limited number of alternative variables available. Similarly, inclusion

258
of an environmental indicator could not be progressed due to there not being a suitable
indicator available. Further research is likely to encounter the same issues.

259
Bibliography Achayra, A. & Wall, H.J. 1994, 'An Evaluation of the United Nations' Human
Development Index', Journal of Economic and Social Measurement, vol. 20, pp. 51-65.
Adelman, I. & Taft Morris, C. 1967, Society, Politics and Economic Development, John
Hopkins University Press, Baltimore. Agarwal, J.P. 1980, 'Determinants of Foreign Direct Investment: A survey',
Weltwirtschaftliches Archiv, vol. 116, pp. 739-73. Aharoni, Y. 1966, The Foreign Investment Decision Process, Harvard University,
Boston. Aliber, R.Z. 1970, 'A Theory of Direct Foreign Investment', in C.P. Kindleberger (ed.),
The International Corporation, The MIT Press, Cambridge Massachusetts. Anand, S. & Sen, A.K. 1993, Human Development Index: Methodology and
measurement, Human Development Report Office, New York. ---- 2000, 'The Income Component of the Human Development Index', Journal of Human
Development, vol. 1, no. 1, pp. 83-106. Arndt, S. 1999, 'Globalization and Economic Development', Journal of International
Trade and Economic Development, vol. 8, no. 3, pp. 309-18. Baker, D., Epstein, G. & Pollin, R. 1998, 'Introduction', in D. Baker, G. Epstein & R.
Pollin (eds), Globalization and Progressive Economic Policy, Cambridge University Press, Cambridge.
Baldwin, R.E. 1955, 'Secular Movements in the Terms of Trade', The American
Economic Review, vol. 45, no. 2, pp. 259-69. Baldwin, R.E. & Martin, P. 1999, Two Waves of Globalisation: Superficial similarities,
fundamental differences, Cambridge MA. Baran, P. 1957, The Political Economy of Growth, Monthly Review Press, New York. Bairoch, P. 1972, 'Free Trade and European Economic Development in the 19th Century',
European Economic Review, vol. 3, no. 3, pp. 211-45. Bairoch, P. & Kozul-Wright, R. 1996, 'Globalization Myths: Some historical reflections
on integration, industrialisation and growth in the world economy', paper presented to WIDER Conference on Transnational Corporations and the Global Economy, Cambridge (UK).
260
Barlow, E.R. & Wender, I.T. 1955, Foreign Investment and Taxation, Prentice-Hall,
Englewood Cliffs. Basu, K. 2001, 'On the Goals of Development', in G.M. Meier & J.E. Stiglitz (eds),
Frontiers of Development Economics: The future in perspective, Oxford University Press, New York.
Baum, C.F., 2003, Stata Technical Bulletin, Boston College, <http://fmwww.bc.edu/ec-
c/s2003/821/sts15.pdf> (27/12/2003) Bennett, M.K. 1951, 'International Disparities in Income Levels', American Economic
Review, vol. 41, no. 4, pp. 632-49. Bhaduri, A. 1998, 'Implications of Globalization for Macroeconomic Theory and Policy
in Developing Economies', in D. Baker, G. Epstein & R. Pollen (eds), Globalization and Progressive Economic Policy, Cambridge University Press, Cambridge.
Bhagwati, J. 1958, 'Immiserizing Growth: A Geometrical Note', Review of Economic
Studies, vol. 25, no. 3, pp. 201 - 5. Bhatnagar, R. K. (2001). 'An Analysis of the Evolution of the Human Development Index
with Special Reference to its Income Component', The Bangladesh Development Studies XXVII, September 2001, No.3, Bangladesh Institute for Development Studies, Bangladesh
Binswanger, H. & Lutz, E. 2003, 'Agricultural trade barriers, trade negotiations and the
interests of developing countries', in J. Toye (ed.), Trade and Development Directions for the 21st Century, Cheltenham, UK.
Boeke, J.H. 1953, Economics and Economic Policy of Dual Societies: as Exemplified by
Indonesia, Institute of Pacific Relations. Bordo, M.D., Eichengreen, B. & Irwin, D.A. 1999, Is Globalization Today Really
Different than Globalization a Hundred Years Ago?, Cambridge MA. Borensztein, E., Khan, M., Reinhart, C. & Wickham, P. 1994, The Behaviour of Non-Oil
Commodity Prices, IMF, Washington D.C. Brecher, R.A. & Choudhri, E.U. 1982, 'Immiserising Investment from Abroad: The
Singer-Prebisch thesis reconsidered'. Buckley, P.J. & Casson, M. 1976, The Future of the Multinational Enterprise, 2002 edn,
Palgrave Macmillan, London.

261
Cahill, M.B. & Sanchez, N. 2001, 'Using Principal Components to Produce an Economic and Social Development Index: An application to Latin America and the U.S.' Atlantic Economic Journal, vol. 29, no. 3, pp. 311-329.
Cantwell, J. 1989, Technological Innovation and Multinational Corporations, Basil
Blackwell, Oxford. Casson, M. 1990, 'The Theory of Foreign Direct Investment', in P.J. Buckley (ed.),
International Investment, Edward Elgar, Aldershot. Caves, R.E. 1971, 'International Corporations: The Industrial Economics of Foreign
Investment', Economica, vol. 38, no. 149, pp. 1-27. ---- 1982, Multinational Enterprise and Economic Analysis, Cambridge University Press,
London. CDIAC, Kyoto-Related Fossil-Fuel Carbon Dioxide Emission Totals, Carbon Dioxide
Information Analysis Center, Annual Updating <http://cdiac.ornl.gov/trends/emis/annex.htm> (28/04/2007)
CEPAL 2002, 'Globalization and Development', paper presented to ECLAC, Brazil. Chang, H.-J. 1998, 'Globalization, Transnational Corporations, and Economic
Development: Can the developing economies pursue strategic industrial policy in a globalised world economy?' in D. Baker, G. Epstein & R. Pollen (eds), Globalization and Progressive Economic Policy, Cambridge University Press, Cambridge.
Chenery, H. 1975, 'The Structuralist Approach to Development Policy', American
Economic Review, vol.65, no. 2., pp. 310-316 ---- 1968, 'Comparative Advantage and Development Policy', in J.D. Theberge (ed.),
Economics of Trade and Development, John Wiley and Sons, Inc., New York. Chenery, H. & Syrquin, M. 1975, Patterns of Development 1950-1970, Oxford
University Press, London. Chowdhury, O.H. 1991, 'Human Development Index: A critique', The Bangladesh
Development Studies, vol. XIX, no. 3, pp. 125-7. Chussodovsky, M. 1997, The Globalisation of Poverty, Zed Books, New York. Clark, C. 1960, The Conditions of Economic Progress, 3rd edn, Macmillan, London. Coase, R. 1937, 'The Nature of the Firm', Economica, vol. 4, no. 16, pp. 386-405.

262
Cole, M.A. 2000, Trade Liberalisation, Economic Growth and the Environment, Edward Elgar.
Costa, D.L. & Streckel, R.H. 1995, Long Term Trends in Health, Welfare and Economic
Growth in the United States, NBER, Cambridge, MA. Crafts, N. 1999, 'Economic Growth in the Twentieth Century', Oxford Review of
Economic Policy, vol. 15, no. 4, pp. 18-34. Crotty, J., Epstein, G. & Kelly, P. 1998, 'Multinational Corporations and the Neo-liberal
Regime', in D. Baker, G. Epstein & R. Pollen (eds), Globalization and Progressive Economic Policy, Cambridge University Press, Cambridge.
Cyert, R.M. & March, J.G. 1963, A Behavioural Theory of the Firm, Prentice-Hall,
Englewood Cliffs, N.J. Daly, H.E. 1996, 'Free Trade: The perils of deregulation', in J. Mander & E. Goldsmith
(eds), The Case Against the Global Economy, Sierra Club Books, San Francisco. Davis, J.S. 1945, 'Standards and Content of Living', American Economic Review, vol. 35,
no. 1, pp. 1-15. del Valle Irala, T.G. 1999, 'New Methodologies for Calculating the HDI', paper presented
to First Global Forum on Human Development, United Nations Headquarters New York, conference date: 29-31 July 1999.
Deninger, K. & Squire, L., Measuring Income Inequality Database, World Bank,
<http://econ.worldbank.org/WBSITE/EXTERNAL/EXTDEC/EXTRESEARCH/0,,contentMDK:20699070~pagePK:64214825~piPK:64214943~theSitePK:469382,00.html> (20/04/2007)
Desai, M. 1995a, 'Greening the HDI', in A. McGillivray (ed.), Accounting for Change,
New Economics Foundation, London. ---- 1995b, 'Income and Alternative Measures of Well-Being', in D.G. Westendorff & D.
Ghai (eds), Monitoring Social progress in the 1990s, Avebury, Aldershot. Dickey, D.A. & Fuller, W.A. 1979, 'Distribution of the Estimators for Autoregressive
Time Series with a Unit Root', Journal of the American Statistical Association, vol. 74, no. 366, pp. 427-31.
Dinda, S., Coondoo, D. & Pal, M. 2000, 'Air Quality and Economic Growth: An
empirical study', Ecological Economics, vol. 34, no. 3, pp. 409-23.
263
Doessel, D.P. & Gounder, R. 1994, 'Theory and Measurement of Living Levels: Some empirical results for the Human Development Index', Journal of International Development, vol. 6, no. 4, pp. 415-35.
Dollar, D. & Kraay, A. 2001, Trade, Growth and Poverty, Development Research Group,
The World Bank. Doraid, M., 1997, Analytical Tools for Human Development, Human Development
Report Office <http://hdr.undp.org/statistics/tools.cfm> (11/05/2003) Dowrick, S. 1994, 'Using the Penn World Tables', The Australian Economic Review, no.
4th Quarter 1994. Drewnowski, J. 1970, Studies in the Measurement of Levels of Living and Welfare,
UNRISD, Geneva. ---- 1972, 'Social Indicators and Welfare Measurement: Remarks on methodology',
Journal of Development Studies, vol. 8, no. 3, pp. 77-90. ---- 1974, On Measuring and Planning the Quality of Life, Mouton, Paris. Dunning, J.H. 1973, 'The Determinants of International Production', Oxford Economic
Papers, vol. 25, np. 3, pp. 289-336. ---- 2001, 'The Eclectic (OLI) Paradigm of International Production: Past, present and
future', International Journal of the Economics of Business, vol. 8, no. 2, pp. 173-90.
Dunning, J.H., Van Hoesel, R. & Narula, R. 1998, 'Third World Multinationals Revisited:
New developments and theoretical implications', in J.H. Dunning (ed.), Globalization, Trade and Foreign Direct Investment, Elsevier Science Ltd, Oxford.
Dunning, J.H. (ed.) 1998, Globalization, Trade and Foreign Direct Investment, Elsevier
Science Ltd, Oxford. EIU 2001a, Bangladesh Country Profile 2001, The Economist Intelligence Unit, London. ---- 2001b, Tanzania Country Profile 2001, The Economist Intelligence Unit, London. Elkan, W. 1995, An Introduction to Development Economics, Revised Second Edition
edn, Prentice Hall, London. Elliott, G., Rothenberg, T.J. & Stock, J.H. 1996, 'Efficient Tests for an Autoregressive
Unit Root', Econometrica, vol. 64, pp. 813-36.

264
Estes, R. 1984, The Social Progress of Nations, Praeger, New York. ---- 1988, Trends in World Social Development: The Social Progress of Nations 1970-
1987, Praeger, New York. Eusufzai, Z. 1996, 'Openness, Economic Growth and Development: Some further results',
Economic Development and Cultural Change, vol. 44, no. 2, pp. 333-50. Falconer, C. & Sauve, P. 1996, 'Globalisation, Trade and Competition', OECD Observer,
no. 201 August - September 1996, pp. 6-9. Feenstra, R.C. 1998, 'Integration of Trade and Disintegration of Production', The Journal
of Economic Perspectives, vol. 12, no. 4, pp. 31-50. Felix, D. 1998, 'Asia and the Crisis of Financial Globalization', in D. Baker, G. Epstein &
R. Pollen (eds), Globalization and Progressive Economic Policy, Cambridge University Press, Cambridge.
Findlay, R. 1981, 'The Fundamental Determinants of the Terms of Trade', in S. Grassman
& E. Lundberg (eds), The World Economic Order: Past and Prospects, St Martin's Press, New York.
Flanders, M.J. 1964, 'Prebisch on Protectionism: An evaluation', The Economic Journal. Floud, R. C. and B. Harris (1996). Health, Height and Welfare: Britain 1700-1890.
Cambridge, MA, NBER. Historical Working Paper 87. Flowers, E.B. 1976, 'Oligopolistic Reactions in European and Canadian Direct
Investment in the United States', Journal of International Business Studies, vol. 7, no. 2, pp. 43-55.
Frank, A.G. 1969, 'Capitalism and Underdevelopment in Latin America', Monthly Review
Press. Fukada-Parr, S. 2001, 'Indicators of Human Development and Human Rights - Overlaps,
Differences... and what about the Human Development Index?' Statistical Journal of the United Nations, vol. 18, pp. 239-48.
Gerschenkron, A. 1966, Economic Backwardness in Historical Perspective: A Book of
Essays, The Belknap Press of Harvard University Press, Cambridge, Massachusetts.
Goldsmith, E. 1996, 'Global Trade and the Environment', in J. Mander & E. Goldsmith
(eds), The Case Against the Global Economy, Sierra Club Books, San Francisco.

265
Goldsmith, J. 1996, 'The Winners and the Losers', in J. Mander & E. Goldsmith (eds), The Case Against the Global Economy, Sierra Club Books, San Francisco.
Goodstein, E. 1998, 'Malthus Redux? Globalization and the Environment', in D. Baker,
G. Epstein & R. Pollen (eds), Globalization and Progressive Economic Policy, Cambridge University Press, Cambridge.
Gostkowski, Z. 1972, 'Problems and Difficulties in the Elaboration of a Coherent System
of Human Resources Indicators for Less Developed Countries', in Z. Gostkowski (ed.), Toward a System of Human Resources Indicators for Less Developed Countries: A Selection of papers prepared for a UNESCO Research Project, Ossolineum.
Government of the United Republic of Tanzania & The World Bank 2002, Tanzania at
the Turn of the Century, IBRD / The World Bank, Washington. Granger, C.W.J. 1969, 'Investigating Causal Relations by Econometric Models and
Cross-Spectral Methods', Econometrica, vol. 37, no. 3, pp. 424-38. Grilli, E.R. & Yang, M.C. 1988, 'Primary Commodity Prices, Manufactured Goods
Prices, and the Terms of Trade of Developing Countries: What the Long Run Shows.' World Bank Economic Review, vol. 2, no. 11, pp. 1-47.
Gujarati, D.N. 2003, Basic Econometrics, Fourth edn, McGraw-Hill, New York. Gundlach, E. & Nunnenkamp, P. 1994, Globalisation of Production and Markets, Kiel
Institute, Germany. ---- 1996, Falling Behind or Catching Up? Developing Economies in the Era of
Globalization, Kiel Institute, Discussion Paper, No. 263. ---- 1998, 'Some Consequences of Globalization for Developing Countries', in J.H.
Dunning (ed.), Globalization, Trade and Foreign Direct Investment, Elsevier Science Ltd, Oxford.
Gwartney, J., Lawson, R., Park, W., Wagh, S., Edwards, C. & de Rugy, V. 2002,
Economic Freedom of the World: 2002 Annual Report., The Fraser Institute, Vancouver.
Gwynne, R.N. 1996, 'Trade and Developing Economies', in P.W. Daniels & W.F. Lever
(eds), The Global Economy in Transition, Addison Wesley Longman Limited, Harlow.
Halcoussis, D. 2005, Understanding Econometrics, Thomson South Western, Mason,
Ohio.
266
Hamilton, K. & Clements, M. 1999, 'Genuine Savings Rates in Developing Countries', The World Bank Economic Review, vol. May 1999, no. 2, pp. 333-56.
Harberler, G. 1959, 'International Trade and Economic Development', National Bank of
Egypt, Fiftieth Anniversary Commemoration Lectures, Cairo, 1959, pp. 5-14. ---- 1961, 'Terms of Trade and Economic Development', in H.S. Ellis & H.C. Wallich
(eds), Economic Development for Latin America. ---- 1968, 'Comparative Advantage, Agricultural Production and International Trade', in
J.D. Theberge (ed.), Economics of Trade and Development, John Wiley and Sons, Inc., New York.
---- 1988, International Trade and Economic Development, International Centre for
Economic Growth, San Fransisco. Harbison, F.H. & Myers, C.A. 1964, Education, Manpower and Economic Growth,
McGraw-Hill, New York. Harbison, F.H., Maruhnic, J. & Resnick, J.R. 1972, 'Availability and Conceptual Validity
of Statistical Data for a System of Human Resources Development Indicators in Africa and Latin America', in Z. Gostkowski (ed.), Toward a System of Human Resources Indicators for Less Developed Countries: A Selection of papers prepared for a UNESCO Research Project, Ossolineum.
Hay, C. & Marsh, D. 2000, 'Introduction: Demystifying Globalization', in Demystifying
Globalization, Macmillan Press Limited, Houndmills. Heckscher, E.F. 1919, 'The Effect of Foreign Trade on the Distribution of Income', in
H.S. Ellis & L.M. Metzler (eds), Readings in the Theory of International Trade, Irwin, Homewood, pp. 272-300.
Hellwig, Z. 1972a, 'On the Optimal Choice of Predictors', in Z. Gostkowski (ed.), Toward
a System of Human Resources Indicators for Less Developed Countries: A Selection of papers prepared for a UNESCO Research Project, Ossolineum.
---- 1972b, 'On the Problem of Weighting in International Comparisons', in Z.
Gostkowski (ed.), Toward a System of Human Resources Indicators for Less Developed Countries: A Selection of papers prepared for a UNESCO Research Project, Ossolineum.
Hennart 1982, A Theory of Multinational Enterprise, The University of Michigan, Ann
Arbor.

267
Heston, A., Summers, R. & Aten, B., Penn World Tables Version 6.1, Center for International Comparisons at the University of Pennsylvania (CICUP), Annual Updating <http://pwt.econ.upenn.edu/php_site/pwt61_form.php> (28/04/2007)
Hicks, D. 1997, 'The Inequality-Adjusted Human Development Index: A Constructive
Proposal', World Development, vol. 258, pp. 1283-98. Hicks, J.R. 1959, Essays in World Economics, Oxford at the Clarendon Press, London. Hirsch, S. 1976, 'An International Trade and Investment Theory of the Firm', Oxford
Economic Papers, vol. 28, no. 2, pp. 258-70. Hirschman, A. 1958, The Strategy of Economic Growth, Yale University Press, Clinton,
Massachusetts. ---- 1977, 'A Generalized Linkage Approach to Development, with Special Reference to
Staples', in M. Nash (ed.), Essays on Economic Development and Cultural Change in Honor of Bert F. Hoselitz, University of Chicago, Chicago, vol. 25.
---- 1981, Essays in Trespassing: Economics to Politics and Beyond, Cambridge
University Press, Cambridge. Hirst, P.Q. & Thompson, G. 1996, Globalisation in Question, Polity, Cambridge. Hoogvelt, A. 1997, Globalisation and the Postcolonial World, Macmillan Press Ltd,
London. ---- 2001, Globalisation and the Postcolonial World - Second Edition, Macmillan Press
Ltd, London. Hopkins, M. 1991, 'Human Development Revisited', World Development, vol. 19, no. 10,
pp. 1469-73. Horst, T. 1972, 'The Industrial Composition of U.S. Exports and Subsidiary Sales to the
Canadian Market', American Economic Review, vol. 62, no. 1, pp. 37-45. Humana, C. 1986, The World Guide to Human Rights, Facts on File, New York. HWGNRD 1996, 'Globalization, Development and the Spread of Disease', in J. Mander
& E. Goldsmith (eds), The Case Against the Global Economy, Sierra Club Books, San Francisco.
Hymer, S.H. 1976, The International Operations of National Firms: A Study of Direct
Foreign Investment, MIT Press, Cambridge, Mass.
268
Inda, J.X. & Rosaldo, R. 2002, 'A World in Motion', in J.X. Inda & R. Rosaldo (eds), The Anthropology of Globalization: A Reader, Blackwell Publishers Ltd, Oxford.
Islam, S. 1995, 'The Human Development Index and per capita GDP', Applied Economics
Letters, vol. 2, pp. 166-7. James, J. 2002, Technology, Globalization and Poverty, Edward Elgar, Cheltenham, UK. Johansen, S. 1995, Likelihood-based Inference in Cointegrated Vector Autoregressive
Models, Oxford University Press. Johnson, D.G. 2002, 'Globalization: What it is and who benefits', Journal of Asian
Economics, vol. 13, pp. 427-39. Jovanovic, M.N. 2001, Geography of Production and Economic Integration, Routledge,
London. Kelley, A.C. 1991, 'The Human Development Index: "Handle with Care"', Population and
Development Review, vol. 17, no. 2., pp. 315–324. Khor, M. 1996, 'Global Economy and the Third World', in J. Mander & E. Goldsmith
(eds), The Case Against the Global Economy, Sierra Club Books, San Francisco. Khusro, A.M. 1999, The Poverty of Nations, Macmillan, Houndmills. Kiely, R. 1998a, 'The Crisis of Global Development', in R. Kiely & P. Marfleet (eds),
Globalisation and the Third World, Routledge, London. ---- 1998b, 'Introduction: Globalisation, (Post-)Modernity and the Third World', in R.
Kiely & P. Marfleet (eds), Globalisation and the Third World, Routledge, London.
Kindleberger, C.P. 1956, The Terms of Trade: A European Case Study, The Technology
Press and Wiley, London. ---- 1969, 'The Theory of Direct Investment', in American Business Abroad: Six Lectures
on Direct Investment, Yale University Press, New Haven. Knickerbocker, F.T. 1973, Oligopolistic Reaction and the Multinational Enterprise,
Division of Research, Harvard University Graduate School of Business Administration, Boston.
Krugman, P. 1981, 'Trade, Accumulation and Uneven Development', Journal of
Development Economics, vol. 8, pp. 149-61. ---- 1990, Rethinking International Trade, MIT Press, Cambridge, Massachusetts.

269
---- 1995, 'Growing World Trade: Causes and Consequences', Brookings Papers on
Economic Activity, vol. 1995, no. 1, pp. 327-77. Kuznets, S. 1953a, 'National Income and Industrial Structure', in S. Kuznets (ed.),
Economic Change, W.M. Norton, New York. ---- 1953b, 'International Income Levels', in S. Kuznets (ed.), Economic Change, W.M.
Norton, New York. Lall, S. & Streeten, P. 1977, Foreign Investment, Transnationals and Developing
Countries, Macmillan, London. Larkin, M. 1998, 'Global Aspects of Heath and Health Policy in Third World Countries',
in R. Kiely & P. Marfleet (eds), Globalisation and the Third World, Routledge, London.
Leamer, E. 1988, 'Measures of Openness', in R.E. Baldwin (ed.), Trade Policy Issues and
Empirical Analysis, University of Chicago Press, Chicago. Leontief, W.W. 1963, 'The Structure of Development', Scientific American, no. Sept.
1963. Lewis, W.A. 1955, The Theory of Economic Growth, George Allen and Unwin Ltd,
London. ---- 1980, 'The Slowing Down of the Engine of Growth', American Economic Review,
vol 70, no. 4, pp. 555-564 Linder, S.B. 1961, An Essay on Trade and Transformation, John Wiley & Sons, New
York. ---- 1967, Trade and Trade Policy for Development, Pall Mall Press, London. Lindert, P.H. & Williamson, J.G. 2001, Does Globalisation Make the World More
Unequal?, Working Paper No. 8228, National Bureau of Economic Research. Lipsey, R. E. (1963). Price and Quality Trends in the Foreign Trade of the United States, Princeton N.J., Princeton University Press for NBER. List 1966, The National System of Political Economy, Kelley, New York. MacBean, A.I. & Balasubramanyam, V.N. 1976, Meeting the Third World Challenge,
Macmillan for the Trade Policy Research Centre, London.

270
MacKinnon, J.G. 1996, 'Numerical Distribution Functions for Unit Root and Cointegration Tests', Journal of Applied Econometrics, vol. 11, no. 6, pp. 601-18.
Maddala, G.S. & Kim, I.-M. 1998, Unit Roots, Cointegration and Structural Change,
Themes in Modern Econometrics, Cambridge University Press, Cambridge. Magee, S.P. 1977, 'Multinational Corporations, the Industry Cycle and Development',
Journal of World Trade Law, vol. 11, no. 4, pp. 297-321. Maizels, A. 2003, 'The Role of the Commodity Sector', in J. Toye (ed.), Trade and
Development Directions for the 21st Century, Cheltenham, UK. Markowitz, H.M. 1959, Portfolio Selection: Efficient Diversification of Investments, John
Wiley, New York. Markusen, J.R. 1983, 'Factor Movements and Commodity Trade as Complements',
Journal of International Economics, vol. 14, pp. 341-56. ---- 1984, 'Multinationals, Multi-plant Economies and the Gains From Trade', Journal of
International Economics, vol. 16, pp. 205-26. Marshall, A. 1890, Principles of Economics, Macmillan, London. Martin, K. & Thackeray, F.G. 1948, 'The Terms of Trade of Selected Countries', Bulletin
of the Oxford University Institute of Economics & Statistics, vol. 10, pp. 373-94. Mazumdar, K. 2002, 'A Note on Cross-country Divergence in Standard of Living',
Applied Economics Letters, vol. 9, pp. 87-90. McGillivray, M. 1991, 'The Human Development Index: Yet another redundant
composite development indicator?' World Development, vol. 19, no. 10, pp. 1461-8.
McGillivray, M. & White, H. 1993, 'Measuring Development? The UNDP's Human
Development Index', Journal of International Development, vol. 5, no. 2, pp. 183-92.
McGranahan, D.V. 1972, 'Development Indicators and Development Models', in N.
Baster (ed.), Measuring Development: The Role and Adequacy of Development Indicators, Frank Cass, London.
McGranahan, D.V., Pizarro, E. & Richard, C. 1985, Measurement and Analysis of Socio-
Economic Development: An enquiry into international indicators of development and quantitative interrelations of social and economic components of development, UNRISD, Geneva.
271
McGranahan, D.V., Richard-Proust, C., Sovani, N.V. & Subramanian, M. 1972, Contents and Measurement of Socioeconomic Development, Staff Study for UNRISD, Praeger Publishers, New York.
McManus, J.C. 1972, 'The Theory of the International Firm', in G. Paquet (ed.), The
Mulitnational Firm and the Nation State, Collier-Macmillan Canada, Ontario. Meier, G. 1958, 'International Trade and International Inequality', Oxford Economic
Papers, vol. 10, no. 3, pp. 277-89. Milanovic, B. 2003, 'The Two Faces of Globalization: Against globalization as we know
it.' World Development, vol. 31, no. 4, pp. 667-83. Mill, J.S. 1848, Principles of a Political Economy, Kelly, New York. Mittelman, J.H. 1996, 'Dynamics of Globalisation', in J.H. Mittelman (ed.),
Globalisation: Critical Reflections, Lynne Rienner Publishers, Colorado. Moosa, I.A. 2002, Foreign Direct Investment: Theory, Evidence and Practice, Palgrave
Macmillan, New York. Morgan, T. 1963, 'Trends in Terms of Trade, and Their Repercussions on Primary
Producers', in R. Harrod & D. Hague (eds), International Trade Theory in a Developing World: Proceedings of a Conference held by the International Economic Association, Macmillan and Co Ltd, London.
Morris, D. 1996, 'Free Trade: The Great Destroyer', in J. Mander & E. Goldsmith (eds),
The Case Against the Global Economy, Sierra Club Books, San Francisco. Morris, M.D. 1979, Measuring the Condition of the World's Poor: The Physical Quality
of Life Index, Pergamon, New York. Moss, M. 1973, 'Introduction', in M. Moss (ed.), The Measurement of Economic and
Social Performance, National Bureau of Economic Research, New York. Muqtada, M., Singh, A. & Ali Rashid, M.A. 2002, 'Bangladesh: Economic and Social
Challenges of Globalisation', in M. Muqtada, A. Singh & M.A. Ali Rashid (eds), The University Press Limited, Bangladesh.
Murray, C. 1991, Development Data Constraints and the Human Development Index,
United Nations Research Institute for Social Development. Myint, H. 1955, 'The Gains from International Trade and the Backward Countries',
Review of Economic Studies, vol. 22, no. 88, pp. 129-42.
272
---- 1958, 'The "Classical Theory" of International Trade and the Underdeveloped Countries', The Economic Journal, vol. 68, no. 270, pp. 317-37.
Myrdal, G. 1956, 'Development and Under-Development', paper presented to National
Bank of Egypt: Fiftieth Anniversary Commemoration Lectures, Cairo. ---- 1957, Economic Theory and Under-Developed Regions. Naisbitt, J. 1994, Global Paradox, Allen and Unwin, Sydney. Nayyar, D. 2001, 'Globalization: What Does it Mean for Development?' in K.S. Jomo &
S. Nagaraj (eds), Globalization versus Development, Palgrave Publishers Ltd., Houndmills.
---- 2003, 'Globalization and Development Strategies', in J. Toye (ed.), Trade and
Development Directions for the 21st Century, Cheltenham, UK. Neumayer, E. 2001, 'The Human Development Index and Sustainability - A Constructive
Proposal', Ecological Economics, vol. 39, pp. 101-14. Nissan, E. & Shahmoon, R. 2001, 'An Assessment of Human Development, by Region
and Country', Journal of Economics and Finance, vol.14, no. 1, pp. 31 - 42. Noorbakhsh, F. 1998a, 'Measuring Human Development: Dome improvements on the
Human Development Index', in F. Analoui (ed.), Human Resource Management Issues in Developing Countries, Ashgate, Aldershot.
---- 1998b, 'The Human Development Index: Some technical issues and alternative
indices', Journal of International Development, vol. 10, no. 5, pp. 589-605. Nordhaus, W. & Tobin, J. 1973, 'Is Growth Obsolete?' in M. Milton (ed.), The
Measurement of Economic and Social Performance. Nurske, R. 1952, 'Some Aspects of Capital Accumulation in Underdeveloped Countries',
paper presented to National Bank of Egypt; Fiftieth Anniversary Commemoration Lectures, Cairo.
---- 1961, 'International Trade Theory and Development Policy', in H.S. Ellis & H.C.
Wallich (eds), Economic Development for Latin America. Obstfeld, M. 1998, 'The Global Capital Market: Benefactor or Menace?' The Journal of
Economic Perspectives, vol. 12, no. 4, pp. 9-30. ODI 2005, Why Bangladesh has Outperformed Kenya, Overseas Development Institute,
London.
273
OECD 1973, List of Social Concerns Common to Most OECD Countries, OECD, Paris. ---- 1976, Measuring Social Well-Being: A Progress Report on the Development of Social
Indicators, OECD, Paris. ---- 1994, 'Globalization of Industrial Activities', Working Paper, vol. 2, no. 48. Ogwang, T. 1994, 'The Choice of Principle Variables for Computing the Human
Development Index', World Development, vol. 22, no. 12, pp. 2011-4. Ohlin, B. 1933, Interregional and international Trade, Harvard University Press,
Cambridge. Ohmae, K. 1994, The Borderless World, Harper Collins, London. Oman, C. 1994, Globalisation and Regionalisation: The Challenge for Developing
Countries, Development Centre of the Organisation for Economic Co-operation and Development, Paris.
---- 1996, The Policy Challenges of Globalisation and Regionalisation, Policy Brief No.
11, Development Centre of the Organisation for Economic Co-operation and Development, Paris.
Oniki, H. & Uzawa, H. 1965, 'Patterns of Trade and Investment in a Dynamic Model of
International Trade', Review of Economic Studies, vol. 32, no. 1, pp. p15-24. Palazzi, P. & Lauri, A. 1998, 'The Human Development Index: Suggested Corrections.'
BNL Quarterly Review, no. 205. Patel, S.J. 1959, 'Exports Prospects and Growth: India', The Economic Journal, vol. 69,
no. 275, pp. 490-506. Paul, S. 1996, 'A Modified Human Development Index and International Comparison',
Applied Economics letters, vol. 3, pp. 677-82. Pellerin, H. 1996, 'Global Restructuring and International Migration: Consequences for
the Globalisation of Politics', in E. Kofman & G. Youngs (eds), Globalisation Theory and Practice, Pinter, London.
Petrochilos, G. 1989, Foreign Direct Investment and the Development Process: The Case
of Greece, Avebury, Aldershot. Pieper, U. & Taylor, L. 1998, 'The Revival of the Liberal Creed: the IMF, the World
Bank, and the Inequality in a Globalized Economy', in D. Baker, G. Epstein & R. Pollen (eds), Globalization and Progressive Economic Policy, Cambridge University Press, Cambridge.

274
Pigou, A.C. 1932, The Economics of Welfare, 4th edn, Macmillan and Co., London. Porter, M. 1990, The Competitive Advantage of Nations, The Free Press, New York. Prebisch, R. 1950, The Economic Development of Latin America and its Principle
Problems, New York. Quantitative Micro Software 1999, EViews 3.1 User's Guide, 3rd Edition edn,
Quantitative Micro Software. Redding, S. & Venables, A. 2004, 'Economic Geography and International Inequality',
Journal of International Economics, vol. 63, pp. 53-82. Rifkin, J. 1996, 'New Technology and the End of Jobs', in J. Mander & E. Goldsmith
(eds), The Case Against the Global Economy, Sierra Club Books, San Francisco. Rodrik, D. 1997, Has Globalisation Gone Too Far?, Institute for International
Economics, Washington, DC. Rosenstein-Rodan, P. 1943, 'Problems of Industrialisation of Easter and South-Eastern
Europe', The Economic Journal, vol. 53, no. 210/211 (Jun /Sept 1943), pp. 202-11.
Rostow 1960, The Stages of Economic Growth, 1990 edn, Cambridge University Press,
Cambridge. Rugman, A.M. 1980, 'Internalisation as a General Theory of Foreign Direct Investment',
Weltwirtschaftliches Archiv, vol. 116, pp. 365-79. ---- 1982, 'Internalisation and Non-equity Forms of Internal Involvement', in A.M.
Rugman (ed.), New Theories of the Multinational Enterprise, St. Martin's Press, New York.
Sachs, J.D. & Warner, A. 1995, 'Economic Reform and the Process of Global
Integration', Brookings Papers on Economic Activity, vol. 1995, no. 1, pp. 1-118. Sagar, A., D & Najam, A. 1998, 'The Human Development Index: A Critical Review',
Ecological Economics, vol. 25, pp. 249-64. Salvatore, D. 1998, ' Globalization and International Competitiveness', in J.H. Dunning
(ed.), Globalization, Trade and Foreign Direct Investment, Elsevier Science Ltd, Oxford.
Samuelson, P.A. 1948, 'International Trade and the Equalisation of Factor Prices', The
Economic Journal, vol. 58, no. 230, pp. 163-84.
275
---- 1949, 'International Factor Price Equalisation Once Again', The Economic Journal,
vol. 59, no. 234, pp. 181-97. Sarkar, P. 1986, 'The Prebisch-Singer Thesis of Terms of Trade Deterioration: Some
doubtful questions vis-a-vis recent findings', paper presented to Discussion Workshop on Thoughts of Raul Prebisch, Research and Information System for the Non-Aligned and Other Developing Countries, New Delhi.
Sassen, S. 1996, 'The Spatial Organisation of Information Industries: Implications for the
role of the state', in J.H. Mittelman (ed.), Globalisation: Critical Reflections, Lynne Rienner Publishers, Colorado.
Scholte, J.A. 1996, 'Beyond the Buzzword: Toward a critical theory of globalisation', in
E. Kofman & G. Youngs (eds), Globalisation Theory and Practice, Pinter, London.
Schultz, T.W. 1961, 'Economic Prospects of Primary Products', in H.S. Ellis & H.C.
Wallich (eds), Economic Development for Latin America. Schumpeter, J.A. 1911, The Theory of Economic Development: An inquiry into profits,
capital, credit, interest and the business cycle, 1934 translation edn, Harvard University Press, Cambridge.
---- 1952, Capitalism, Socialism and Democracy, 4th edn, Allen and Unwin, London. Seers, D. 1972, 'What are we Trying to Measure?' Journal of Development Studies, vol. 8,
no. 3, pp. 21-36. Sheldon, E. & Moore, W. (eds) 1968, Indicators of Social Change, Russell Sage
Foundation, New York. Singer, H. 1950, 'US Foreign Investment in Underdeveloped Areas: The distribution of
gains between investing and borrowing countries', American Economic Review, vol. 40, no. 2, pp.473-485.
---- 1975, 'The Strategy of International Development'. ---- 1984a, 'The Terms of Trade Controversy and the Evolution of Soft Financing: Early
years in the U.N.' in G. Meier & D. Seers (eds), Pioneers in Development, Oxford University Press, New York.
---- 1984b, 'Ideas and Policy: The Sources of UNCTAD', Institute of Development Studies
(IDS) Bulletin, pp. 14-7.

276
Skarstein, R. 1997, Development Theory: A guide to some unfashionable perspectives, Oxford University Press, Delhi.
Smith, A. 1939, The Wealth of Nations, The Modern Library, New York. Smith, P. 1991, On the Use and Limitations of Economic and Social Indicators in
Analaysing the Quality of Life in Singapore, University of Southampton, Southampton.
Solomon, L.D. 1978, Multinational Corporations and the Emerging World Order,
Kennikat Press, Port Washington, NY. Spraos 1980, 'The Statistical Debate on the Net Barter Terms of Trade between Primary
Commodities and Manufactures', The Economic Journal, vol. 90, no. 357, pp. 107-28.
Srinivasan, T.N. 1994, 'Human Development: A new paradigm or reinvention of the
wheel?' Human Development, vol. 84, no. 2, pp. 238-43. Staelin, C.P. 1974, 'Theory of Autarkic Development: A critical review', Foreign trade
Review, vol. 9, no. 4, pp. 267-91. Streeten, P. 1974, 'World Trade in Agricultural Commodities and the Terms of Trade
with Industrial Goods', in N. Islam (ed.), Agricultural Policies in Developing Countries: Proceedings of a conference held by the International Economic Association at Bad Godesberg, West Germany, Macmillan, London.
---- 1981, Development Perspectives, Macmillan, London. Summers, R. & Heston, A. 1991, 'The Penn World Table (Mark 5): An expanded set of
international comparisons, 1950-1988', Quarterly Journal of Economics, vol. 106, no. 2, pp. 327-68.
Syrquin, M. & Chenery, H. 1989, 'Three Decades of Industrialisation', The World Bank
Economic Review, vol. 3, no. 2, pp. 145-81. The World Bank 1992, World Development Report, Oxford University Press, New York. ---- 1999, Bangladesh Education Sector Review. ---- 2001, World Development Indicators, The Wold Bank, Washington. ---- 2002, Globalization, Growth and Poverty, Oxford University Press, New York. Thirlwall, A.P. 1999, Growth and Development with Special Reference to Developing
Economies, 6th edn, Macmillan, Houndmills.
277
---- 2003, Growth and Development with Special Reference to Developing Economies,
7th edn, Palgrave Macmillan, Houndmills. Thomas, R.L. 1997, Modern Econometrics: An introduction, Addison-Wesley, Harlow. Tobin, J. 1958, 'Liquidity Preference as Behaviour Towards Risk', Review of Economic
Studies, vol. 25, no. 2, pp. 65-86. Tweeten, L.G. 1997, 'Investing in People', in L.G. Tweeten & D.G. McGlelland (eds),
Promoting Third-World Development and Food Security, Praeger Publishers, Westport.
Tweeten, L.G. & McGlelland, D.G. (eds) 1997, Promoting Third-World Development
and Food Security, Praeger Publishers, Westport. UNCTAD, Foreign Direct Investment Database, Annual Updating
<http://www.unctad.org/Templates/Page.asp?intItemID=1923&lang=1.> (08/04/2007)
---- 2000, World Investment Report, United Nations, New York. ---- 2001, Economic Development in Africa: Performance, Prospects and Policy Issues,
New York. ---- 2002a, Trade and Development Report 2002, UNCTAD/TDR/(2002), United
Nations. ---- 2002b, The Least Developed Countries Report 2002, UNCTAD/TDR/(2002), United
Nations. ---- 2002c, World Investment Report 2002, United Nations. ---- 2003, Economic Development in Africa: Trade Performance and Commodity
Dependence, New York. ---- 2004, UNCTAD Handbook of Statistics, UNCTAD. ----, 2007, The Criteria for the Identification of the LDCs, <http://www.un.org/special-
rep/ohrlls/ldc/ldc%20criteria.htm> (28/04/2007) UNDP 1990, Human Development Report, Oxford University Press, New York. ---- 1993, Human Development Report, Oxford University Press, New York. ---- 1994, Human Development Report, Oxford University Press, New York.
278
---- 1999, Human Development Report, Oxford University Press, New York. ---- 2002, Human Development Report, Oxford University Press, New York. UNESCO, Education Statistical Tables, Annual Updating
<http://stats.uis.unesco.org/ReportFolders/ReportFolders.aspx?CS_referer=&CS_ChosenLang=en> (08/04/2007)
United Nations, List of Least Developed Countries, <http://www.un.org/special-
rep/ohrlls/ldc/list.htm> (20/05/2007) ---- 1954, Report on International Definition and Measurement of Standards and Levels
of Living, No. E/CN.3/179-E/CN.5/299, United Nations, New York. ---- 1961, International Definition and Measurement of levels of Living: An interim
guide, United Nations, New York. ---- 1964, Towards a New Trade Policy for Development, United Nations, New York. Vernon, R. 1966, 'International Investment and International Trade in the Product Cycle',
Quarterly Journal of Economics, vol. 80, pp. 190-207. ---- 1974, 'The Location of Economic Activity', in J.H. Dunning (ed.), Economic Analysis
and the Multinational Enterprise, Allen and Unwin, London. ---- 1979, 'The Product Life Cycle in a New International Environment', Oxford Bulletin
of Economics and Statistics, vol. 41, pp. 255-67. Viner, J. 1953, International Trade and Economic Development: Lectures delivered at
the National University of Brazil, Oxford, London. Williams, J.H. 1929, 'The Theory of International Trade Reconsidered', The Economic
Journal, vol. 39, no. 154, pp. 195-209. Williams, M. 1996, 'Rethinking Sovereignty', in E. Kofmans & G. Youngs (eds),
Globalisation Theory and Practice, Pinter, London. Wilson, T., Sinha, R.P. & Castree, J.R. 1969, 'The Income Terms of Trade of Developed
and Developing Countries', The Economic Journal, vol. 79, no. 316, pp. 813-32. Wolfe, M. 1995, 'Globalisation and Social Exclusions: Some Paradoxes', in G. Rodgers,
C. Gore & J.B. Figueiredo (eds), Social Exclusion: Rhetoric, Reality, Reponses, International Institute for Labour Studies, Geneva.
279
Yates, P.L. 1959, Forty Years of Foreign Trade: A statistical handbook with special reference to primary products and under-developed countries, The Macmillan Company, New York.
Yeh, S.H.K. 1976, 'The Use of Social Indicators in Development Planning', in UNESCO
(ed.), The Use of Socio-Economic Indicators in Development Planning, UNESCO, Paris.
Young, A.A. 1928, 'Increasing Returns and Economic Progress', Economic Journal, vol.
38, pp. 527-42. Yusuf, S. & Stiglitz, J.E. 2001, 'Development Issues: Settled and Open', in G.M. Meier &
J.E. Stiglitz (eds), Frontiers of Development Economics: The future in perspective, Oxford University Press, New York.


