Download - Agarikon.1 and Agarikon Plus Affect Cell Cycle and Induce Apoptosis in Human Tumor Cell Lines

Agarikon.1 and Agarikon Plus Affect Cell Cycle and Induce Apoptosis in Human Tumor Cell Lines
Boris Jakopovich, Ivan Jakopovich, Neven Jakopovich
Dr Myko San – Health from Mushrooms Miramarska c. 109, Zagreb, Croatia

INDEX
• Introduction • Materials and Methods • Results • Conclusions

INTRODUCTION
• Continuation of the study on 6 blended mushroom products and 3 single extracts on 4 human tumor cell lines (Durgo, Jakopovich 2013)
• Neutral Red and MTT proliferation assays demonstrate that blended extracts cause increased tumor cell membrane and mitochondria damage
• This study concentrates on the mechanisms; effects on the cell cycle and inducing apoptosis
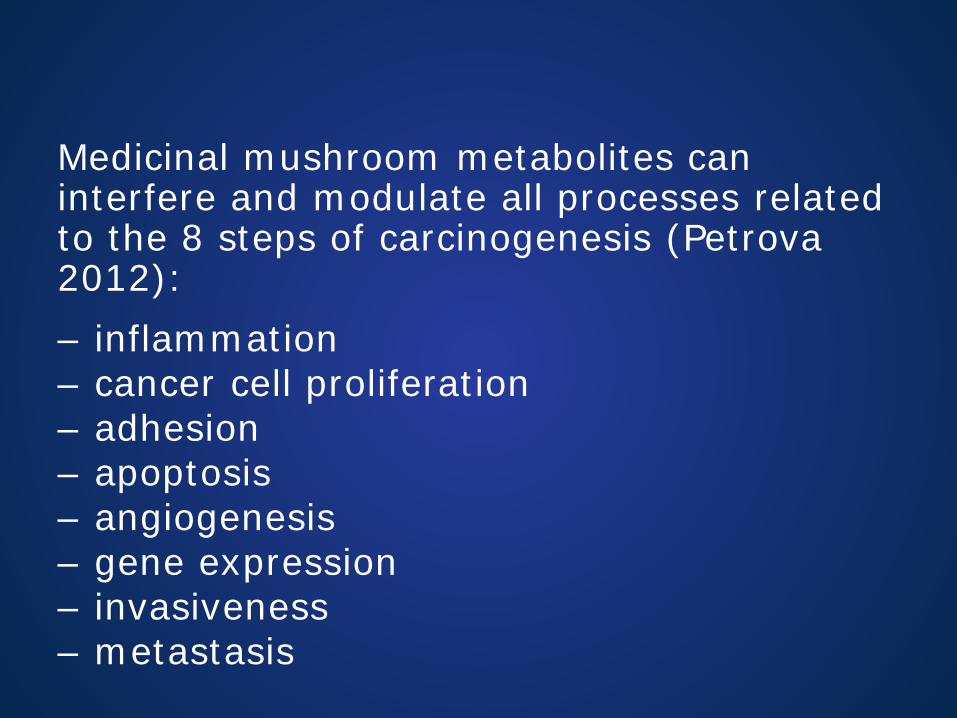
Medicinal mushroom metabolites can interfere and modulate all processes related to the 8 steps of carcinogenesis (Petrova 2012):
– inflammation – cancer cell proliferation – adhesion – apoptosis – angiogenesis – gene expression – invasiveness – metastasis
Apoptosis - programmed cell death - is a crucial tumor suppression mechanism
‒ eliminates cells with extensive DNA damage (potentially leading to cancer)
• differentiation - cell growth – apoptosis balance
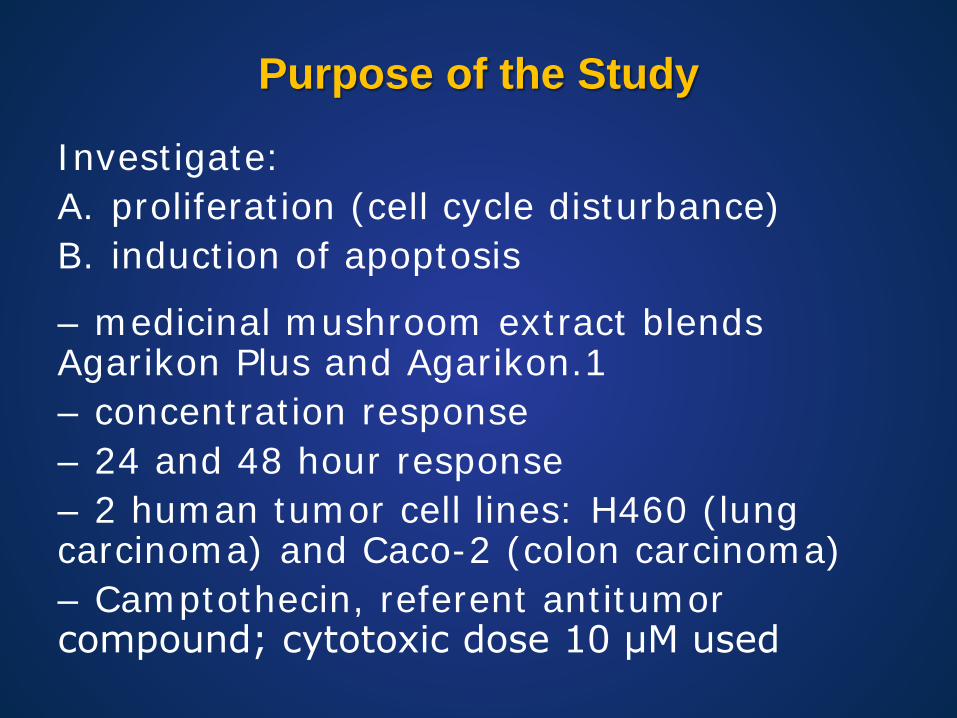
Purpose of the Study
Investigate: A. proliferation (cell cycle disturbance) B. induction of apoptosis
– medicinal mushroom extract blends Agarikon Plus and Agarikon.1 – concentration response – 24 and 48 hour response – 2 human tumor cell lines: H460 (lung carcinoma) and Caco-2 (colon carcinoma) – Camptothecin, referent antitumor compound; cytotoxic dose 10 μM used
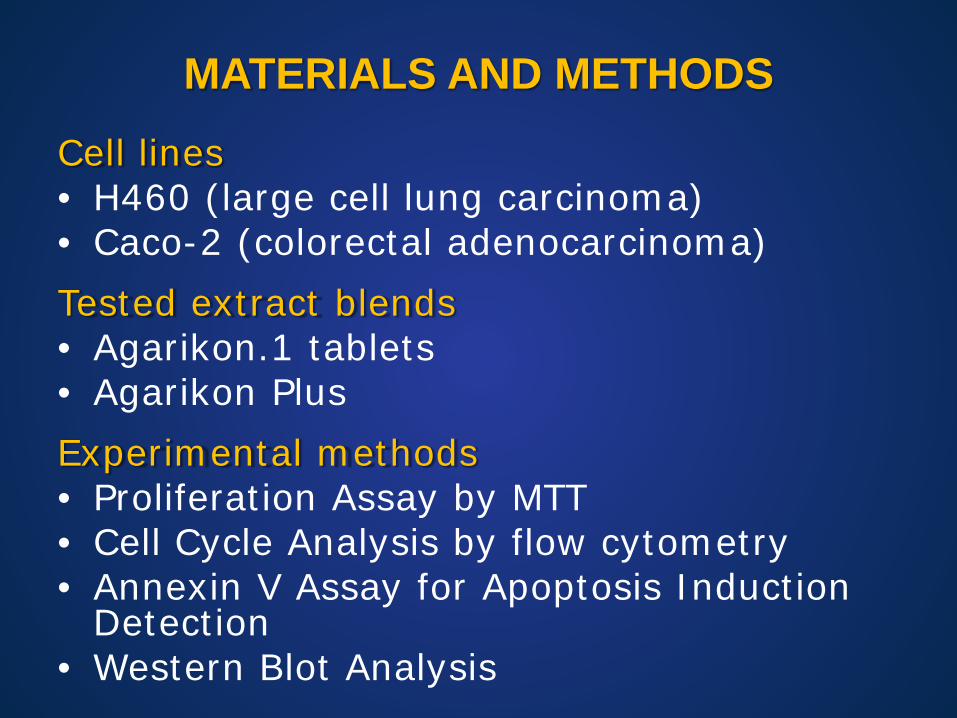
MATERIALS AND METHODS
Cell lines • H460 (large cell lung carcinoma) • Caco-2 (colorectal adenocarcinoma)
Tested extract blends • Agarikon.1 tablets • Agarikon Plus
Experimental methods • Proliferation Assay by MTT • Cell Cycle Analysis by flow cytometry • Annexin V Assay for Apoptosis Induction
Detection • Western Blot Analysis

TESTED PRODUCTS
• Agarikon.1 tablets (AG.1)
• proprietary mushroom extract blend from Dr Myko San company
• Ganoderma lucidum, Lentinus edodes, Grifola frondosa, Pleurotus ostreatus, Agaricus brasiliensis
• registered med. mushroom supplement
• recommended treatment dose: ~0.1 g/kg bodyweight per day of soluble polysaccharides
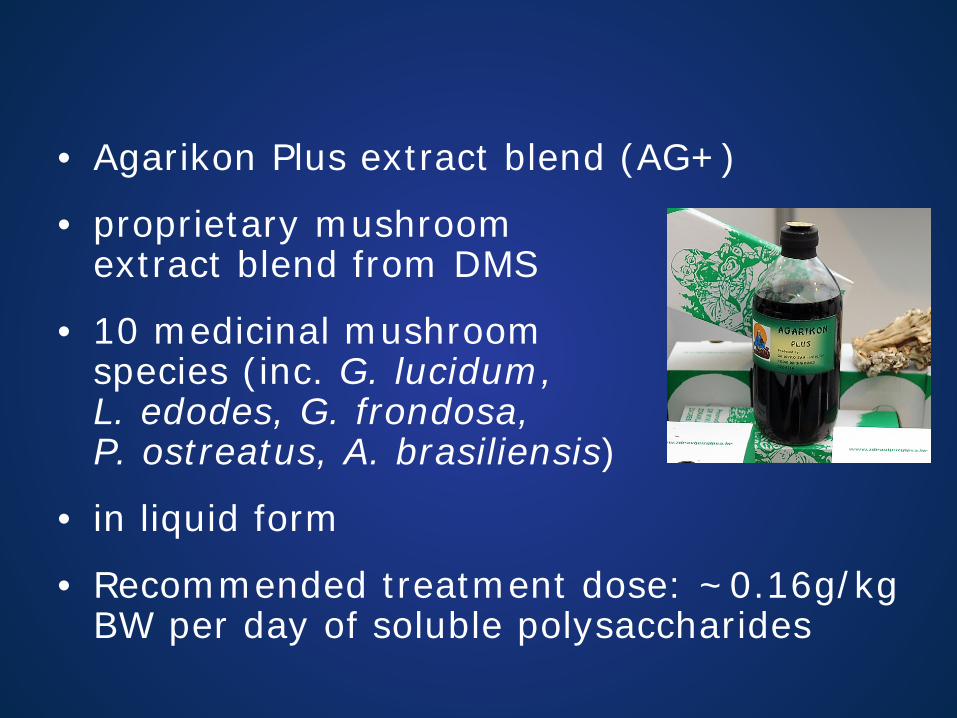
• Agarikon Plus extract blend (AG+)
• proprietary mushroom extract blend from DMS
• 10 medicinal mushroom species (inc. G. lucidum, L. edodes, G. frondosa, P. ostreatus, A. brasiliensis)
• in liquid form
• Recommended treatment dose: ~0.16g/kg BW per day of soluble polysaccharides
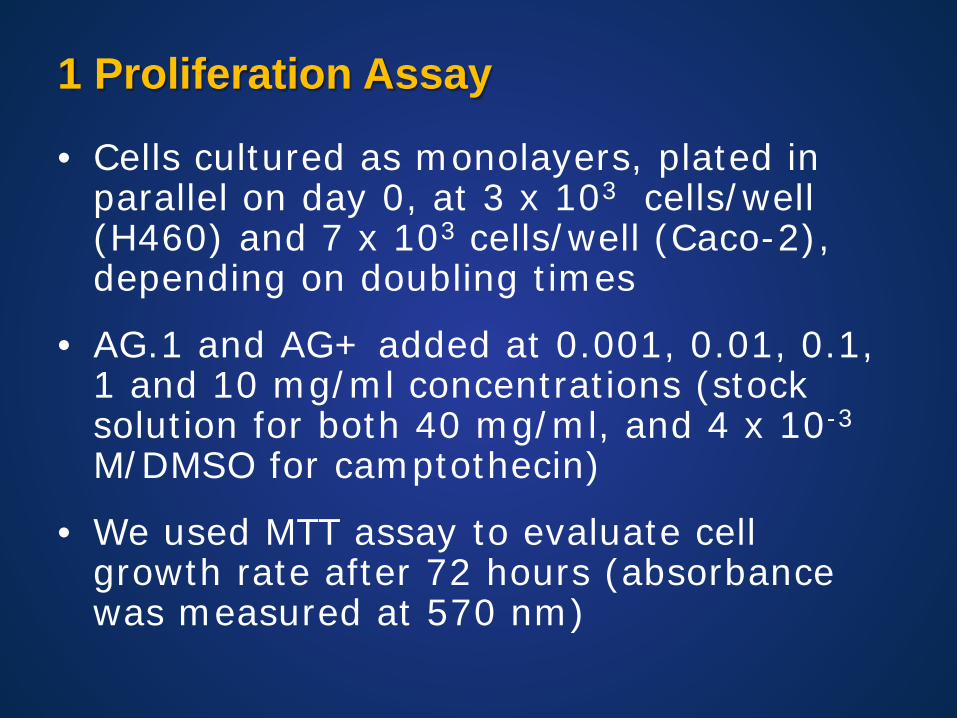
1 Proliferation Assay
• Cells cultured as monolayers, plated in parallel on day 0, at 3 x 10³ cells/well (H460) and 7 x 10³ cells/well (Caco-2), depending on doubling times
• AG.1 and AG+ added at 0.001, 0.01, 0.1, 1 and 10 mg/ml concentrations (stock solution for both 40 mg/ml, and 4 x 10⁻³ M/DMSO for camptothecin)
• We used MTT assay to evaluate cell growth rate after 72 hours (absorbance was measured at 570 nm)
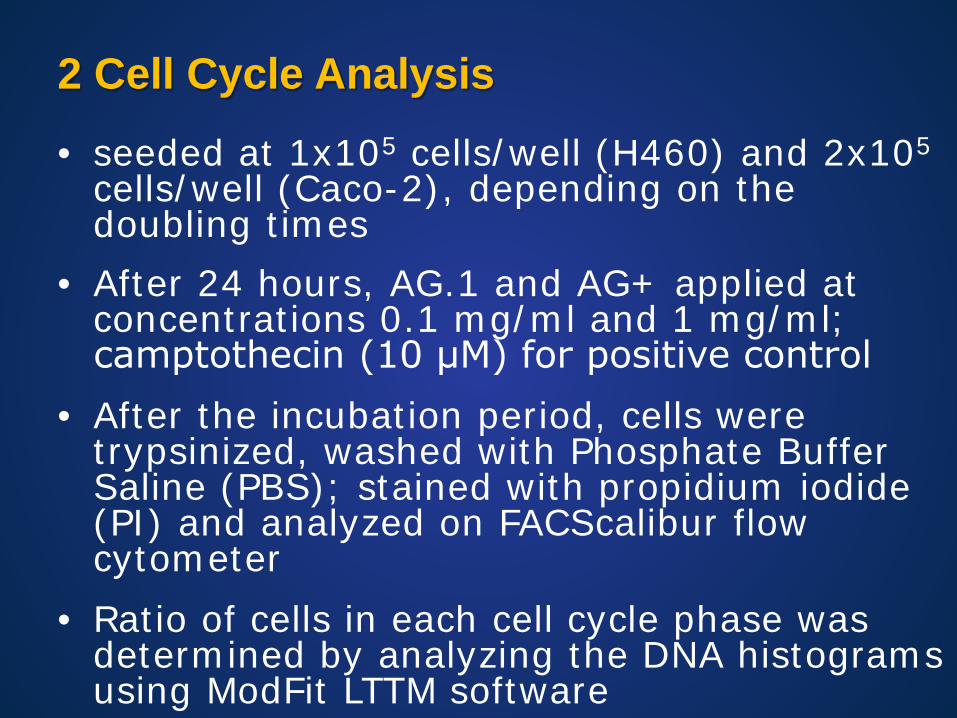
2 Cell Cycle Analysis
• seeded at 1x10⁵ cells/well (H460) and 2x10⁵ cells/well (Caco-2), depending on the doubling times
• After 24 hours, AG.1 and AG+ applied at concentrations 0.1 mg/ml and 1 mg/ml; camptothecin (10 μM) for positive control
• After the incubation period, cells were trypsinized, washed with Phosphate Buffer Saline (PBS); stained with propidium iodide (PI) and analyzed on FACScalibur flow cytometer
• Ratio of cells in each cell cycle phase was determined by analyzing the DNA histograms using ModFit LTTM software
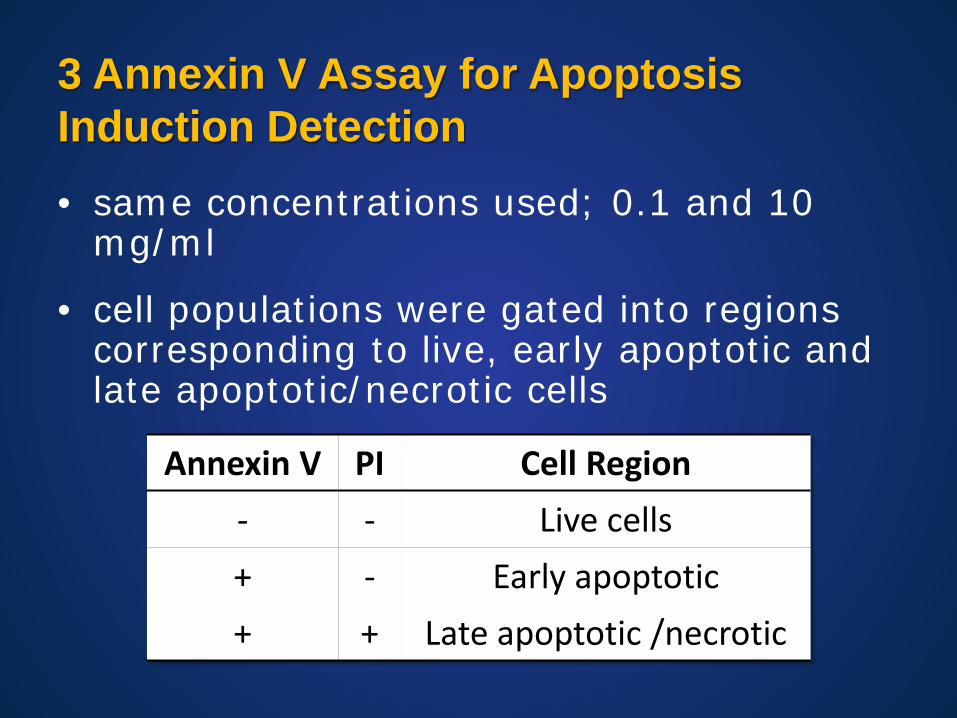
3 Annexin V Assay for Apoptosis Induction Detection • same concentrations used; 0.1 and 10
mg/ml
• cell populations were gated into regions corresponding to live, early apoptotic and late apoptotic/necrotic cells
Annexin V PI Cell Region - - Live cells + - Early apoptotic + + Late apoptotic /necrotic
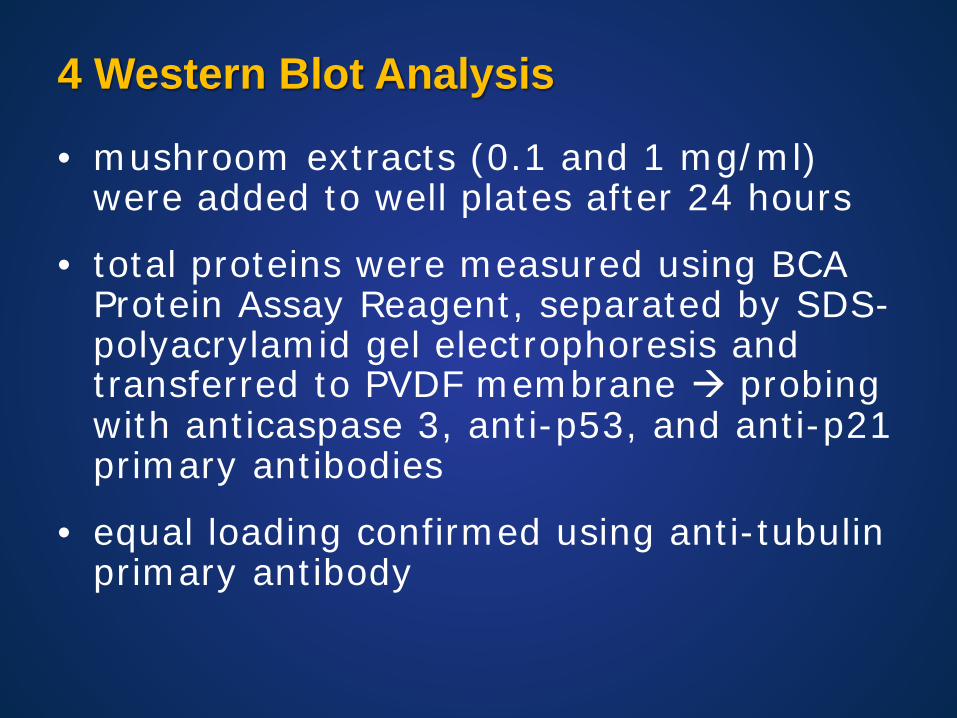
4 Western Blot Analysis
• mushroom extracts (0.1 and 1 mg/ml) were added to well plates after 24 hours
• total proteins were measured using BCA Protein Assay Reagent, separated by SDS-polyacrylamid gel electrophoresis and transferred to PVDF membrane probing with anticaspase 3, anti-p53, and anti-p21 primary antibodies
• equal loading confirmed using anti-tubulin primary antibody

RESULTS
Proliferation Assay • Agarikon Plus (strong effect at 10 mg/ml,
GI50 ≈ 2-3 mg/ml) and Agarikon.1 inhibit the growth of both tumor cell lines
• H460 cells are more resistant to Agarikon.1 (approaching GI50 above 10 mg/ml mass concentration)

• Concentration-response curves showing growth inhibition of H460 and Caco-2 cell in vitro after 72 hours after adding Agarikon.1, Agarikon Plus, and camptothecin.

•expected Camptothecin curve confirms valid measurements (positive control)
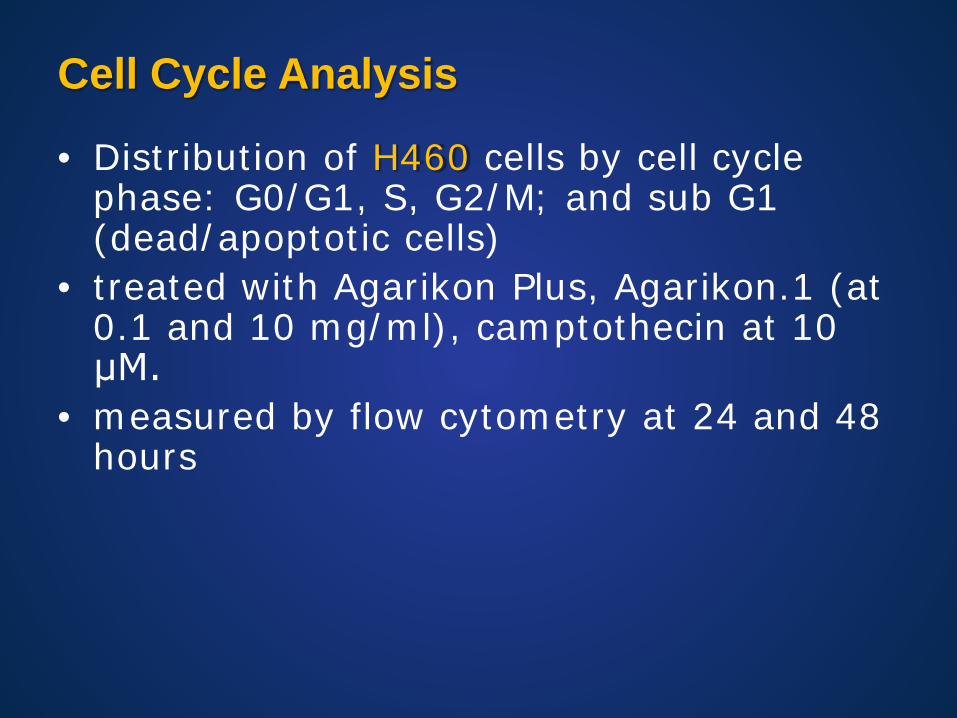
Cell Cycle Analysis
• Distribution of H460 cells by cell cycle phase: G0/G1, S, G2/M; and sub G1 (dead/apoptotic cells)
• treated with Agarikon Plus, Agarikon.1 (at 0.1 and 10 mg/ml), camptothecin at 10 μM.
• measured by flow cytometry at 24 and 48 hours

• no significant influence on cell cycle • moderate increase in apoptotic/dead cells for
AG+ at higher concentrations

• AG+ and AG.1 (1mg/ml) induce accumulation of cells in G1, reduction in S, increase in sub G1 (apoptotic/necrotic)
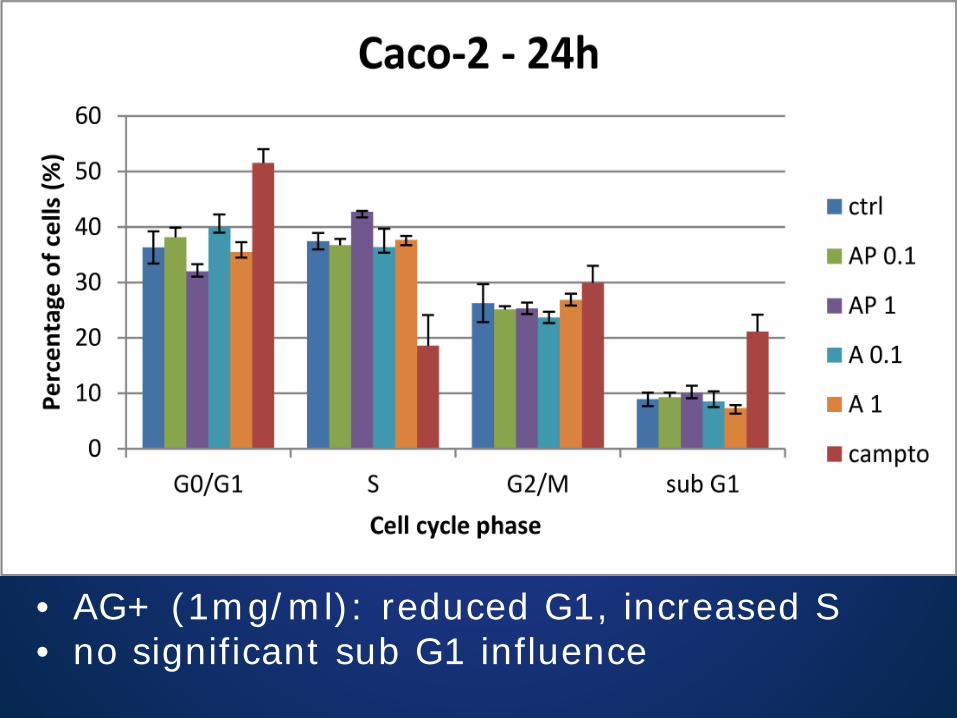
• AG+ (1mg/ml): reduced G1, increased S • no significant sub G1 influence
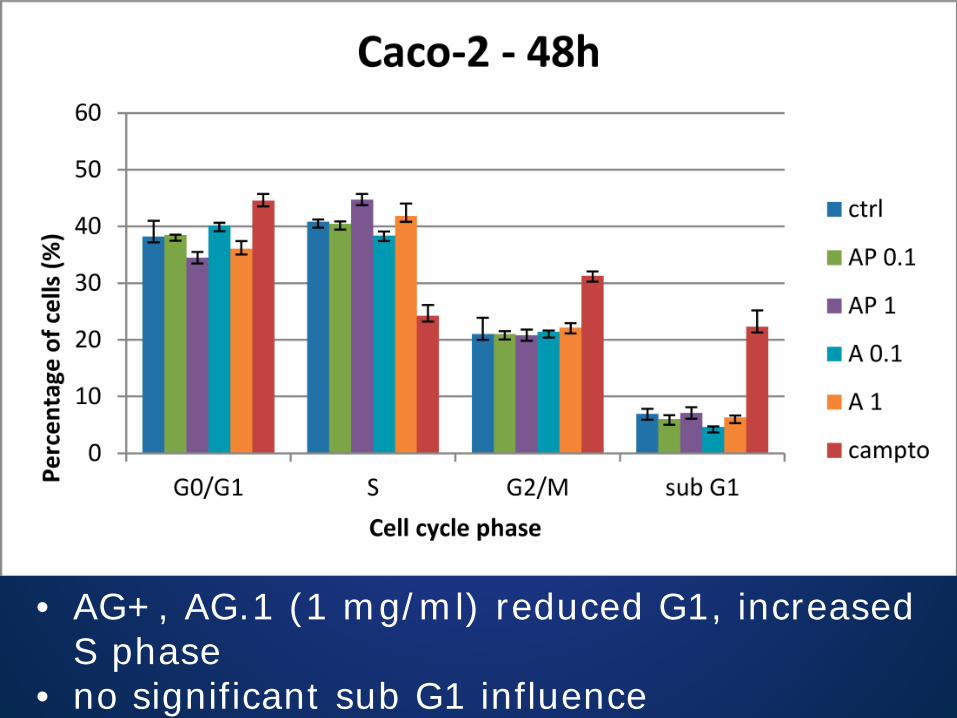
• AG+, AG.1 (1 mg/ml) reduced G1, increased S phase
• no significant sub G1 influence
Apoptosis Induction Detection by Annexin V Assay • Ratio of H460 cells in early or late
apoptosis, obtained by co-staining with FITC-labeled annexin V and propidium iodide (PI) and analyzed by flow cytometry.

• AG+ (1 mg/ml): moderate increase in early apoptotic cells

• AG+ (1 mg/ml): larger increase in late apoptotic/necrotic cells
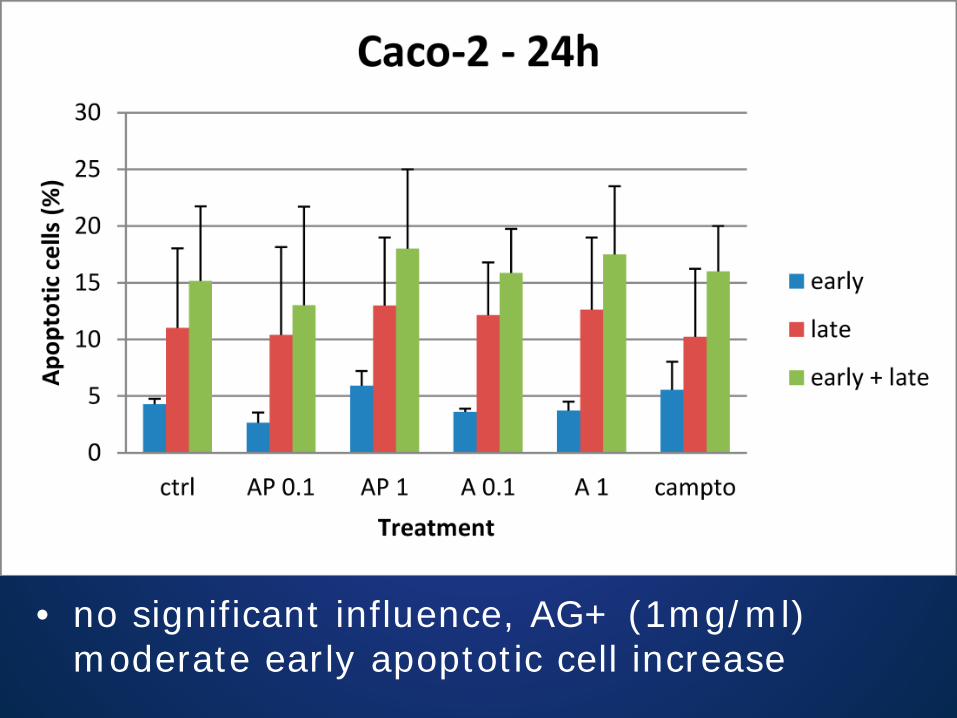
• no significant influence, AG+ (1mg/ml) moderate early apoptotic cell increase
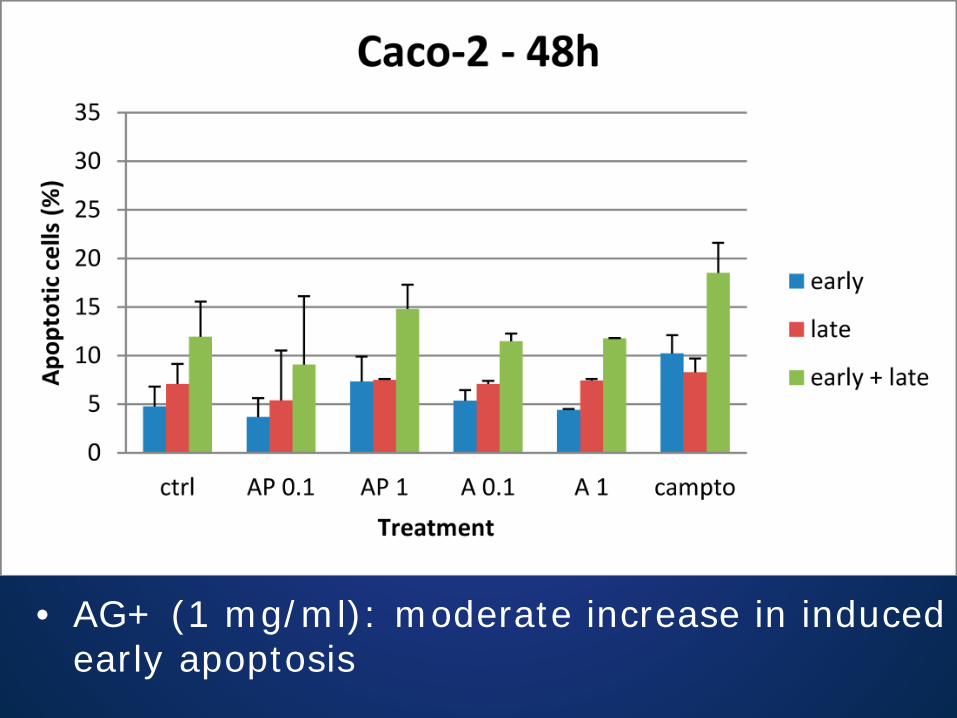
• AG+ (1 mg/ml): moderate increase in induced early apoptosis

Apoptosis induction detection by caspase-3 cleavage assessment • Appearance of the 17-kDa subunit (caspase-3
p17) – a major cleaved product of the 32-kDa zymogen procaspase-3 - confirms caspase-3 activation which marks the induction of apoptosis.
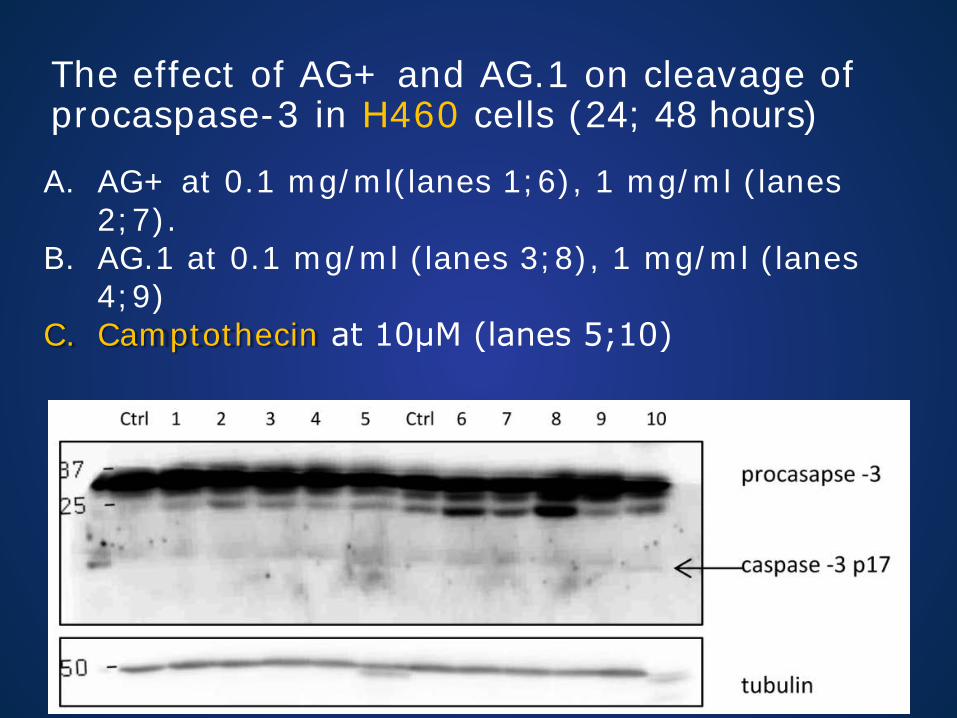
The effect of AG+ and AG.1 on cleavage of procaspase-3 in H460 cells (24; 48 hours)
A. AG+ at 0.1 mg/ml(lanes 1;6), 1 mg/ml (lanes 2;7).
B. AG.1 at 0.1 mg/ml (lanes 3;8), 1 mg/ml (lanes 4;9)
C. Camptothecin at 10μM (lanes 5;10)
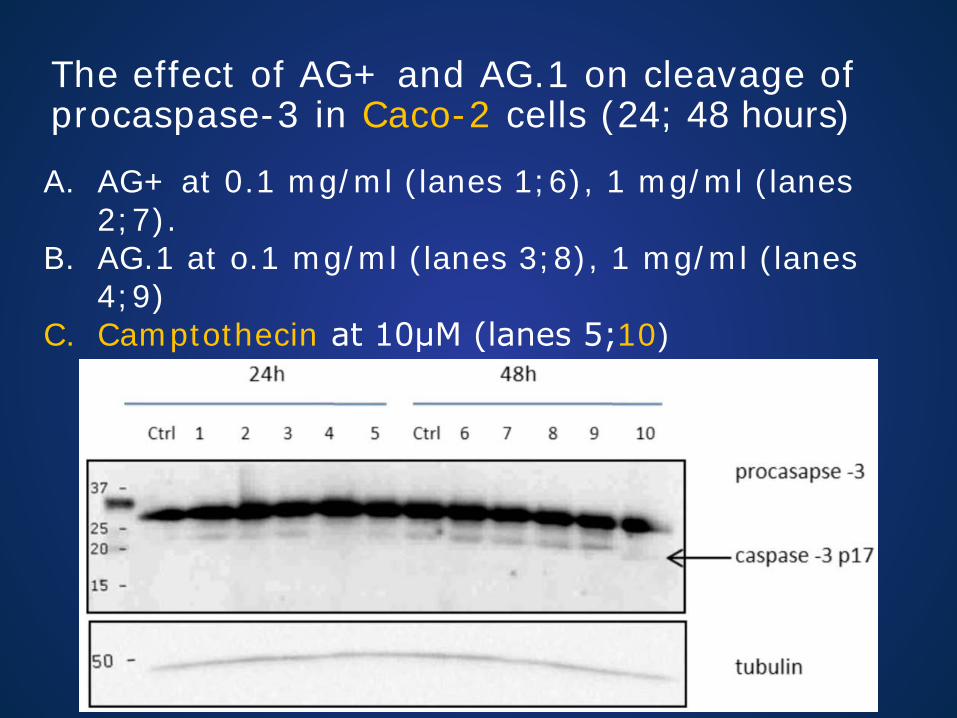
The effect of AG+ and AG.1 on cleavage of procaspase-3 in Caco-2 cells (24; 48 hours)
A. AG+ at 0.1 mg/ml (lanes 1;6), 1 mg/ml (lanes 2;7).
B. AG.1 at o.1 mg/ml (lanes 3;8), 1 mg/ml (lanes 4;9)
C. Camptothecin at 10μM (lanes 5;10)

Influence of AG+ and AG.1 on p53 and p21 protein expression • Agarikon.1, in both concentrations,
induced mild p53 protein expression in H460 after 24 hours (A; lanes 3 and 4)

• Both Agarikon Plus (lane 2) and Agarikon.1 (lane 4) at the concentration of 1 mg/ml induced a moderate increase in the expression of both p53 and p21 after 24 hours in H460

• In Caco-2 cells (B), only minor upregulation of p21 protein expression is detected after 48 hour treatment.

CONCLUSIONS
• Agarikon Plus and Agarikon.1 possess antiproliferative, mainly cytostatic activity, on H460 and Caco-2 cells, in the concentration range 1-10 mg/ml
• Both induce cell cycle perturbations, by delaying the progress through the G1 and S phase
• This points to disturbances occurring before or during DNA replication (confirmed by increase in both p53 and p21 protein expression)
CONCLUSIONS (II)
• Although a modest induction of early (after 24 hours) and late (48 hours) apoptosis was noticed by annexin V test, no processing (cleavage) of caspase-3 was detected
• More-pronounced antiproliferative activity (MTT) of tested agents towards Caco-2 line at maximal concentration (10 mg/ml) points to a non-specific cytotoxic effect

Acknowledgements
Dr. Marijeta Kralj Dr. Ana-Matea Mikecin Biozyne, Bijenicka c. 54, 10000 Zagreb,
Rudjer Boskovic Institute


APPENDIX
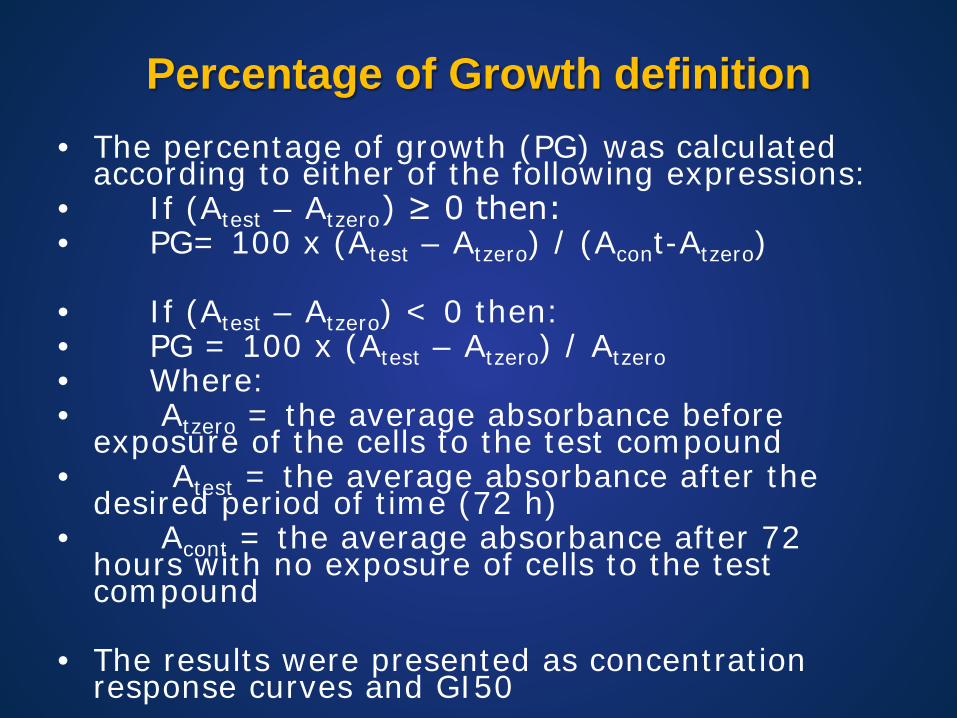
Percentage of Growth definition • The percentage of growth (PG) was calculated
according to either of the following expressions: • If (Atest – Atzero) ≥ 0 then: • PG= 100 x (Atest – Atzero) / (Acont-Atzero)
• If (Atest – Atzero) < 0 then: • PG = 100 x (Atest – Atzero) / Atzero • Where: • Atzero = the average absorbance before
exposure of the cells to the test compound • Atest = the average absorbance after the
desired period of time (72 h) • Acont = the average absorbance after 72
hours with no exposure of cells to the test compound
• The results were presented as concentration response curves and GI50

Camptothecin Proliferation Assay


