
June 2014
Alouette Project Water Use Plan Kokanee Out-Migration
Implementation Year 6 Reference: ALUMON-2
Evaluation of the Migration Success of O. nerka (Kokanee/Sockeye) from the Alouette Reservoir, - 2013
Study Period: 2013
LGL Limited
EA 3071
Evaluation of the Migration Success of O. nerka
(Kokanee / Sockeye) from the Alouette Reservoir, 2013
Prepared for:
BC Hydro
Water License Requirements
6911 Southpoint Drive, E16
Burnaby, BC V3N 4X8
Prepared by:
M. A. Mathews, J. J. Smith and R. C. Bocking
LGL Limited environmental research associates
9768 Second Street
Sidney, BC V8L 3Y8
June 2014

EVALUATION OF THE MIGRATION SUCCESS OF O. NERKA
(KOKANEE / SOCKEYE) FROM THE ALOUETTE RESERVOIR, 2013
Prepared by:
M. A. Mathews, J. J. Smith and R. C. Bocking
LGL Limited
environmental research associates
9768 Second Street
Sidney, BC V8L 3Y8
Prepared for:
BC Hydro
Water License Requirements
6911 Southpoint Drive, E16
Burnaby, BC V3N 4X8
20 June 2014
2013 Alouette O. nerka Out-Migration EA3071
LGL Limited / Katzie First Nation Page i
EXECUTIVE SUMMARY
In order to assess the feasibility of anadromous sockeye salmon (Oncorhynchus nerka)
re-introduction into the Alouette Reservoir, studies are being conducted to determine the
migration success of O. nerka smolts from the reservoir; 2013 was the ninth year of study of
juvenile salmon migration from the Alouette Reservoir. In 2005, spillway releases at the
Alouette Dam occurred from 3 May to 3 June to evaluate the migration success of marked coho
salmon (O. kisutch) smolts as they were captured in the Mud Creek rotary screw trap (RST),
located 1.5 km downstream of the Alouette Dam. In 2006, spillway releases at the Alouette Dam
again occurred from 11–31 May to evaluate the migration success of marked steelhead trout
(O. mykiss) from the Alouette Reservoir. In both years, coincidental O. nerka migrations were
monitored and an estimated 7,900 and 5,064 smolts migrated from the reservoir, respectively.
From 2007 to 2012, the spillway was opened from mid-April until mid-June (closed
approximately two weeks earlier in 2007, 2008, and 2010 once the migration had ceased) and
estimates of O. nerka smolt migrations from the reservoir ranged from 728 (95% CI: 348–1,108)
in 2012 to 62,923 (95% CI: 48,436–77,410) in 2007.
The Mud Creek RST was operated during the complete duration of the O. nerka smolt migration
from the Alouette Reservoir in 2013, from 13 April to 31 May. In total 1,032 O. nerka smolts
were captured, 794 of which were lower caudal clipped and released below the Alouette Dam,
1,165 fish were inspected for clips, and 149 clipped fish were recaptured. Using a pooled
Petersen estimator, an estimated 6,179 O. nerka smolts (95% CI: 5,350–7,008) migrated from the
Alouette Reservoir between 16 April and 31 May. This was the sixth highest estimate in nine
years of studies. Average daily spillway flows to the South Alouette River during the O. nerka
migration were maintained at similar levels to past years and ranged from 3.27–4.29 m3/s; no
post-surface release flush occurred in 2013.
A subsample of O. nerka smolts captured at the Mud Creek RST in 2013 were sampled for
length, weight, age (scales), and genetics (fin tissue). Randomly chosen O. nerka smolts
(< 100 mm FL) averaged 86 mm FL (range: 61–99 mm FL; n = 464) and 5.5 g (range: 2.0–9.6 g;
n = 464).
All other species captured were counted and released, including 254 steelhead smolts (> 90 mm
FL), 555 coho parr /smolts (> 70 mm FL) and more than 371,415 salmonid fry, most of which
were chum salmon (O. keta).

2013 Alouette O. nerka Out-Migration EA3071
LGL Limited / Katzie First Nation Page ii
TABLE OF CONTENTS
EXECUTIVE SUMMARY ............................................................................................................. i
LIST OF TABLES ......................................................................................................................... iii
LIST OF FIGURES ....................................................................................................................... iii
LIST OF APPENDICES ................................................................................................................ iv
LIST OF PHOTO PLATES ........................................................................................................... iv
INTRODUCTION .......................................................................................................................... 1
Management Questions ........................................................................................................... 5
Project Objectives .................................................................................................................... 6
METHODS ..................................................................................................................................... 6
Study Area ............................................................................................................................... 6
BC Hydro Operations .............................................................................................................. 6
Fish Capture and Sampling ...................................................................................................... 7
Statistical Analyses .................................................................................................................. 8
Abundance Estimate ......................................................................................................... 8 Fish Lengths, Weights and Condition Factor ................................................................... 9
224th Street Rotary Screw Trap ............................................................................................... 9
RESULTS ....................................................................................................................................... 9
BC Hydro Operations .............................................................................................................. 9
Fishing Effort and Physical Conditions ................................................................................. 10
Fish Capture and Sampling .................................................................................................... 11
O. nerka .......................................................................................................................... 11 Steelhead Smolts ............................................................................................................ 18
Other Species .................................................................................................................. 18 224th Street Rotary Screw Trap ............................................................................................. 18
DISCUSSION ............................................................................................................................... 19
BC Hydro Operations ............................................................................................................ 19
Fishing Effort ......................................................................................................................... 19
Abundance Estimate .............................................................................................................. 20
Run Timing ............................................................................................................................ 21
Biosamples ............................................................................................................................. 22
Steelhead Smolts (> 90 mm FL) ............................................................................................ 23
RECOMMENDATIONS .............................................................................................................. 23
ACKNOWLEDGMENTS ............................................................................................................ 23
REFERENCES ............................................................................................................................. 24
APPENDICES .............................................................................................................................. 26
2013 Alouette O. nerka Out-Migration EA3071
LGL Limited / Katzie First Nation Page iii
LIST OF TABLES
Table 1. Daily catch of O. nerka in the Mud Creek and 224th Street rotary screw traps,
2013. ....................................................................................................................... 12
Table 2. Total estimated O. nerka migration from the Alouette Reservoir, 2013. ............... 14
Table 3. Mean length of O. nerka less than 100 mm FL (random samples only),
2005−2013. ............................................................................................................. 16
Table 4. Mean weights of O. nerka less than 100 mm FL (random samples only),
2006−2007 and 2009–2013. ................................................................................... 17
Table 5. Total catch at the Mud Creek rotary screw trap and the corresponding
population estimate of O. nerka migrating from the Alouette Reservoir,
2005−2013. ............................................................................................................. 21
LIST OF FIGURES
Figure 1. Map of the Alouette Watershed showing local communities and features. ............. 2
Figure 2. Map of the South Alouette River and locations of the rotary screw traps
operational in 2013. .................................................................................................. 3
Figure 3. Comparison of flows at the Alouette Dam spillway gate during the O. nerka
migration period, 2005–2013. ................................................................................ 10
Figure 4. Daily discharge (m3/s) at Water Survey of Canada Station No. 08MH005 and
spillway flows from the Alouette Reservoir (15 April–15 June 2013). The
WSC station is located on the mainstem South Alouette River at the 232nd
Street bridge (discharge data from Water Survey of Canada website:
http://www.ec.gc.ca/rhc-wsc/). ............................................................................... 11
Figure 5. Daily catch of O. nerka at the Mud Creek rotary screw trap in 2013 in
comparison to the maximum, mean and minimum catches of the previous eight
years (spillway opened 3 May, 11 May, 16 April, 15 April, 15 April, 14 April,
15 April, 16 April, and 15 April for 2005–2013, respectively).............................. 14
Figure 6. Length frequency distribution of O. nerka measuring less than 100 mm FL (top
panel), and 100 mm FL or greater (bottom panel), captured in the Mud Creek
rotary screw trap operated in the South Alouette River (random and target
samples), 2005−2013. ............................................................................................ 15
Figure 7. Length-weight relationship of O. nerka smolts migrating from the South
Alouette Reservoir, 2013. ....................................................................................... 16
Figure 8. Comparison of mean condition factors from sampling years 2006–2007 and
2009−2013. Letters indicate results of the post-hoc pairwise comparisons
between years, where years that are not connected by the same letter are
significantly different. ............................................................................................ 17
Figure 9. Comparison of the average length of O. nerka smolts measuring less than
100 mm FL and the estimated abundance of O. nerka (all sizes) that migrated
from the South Alouette Reservoir, 2005–2013. Labels above the data points
indicate the study year. ........................................................................................... 18

2013 Alouette O. nerka Out-Migration EA3071
LGL Limited / Katzie First Nation Page iv
Figure 10. Daily catch of wild steelhead smolts (> 90 mm FL) at the Mud Creek rotary
screw trap, 2013. Minimum, maximum, and mean daily catches from
2006−2012 were plotted for reference. .................................................................. 19
LIST OF APPENDICES
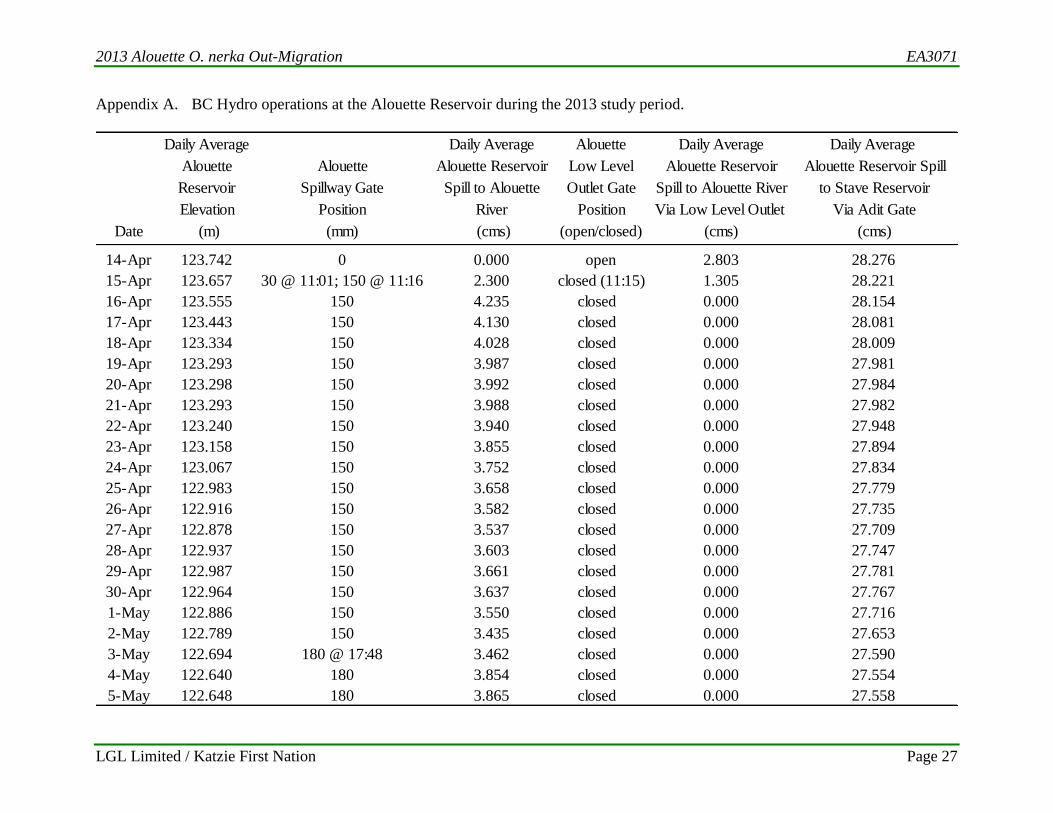
Appendix A. BC Hydro operations at the Alouette Reservoir during the 2013 study period. .... 27
Appendix B. Physical data collected at the Mud Creek rotary screw trap site, 2013. ................. 30
Appendix C. Catch of non-target species at the Mud Creek rotary screw trap, 2013. ................ 31
LIST OF PHOTO PLATES
Photo 1. Mud Creek rotary screw trap. ................................................................................... 8

2013 Alouette O. nerka Out-Migration EA3071
LGL Limited / Katzie First Nation Page 1
INTRODUCTION
Numerous interested parties in the Alouette Watershed, including government agencies, the
Katzie First Nation, stewardship groups, environmental Non-Government Organizations
(NGOs), and concerned citizens have a vision of restoring historic salmon (Oncorhynchus spp.)
runs above the Alouette Dam at the outlet of the Alouette Reservoir (Figure 1). Among other
things, salmon re-introduction to the Alouette Reservoir hinges on determining whether or not
sufficient numbers of juvenile salmonids (smolts) will exit over the dam at the south end of the
Alouette Reservoir or through the diversion to Stave Lake at the north end of the Alouette
Reservoir. A previous feasibility assessment on fish passage by Bengeyfield et al. (2001)
suggested that the majority of out-migrating smolts would orient to the much higher diversion
flows in watersheds with inter-basin water transfers (Alouette, Coquitlam, and Carpenter). As a
consequence, Bengeyfield et al. (2001) believed there was a reduced likelihood of successful re-
introduction of anadromous salmonids above dams in these watersheds.
In 2002, LGL Limited (Sidney, B.C.) developed a framework for evaluating fish passage issues
in the Bridge-Coastal hydro operating area (Bocking and Gaboury 2002). Following this, the
Bridge Coastal Restoration Program (BCRP) sponsored an evaluation of the feasibility of
restoring anadromous fish passage into the Alouette Reservoir (Gaboury and Bocking 2004).
Numerous recommendations were made for future studies to address the fish-passage question at
the Alouette Reservoir. To address the issue of whether smolts would exit over the dam or the
diversion to Stave Lake, the BCRP sponsored a study in 2005 that monitored the migration of
coho salmon (O. kisutch) smolts out of the Alouette Reservoir and down the South Alouette
River using unique colours of visible implant elastomer (VIE) tags during a test surface release
of ~3 m3/s from the Alouette Dam (Baxter and Bocking 2006). Estimated migration success
rates of coho salmon smolts to the lower Alouette River ranged from 79% for fish released at the
spillway to 31–38% for fish released in the reservoir. The 2005 study also monitored the
migration of sockeye salmon (O. nerka; raised to a suitable size) that were tagged with acoustic
transmitters for subsequent detection in listening arrays in the lower Fraser River, Juan de Fuca
Strait, and Strait of Georgia. From the release location, the estimated migration success was
26% to the lower Fraser River detection array and 5.3% to the Juan de Fuca detection array. In
2005, an estimated 7,900 O. nerka also emigrated from the reservoir. This unexpected result
prompted the Water Use Plan Consultative Committee (WUP CC) to recommend that the surface
release occur annually.
In 2006, a study was conducted to monitor steelhead (O. mykiss) smolt migration success out of
the Alouette Reservoir and down the South Alouette River using both VIE tags and adipose fin
clips (Humble et al. 2006). The estimated migration success rate to the lower Alouette River was
only 5.8% for steelhead smolts released in the reservoir. This low success rate was believed to
be, at least in part, related to the delayed opening of the spillway gate due to low water levels in
the reservoir. The 2006 project also provided a second year of O. nerka passage with an
estimated 5,064 fish migrating from the reservoir during the surface release flow of ~3 m3/s.
The 2005 and 2006 study results indicated that O. nerka smolts were successfully migrating from
the Alouette Reservoir and there was the potential for adult sockeye salmon to return as early as
2007. In order to assess the feasibility of sockeye salmon re-introduction into the Alouette
Reservoir, the 2007 smolt study was conducted to determine the volitional migration success of

2013 Alouette O. nerka Out-Migration EA3071
LGL Limited / Katzie First Nation Page 2
O. nerka from the reservoir during the surface release flow of ~3 m3/s. In 2007, a total of 7,787
O. nerka were captured in the Mud Creek rotary screw trap (RST), located 1.5 km downstream
of the Alouette Dam (Figure 2). An estimated 62,923 (95% confidence interval [CI]:
48,436−77,410) O. nerka emigrated from the Alouette Reservoir that year (Mathews and
Bocking 2007). Supported by the previous three years of results, and as part of the Alouette
Project Water Use Plan (BC Hydro 2009), surface release flows were scheduled to continue
annually with the expectation of re-establishing a sockeye salmon run. In 2008, 3,224 O. nerka
were captured at Mud Creek from 15 April to 26 May. The total 2008 migration was estimated
to be 8,257 fish; this included a mark-recapture estimate of 7,712 fish (95% CI: 6,682–8,742)
passing Mud Creek from 21 April to 8 May, plus an additional 545 fish (estimate based on trap
efficiency) that passed outside of the marking period (Mathews and Bocking 2009). Monitoring
continued at Mud Creek throughout the 2009 migration. In total, 1,247 O. nerka were captured
in the RST, yielding a total estimate of 4,287 (95% CI: 3,833–4,741) for the period of 21 April to
28 May 2009 (Mathews and Bocking 2010).
Figure 1. Map of the Alouette Watershed showing local communities and features.

2013 Alouette O. nerka Out-Migration EA3071
LGL Limited / Katzie First Nation Page 3
Figure 2. Map of the South Alouette River and locations of the rotary screw traps operational in 2013.

2013 Alouette O. nerka Out-Migration EA3071
LGL Limited / Katzie First Nation Page 4
In 2010, two sites were to be used for the mark-recapture study. The Mud Creek RST was
initially intended to operate as the recapture site. Two inclined plane traps (IPTs) located
approximately 500 m upstream from the RST were intended to operate as the marking site. The
IPTs were also to be used as a safe and effective trapping method during the flush. However,
despite numerous modifications to the IPTs and the trapping site, they were not successful at
capturing O. nerka smolts and were removed in early May. Fortunately, the RST operated as
both the mark and recapture sites (as in previous years), and was used effectively during the
2010 flush period. In total, 4,600 O. nerka were captured at the RST, yielding a total estimate of
14,201 fish (95% CI: 13,624–14,778) from 18 April to 24 May. An additional 1,233 migrants
were estimated based on trap efficiency (37.2%) outside of the marking period, resulting in a
total estimate of 15,434 O. nerka (Mathews and Bocking 2011). In 2011, 9,841 O. nerka were
captured at the Mud Creek RST and a mark-recapture estimate of 35,542 fish (95% CI:
34,034−37,051) was generated (Mathews et al. 2012). The 2012 study recorded the lowest
catches (83 O. nerka) since trapping began at the Mud Creek site; resulting in a mark-recapture
estimate of 728 fish (95% CI: 348-1,108; Mathews et al. 2013).
In the summer of 2007, 28 adult sockeye salmon returned to the South Alouette River. Genetic
and scale-sample analyses indicated that these fish were from the 2005 O. nerka smolt migration
from the reservoir (Godbout et al. 2011). During the summer of 2008, 54 adult sockeye salmon
returned to the South Alouette River and genetic analysis indicated no discernible difference
between these returning adults and the O. nerka smolt migrants (Mathews and Bocking 2009).
Adult returns continued in 2009 as 45 sockeye salmon returned to the outlet of the Alouette
Reservoir; 15 of these fish were tagged and tracked with radio telemetry to help determine the
spawning location and timing of returns (Plate and Bocking 2010). Returns of adult sockeye
salmon to the Alouette River in 2010 were the largest thus far as 115 migrants returned to the
outlet of the reservoir. Radio telemetry was again used to help determine spawning locations and
timing; 20 sockeye salmon were tagged and tracked (Plate and Bocking 2011). In 2011, 10 adult
sockeye salmon returned, of which four were tagged (E. Plate, LGL Limited, pers. comm.).
Adult returns then increased again in 2012 as 45 sockeye salmon returned to the South Alouette
River (Borick-Cunningham 2012). Of these fish, 21 were tagged and tracked which improved
our understanding of spawning timing and locations within the reservoir (Plate and Bocking
2013). These six years of returns, along with the continued smolt migration, lend support to the
expectation that a South Alouette River sockeye salmon run, extirpated since the mid-1920s
following the impoundment of the reservoir, could be re-established.
The revised Alouette Water License issued in April 2009 confirmed that the surface release and
associated O. nerka out-migration enumeration would be conducted through 2014. Due to
run-timing uncertainty, it was proposed that the surface release be done for a period of eight
weeks each year. Annual monitoring would continue in order to identify the typical start,
duration, and peak of the outmigration in hopes of shortening the duration of the surface release
and reducing the corresponding flood risks. Although the migration timing has remained
relatively consistent during the six years of full-season monitoring, there have been differences
in peak timing and duration. The 2011 migration continued through the first week of June,
which was approximately a week later than the 2007 and 2009 migrations, and two weeks later
than in 2008 and 2010. The peak of the 2009 migration occurred in the latter half of May, while
the peaks in 2007, 2008, and 2010 occurred late April. The 2010 migration also began with high

2013 Alouette O. nerka Out-Migration EA3071
LGL Limited / Katzie First Nation Page 5
catches immediately once the spillway was opened in mid-April. Peak catches in 2012 occurred
on the same date as 2011 (14 May); however, daily catches were extremely low and hence not
readily comparable to previous years. Subsequent years of monitoring are, therefore, beneficial
to help to improve our understanding of the timing of the run.
To address the uncertainty of whether the current magnitude of release is sufficient to promote
migration among all seaward smolts, an experimental post-surface release flush was proposed for
every second year of monitoring to determine if a doubling of flows for seven days could induce
additional migrants to move out of the reservoir. The first year of flush was attempted in 2009
and was scheduled for seven days at the tail end of the migration. However, once flows reached
a maximum of 6.5 m3/s, the integrity of the RST and safety of the crew and fish captured became
a concern, so the flush was terminated after only three days. As a result, it was proposed that a
flush occur again in 2010 with an alternative gear type (IPTs) that could be operated safely
during high flows. However, as discussed earlier, the IPTs were not effective at capturing
O. nerka smolts, so operational modifications were made to the RST so that it could operate
safely and effectively during the seven day flush period. No increases in O. nerka catches were
observed at the Mud Creek RST during the 2010 and 2011 post-surface release flush periods.
Management Questions
Three management questions will be addressed throughout the subsequent years of monitoring:
1) Is the surface release of at least 3 m3/s from the Alouette Dam (obtained through the spillway
gate) adequate to promote the downstream migration of O. nerka smolts out of the Alouette
Reservoir?
To address Question 1, the following hypothesis will be tested:
HO1: The seaward movement of kokanee/sockeye smolts, as identified from RST data
collected at the confluence of Mud Creek, has a start, peak, and end that are
characteristic of kokanee/sockeye smolts found in other systems (e.g., Cultus Lake
sockeye salmon).
2) Does a post-surface release flush of 6-9 m3/s, lasting seven days following the tail end of the
out-migration period encourage more smolts to leave the system?
To address Question 2, the following hypothesis will be tested:
HO2: The seaward movement of kokanee/sockeye smolts, as identified from RST data
collected at the confluence of Mud Creek, has a start, peak, and end (i.e., a bimodal
out-migration pattern) during those years when a post-surface release flush of
6-9 m3/s is implemented (the post surface release flush will be implemented on
average every two years).
3) How long should the surface release last to ensure out-migration of all smolts prepared to
leave the system?

2013 Alouette O. nerka Out-Migration EA3071
LGL Limited / Katzie First Nation Page 6
Question 3 will be addressed through consideration of the results of the two hypotheses
identified above, the start, peak and end dates of the migration period, the duration of the surface
release, an assessment of downstream movement patterns, and smolt out-migration data from
other coastal systems. These findings will then form the basis for an alternative surface release
regime to be considered at the next WUP review in 2014/2015.
Project Objectives
Specific objectives for the 2013 study year were to:
1) Operate the Alouette Dam spillway to allow ~3.0–4.5 m3/s of flow from 15 April to 14 June;
flows through the low level outlet will be held near 0.0 m3/s for the study period;
2) Install and operate a RST at the Mud Creek site, located 1.5 km downstream of the Alouette
Dam, from 15 April to 14 June (or earlier if the migration ceases) to monitor the migration of
O. nerka from the reservoir;
3) Capture O. nerka from the Alouette Reservoir in the Mud Creek RST;
4) Mark all O. nerka captured (up to a maximum of 150 fish + 10 target samples / day)
throughout the entire migration and re-capture these same marked O. nerka in the Mud Creek
RST to estimate total migration;
5) Determine the abundance, timing and biological characteristics of O. nerka migrating from
the Alouette Reservoir;
6) Collect genetic tissue from 100 individuals of O. nerka to determine stock identification; and
7) Record incidental catches of all other species.
METHODS
Study Area
The Alouette Reservoir is located in east Maple Ridge in southwest British Columbia (Figure 1).
The Alouette River watershed is a relatively small system (144 km2) that arises in the Coastal
Mountains of Golden Ears Provincial Park, approximately 50 km northeast of Vancouver, B.C.
The upper watershed flows into an impounded reservoir known as Alouette Lake. At the
reservoir’s river outlet, the South Alouette River flows for 21 km before entering Pitt River near
Pitt Meadows and the Pitt River, in turn, flows south into the Fraser River at Douglas Island.
Present fish resources within the Alouette Reservoir include kokanee (O. nerka), rainbow trout
(O. mykiss), bull trout (Salvelinus confluentus), cutthroat trout (O. clarki clarki), lake trout
(Salvelinus namaycush), stickleback (Gasterosteus sp.), sculpin (Cottus sp.), northern
pikeminnow (Ptycheilus oregonensis), peamouth chub (Mylocheilus caurinus), bridgelip sucker
(Catostomus columbianus), largescale sucker (Catostomus macrocheilus), and redside shiner
(Richardsonius balteatus; Wilson et al. 2003).
BC Hydro Operations
To facilitate the 2013 study, BC Hydro agreed to release water over the spillway at the Alouette
Dam, while closing the low level outlet, for the period of 15 April to 14 June. The spillway

2013 Alouette O. nerka Out-Migration EA3071
LGL Limited / Katzie First Nation Page 7
release and low level outlet closure were consistent throughout the duration of the RST
operation.
Fish Capture and Sampling
All fish for this study were captured at the Mud Creek RST, located on the South Alouette River
approximately 1.5 km downstream of the Alouette Dam (Figure 2; Photo 1). The Mud Creek
RST was checked twice daily. Each morning, crews enumerated all species of fish in the holding
box. Unmarked non-target fish were enumerated to species and released downstream of the trap.
All steelhead were examined for adipose fin clips (applied in 2006); and if clipped, were also
examined for the presence of a fluorescent VIE tag prior to release. Each evening, crews
checked the RST for debris and ensured that all fish in the holding box were healthy. All fish
captured after the morning check were processed the following morning.
Up to a daily maximum of 150 randomly chosen O. nerka were marked with a lower caudal fin
clip. If the random sample did not produce ten large fish (≥ 100 mm FL), then additional target
samples were to be collected until this goal was reached (up to a maximum of 10 fish per day).
All target fish were to receive an adipose fin clip instead of a lower caudal fin clip. All marked
fish were released into the plunge pool below the dam during the evening on the day they were
marked which allowed adequate time for recovery.
The first 40 randomly chosen O. nerka each day, as well as any target samples of large fish, were
measured for fork length (to the nearest millimetre) and weighed (to the nearest tenth of a gram).
Fish scales were collected from the first 10 randomly chosen O. nerka each day, and from all
target samples. Scales were sent to the Pacific Salmon Commission (Vancouver, B.C.) for
ageing. Genetic samples (fin tissue) were collected from the first 40 randomly chosen O. nerka
each day, from all target samples, and from any mortalities. Genetic samples were sent to the
Pacific Biological Station (Nanaimo, B.C.) to process for stock identification.

2013 Alouette O. nerka Out-Migration EA3071
LGL Limited / Katzie First Nation Page 8
Photo 1. Mud Creek rotary screw trap.
Statistical Analyses
Abundance Estimate
A pooled Petersen estimator with Chapman modification was used to estimate the number of
O. nerka migrating from the reservoir:
11
)1)(1(
R
CMN , where (1)
C = total number of fish caught in second sample (including recaptures),
M = number of fish caught, marked, and released in first sample,
N = population estimate, and
R = number of recaptures in the second sample (i.e., fish that were marked and released
in the first sample).
The variance, standard error, and approximate 95% confidence interval for the abundance
estimate (N) were calculated as follows:

2013 Alouette O. nerka Out-Migration EA3071
LGL Limited / Katzie First Nation Page 9
Variance of )2()1(
))()(1)(1(2
RR
RCRMCMN (2)
Standard error = NVarianceof (3)
N ± 1.96 * Standard Error (4)
Fish Lengths, Weights and Condition Factor
The lengths, weights, and condition factors of randomly chosen one-year-old O. nerka smolts
(i.e., fish considered to have over-wintered for one year in the Alouette Reservoir) were
compared by year of monitoring using ANOVA. Length-at-age data from 2005 to 2010
(Mathews and Bocking 2011) indicated that one-year-old fish were 100 mm FL or less, thus
bigger fish were excluded from the length and weight analyses. When ANOVA results were
statistically significant, Tukey’s HSD post-hoc multiple comparison was used to assess pairwise
differences.
224th Street Rotary Screw Trap
Westslope Fisheries Ltd. has been conducting a separate smolt migration enumeration study on
the South Alouette River since 1998. This monitoring project has been a requirement of the
Alouette DAM WUP (ALUMON-1) since 2008. The current trapping site is located
approximately 14 km downstream of the Alouette Reservoir near 224th Street (Figure 2; Cope
2014). The main objective of this annual study was to obtain abundance estimates of emigrant
fry and smolts (by species) using mark-recapture techniques. Crews at the 224th Street RST
inspected all O. nerka for fin clips that were applied at the Mud Creek RST.
RESULTS
BC Hydro Operations
The Alouette Dam spillway gate was opened on 15 April 2013 at 1101 hours and remained open
until 14 June at 1326 hours. During the O. nerka smolt migration period from 16 April to
23 May, average daily releases from the spillway gate ranged from 3.27–4.29 m3/s (Figure 3;
Appendix A). The low level outlet gate was closed from 15 April (1115 hours) to 14 June
(1310 hours). The spillway release and low level closure were consistent throughout the
duration of the trapping operations. Spillway flows were very similar to those maintained during
the full monitoring years (2007 and later); however, no flushing flows occurred at the tail end of
the 2013 migration. Also, as has been the case in past years, the majority of Alouette flows in
2013 were diverted to the Stave Reservoir via the adit gate (ranged from 27.55 to 28.28 m3/s
during the migration).

2013 Alouette O. nerka Out-Migration EA3071
LGL Limited / Katzie First Nation Page 10
Figure 3. Comparison of flows at the Alouette Dam spillway gate during the O. nerka
migration period, 2005–2013.
Fishing Effort and Physical Conditions
The Mud Creek RST was operated almost continuously from 13 April (1200 hours) to 31 May
(1000 hours). The RST was stopped for 5 minutes (0940–0945 hours) on 7 May to remove
debris from the drum. Although spillway flows continued as planned until 14 June, monitoring
ceased on 31 May because no O. nerka had been captured since 23 May, and the migration had
presumably ended.
Water temperature, water depth, RST rotational speed, and general weather conditions were
recorded daily each morning from 15 April to 30 May at the Mud Creek site (Appendix B).
Water temperature was measured using a hand-held thermometer. Daily discharge of the South
Alouette River was recorded at the Water Survey of Canada Station No. 08MH005 (~10 km
downstream of the Mud Creek RST site), and ranged from 3.14–9.37 m3/s (mean = 4.76 m3/s)
between 13 April and 31 May (Figure 4). Three spikes in Alouette River discharge occurred
during the smolt migration; however, none of these were associated with large increases in
spillway flows at the Alouette Dam (discharge increases were likely due to increases in tributary
inputs; Figure 4; Appendix A).
0
1
2
3
4
5
6
7
8
15-Apr 22-Apr 29-Apr 6-May 13-May 20-May 27-May 3-Jun
Sp
illw
ay F
low
(m
3/s
)
Date
2005 2006 2007
2008 2009 2010
2011 2012 2013

2013 Alouette O. nerka Out-Migration EA3071
LGL Limited / Katzie First Nation Page 11
Figure 4. Daily discharge (m3/s) at Water Survey of Canada Station No. 08MH005 and
spillway flows from the Alouette Reservoir (15 April–15 June 2013). The WSC
station is located on the mainstem South Alouette River at the 232nd Street bridge
(discharge data from Water Survey of Canada website: http://www.ec.gc.ca/rhc-
wsc/).
Fish Capture and Sampling
O. nerka
In 2013, 1,032 unmarked O. nerka were captured in the Mud Creek RST from 13 April to
31 May (Table 1; Figure 5). The peak catch of 388 smolts occurred on 5 May. The first
O. nerka was captured on 16 April, and the last O. nerka was captured on 23 May, a migration
duration of 38 days.
A total of 794 O. nerka (‘M’) were marked (lower caudal clipped) and released below the dam
from 16 April to 23 May 2013 (Table 2). In total 1,165 smolts (‘C’) captured at the Mud Creek
RST were examined for marks and considered available for recapture, 149 (‘R’; 12.8%) of those
examined were lower caudal clipped recaptures. Sixteen O. nerka captured from 16–17 April
were censored from the second-event sample due to the assumption of a two day travel time from
the plunge pool release site to the RST capture site (i.e., it was highly unlikely that these 16 fish
were already marked and hence had the potential of being recaptures). Capture efficiency at the
Mud Creek RST was estimated to be 18.8% (149 recaptures out of 794 marked fish released).
Using a pooled Petersen estimator, an estimated 6,179 (‘N’; 95% CI: 5,350–7,008) smolts
migrated from the Alouette Reservoir from 16 April to 31 May (Table 2). No target fish were
sampled in 2013 hence no O. nerka were adipose clipped.
0
2
4
6
8
10
15-Apr 22-Apr 29-Apr 06-May 13-May 20-May 27-May 03-Jun 10-Jun
Dis
cha
rge
& S
pil
lwa
y F
low
(m
3/s
)
Date
Discharge (Station No. 08MH005)
Spillway Alouette Reservoir

2013 Alouette O. nerka Out-Migration EA3071
LGL Limited / Katzie First Nation Page 12
Table 1. Daily catch of O. nerka in the Mud Creek and 224th Street rotary screw traps, 2013.
Date Unmarked Clip Recaptures Unmarked Clip Recapturesa
13-Apr 0
14-Apr 0 0
15-Apr 0 0
16-Apr 5 0
17-Apr 11 0 1
18-Apr 4 0 1
19-Apr 5 2
20-Apr 0 1
21-Apr 4 0
22-Apr 6 0
23-Apr 9 0
24-Apr 18 1
25-Apr 27 0
26-Apr 35 0
27-Apr 20 6 1
28-Apr 11 10 3
29-Apr 4 8 1
30-Apr 23 2 1
1-May 17 1 3
2-May 26 3 2 1
3-May 32 4 3
4-May 132 9 7 1
5-May 388 16 73 1
6-May 84 30 35 1
7-May 36 24 28 1
8-May 30 10 15 3
9-May 37 5 5 2
10-May 28 8 7
11-May 16 4 1
12-May 4 3 1 1
13-May 3 0 1 1
14-May 11 1 1
15-May 2 0 1
16-May 1 0
17-May 1 1 1
18-May 0 0
224th
StreetMud Creek

2013 Alouette O. nerka Out-Migration EA3071
LGL Limited / Katzie First Nation Page 13
Table 1. Continued.
Date Unmarked Clip Recaptures Unmarked Clip Recapturesa
19-May 0 0
20-May 0 0 1
21-May 0 0
22-May 1 0
23-May 1 0
24-May 0 0
25-May 0 0
26-May 0 0
27-May 0 0
28-May 0 0
29-May 0 0
30-May 0 0
31-May 0 0
1-Jun
2-Jun
3-Jun
4-Jun
5-Jun
6-Jun
7-Jun
8-Jun
9-Jun
10-Jun
11-Jun
12-Jun
13-Jun
14-Jun
Total 1,032 149 192 13a Clip recaptures from Mud Creek RST; an additional 8 fish (not displayed) were recaptures
from 224th
Street location.
Mud Creek 224th
Street

2013 Alouette O. nerka Out-Migration EA3071
LGL Limited / Katzie First Nation Page 14
Figure 5. Daily catch of O. nerka at the Mud Creek rotary screw trap in 2013 in comparison to
the maximum, mean and minimum catches of the previous eight years (spillway
opened 3 May, 11 May, 16 April, 15 April, 15 April, 14 April, 15 April, 16 April, and
15 April for 2005–2013, respectively).
Table 2. Total estimated O. nerka migration from the Alouette Reservoir, 2013.
Of the 1,032 O. nerka captured at Mud Creek in 2013, 552 were biosampled for fork length and
weight (one fish was later excluded from size analysis due to erroneous measurements), and their
corresponding fin clips were collected for genetic stock identification. Of those biosampled, 246
smolts were also scale-sampled for age analysis. Scale and genetic samples collected from
O. nerka in 2013 had not been analyzed at the time this report was prepared.
0
200
400
600
800
1,000
1,200
1,400
15-Apr 22-Apr 29-Apr 6-May 13-May 20-May 27-May 3-Jun 10-Jun
Nu
mb
er o
f O
. ner
ka
Ca
ptu
red
Date
Max Mean Min 2013
2005: n = 3,3102006: n = 1,7572007: n = 7,7872008: n = 3,2242009: n = 1,2472010: n = 4,6002011: n = 8,5252012: n = 832013: n = 1,032
No. O. nerka Clipped and Released Below Dam ('M') 794
No. O. nerka Examined for Clips ('C') 1,165
No. O. nerka Recaptures ('R') 149
Estimated O. nerka Passage (16 April‒31 May 2013) ('N') 6,179
95% Confidence Intervals (5,350‒7,008)
Trap Efficiency 18.8%

2013 Alouette O. nerka Out-Migration EA3071
LGL Limited / Katzie First Nation Page 15
The lengths of O. nerka sampled ranged from 61–218 mm FL (mean = 94 mm FL; n = 551;
Figure 6). The largest number of O. nerka were in the 81-85 mm (n = 170) size class, followed
closely by the 86-90 mm (n = 168) size class. The weights of O. nerka sampled ranged from
2.0–106.0 g and averaged 9.1 g (n = 551). Figure 7 displays a length-weight relationship
established for the 2013 O. nerka smolts migrating from the Alouette Reservoir.
Figure 6. Length frequency distribution of O. nerka measuring less than 100 mm FL (top
panel), and 100 mm FL or greater (bottom panel), captured in the Mud Creek rotary
screw trap operated in the South Alouette River (random and target samples),
2005−2013.
0.0
0.1
0.2
0.3
0.4
0.5
60 65 70 75 80 85 90 95 99
Rel
ati
ve
Fre
qu
ency
of
O. n
erk
a
Fork Length (mm)
2005 2006 2007 2008 2009 2010 2011 2012 2013
2005: n = 2332006: n = 1112007: n = 1982008: n = 4472009: n = 4892010: n = 7082011: n = 1,6182012: n = 402013: n = 464
0.00
0.05
0.10
0.15
0.20
0.25
0.30
0.35
100 110 120 130 140 150 160 170 180 190 200 210 220
Rel
ati
ve
Fre
qu
ency
of
O.n
erka
Fork Length (mm)
2005 2006 2007 2008 2009 2010 2011 2012 2013
2005: n = 7
2006: n = 9
2007: n = 22
2008: n = 67
2009: n = 12
2010: n = 149
2011: n = 49
2012: n = 41
2013: n = 87
2010: 8 fish >220mm not
shown (range: 226-266mm)
2011: 7 fish >220mm not
shown (range: 222-284mm)

2013 Alouette O. nerka Out-Migration EA3071
LGL Limited / Katzie First Nation Page 16
Figure 7. Length-weight relationship of O. nerka smolts migrating from the South Alouette
Reservoir, 2013.
Of those O. nerka measuring less than 100 mm FL (i.e., fish considered to have over-wintered
for one year in the Alouette Reservoir), mean lengths varied significantly among years (F8, 4285 =
519.6, P < 0.0001; Table 3). Post-hoc pairwise comparisons between years indicated the 2005,
2006, and 2012 mean fork lengths (78.6, 79.5, and 79.9 mm, respectively) were not significantly
different, and neither were the 2006, 2007, and 2012 mean fork lengths (79.5, 80.8, and 79.9 mm
FL, respectively). However, the mean fork lengths from all other year combinations differed
from one another. The mean fork length of fish measured in 2013 (85.6 mm) was the highest
observed in the nine years of study.
Table 3. Mean length of O. nerka less than 100 mm FL (random samples only), 2005−2013.
No weight data was collected in 2008, and the weight data collected in 2005 was excluded due to
sampling biases. The average weight of one-year-old O. nerka varied significantly among the
remaining study years (F6, 3583 = 678.2, P < 0.0001; Table 4). Post-hoc pairwise comparisons
0
10
20
30
40
50
60
60 70 80 90 100 110 120 130 140 150 160 170 180 190
Wei
gh
t (g
)
Fork Length (mm)
Weight = -0.73 + (9.70x10⁻⁶ Length3)
R2 = 0.76
Year Mean FL (mm) SE n
2005 78.6 0.31 233
2006 79.5 0.54 97
2007 80.8 0.38 198
2008 71.2 0.28 447
2009 75.0 0.23 489
2010 83.2 0.23 708
2011 72.4 0.12 1,618
2012 79.9 1.24 40
2013 85.6 0.22 464

2013 Alouette O. nerka Out-Migration EA3071
LGL Limited / Katzie First Nation Page 17
between years indicated that the mean weights in 2006, 2007, and 2012 (4.6, 4.8, and 4.3 g,
respectively) were not significantly different, but that all other pairs of years differed
significantly. The mean weight of fish measured in 2013 (5.5 g) was the highest observed in the
seven years of study.
Table 4. Mean weights of O. nerka less than 100 mm FL (random samples only), 2006−2007
and 2009–2013.
No condition factors were calculated from data collected in 2005 or 2008. The average condition
factor varied significantly among the remaining study years (F6, 3583 = 151.7, P < 0.0001).
Results of the post-hoc pairwise comparisons between years are shown in Figure 8, where years
that are not connected by the same letter are significantly different (2013 was not different from
2009; 2012 was not different from 2010 or 2011, etc.).
Figure 8. Comparison of mean condition factors from sampling years 2006–2007 and
2009−2013. Letters indicate results of the post-hoc pairwise comparisons between
years, where years that are not connected by the same letter are significantly different.
Year Mean Wt (g) SE n
2006 4.6 0.08 97
2007 4.8 0.08 198
2009 3.7 0.04 489
2010 5.0 0.05 684
2011 3.1 0.02 1,618
2012 4.3 0.22 40
2013 5.5 0.04 464
AA
B
C
D
CD
B
0.72
0.74
0.76
0.78
0.80
0.82
0.84
0.86
0.88
0.90
0.92
0.94
2006 2007 2009 2010 2011 2012 2013
Mea
n C
on
dit
ion
Fact
or
Monitoring Year

2013 Alouette O. nerka Out-Migration EA3071
LGL Limited / Katzie First Nation Page 18
Additionally, we compared the average length of O. nerka smolts measuring less than 100 mm
FL and the estimated abundance of O. nerka (all sizes) that migrated from the South Alouette
Reservoir (Figure 9). There was no apparent relationship between smolt size and abundance.
Figure 9. Comparison of the average length of O. nerka smolts measuring less than 100 mm FL
and the estimated abundance of O. nerka (all sizes) that migrated from the South
Alouette Reservoir, 2005–2013. Labels above the data points indicate the study year.
Steelhead Smolts
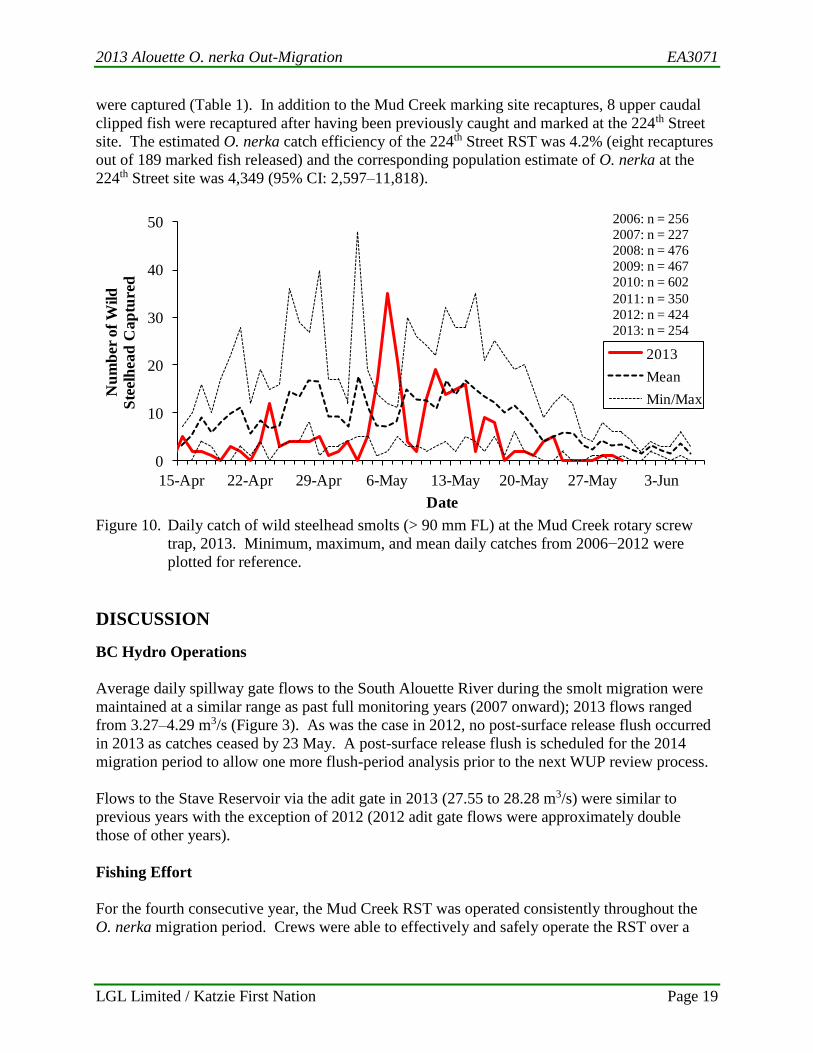
In 2013, a total of 254 wild steelhead smolts (> 90 mm FL) were captured in the Mud Creek
RST. Steelhead were caught consistently from 15 April to 29 May, and the peak catch occurred
on 6 May (n = 35; Figure 10). As has been the case consistently since 2010, no adipose-clipped
steelhead were captured in 2013.
Other Species
Consistent with past sampling years, many other non-target species were captured in the Mud
Creek RST in 2013. Greater than 371,415 salmonid fry were estimated from daily catches, the
vast majority were chum salmon (O. keta), and the remainder consisted of Chinook
(O. tshawytscha), and coho salmon fry (Appendix C). Other salmonid catches included a total of
555 coho salmon parr/smolts (> 70 mm FL), 55 Chinook salmon parr/smolts (> 70 mm FL),
22 steelhead (< 90 mm FL), 25 rainbow trout, and 1 cutthroat trout. In addition to these
salmonids, dace (Rhinichthys spp.), sculpin, northern pikeminnow, stickleback, peamouth chub
and lamprey (Lampetra sp.) were also counted and released.
224th Street Rotary Screw Trap
The 224th Street RST operated from 1 March to 14 June 2013. In total, 192 unmarked O. nerka
were captured from 17 April to 20 May and 13 lower caudal clipped O. nerka (from Mud Creek)
20052006
2007
20082009
2010
2011
2012
2013
0
10,000
20,000
30,000
40,000
50,000
60,000
70,000
70 71 72 73 74 75 76 77 78 79 80 81 82 83 84 85 86
Est
imate
d A
bu
nd
an
ce
Mean Fork Length (mm)
2013 Alouette O. nerka Out-Migration EA3071
LGL Limited / Katzie First Nation Page 19
were captured (Table 1). In addition to the Mud Creek marking site recaptures, 8 upper caudal
clipped fish were recaptured after having been previously caught and marked at the 224th Street
site. The estimated O. nerka catch efficiency of the 224th Street RST was 4.2% (eight recaptures
out of 189 marked fish released) and the corresponding population estimate of O. nerka at the
224th Street site was 4,349 (95% CI: 2,597–11,818).
Figure 10. Daily catch of wild steelhead smolts (> 90 mm FL) at the Mud Creek rotary screw
trap, 2013. Minimum, maximum, and mean daily catches from 2006−2012 were
plotted for reference.
DISCUSSION
BC Hydro Operations
Average daily spillway gate flows to the South Alouette River during the smolt migration were
maintained at a similar range as past full monitoring years (2007 onward); 2013 flows ranged
from 3.27–4.29 m3/s (Figure 3). As was the case in 2012, no post-surface release flush occurred
in 2013 as catches ceased by 23 May. A post-surface release flush is scheduled for the 2014
migration period to allow one more flush-period analysis prior to the next WUP review process.
Flows to the Stave Reservoir via the adit gate in 2013 (27.55 to 28.28 m3/s) were similar to
previous years with the exception of 2012 (2012 adit gate flows were approximately double
those of other years).
Fishing Effort
For the fourth consecutive year, the Mud Creek RST was operated consistently throughout the
O. nerka migration period. Crews were able to effectively and safely operate the RST over a
0
10
20
30
40
50
15-Apr 22-Apr 29-Apr 6-May 13-May 20-May 27-May 3-Jun
Nu
mb
er o
f W
ild
Ste
elh
ead
Cap
ture
d
Date
2013
Mean
Min/Max
2006: n = 256
2007: n = 227
2008: n = 476
2009: n = 467
2010: n = 602
2011: n = 350
2012: n = 424
2013: n = 254

2013 Alouette O. nerka Out-Migration EA3071
LGL Limited / Katzie First Nation Page 20
range of water conditions with very minimal down time. Substantial peaks in spillway flow did
not occur when large increases in Alouette River discharge were noted.
Abundance Estimate
At Mud Creek, the South Alouette River O. nerka smolt migration was estimated to be 6,179
(CI: 5,350–7,008) fish for the period of 16 April to 31 May 2013. This was the sixth highest
estimate in the nine years of study, almost 80% of the median estimate (N = 7,900 in 2005), and
approximately eight times larger than the lowest estimate (N = 728 in 2012; Table 5).
Although the 2013 abundance estimate ranked sixth highest (or fourth lowest) of the nine years
of study, the total catch of 1,032 O. nerka ranked second lowest, following the extreme low in
2012 of only 83 smolts. The Mud Creek RST capture efficiency in 2013 of 18.8% was also
lower than the range of 28–42% observed in earlier years of study (2005–2011, excluding 2007;
Table 5; Figure 5). As was the case in 2012 (capture efficiency of 11.3%), the low capture
efficiency did not appear to be the result of any operational issues at the RST site. This was
again supported by the fact that a large number of non-target species were captured at the Mud
Creek RST. Also, the total catch of 192 O. nerka at the 224th Street RST was proportional to
19% of the Mud Creek RST catch (Table 1), which is within the range of 9–31% observed since
the current WUP monitoring period began in 2008. Again, relative to previous years, there was
no significant variation in the location or cross-sectional position of the RST in the channel
(i.e., relative to the thalweg). A few weeks prior to the study period, significant rainfall did
cause erosion problems at the culvert confluence of Mud Creek; however, this did not appear to
alter the channel morphology of the RST site.

2013 Alouette O. nerka Out-Migration EA3071
LGL Limited / Katzie First Nation Page 21
Table 5. Total catch at the Mud Creek rotary screw trap and the corresponding population
estimate of O. nerka migrating from the Alouette Reservoir, 2005−2013.
Run Timing
The 38-day duration of the 2013 Alouette Reservoir O. nerka migration (16 April to 23 May)
was the shortest of all full seasons monitored (2007–2012, range: 39–51 days; Figure 5). The
start and peak dates for the 2005 and 2006 migrations were not comparable to those from 2007 to
2013 because the spillway was opened much later in those years (3 May 2005 and 11 May 2006),
and presumably after the onset of the O. nerka migrations.
In 2013, the first O. nerka were captured on 16 April, which was one day after the spillway was
opened. This timing was similar to the start dates observed from 2007 to 2012 during full season
monitoring (15–19 April). For the third consecutive year, catches during the first week of
migration were consistently low, indicating the spillway opening was timed well with the onset
of the migration. This was not always the case in past years. High catches of O. nerka upon
Year Total Catch
Abundance
Estimate (N)
Lower 95%
CI
Upper 95%
CI
Trap Efficiency
(%)
2005a
3,310 7,900 - - 42
2006b
1,757 5,064 - - 35
2007c
7,787 62,923 48,436 77,410 12
2008d
3,224 8,257 - - 40
2009e
1,247 4,287 3,833 4,741 34
2010f
4,600 15,434 - - 37
2011g
8,525 35,542 34,034 37,051 28
2012h
83 728 348 1,108 11
2013i
1,032 6,179 5,350 7,008 19
aBased on coho salmon trap efficiency (Baxter and Bocking 2006).
bBased on O. nerka trap efficiency (Humble et al. 2006).
cPooled Petersen estimate (19 April to 1 June) (Mathews and Bocking 2007) .
d
ePooled Petersen estimate (21 April to 1 June) (Mathews and Bocking 2010).
f
gPooled Petersen estimate (15 April to 8 June) (Mathews et al. 2012).
hPooled Petersen estimate (17 April to 1 June) (Mathews et al. 2013).
iPooled Petersen estimate (16 April to 31 May) (Mathews et al. 2014 In Press).
Trap efficiency estimate of 545 (15 April to 20 April & 9 May to 26 May) + Pooled Petersen estimate of 7,712
(95% CI 6,682 to 8,742; 21 April to 8 May) (Mathews and Bocking 2009).
Trap efficiency estimate of 1,232 (15 to 17 April) + Pooled Petersen estimate of 14,201 (95% CI 13,624 to 14,778;
18 April to 24 May) + Total catch of 1 (25 May to 1 June) (Mathews and Bocking 2011).

2013 Alouette O. nerka Out-Migration EA3071
LGL Limited / Katzie First Nation Page 22
immediate opening of the spillway in 2010, and to a lesser extent in 2007, indicated it was
possible that the migrations in these years may have begun earlier if the spillway had been
opened earlier.
Peak catches of O. nerka at both the Mud Creek and 224th Street RSTs occurred on 5 May in
2013. This was the only year that peak catches have occurred on the same day for both traps.
Since full-season monitoring began, peak catches have been staggered by one day during two of
the study years (2009 and 2010), and by several days during the other years. The occurrence of
peak catches on the same day at both traps is unexpected given the 224th Street RST is located
approximately 12.5 km downstream from the Mud Creek RST. The timing of peak catch in 2013
was in the range of past study years, ranging from 5–12 days later than 2007, 2008, and 2010
(23−30 April), and 4–13 days earlier than 2005, 2006, 2009, 2011, and 2012 (9–18 May).
Similar to the 2008 to 2012 study years, the date of peak catch in 2013 did not correspond to the
date of peak spillway flows. In contrast, peak catches in 2007 did occur during the period of
highest spillway flows.
End dates of the O. nerka migrations have varied considerably since 2005. The end date of the
2013 migration on 23 May was very similar to those observed in 2005, 2008, and 2012
(24−25 May); approximately one week earlier than those observed in 2006, 2007, 2009, and
2010 (28 May–1 June); and approximately two weeks earlier than the end date in 2011 (8 June).
Due to the continued variation in start dates, peak timing, and end dates observed since 2005,
additional years of monitoring are still required to better understand the run timing of O. nerka
from of the Alouette Reservoir. However, the target spill period from mid-April to mid-June (as
effected from 2007 to 2012) appears to cover the bulk of the smolt migration window in most
years monitored to-date.
Biosamples
The mean fork length of O. nerka (< 100 mm FL) sampled in 2013 (85.6 mm FL; n = 464) was
significantly larger than the mean fork lengths observed in previous study years (Table 3). On
average, the other ‘large fish years’ (mean > 78 mm FL), occurred in 2005 to 2007, 2012, and
2010, of which the latter year produced the second greatest mean of all study years (83.2 mm FL;
n = 708). The mean fork lengths in these years contrast notably with those in 2008, 2009, and
2011, in which mean lengths were smaller (range: 71.2–75.0 mm FL). In 2013, the largest
number of fish were in the 81–85 mm FL size class, followed closely by the 86–90 mm size class
(Figure 6). Size classes comprising the largest number of O. nerka have varied over the years:
66–70 (2008), 71–75 (2009, 2011, 2012), 76–80 (2005, 2006, 2012; equal numbers of fish
measured in 2012 were in both the latter two size classes), and 81–85 mm FL (2007, 2010). The
smallest O. nerka sampled in 2013 measured 61 mm FL, while the largest fish measured 218 mm
FL. As was the case with fork length, O. nerka sampled (< 100 mm FL) in 2013 had the heaviest
mean weight (5.5 g; n = 464); and it was significantly different from all other years with
measured weight data (Table 4).
Condition factor was compared across all years with length and weight data (2005 and 2008
excluded). The mean condition factor of the 2013 O. nerka smolts was 0.87 (n = 464), which

2013 Alouette O. nerka Out-Migration EA3071
LGL Limited / Katzie First Nation Page 23
was within the mean range of 0.80–0.90 from previous study years, and statistically significant
from all other years except 2009 (mean condition factor = 0.87; n = 489; Figure 8).
As mentioned earlier, age and genetic samples from the 2013 study year had not been analyzed
by the time this report was completed. Results of genetic analysis of the Alouette Reservoir
sockeye salmon population, including O. nerka smolt samples collected at Mud Creek during
past study years, are found in Godbout et al. (2011) and Godbout et al. (2013).
Steelhead Smolts (> 90 mm FL)
The total catch of wild steelhead smolts (> 90 mm FL) at the Mud Creek RST in 2013 (254 fish)
was the second lowest of the past eight years of monitoring (Figure 10). This was just 27 more
fish than the lowest catch year (227 fish in 2007), only 2 fish less than the 2006 catch of 256
smolts, and almost 100 fish less than the next highest catch year of 350 fish in 2011. The date of
peak catch in 2013 (6 May) was similar to 2010 (3 May) and 2007 (9 May), 8–11 days later than
2008, 2011, and 2012, and 7 and 9 days earlier than 2006 and 2009, respectively.
RECOMMENDATIONS
The following recommendations are proposed for the monitoring of O. nerka migration from the
Alouette Reservoir in 2014:
1) Maintain similar flows from the Alouette Dam spillway gate (3.0–4.5 m3/s), including a
post-surface release flush of 6.0–9.0 m3/s, lasting seven days following the tail end of the
out-migration period;
2) Conduct daily marking of O. nerka at the RST across the entire migration period to
ensure an accurate abundance estimate can be generated;
3) Collect genetic tissue from at least 100 O. nerka for stock identification;
4) Collect scale samples from O. nerka for ageing; and
5) Continue to enumerate all non-target fish species, including steelhead.
ACKNOWLEDGMENTS
The cooperation of many people was essential in meeting the objectives of this study. Special
thanks to George Moody and Roxanne Moody from the Katzie First Nation for their assistance
with daily operations and data collection. Thanks also to Denis Vaillancourt from the Katzie
First Nation for his assistance in planning and coordination. We are grateful to Greta Borick-
Cunningham and Geoff Clayton of the Alouette River Management Society (ARMS) for their
assistance throughout this program. We thank Scott Cope (Westslope Fisheries Ltd.) for
providing information on the 224th Street trapping operations. From BC Hydro, we thank Darin
Nishi for project management, Brent Wilson for providing assistance and operations data, and
Jeff Sneep for technical review. From LGL Limited, Dave Robichaud assisted with data analysis
and Dawn Keller edited the final report. We appreciate BC Hydro altering their operational
procedures at the Alouette Dam to accommodate the needs of this study. Funding for this project
was provided by BC Hydro as part of the Alouette WUP.

2013 Alouette O. nerka Out-Migration EA3071
LGL Limited / Katzie First Nation Page 24
REFERENCES
Baxter, B.E. and R.C. Bocking. 2006. Field trials to assess Coho smolt migration success
through the Alouette Reservoir, 2005. Report prepared by LGL Limited for BC Hydro
Bridge Coastal Fish and Wildlife Restoration Program. BCRP Report No. 05.Al.02.
BC Hydro. 2009. Alouette Project Water Use Plan (April 15, 2009). Revised for Acceptance
for the Comptroller of Water Rights. Prepared by BC Hydro Generation Resource
Management.
Bengeyfield, W., D. Hay, S. Joyce, and J. Greenbank. 2001. Evaluation of restoring historic fish
passage for anadromous fish at BC Hydro facilities. Report prepared for Power Supply
Environment, BC Hydro, Burnaby, B.C.
Bocking, R.C. and M.N. Gaboury. 2002. Framework for the evaluation of restoring historic
passage for anadromous fish at BC Hydro Bridge-Coastal Generation Area dams.
Prepared for Bridge-Coastal Fish and Wildlife Restoration Program.
Borick-Cunningham, G. 2012. Alouette Adult Sockeye Enumeration 2012. Prepared for BC
Hydro Water License Requirements. Prepared by Alouette River Management Society.
Cope, R.S. 2014. Alouette River salmonid smolt migration enumeration: 2013 Data Report.
Prepared for Alouette River Management Committee and BC Hydro Generation,
Burnaby, B.C. Prepared by Westslope Fisheries Ltd., Cranbrook, B.C.
Gaboury, M.N. and R.C. Bocking. 2004. Feasibility of reintroducing Sockeye and other species
of Pacific salmon in the Alouette Reservoir, B.C. Report prepared for Alouette River
Management Society, Maple Ridge, B.C.
Godbout, L., C.C. Wood, R.E. Withler, S. Latham, R.J. Nelson, L. Wetzel, R. Barnett-Johnson,
M.J. Grove, A.K. Schmitt, and K.D. McKeegan. 2011. Sockeye salmon (Oncorhynchus
nerka) return after an absence of nearly 90 years: a case of reversion to anadromy.
Canadian Journal of Fisheries and Aquatic Sciences 68(9): 1590-1602.
Godbout, L., C.C. Wood, R.E. Withler, D. Menard, A. Ogden. 2013. Assessment of smolt
production from anadromous O. nerka transferred into the Alouette Reservoir: Brood
Years 2008-2010. Prepared for BC Hydro Bridge Coastal Restoration Program.
Prepared by Fisheries and Oceans Canada, Pacific Biological Station.
Humble, S.R., A.C. Blakley, and R.C. Bocking. 2006. Field trials to assess Steelhead smolt
migration success through the Alouette Reservoir, 2006. Report prepared by LGL
Limited, Sidney, B.C., for BC Hydro Bridge Coastal Restoration Program.
Mathews, M.A. and R.C. Bocking. 2007. Evaluation of the migration success of O. nerka
(Kokanee / Sockeye) from the Alouette Reservoir, 2007. Report prepared by LGL
Limited, Sidney, B.C., for BC Hydro Bridge Coastal Restoration Program.
Mathews, M.A. and R.C. Bocking. 2009. Evaluation of the migration success of O. nerka
(Kokanee / Sockeye) from the Alouette Reservoir, 2008. Report prepared by LGL
Limited, Sidney, B.C., for BC Hydro Water License Requirements.

2013 Alouette O. nerka Out-Migration EA3071
LGL Limited / Katzie First Nation Page 25
Mathews, M.A. and R.C. Bocking. 2010. Evaluation of the migration success of O. nerka
(Kokanee / Sockeye) from the Alouette Reservoir, 2009. Report prepared by LGL
Limited, Sidney, B.C., for BC Hydro Water License Requirements.
Mathews, M.A. and R.C. Bocking. 2011. Evaluation of the migration success of O. nerka
(Kokanee / Sockeye) from the Alouette Reservoir, 2010. Report prepared by LGL
Limited, Sidney, B.C., for BC Hydro Water License Requirements.
Mathews, M.A., J.J. Smith, and R.C. Bocking. 2012. Evaluation of the migration success of
O. nerka (Kokanee / Sockeye) from the Alouette Reservoir, 2011. Report prepared by
LGL Limited, Sidney, B.C., for BC Hydro Water License Requirements.
Mathews, M.A., J.J. Smith, and R.C. Bocking. 2013. Evaluation of the migration success of
O. nerka (Kokanee / Sockeye) from the Alouette Reservoir, 2012. Report prepared by
LGL Limited, Sidney, B.C., for BC Hydro Water License Requirements.
Plate, E.M. and R.C. Bocking. 2010. Alouette Lake Sockeye tracking study 2009. Report
prepared by LGL Limited, Sidney, B.C., for BC Hydro Bridge Coastal Restoration
Program, Burnaby, B.C.
Plate, E.M. and R.C. Bocking. 2011. Alouette Lake Sockeye tracking study 2010. Report
prepared by LGL Limited, Sidney, B.C., for BC Hydro Bridge Coastal Restoration
Program, Burnaby, B.C.
Plate, E.M. and R.C. Bocking. 2013. Alouette Lake Sockeye tracking study, 2011-2012. Report
prepared by LGL Limited, Sidney, B.C., for BC Hydro Bridge Coastal Restoration
Program, Burnaby, B.C.
Water Survey of Canada [Internet]. 2012. Gatineau, Q.C.: Government of Canada, Environment
Canada; [modified 10 January 2013; accessed February 2013]. Available from:
http://www.ec.gc.ca/rhc-wsc/.
Wilson, G., K. Ashley, M. McCusker, R. Land, J. Stockner, G. Scholten, D. Dolecki, and
D. Sebastian. 2003. The Alouette Reservoir Fertilization Project: Years 2000 and 2001
experiment, whole reservoir fertilization. Fisheries Project Report No. RD 99 2003.
Ministry of Water, Land & Air Protection, Aquatic Ecosystem Section, Province of B.C.

2013 Alouette O. nerka Out-Migration EA3071
LGL Limited / Katzie First Nation Page 26
APPENDICES
2013 Alouette O. nerka Out-Migration EA3071
LGL Limited / Katzie First Nation Page 27
Appendix A. BC Hydro operations at the Alouette Reservoir during the 2013 study period.
Daily Average Daily Average Alouette Daily Average Daily Average
Alouette Alouette Alouette Reservoir Low Level Alouette Reservoir Alouette Reservoir Spill
Reservoir Spillway Gate Spill to Alouette Outlet Gate Spill to Alouette River to Stave Reservoir
Elevation Position River Position Via Low Level Outlet Via Adit Gate
Date (m) (mm) (cms) (open/closed) (cms) (cms)
14-Apr 123.742 0 0.000 open 2.803 28.276
15-Apr 123.657 30 @ 11:01; 150 @ 11:16 2.300 closed (11:15) 1.305 28.221
16-Apr 123.555 150 4.235 closed 0.000 28.154
17-Apr 123.443 150 4.130 closed 0.000 28.081
18-Apr 123.334 150 4.028 closed 0.000 28.009
19-Apr 123.293 150 3.987 closed 0.000 27.981
20-Apr 123.298 150 3.992 closed 0.000 27.984
21-Apr 123.293 150 3.988 closed 0.000 27.982
22-Apr 123.240 150 3.940 closed 0.000 27.948
23-Apr 123.158 150 3.855 closed 0.000 27.894
24-Apr 123.067 150 3.752 closed 0.000 27.834
25-Apr 122.983 150 3.658 closed 0.000 27.779
26-Apr 122.916 150 3.582 closed 0.000 27.735
27-Apr 122.878 150 3.537 closed 0.000 27.709
28-Apr 122.937 150 3.603 closed 0.000 27.747
29-Apr 122.987 150 3.661 closed 0.000 27.781
30-Apr 122.964 150 3.637 closed 0.000 27.767
1-May 122.886 150 3.550 closed 0.000 27.716
2-May 122.789 150 3.435 closed 0.000 27.653
3-May 122.694 180 @ 17:48 3.462 closed 0.000 27.590
4-May 122.640 180 3.854 closed 0.000 27.554
5-May 122.648 180 3.865 closed 0.000 27.558

2013 Alouette O. nerka Out-Migration EA3071
LGL Limited / Katzie First Nation Page 28
Appendix A. Continued.
Daily Average Daily Average Alouette Daily Average Daily Average
Alouette Alouette Alouette Reservoir Low Level Alouette Reservoir Alouette Reservoir Spill
Reservoir Spillway Gate Spill to Alouette Outlet Gate Spill to Alouette River to Stave Reservoir
Elevation Position River Position Via Low Level Outlet Via Adit Gate
Date (m) (mm) (cms) (open/closed) (cms) (cms)
6-May 122.719 180 3.992 closed 0.000 27.604
7-May 122.799 180 4.134 closed 0.000 27.657
8-May 122.854 170 @ 15:14; 150 @ 15:44 3.962 closed 0.000 27.693
9-May 122.887 150 3.547 closed 0.000 27.715
10-May 122.916 150 3.580 closed 0.000 27.734
11-May 122.943 150 3.610 closed 0.000 27.751
12-May 123.083 150 3.762 closed 0.000 27.840
13-May 123.383 150 4.067 closed 0.000 28.037
14-May 123.585 150 4.258 closed 0.000 28.171
15-May 123.624 150 4.294 closed 0.000 28.198
16-May 123.374 150 4.064 closed 0.000 28.035
17-May 123.309 150 4.003 closed 0.000 27.992
18-May 123.245 150 3.944 closed 0.000 27.951
19-May 123.177 150 3.876 closed 0.000 27.906
20-May 123.093 150 3.782 closed 0.000 27.851
21-May 123.025 150 3.704 closed 0.000 27.806
22-May 122.975 150 3.649 closed 0.000 27.774
23-May 122.916 150 3.582 closed 0.000 27.735
24-May 122.839 150 3.496 closed 0.000 27.685
25-May 122.759 150 3.391 closed 0.000 27.632
26-May 122.677 150 3.268 closed 0.000 27.578
27-May 122.604 180 @ 15:35 3.378 closed 0.000 27.531

2013 Alouette O. nerka Out-Migration EA3071
LGL Limited / Katzie First Nation Page 29
Appendix A. Continued.
Daily Average Daily Average Alouette Daily Average Daily Average
Alouette Alouette Alouette Reservoir Low Level Alouette Reservoir Alouette Reservoir Spill
Reservoir Spillway Gate Spill to Alouette Outlet Gate Spill to Alouette River to Stave Reservoir
Elevation Position River Position Via Low Level Outlet Via Adit Gate
Date (m) (mm) (cms) (open/closed) (cms) (cms)
28-May 122.581 180 3.746 closed 0.000 27.515
29-May 122.640 180 3.851 closed 0.000 27.553
30-May 122.675 180 3.914 closed 0.000 27.576
31-May 122.675 180 3.916 closed 0.000 27.577
1-Jun 122.631 180 3.839 closed 0.000 27.549
2-Jun 122.561 180 3.713 closed 0.000 27.503
3-Jun 122.484 180 3.575 closed 0.000 27.453
4-Jun 122.406 180 3.435 closed 0.000 27.401
5-Jun 122.336 210 @ 12:16 3.558 closed 0.000 27.355
6-Jun 122.267 210 3.677 closed 0.000 27.310
7-Jun 122.217 210 3.567 closed 0.000 17.135
8-Jun 122.230 210 3.595 closed 0.000 7.650
9-Jun 122.237 210 3.609 closed 0.000 7.651
10-Jun 122.243 210 3.622 closed 0.000 4.554
11-Jun 122.281 210 3.702 closed 0.000 0.000
12-Jun 122.318 210 3.782 closed 0.000 0.000
13-Jun 122.351 210 3.854 closed 0.000 0.000
14-Jun 122.386 190 @ 10:06; 0 @ 13:26 2.068 opened (13:10) 1.189 0.000
15-Jun 122.423 0 0.000 open 2.670 0.000

2013 Alouette O. nerka Out-Migration EA3071
LGL Limited / Katzie First Nation Page 30
Appendix B. Physical data collected at the Mud Creek rotary screw trap site, 2013.
Date
Water
Temp
(ºC)
Weather
Conditions
RST
Speed
(RPM)
Water
Depth
(cm) Date
Water
Temp
(ºC)
Weather
Conditions
RST
Speed
(RPM)
Water
Depth
(cm)
15-Apr 8 sunny 8 26 8-May 8 sunny 8 28
16-Apr 6 sunny 8 30 9-May 9 sunny 8 26
17-Apr 6 sunny 8 30 10-May 8 sunny 8 26
18-Apr 6 rainy 8 29 11-May 11 overcast 8 26
19-Apr 6 rainy 8 31 12-May 11 rain 8 27
20-Apr 6 overcast 8 30 13-May 10 rain 8 29
21-Apr 5 rainy 8 30 14-May 9 overcast 8 30
22-Apr 5 sunny 8 29 15-May 12 overcast 8 30
23-Apr 6 sunny 8 28 16-May 12 overcast 8 31
24-Apr 6 sunny 8 28 17-May 10 overcast 8 30
25-Apr 6 sunny 8 27 18-May 11 overcast 8 30
26-Apr 7 sunny 8 27 19-May 11 overcast 8 29
27-Apr 8 rainy 8 26 20-May 11 overcast 8 29
28-Apr 7 overcast 8 27 21-May 10 rain 8 28
29-Apr 5 sunny 8 27 22-May 10 sunny 8 28
30-Apr 5 sunny 8 27 23-May 10 sunny 8 28
1-May 6 sunny 8 27 24-May 11 sunny 8 27
2-May 8 sunny 8 27 25-May 10 overcast 8 27
3-May 7 sunny 8 27 26-May 12 rainy 8 27
4-May 8 sunny 8 27 27-May 12 overcast 8 26
5-May 10 sunny 8 27 28-May 13 overcast 8 29
6-May 11 sunny 8 27 29-May 12 rainy 8 30
7-May 10 sunny 8 28 30-May 10 overcast 8 30

2013 Alouette O. nerka Out-Migration EA3071
LGL Limited / Katzie First Nation Page 31
Appendix C. Catch of non-target species at the Mud Creek rotary screw trap, 2013.
Date
Chum
Fry
Chinook/
Coho
Fry
Salmon
Fry
(est.)
Chinook
Parr/Smolt
(>70mm)
Coho
Parr/Smolt
(>70mm)
Steelhead
(<90mm)
Steelhead
(>90mm)
Rainbow
no Clip Cutthroat
Dace
Spp.
Sculpin
Spp.
Northern
Pike-
minnow
Stickle-
back
Peamouth
Chub
Red Side
Shiner Lamprey
14-Apr 100 0 10,000 0 0 0 0 0 0 0 0 0 0 0 0 0
15-Apr 100 0 33,000 0 0 0 5 1 0 0 1 0 1 0 0 0
16-Apr 100 0 32,000 0 3 2 2 0 0 5 4 0 0 0 0 1
17-Apr 100 0 28,000 0 4 1 2 0 0 6 0 0 1 0 0 1
18-Apr 100 0 32,000 0 3 1 1 0 0 6 0 0 0 0 0 0
19-Apr 99 1 50,000 0 5 3 0 0 0 3 1 0 0 0 0 1
20-Apr 99 1 39,000 0 14 2 3 0 0 5 2 0 0 0 0 0
21-Apr 99 1 13,000 1 6 1 2 0 0 2 5 0 0 0 0 0
22-Apr 100 0 21,000 0 5 0 0 0 0 2 3 0 0 0 0 0
23-Apr 100 0 18,000 0 5 1 4 1 0 3 2 0 0 0 0 0
24-Apr 100 0 19,000 0 14 1 12 0 0 10 1 0 1 0 0 0
25-Apr 100 0 10,000 1 3 0 3 0 0 1 1 0 0 0 0 1
26-Apr 100 0 12,000 0 12 0 4 0 0 13 1 0 0 0 0 0
27-Apr 100 0 20,000 0 5 0 4 0 1 15 1 0 0 0 0 1
28-Apr 99 1 12,000 0 5 1 4 0 0 26 6 0 0 0 0 0
29-Apr 99 1 6,000 0 10 0 5 1 0 1 10 0 1 0 0 1
30-Apr 100 0 1,000 0 15 1 1 1 0 0 2 0 0 0 0 0
1-May 100 0 3,000 0 18 1 2 0 0 2 0 0 0 0 0 0
2-May 100 0 3,000 0 15 1 4 0 0 25 8 0 0 0 0 0
3-May 100 0 2,000 0 15 1 0 0 0 2 1 0 0 0 0 2
4-May 100 0 1,500 14 7 0 5 0 0 8 6 0 0 0 0 0
5-May 100 0 2,000 11 6 0 17 2 0 51 11 1 1 0 0 0
6-May 100 0 1,000 6 9 0 35 5 0 22 18 1 3 0 0 2
7-May 100 0 1,000 9 41 0 21 4 0 12 13 0 0 0 0 0
8-May 100 0 500 0 48 0 4 0 0 4 9 1 1 0 0 1
9-May 99 1 500 8 35 1 2 1 0 3 2 0 0 0 0 1
10-May 100 0 500 0 25 1 13 1 0 4 3 0 0 0 0 0
11-May 60 40 200 2 19 0 19 1 0 7 1 1 0 0 0 1
12-May 100 0 <100 0 26 1 14 1 0 6 5 0 0 0 0 1
13-May 100 0 100 0 55 2 15 2 0 1 4 0 0 1 0 1
14-May 100 0 <100 1 34 0 16 0 0 6 2 0 1 0 0 0
15-May 50 50 25 0 12 0 2 0 0 1 4 1 1 0 0 0
Species
Composition (%) Total Catch (# fish)

2013 Alouette O. nerka Out-Migration EA3071
LGL Limited / Katzie First Nation Page 32
Appendix C. Continued.
Date
Chum
Fry
Chinook/
Coho
Fry
Salmon
Fry
(est.)
Chinook
Parr/Smolt
(>70mm)
Coho
Parr/Smolt
(>70mm)
Steelhead
(<90mm)
Steelhead
(>90mm)
Rainbow
no Clip Cutthroat
Dace
Spp.
Sculpin
Spp.
Northern
Pike-
minnow
Stickle-
back
Peamouth
Chub
Red Side
Shiner Lamprey
16-May 100 0 <25 0 5 0 9 0 0 5 5 2 1 0 0 0
17-May 50 50 <50 0 10 0 8 0 0 1 2 2 1 0 0 1
18-May 50 50 20 0 8 0 0 1 0 0 0 0 0 0 0 0
19-May 40 60 50 0 2 0 2 0 0 0 2 3 0 0 0 0
20-May 50 50 <50 1 12 0 2 1 0 1 5 0 0 0 0 0
21-May 50 50 <20 0 1 0 1 1 0 2 5 3 1 0 0 0
22-May 40 60 <20 1 9 0 4 0 0 2 2 0 0 0 0 0
23-May 60 40 <20 0 2 0 5 0 0 0 4 0 1 0 0 0
24-May 50 50 <10 0 6 0 0 0 0 0 0 1 0 0 0 0
25-May 50 50 <20 0 4 0 0 0 0 0 4 0 2 0 0 0
26-May 40 60 <20 0 7 0 0 0 0 2 3 0 0 1 0 0
27-May 30 70 20 0 3 0 0 0 0 2 0 0 0 0 0 1
28-May 50 50 <20 0 4 0 1 0 0 1 6 0 0 0 0 0
29-May 40 60 <20 0 7 0 1 0 0 2 3 1 0 0 0 0
30-May 30 70 <20 0 1 0 0 1 0 2 3 0 1 0 0 0
31-May -- -- 0 0 0 0 0 0 0 0 0 0 0 0 0 0
Totals -- -- > 371,415 55 555 22 254 25 1 272 171 17 18 2 0 17
Species
Composition (%) Total Catch (# fish)


