table of contents - alouette valley...
TRANSCRIPT
Table of Contents Title Page Abstract
Acknowledgement Introduction
Study Area and Background Information Data Sources
Results Conclusion and Possible Further Studies
References Feedback
Abstract This study presents data on flooding along the Alouette River in Maple Ridge, BC. Although the Alouette is controlled by a BC Hydro dam, significant flooding can and does occur, most recently in 1995. BC Hydro, together with the municipality and various emergency preparedness organizations, has put into place several warning and preparedness plans. Education of the public about the extent of possible floods is part of the warning process. This project facilitates that education by providing a mildly interactive World Wide Web site allowing residents of the area and other interested persons to examine maps which illustrate the extent of flooding under three scenarios. Larger, more detailed maps may be accessed by clicking on locations on the main maps. All maps in this study were prepared using GIS and related technologies. This project also used GIS technology to estimate the number of persons affected by each of the flooding scenarios.
Acknowledgement The authors would like to acknowledge the cooperation and support of BC Hydro in the preparation of this study. In particular, we would like to thank Mr. Dave Cattanach, P.Eng., manager of BC Hydro’s Hydrotechnical division. BC Hydro provided us with considerable data without which this project could not have been completed.
Introduction This study maps the flood plain of the Alouette River (the "Alouette") in the urbanized portion of the District of Maple Ridge, British Columbia. It illustrates the areas expected to be inundated by floods resulting from 3 representative flows in the Alouette. These areas are shown on maps which allow the reader to zoom in to some degree and to determine if a particular property is assumed to be at risk of flooding for the given flow. The project also determined the approximate number of persons inhabiting the flooded areas based upon 1991 Census Canada data.
The study was designed to serve as a model for, or to be directly incorporated in, an interactive public information tool accessible on BC Hydro’s World Wide Web site. Although this information is available to the public in hard copy form, the authors believe this to be the first presentation of this data on the Internet.
This project was compiled using a variety of software available to students in the Department of Geography at the University of British Columbia. Computer programs used included Roots for digitizing the flood plain areas, Idrisi for geographic information system analyses, and CorelDraw7 and Photo-Paint7 for graphics. Data included hardcopy floodplain maps provided by BC Hydro, TRIM map data from the BC Ministry of Environment, Lands & Parks, and population data collected by Statistics Canada as part of the national census in 1991.
The project is intended as a public information tool and does not include an analysis of the hazards or risks of flooding although it does briefly describe the causes.
The contents of this report include visual outlines of the Maple Ridge Alouette floodplain area, a description of the data sources used , the methodology of the project’s completion, the results obtained, and conclusions and ideas for further study arising from the project.
Study Area and Background Information
Location and History of the Alouette River | Location of Study Area | The Flooding Problem | Responses
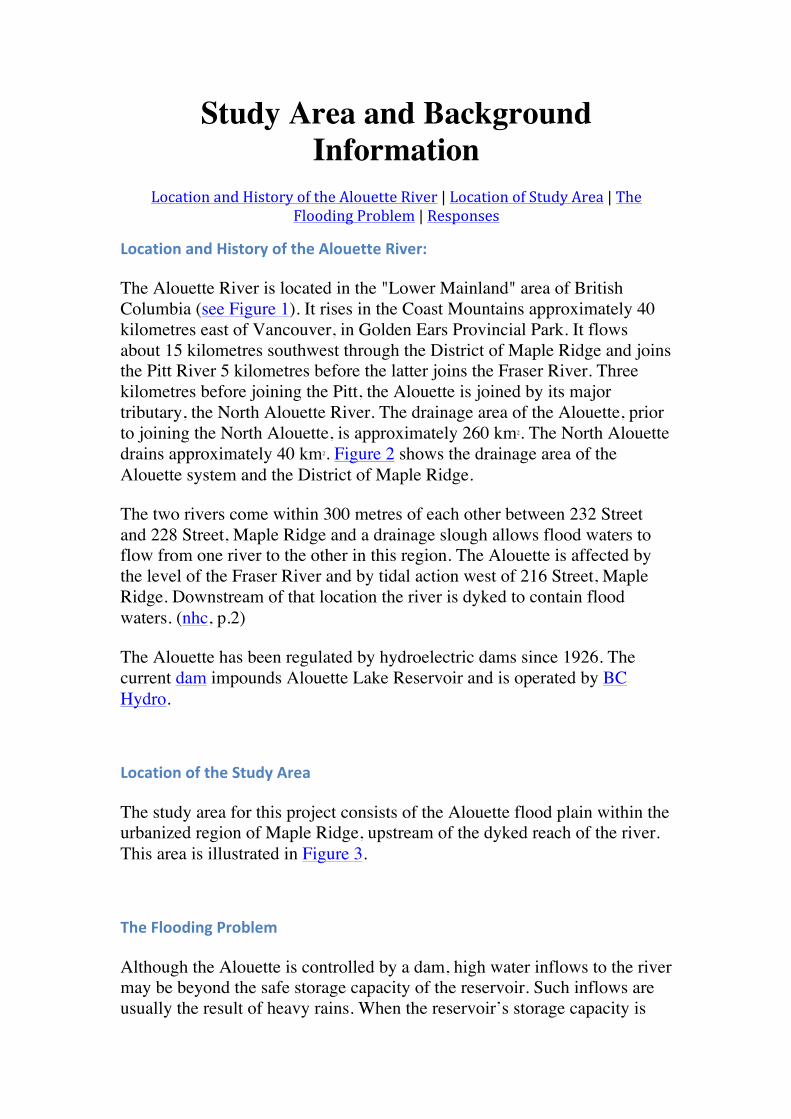
Location and History of the Alouette River:
The Alouette River is located in the "Lower Mainland" area of British Columbia (see Figure 1). It rises in the Coast Mountains approximately 40 kilometres east of Vancouver, in Golden Ears Provincial Park. It flows about 15 kilometres southwest through the District of Maple Ridge and joins the Pitt River 5 kilometres before the latter joins the Fraser River. Three kilometres before joining the Pitt, the Alouette is joined by its major tributary, the North Alouette River. The drainage area of the Alouette, prior to joining the North Alouette, is approximately 260 km2. The North Alouette drains approximately 40 km2. Figure 2 shows the drainage area of the Alouette system and the District of Maple Ridge.
The two rivers come within 300 metres of each other between 232 Street and 228 Street, Maple Ridge and a drainage slough allows flood waters to flow from one river to the other in this region. The Alouette is affected by the level of the Fraser River and by tidal action west of 216 Street, Maple Ridge. Downstream of that location the river is dyked to contain flood waters. (nhc, p.2)
The Alouette has been regulated by hydroelectric dams since 1926. The current dam impounds Alouette Lake Reservoir and is operated by BC Hydro.
Location of the Study Area
The study area for this project consists of the Alouette flood plain within the urbanized region of Maple Ridge, upstream of the dyked reach of the river. This area is illustrated in Figure 3.
The Flooding Problem
Although the Alouette is controlled by a dam, high water inflows to the river may be beyond the safe storage capacity of the reservoir. Such inflows are usually the result of heavy rains. When the reservoir’s storage capacity is
exceeded, BC Hydro must allow more water than usual to spill from the dam to protect the dam's integrity. This raises the water level in the river downstream of the dam and, if the spill is large enough, the river may overtop its banks, flooding the surrounding region. Note that downstream of the dam the water in the river is a combination of releases at the dam and runoff and direct precipitation into the river downstream of the dam.
Flow in rivers is commonly measured in units of cubic metres per second (m3/s). Ordinarily, the flow in the Alouette is about 21 m3/s. Flooding has historically occurred when flows reach about 100 m3/s. For example, the peak flows in the November, 1995 floods were estimated at 190 m3/s, of which 143 m3/s was released from the dam (nhc, p. 7). The 200-year flood on the Alouette is predicted to be 558 m3/s. The 200-year flood is the maximum flow which can be expected, on average, to occur once every 200 years (nhc, p. 8).
Responses to the Flooding Problem
Following significant floods in November, 1995, BC Hydro commissioned a study of the river hydrology. That study was conducted by northwest hydraulic consultants ltd. ("nhc") and has been referred to extensively in this project. In particular, nhc used the HEC-RAS Hydrologic modeling software to predict the extent of flooding under three representative flows: 180 m3/s, 320 m3/s, and 420 m3/s. The upper limit of 420 m3/s represents the maximum known flow prior to construction of the first dam on the Alouette in 1926. Note that it is less than the 200-year flood described above.
The flooding created by each of the three representative flows in the study area has been mapped in Figure 4, Figure 5, and Figure 6, respectively. Figure 7 is a composite of each of the flooded areas under the above flows.
Using the flooding predictions generated by nhc and BC Hydro’s own inundation maps showing the extent of flooding in the event of a breach of Alouette Dam, BC Hydro, the District of Maple Ridge, the floodplain residents, and various emergency response organizations developed a flood warning and response plan to deal with future flooding. That plan includes a telephone early warning call-out program to residents and a telephone hot-line containing prerecorded messages detailing the current state of the Alouette River. Further details of that program are available on BC Hydro’s web site.
Part of BC Hydro’s response plan is to educate floodplain residents and other interested parties about the estimated extent of flooding. This
study attempts to provide a visual description of the flooded area under the three flows described above, allowing interested parties to
determine if a particular site is prone to flooding.
Data Sources The data used in this project was obtained from the following sources:
• Mapping data, including roads and rivers but excluding the floodplain boundaries, was obtained from the Ministry of Environment, Land & Parks' TRIM data. This data is digital mapping data based upon the NAD83 datum. The underlying digital elevation model is a raster model with resolution of 50 metres per pixel.
• The floodplain boundaries were digitized from hardcopy maps prepared by nhc in February 1996. Those maps were based upon topographic maps supplied by the District of Maple Ridge (nhc, p. 12).
• The population within the floodplain boundaries was estimated using Statistics Canada data collected in the 1991 national census and available in digital form. Specifically, the data used included digitized enumeration area boundaries within the Greater Vancouver Regional District and the population within each of those enumeration areas.
• Hydrologic data was obtained from the aforementioned nhc report on the November, 1995 flooding on the Alouette, which was prepared for BC Hydro and titled "Flood Potential Downstream of Alouette Lake Dam".
Results The Flooding Maps | Estimate of Population at Risk
The Flooding Maps
The project results are illustrated in four base images which allow readers to examine the projected level of flooding in Maple Ridge resulting from three representative flows in the Alouette River. These projected levels assume that the North Alouette River is not also in flood. The four images are:
• Figure 4: Flooding Map at Flow of 180 m3/s. The area flooded at that flow is 212 hectares.
• Figure 5: Flooding Map at Flow of 320 m3/s. The area flooded at that flow is 430.25 hectares.
• Figure 6: Flooding Map at Flow of 420 m3/s. The area flooded at that flow is 463.25 hectares.
• Figure 7: Composite Map.
The images are designed to be used as follows. The reader determines which flooding level he or she is interested in and examines the appropriate image to determine approximately where the property of interest is located, using primarily the labeled major roads for guidance. By clicking on the approximate location of the property, the reader will be shown a larger, more detailed image with additional road labels which will allow him or her to better determine the risk of flooding to a particular site.
Estimate of Population at Risk
Our Idrisi calculations with Statistics Canada data indicate that the approximate number of persons living within the study area and affected by flooding is:
• At a flow of 180 m3/s: 249
• At a flow of 320 m3/s: 580
• At a flow of 420 m3/s: 732
These figures are based upon 1991 census data and have the further limitations described above under "Methodology". Nevertheless, they demonstrate that Alouette flooding may have direct impact on several hundreds of persons.
Conclusion and Possible Further Studies
This study consists of a series of interactive maps allowing residents in Maple Ridge to determine visually the predicted extent of flooding for three representative levels of flow in the Alouette River. The study also estimated the number of persons likely to be affected by flooding at each of the three levels. The project is intended to form the basis of a public information tool for use by BC Hydro to inform the public about flooding risks along the Alouette.
Further potential areas of study and improvement include:
1. Increasing the detail of the maps, particularly in terms of adding additional roads and other geographic features such as parkland to allow Maple Ridge residents to more easily locate their property.
2. Improving the prediction of persons affected by flooding by incorporating the empty land within each enumeration area and the latest 1996 census data (not available at the time of this project).
3. Adding other information of interest to the maps, such as the travel time of flood waters through the study area. This information has been determined as part of the hydrologic study of the river and would probably be of interest to the residents and may aid in refining the priorities of the telephone callout warning system.
4. Increasing the number of expanded, more detailed images to provide finer resolution and allow more and larger labels on terrain features and roads to make it easier for residents to identify expected impacts within their neighbourhoods.
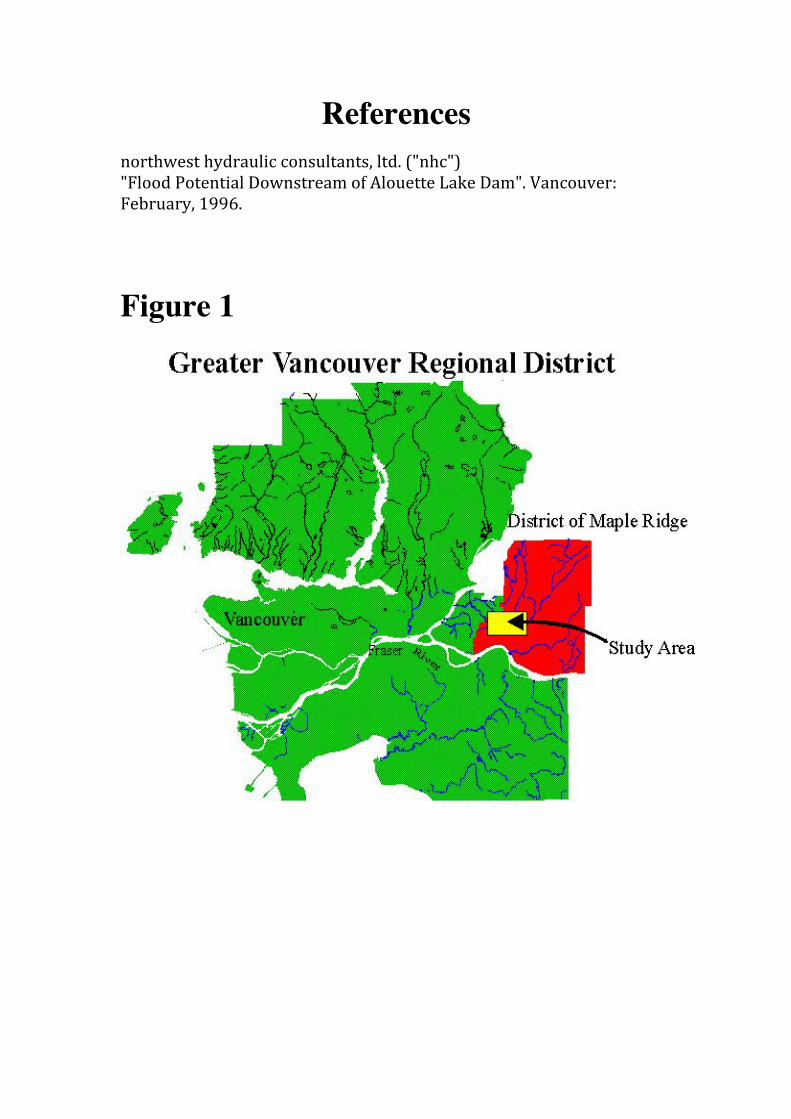
References northwest hydraulic consultants, ltd. ("nhc") "Flood Potential Downstream of Alouette Lake Dam". Vancouver: February, 1996.
Figure 1
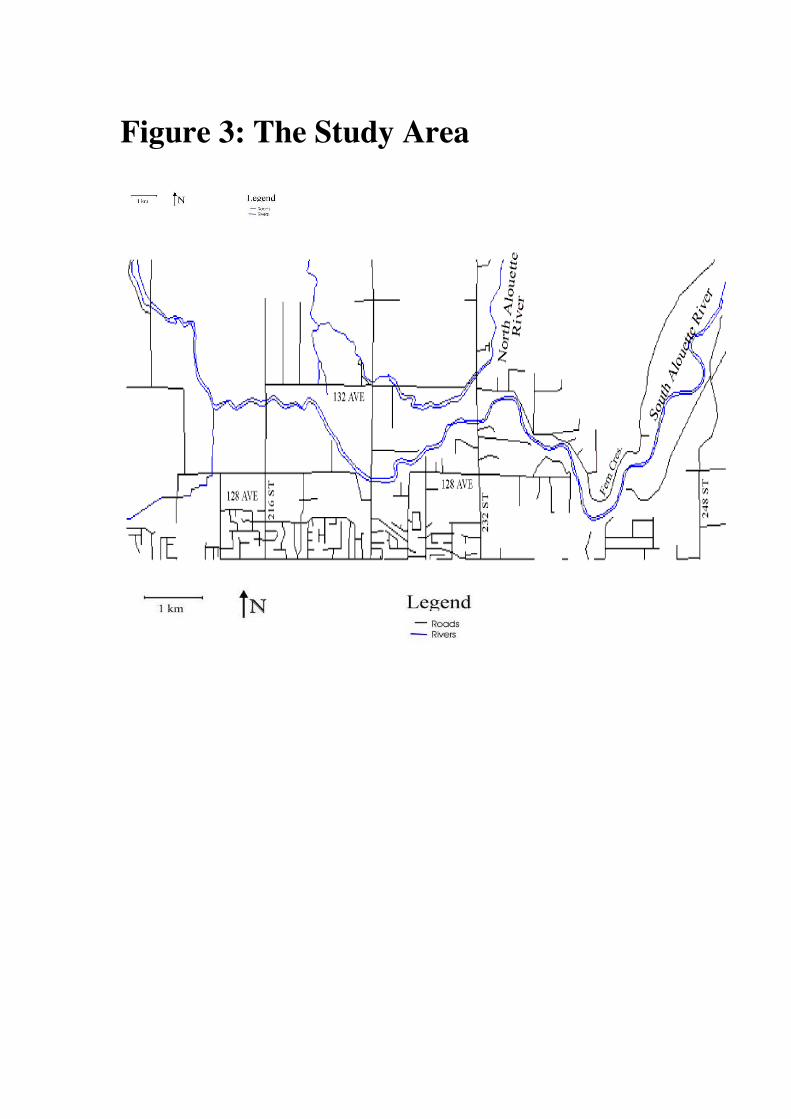
Figure 3: The Study Area
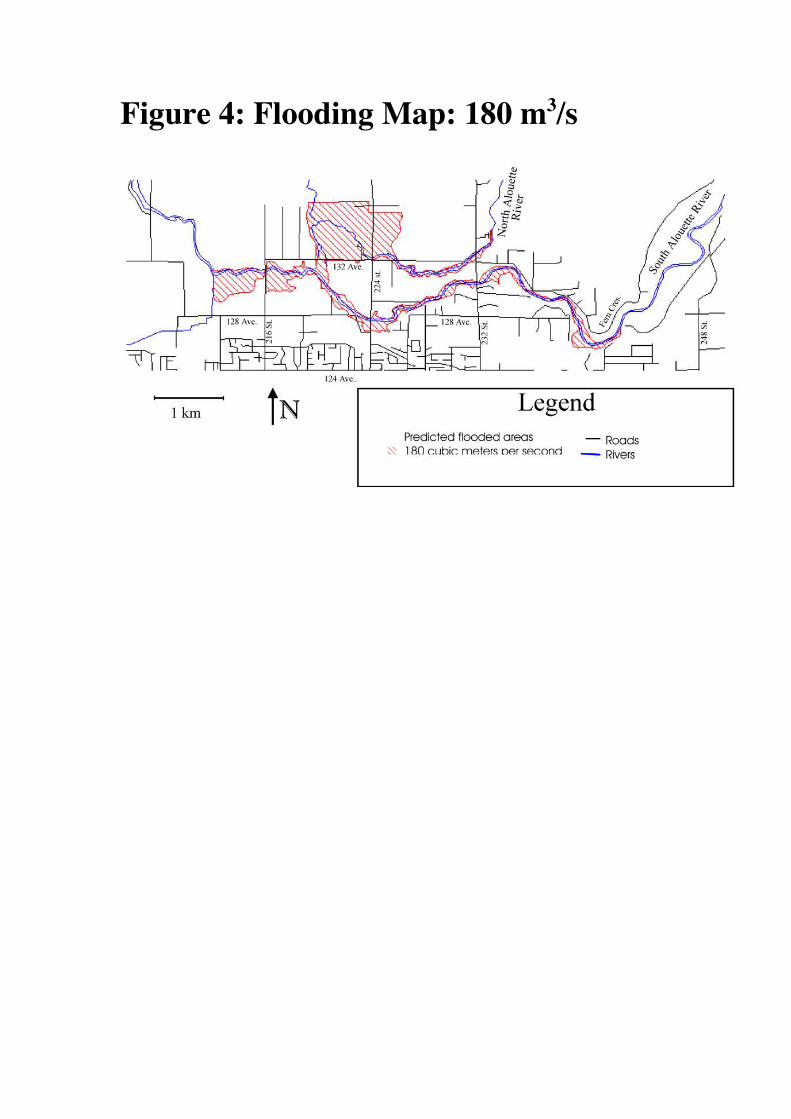
Figure 4: Flooding Map: 180 m3/s
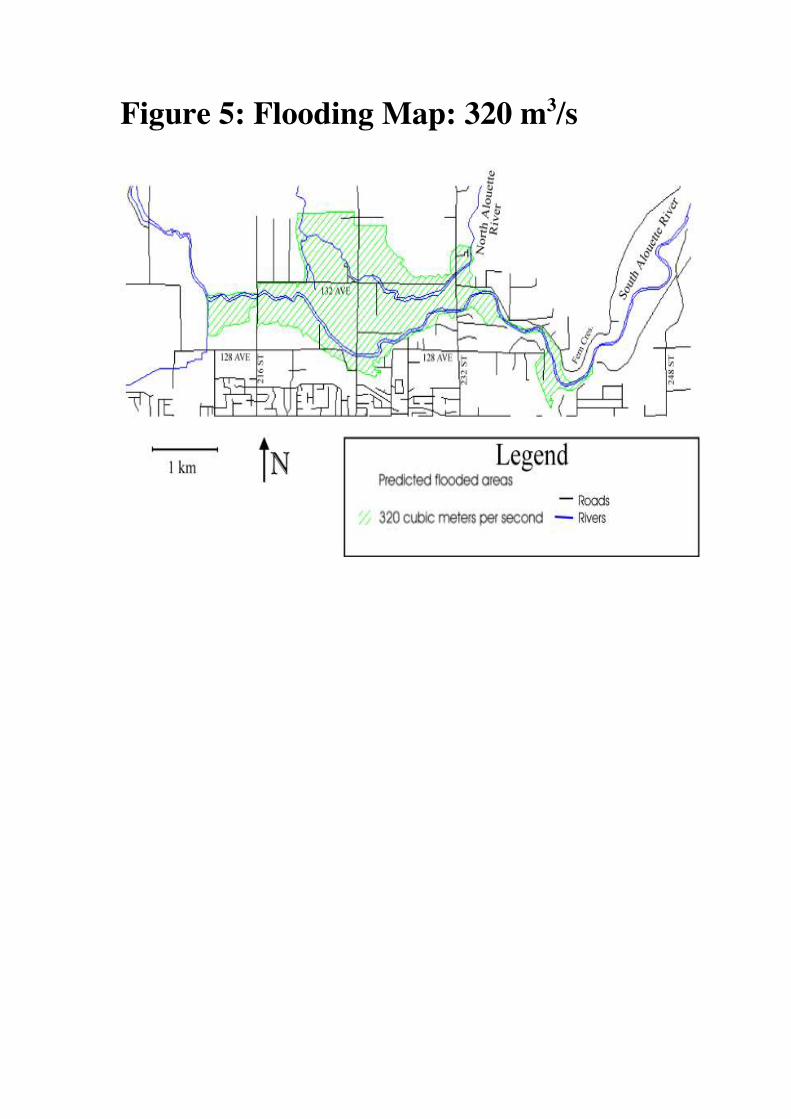
Figure 5: Flooding Map: 320 m3/s
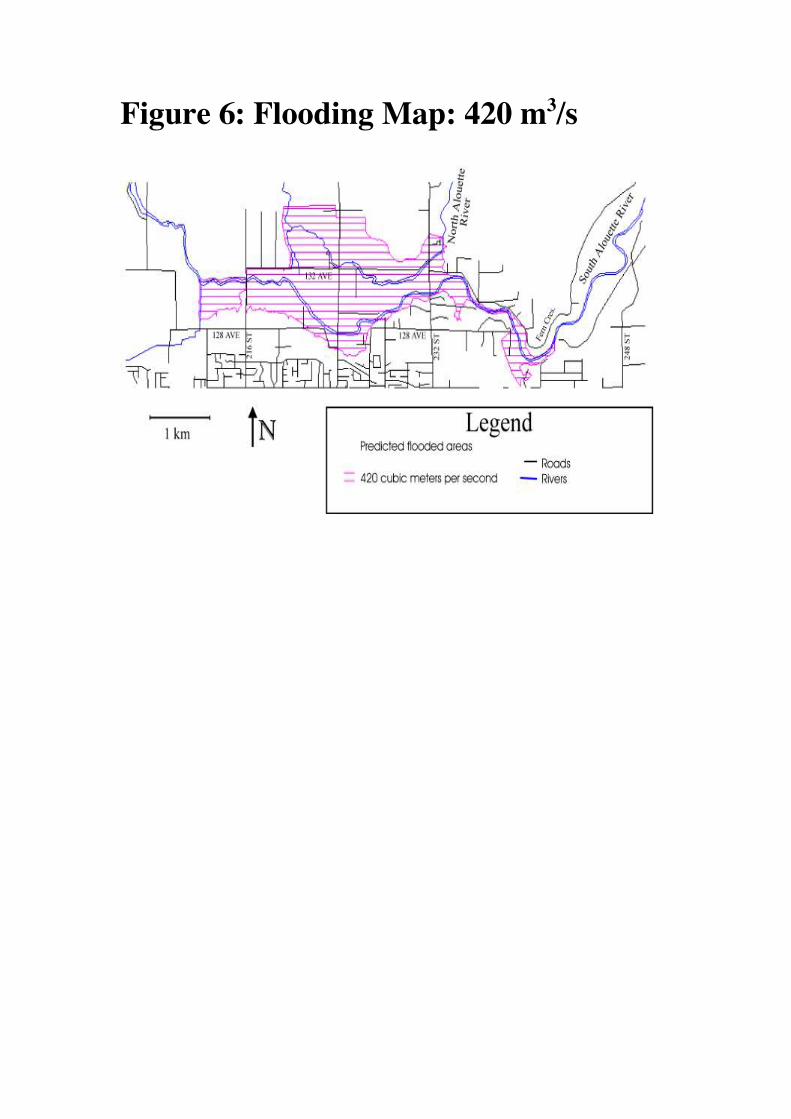
Figure 6: Flooding Map: 420 m3/s
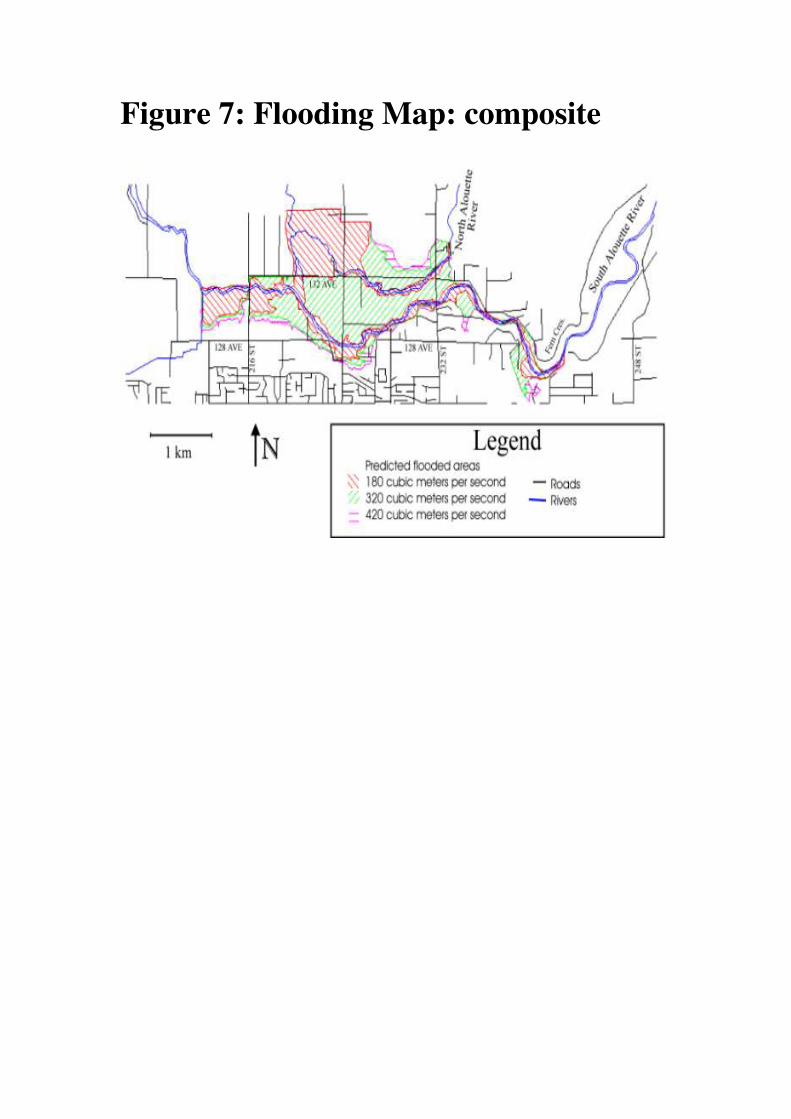
Figure 7: Flooding Map: composite
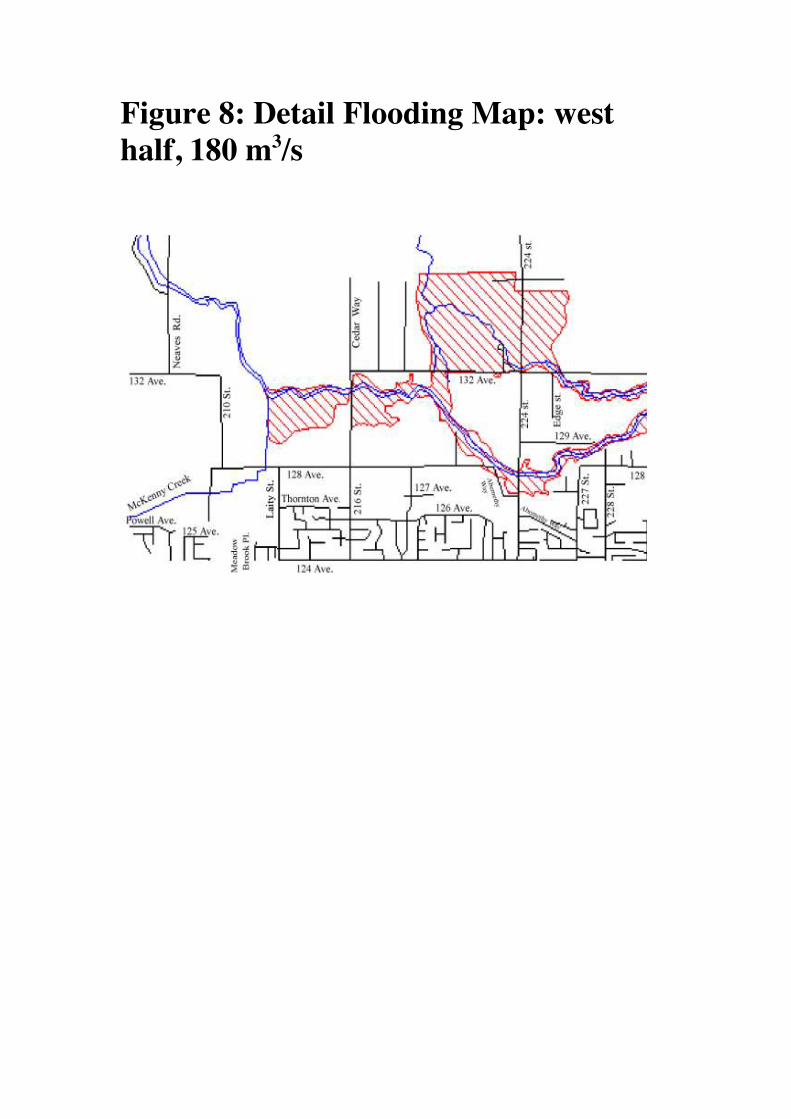
Figure 8: Detail Flooding Map: west half, 180 m3/s
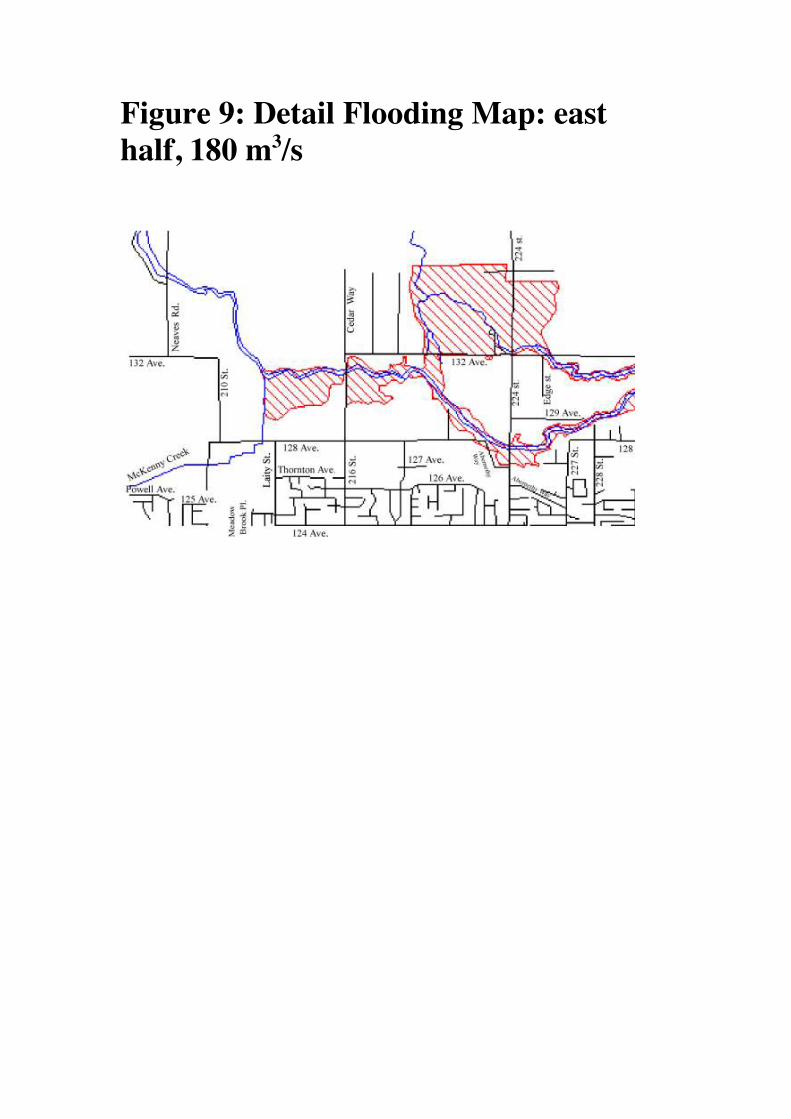
Figure 9: Detail Flooding Map: east half, 180 m3/s
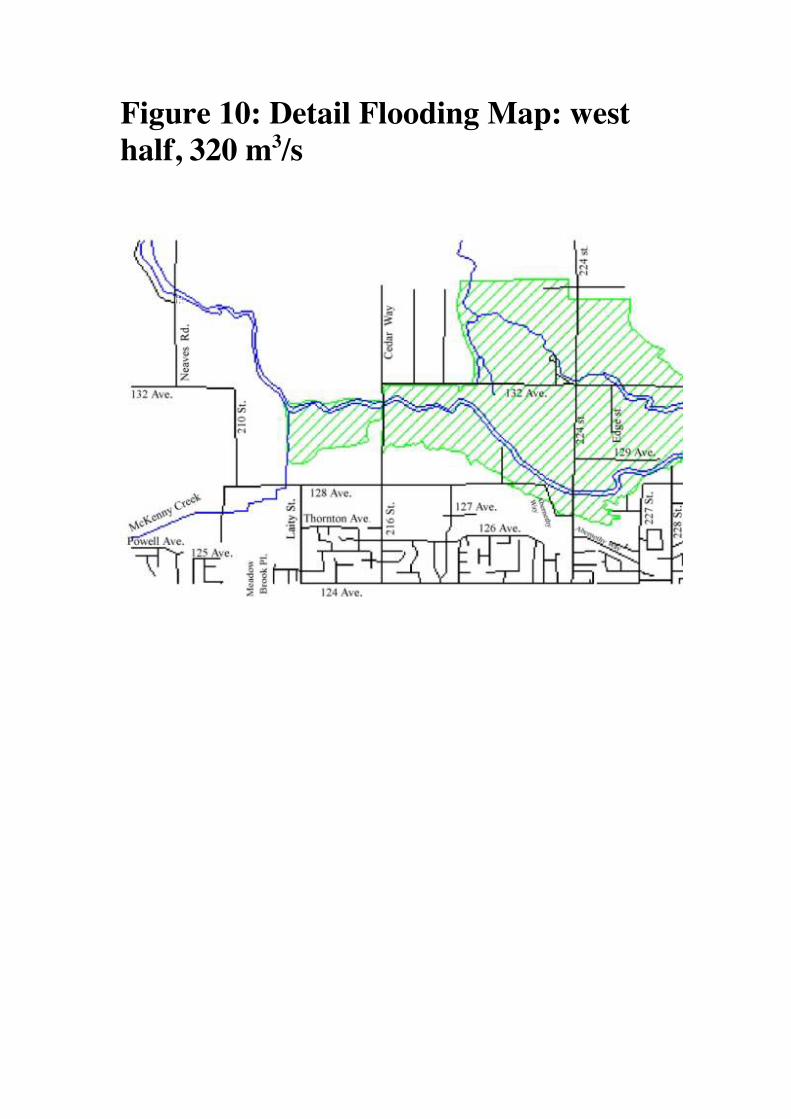
Figure 10: Detail Flooding Map: west half, 320 m3/s
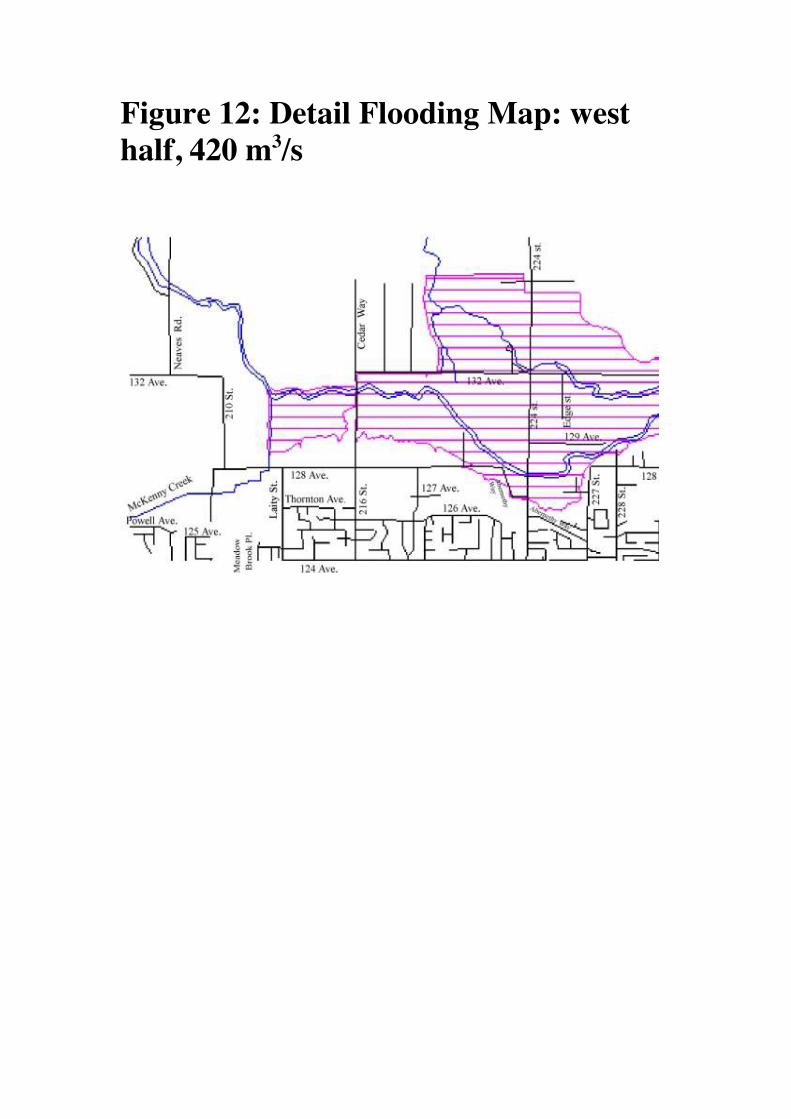
Figure 12: Detail Flooding Map: west half, 420 m3/s
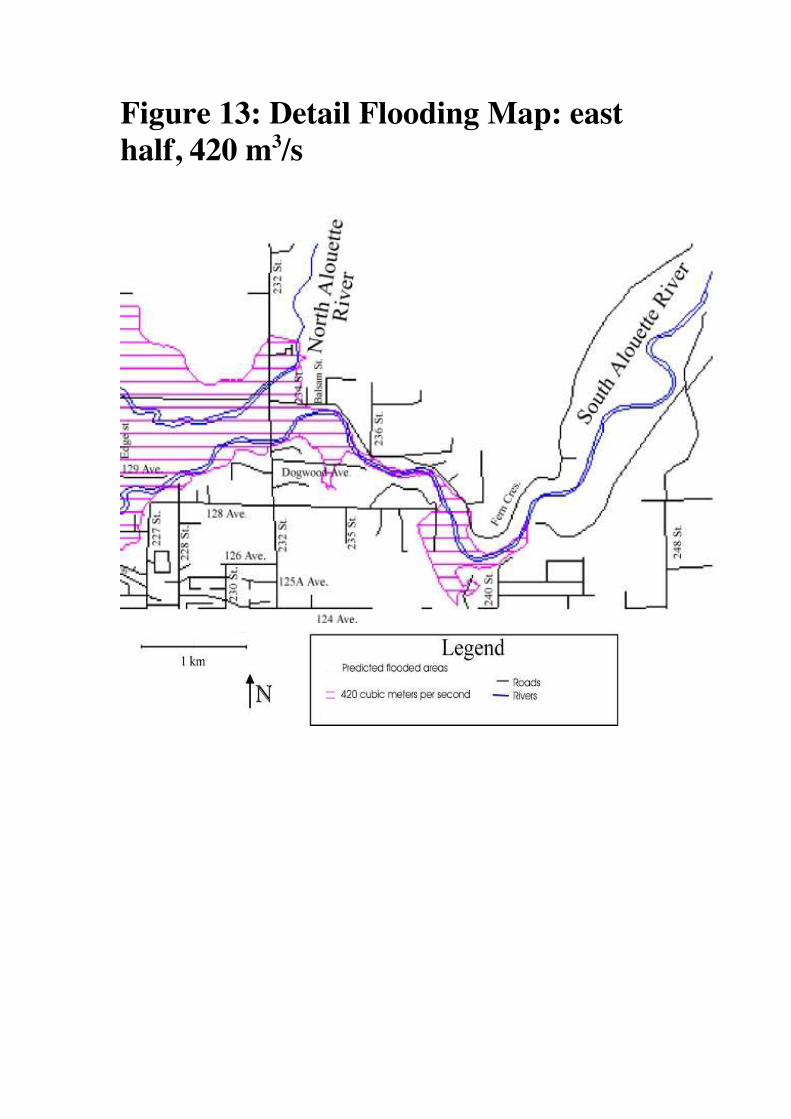
Figure 13: Detail Flooding Map: east half, 420 m3/s
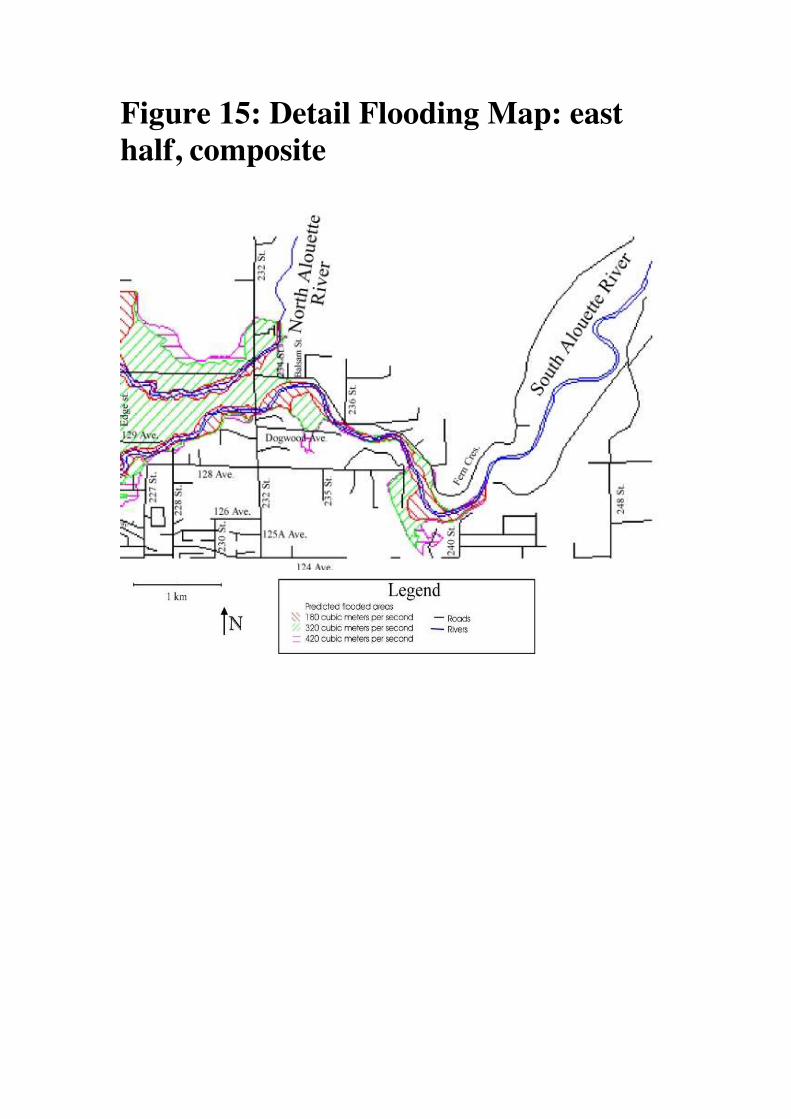
Figure 15: Detail Flooding Map: east half, composite