
an Ebiquity company
Interim Presentation
Six Months to October 2008

2
A company newly positioned to meet the needs of a new age
Welcome to Ebiquity!
1. A new name signals our commitment to data analytics2. A new on-line interface that brings our technology tools and services together into one powerful
program3. An upgraded advertising monitoring service - Billetts Media Monitoring4. A new ‘state of the art’ editorial monitoring service - Newslive 2.05. A unique go to market strategy ‘Marketing Investment Management’ that combines the strength of
our analytics business with the power of our database
Our strategic goals have been met:

3
The CEO perspective
A view from the Boardroom
“Marketing, once seen as an expensive luxury, must now become a hygiene factor
for my organisation
The Marketing Director waxes lyrical about the intangible asset of the brand…but we
all have to clearly demonstrate what that investment produces in terms of building
value in the business.
Marketing have constantly hidden behind a fog of measures that are based purely on
tactical marketing activity, rather than solid financial metrics..
Our focus must be to develop a standard set of auditable metrics that both the
Marketing Director and I understand. Without these, Marketing should realise that I
will continue to challenge their budgets”
‘Marketing in 3D’ - Deloitte

4
A view from the agencies
Looking into the future
"Clients won't move in the future unless they get quantitative justification for what they do. We may not like it - creative departments of ad agencies certainly
don't - but that's the way the world's going."
Martin Sorrell

5
Perfectly positioned to help companies address the challenges of the new communications landscape

6
...a very different recession with a mountain of debt
Challenge 1

7
Dynamic and complex media landscapeChallenge 2
Consumers and their journeys have become more complex and less stereotyped Marketing and media planning has been slow to change
8
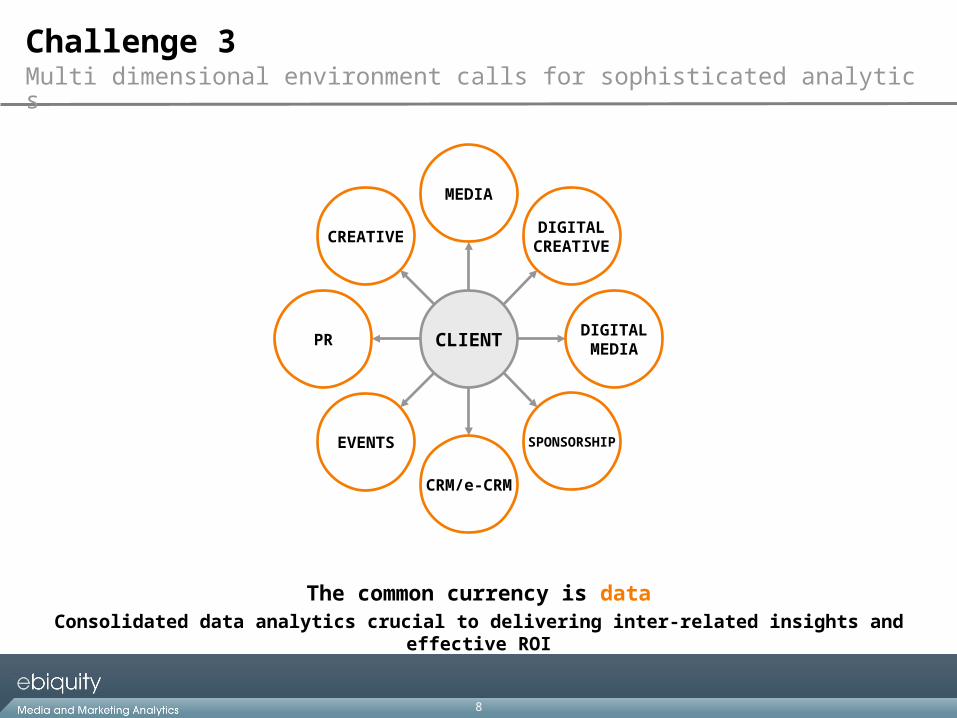
Multi dimensional environment calls for sophisticated analytics
The common currency is dataConsolidated data analytics crucial to delivering inter-related insights and effective ROI
Challenge 3
CREATIVE
PR
EVENTS
CRM/e-CRM
SPONSORSHIP
DIGITALMEDIA
DIGITALCREATIVE
MEDIA
CLIENT

9
How can I deliver more for less?
ROI just became a lot tougherEnsuring that every last penny is maximised is a pre-requisite
Challenge 4
10
Change sub heading - via *View* / HEADER & FOOTER
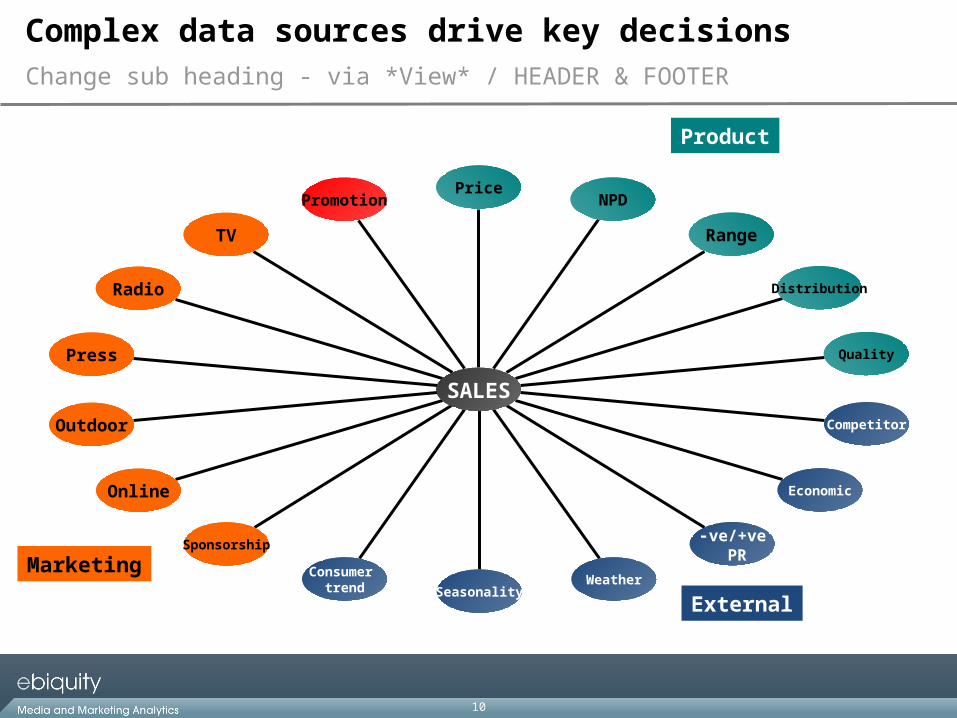
Promotion
TV
Radio
Press
Outdoor
Online
Sponsorship
Consumer trend Seasonality
Weather
-ve/+ve PR
Economic
Competitor
Quality
Distribution
Range
NPDPrice
SALES
Product
Marketing
External
Complex data sources drive key decisions
11
Change sub heading - via *View* / HEADER & FOOTER
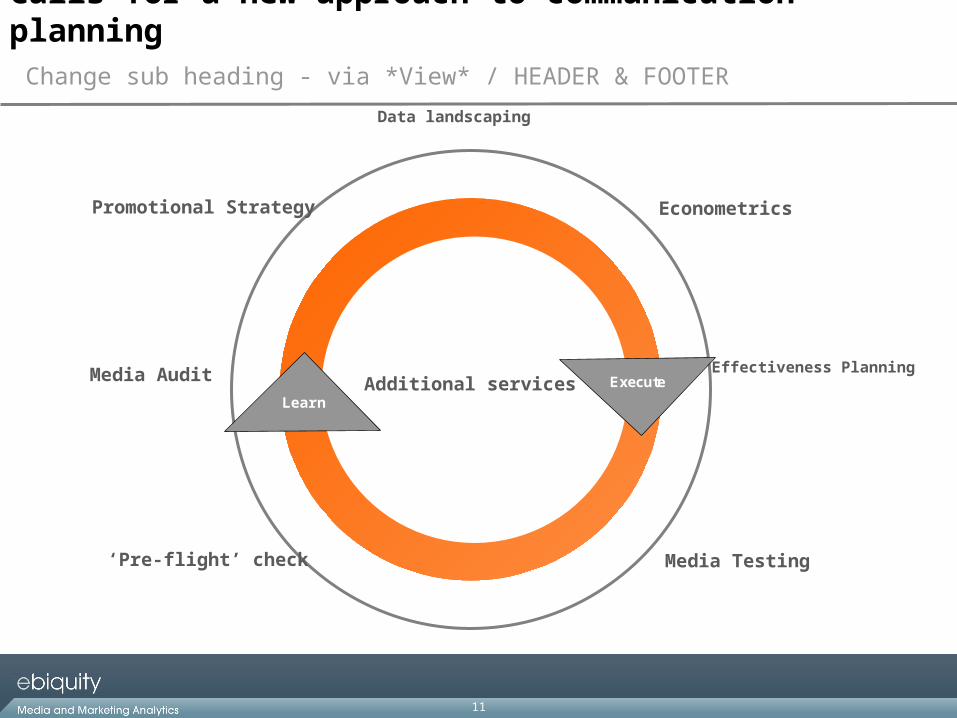
Data landscaping
Calls for a new approach to communication planning
Econometrics
Effectiveness Planning
Media Testing‘Pre-flight’ check
Media Audit
LearnExecute
Promotional Strategy
LearnAdditional services
12
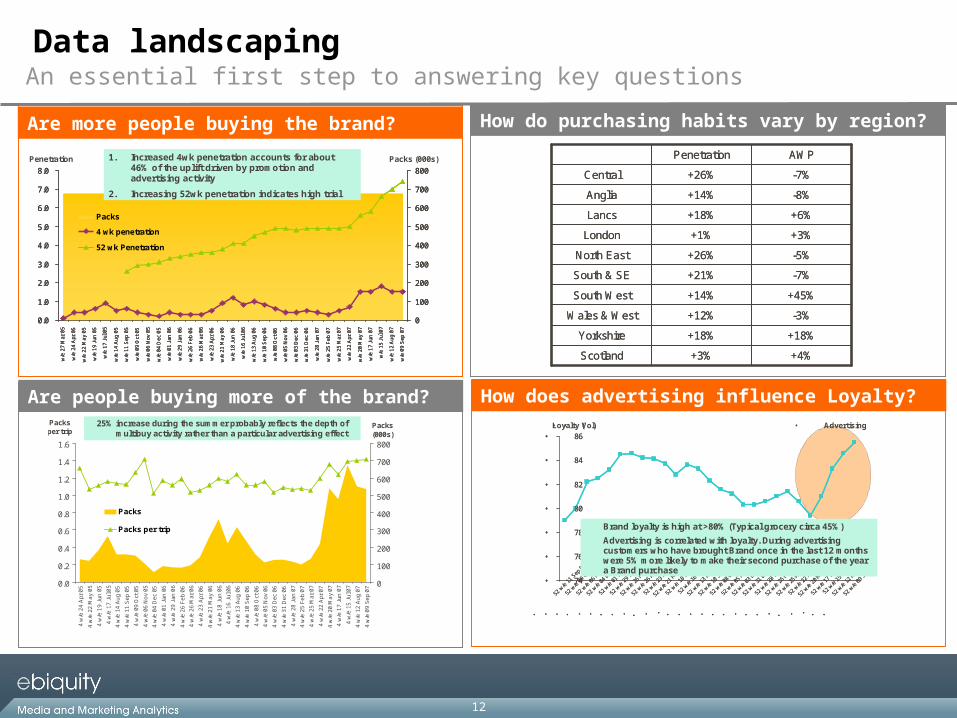
An essential first step to answering key questions
©copyright billetts 2008
0.0
1.0
2.0
3.0
4.0
5.0
6.0
7.0
8.0
w/e
27
Mar
05
w/e
24
Apr
05
w/e
22
Ma
y 0
5
w/e
19
Jun
05
w/e
17
Jul
05
w/e
14
Au
g 0
5
w/e
11
Sep
05
w/e
09
Oct
05
w/e
06
No
v 0
5
w/e
04
Dec
05
w/e
01
Jan
06
w/e
29
Jan
06
w/e
26
Feb
06
w/e
26
Mar
06
w/e
23
Apr
06
w/e
21
Ma
y 0
6
w/e
18
Jun
06
w/e
16
Jul
06
w/e
13
Au
g 0
6
w/e
10
Sep
06
w/e
08
Oct
06
w/e
05
No
v 0
6
w/e
03
Dec
06
w/e
31
Dec
06
w/e
28
Jan
07
w/e
25
Feb
07
w/e
25
Mar
07
w/e
22
Apr
07
w/e
20
Ma
y 0
7
w/e
17
Jun
07
w/e
15
Jul
07
w/e
12
Au
g 0
7
w/e
09
Sep
07
0
100
200
300
400
500
600
700
800
Packs
4 wk penetration
52 wk Penetration
Penetration Packs (000s)1. Increased 4wk penetration accounts for about 46% of the uplift driven by promotion and advertising activity
2. Increasing 52wk penetration indicates high trial
©copyright billetts 2008
0.0
1.0
2.0
3.0
4.0
5.0
6.0
7.0
8.0
w/e
27
Mar
05
w/e
24
Apr
05
w/e
22
Ma
y 0
5
w/e
19
Jun
05
w/e
17
Jul
05
w/e
14
Au
g 0
5
w/e
11
Sep
05
w/e
09
Oct
05
w/e
06
No
v 0
5
w/e
04
Dec
05
w/e
01
Jan
06
w/e
29
Jan
06
w/e
26
Feb
06
w/e
26
Mar
06
w/e
23
Apr
06
w/e
21
Ma
y 0
6
w/e
18
Jun
06
w/e
16
Jul
06
w/e
13
Au
g 0
6
w/e
10
Sep
06
w/e
08
Oct
06
w/e
05
No
v 0
6
w/e
03
Dec
06
w/e
31
Dec
06
w/e
28
Jan
07
w/e
25
Feb
07
w/e
25
Mar
07
w/e
22
Apr
07
w/e
20
Ma
y 0
7
w/e
17
Jun
07
w/e
15
Jul
07
w/e
12
Au
g 0
7
w/e
09
Sep
07
0
100
200
300
400
500
600
700
800
Packs
4 wk penetration
52 wk Penetration
0.0
1.0
2.0
3.0
4.0
5.0
6.0
7.0
8.0
w/e
27
Mar
05
w/e
24
Apr
05
w/e
22
Ma
y 0
5
w/e
19
Jun
05
w/e
17
Jul
05
w/e
14
Au
g 0
5
w/e
11
Sep
05
w/e
09
Oct
05
w/e
06
No
v 0
5
w/e
04
Dec
05
w/e
01
Jan
06
w/e
29
Jan
06
w/e
26
Feb
06
w/e
26
Mar
06
w/e
23
Apr
06
w/e
21
Ma
y 0
6
w/e
18
Jun
06
w/e
16
Jul
06
w/e
13
Au
g 0
6
w/e
10
Sep
06
w/e
08
Oct
06
w/e
05
No
v 0
6
w/e
03
Dec
06
w/e
31
Dec
06
w/e
28
Jan
07
w/e
25
Feb
07
w/e
25
Mar
07
w/e
22
Apr
07
w/e
20
Ma
y 0
7
w/e
17
Jun
07
w/e
15
Jul
07
w/e
12
Au
g 0
7
w/e
09
Sep
07
0
100
200
300
400
500
600
700
800
Packs
4 wk penetration
52 wk Penetration
Penetration Packs (000s)1. Increased 4wk penetration accounts for about 46% of the uplift driven by promotion and advertising activity
2. Increasing 52wk penetration indicates high trial
Are more people buying the brand? How do purchasing habits vary by region?
Are people buying more of the brand? How does advertising influence Loyalty?
Data landscaping
©copyright billetts 2008
4 wk packs per trip – Total market
0.0
0.2
0.4
0.6
0.8
1.0
1.2
1.4
1.6
4 w
/e 2
4 A
pr
05
4 w
/e 2
2 M
ay 0
5
4 w
/e 1
9 Ju
n 0
5
4 w
/e 1
7 Ju
l 05
4 w
/e 1
4 A
ug
05
4 w
/e 1
1 S
ep 0
5
4 w
/e 0
9 O
ct 0
5
4 w
/e 0
6 N
ov
05
4 w
/e 0
4 D
ec
05
4 w
/e 0
1 Ja
n 0
6
4 w
/e 2
9 J
an
06
4 w
/e 2
6 F
eb
06
4 w
/e 2
6 M
ar 0
6
4 w
/e 2
3 A
pr 0
6
4 w
/e 2
1 M
ay 0
6
4 w
/e 1
8 J
un
06
4 w
/e 1
6 J
ul 0
6
4 w
/e 1
3 A
ug
06
4 w
/e 1
0 S
ep 0
6
4 w
/e 0
8 O
ct 0
6
4 w
/e 0
5 N
ov
06
4 w
/e 0
3 D
ec
06
4 w
/e 3
1 D
ec
06
4 w
/e 2
8 Ja
n 0
7
4 w
/e 2
5 F
eb
07
4 w
/e 2
5 M
ar
07
4 w
/e 2
2 A
pr
07
4 w
/e 2
0 M
ay
07
4 w
/e 1
7 J
un
07
4 w
/e 1
5 Ju
l 07
4 w
/e 1
2 A
ug 0
7
4 w
/e 0
9 S
ep
07
0
100
200
300
400
500
600
700
800
Packs
Packs per trip
Packs per trip
25% increase during the summer probably reflects the depth of multibuy activity rather than a particular advertising effect
Packs (000s)
+45%+14%South West
-7%+21%South & SE
-5%+26%North East
+3%+1%London
+6%+18%Lancs
-8%+14%Anglia
-3%+12%Wales & West
-7%+26%Central
+4%+3%Scotland
+18%+18%Yorkshire
AWPPenetration
+45%+14%South West
-7%+21%South & SE
-5%+26%North East
+3%+1%London
+6%+18%Lancs
-8%+14%Anglia
-3%+12%Wales & West
-7%+26%Central
+4%+3%Scotland
+18%+18%Yorkshire
AWPPenetration
• ©• copyright billetts 2008
• 74
• 76
• 78
• 80
• 82
• 84
• 86
•
52 w
/e11
Sep
05
•
52 w
/e09
Oct
05
•
52 w
/e06
Nov
05
•
52 w
/e04
Dec
05
•
52 w
/e01
Jan
06
•
52 w
/e29
Jan
06
•
52 w
/e26
Feb
06
•
52 w
/e26
Mar
06
•
52 w
/e23
Apr
06
•
52 w
/e21
May
06
•
52 w
/e18
Jun
06
•
52 w
/e16
Jul 0
6
•
52 w
/e13
Aug
06
•
52 w
/e10
Sep
06
•
52 w
/e08
Oct
06
•
52 w
/e05
Nov
06
•
52 w
/e03
Dec
06
•
52 w
/e31
Dec
06
•
52 w
/e28
Jan
07
•
52 w
/e25
Feb
07
•
52 w
/e25
Mar
07
•
52 w
/e22
Apr
07
•
52 w
/e20
May
07
•
52 w
/e17
Jun
07
•
52 w
/e15
Jul 0
7
•
52 w
/e12
Aug
07
•
52 w
/e09
Sep
07
• Loyalty (• Vol• )
Brand loyalty is high at >80% (Typical grocery circa 45%)
Advertising is correlated with loyalty. During advertising customers who have brought Brand once in the last 12 months were 5% more likely to make their second purchase of the year a Brand purchase
• Advertising
• ©• copyright billetts 2008
• 74
• 76
• 78
• 80
• 82
• 84
• 86
•
52 w
/e11
Sep
05
•
52 w
/e09
Oct
05
•
52 w
/e06
Nov
05
•
52 w
/e04
Dec
05
•
52 w
/e01
Jan
06
•
52 w
/e29
Jan
06
•
52 w
/e26
Feb
06
•
52 w
/e26
Mar
06
•
52 w
/e23
Apr
06
•
52 w
/e21
May
06
•
52 w
/e18
Jun
06
•
52 w
/e16
Jul 0
6
•
52 w
/e13
Aug
06
•
52 w
/e10
Sep
06
•
52 w
/e08
Oct
06
•
52 w
/e05
Nov
06
•
52 w
/e03
Dec
06
•
52 w
/e31
Dec
06
•
52 w
/e28
Jan
07
•
52 w
/e25
Feb
07
•
52 w
/e25
Mar
07
•
52 w
/e22
Apr
07
•
52 w
/e20
May
07
•
52 w
/e17
Jun
07
•
52 w
/e15
Jul 0
7
•
52 w
/e12
Aug
07
•
52 w
/e09
Sep
07
• Loyalty (• Vol• )
Brand loyalty is high at >80% (Typical grocery circa 45%)
Advertising is correlated with loyalty. During advertising customers who have brought Brand once in the last 12 months were 5% more likely to make their second purchase of the year a Brand purchase
• Advertising

13
Proprietory tools to support better decision makingOnline tools

14
LOWER QUALITY HIGHER QUALITYNORM
Track your own - and competitors’ - activity in real-time
Online toolsBilletts Media Monitoring

15
Desktop access to international results all in one placeDashboard delivery
16
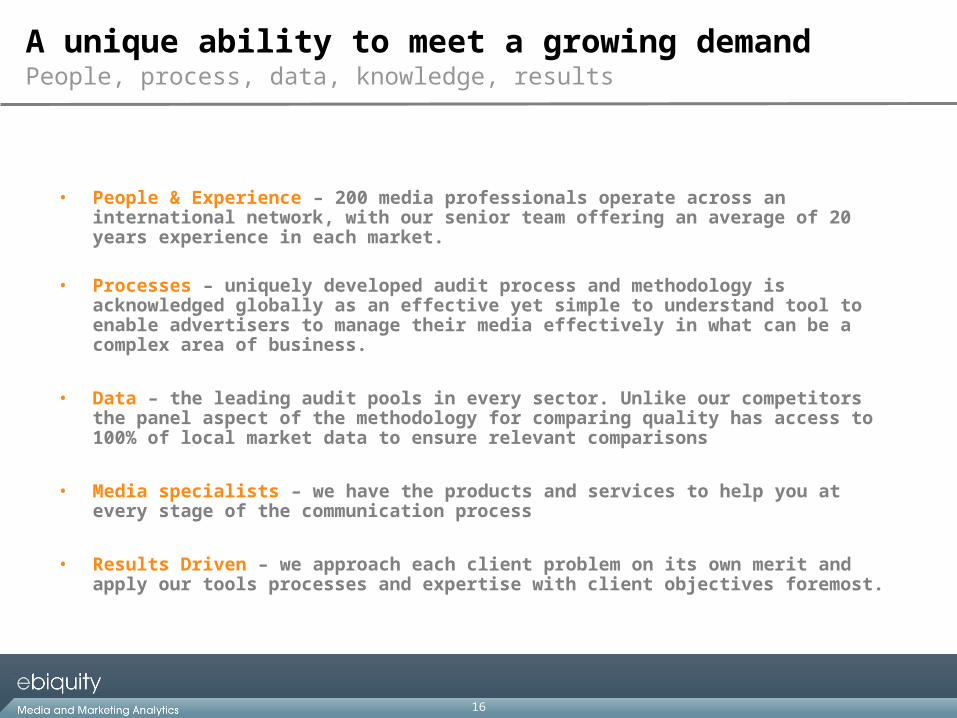
People, process, data, knowledge, results
• People & Experience – 200 media professionals operate across an international network, with our senior team offering an average of 20 years experience in each market.
• Processes – uniquely developed audit process and methodology is acknowledged globally as an effective yet simple to understand tool to enable advertisers to manage their media effectively in what can be a complex area of business.
• Data – the leading audit pools in every sector. Unlike our competitors the panel aspect of the methodology for comparing quality has access to 100% of local market data to ensure relevant comparisons
• Media specialists – we have the products and services to help you at every stage of the communication process
• Results Driven – we approach each client problem on its own merit and apply our tools processes and expertise with client objectives foremost.
A unique ability to meet a growing demand

an Ebiquity company
The story so far…..

18
Two complementary divisions
What we do
Analytics Division
Platform Division
•Media Auditing and Optimisation•Marketing Effectiveness
•Ad Monitoring•News Monitoring•Publisher Services

19
...but weak economy has a silver lining!
A story of two parts
Analytics Division
Platform Division
Strong growth in a market in which ROI and value are‘mission critical’
Weaker sales from those companiesfor whom Ad Monitoring is not ‘mission critical’. Newslive is work in progress but early signs are promising

20
Strong growth with limited competition
Analytics Division
• Billetts ‘Marketing Investment Management’ provides ‘best practice’ approach to media and marketing investment
• Billetts name - strongest sector specialist
• Largest media data base with proprietary analytics
• Continuing significant growth from international companies
• Limited competition
• US office growing in strength and reputation
• Germany, Spain and Nordics will strengthen international offering
21
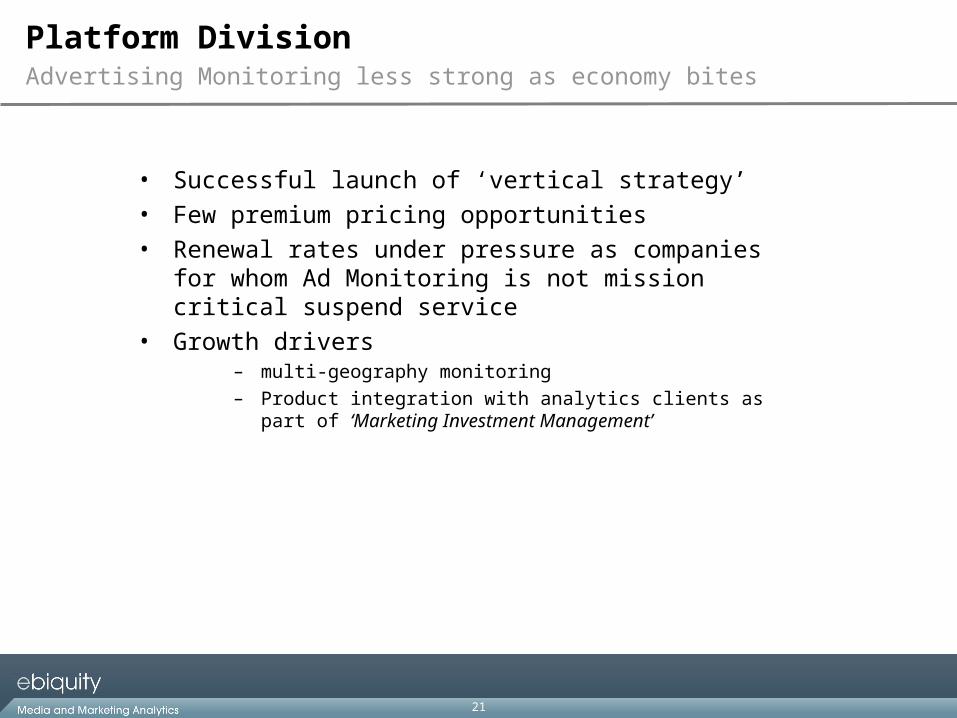
Advertising Monitoring less strong as economy bites
Platform Division
• Successful launch of ‘vertical strategy’
• Few premium pricing opportunities
• Renewal rates under pressure as companies for whom Ad Monitoring is not mission critical suspend service
• Growth drivers – multi-geography monitoring– Product integration with analytics clients as part of ‘Marketing
Investment Management’

22
Newslive - work in progress but good start
Platform Division
• Weak economy means reputation monitoring increasingly mission critical
• But more price competitive than before
• Successful launch of ‘best in class’ platform - September
• Trials phase successfully completed
• Loss making in 2008/9
• Full impact in 2009/10

23
Six months to October 2008
Financials
Financial Summary

24
Change sub heading - via *View* / HEADER & FOOTER
Revenue
Oct 08 Oct 07 YOY Apr 08
All numbers in £’000s 6m 6m % 12m
Analytics 5,717 5,467 5% 11,310
Platform 2,875 2,935 (2%) 5,910
Total 8,592 8,402 2% 17,220

25
Change sub heading - via *View* / HEADER & FOOTER
Gross Margin
Oct 08 Oct 07 YOY Apr 08
6m 6m % 12m
Gross profit
Analytics 2,892 2,646 9% 5,541
Platform 1,520 1,738 (13%) 3,418
Total 4,412 4,384 1% 8,959
Gross margin
Analytics 51% 48% 6% 49%
Platform 53% 59% (10%) 58%
Total 51% 52% (2%) 52%

26
Change sub heading - via *View* / HEADER & FOOTER
Underlying Operating Profit
Oct 08 Oct 07 YOY Apr 08
6m 6m % 12m
Analytics 1,204 836 44% 1,857
Platform (228) 295 (177%) 419
Central (55) (69) (20%) (259)
Underlying operating profit 921 1,063 (13%) 2,017
Highlighted items - non cash (333) (1,690) 83% (1,835)
- cash (161) (463) 65% (1,305)
Reporting operating profit 427 (1,090) 139% (1,123)
27
Change sub heading - via *View* / HEADER & FOOTER
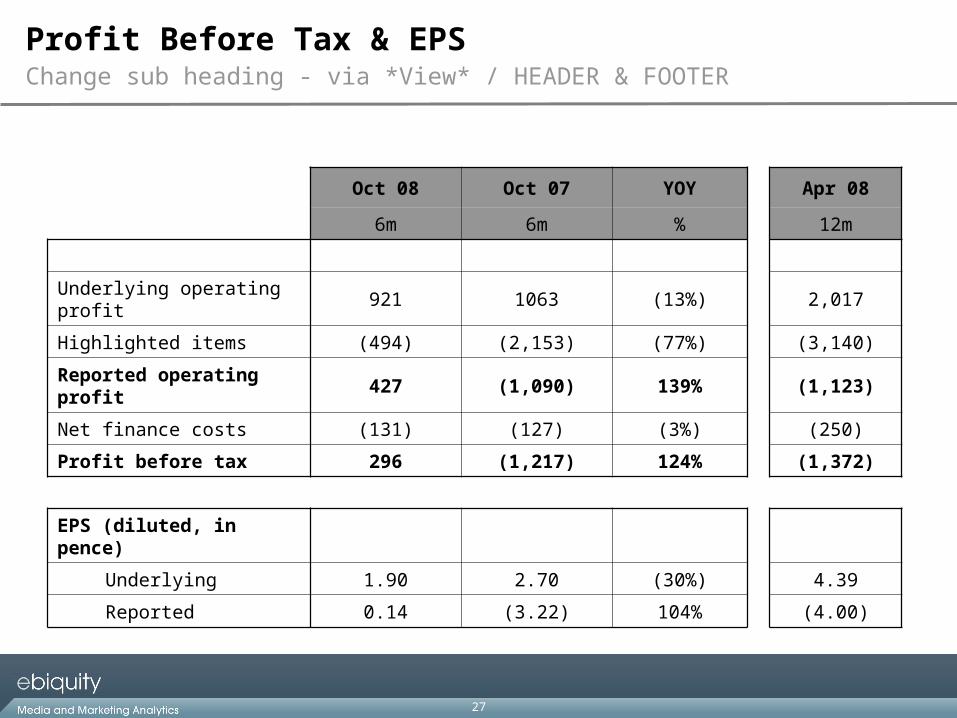
Profit Before Tax & EPS
Oct 08 Oct 07 YOY Apr 08
6m 6m % 12m
Underlying operating profit 921 1063 (13%) 2,017
Highlighted items (494) (2,153) (77%) (3,140)
Reported operating profit 427 (1,090) 139% (1,123)
Net finance costs (131) (127) (3%) (250)
Profit before tax 296 (1,217) 124% (1,372)
EPS (diluted, in pence)
Underlying 1.90 2.70 (30%) 4.39
Reported 0.14 (3.22) 104% (4.00)

28
Change sub heading - via *View* / HEADER & FOOTER
Net Debt
Oct 08 Oct 07 Apr 08
Cash 1,277 1,286 1,687
Gross debt 4,000 4,038 3,751
Net debt 2,723 2,752 2,064
Unutilised cash facility 1,000 4,100 4,100

29
A unique offering in a growing market
Outlook
• Media and Marketing analytics key driver of growth
• International growth likely to continue to accelerate with strong pipeline
• Advertising Monitoring likely to continue to show some weakness
• Growing impact of Newslive as revenues begin to scale although loss making in year one
• Continue to be confident that the Company is well positioned for future growth

30
The Future Looks Bright
• We help our clients to save money, make them more efficient and help them to make better informed decisions
• Our services are even more valid during economic uncertainty
• We see big international opportunities with limited credible competition
• We are at the beginning of our journey – our strategy is set, and we have delivered our promises
• We are conservatively financed
• We control our costs tightly
• We are in a position to look at well priced acquisition opportunities

an Ebiquity company
The Registry
Royal Mint Court
London
EC3N 4QN
Tel. +44 (0) 20 7650 9600
Fax. +44 (0) 20 7650 9650
www.ebiquity.com

an Ebiquity company
Financial Appendices

33
Highlighted items
Oct 08 Oct 07 Apr 08
6m 6m 12m
Recurring
Share based expenses 152 45 99
Amortisation of purchased intangibles 181 188 369
333 233 468
Non recurring
Write down of development asset - 1,457 1,457
Property costs - 246 458
Management restructuring 161 127 521
Other - 90 236
161 1,920 2,672
Total 494 2,153 3,140

34
Balance sheet
Oct 08 Oct 07 Apr 08
Non current assets 13,841 13,284 13,606
Current assets Trade debtors 3,194 3,496 3,052
Accrued income 2,083 1,698 1,904
Cash 1,277 1,286 1,687
Other 853 466 797
7,407 6,946 7,440
Current liabilities Loans 2,400 2,038 1,951
Deferred income 2,927 2,562 2,830
Other 4,400 3,375 4,528
9,727 7,975 9,309
Non current liabilities Loans 1,600 2,000 1,800
Deferred tax 615 720 667
Other 39 124 65
2,254 2,844 2,532
Net assets 9,267 9,411 9,205

35
Cashflow
Oct 08 Oct 07
6m 6m
Cash generated from operations 376 430
Finance expense (147) (164)
Income taxes paid (118) 167
Net cash from operating activities 111 433
Investing activities
Purchase of PPE (341) (140)
Capitalised development costs (454) (211)
Finance income 16 30
(779) (321)
Financing activities
New borrowings 500 62
Loan repayments (251) (1,019)
249 (957)
Net decrease in cash (419) (845)


