
22
Analyst Meeting2020 Results23 February 2021Ticker: BCPG (SET)


Capturing Thailand Opportunities in midst of COVID-19
Accelerate construction progress of Japan Solar Power Plants in midst of COVID-19
Successful Bond Issuance of USD 1.1 bn to refinance existing loan of Salak-Darajat power plants
PH Tariff Escalation in place granted retroactive adjustment and annual rebase
Successful Capital Raising of THB 10,235 mn
Continuing Asset Optimization
BCPG’s Regional Plan
Acquired Nam San 3B, adding hydro power portfolio to 114 MW
Secured higher tariff with EVN (Vietnam) for 2 hydro power plants
Co-invested 79 km Transmission line from Nam San 3A&3B to sell electricity to VN
Develop 600 MW wind farm to sell electricity cross border to VN
20 MW Solar TH Acquisition District Cooling in CHULA Smart City
Laying a solid 2020 foundation for next stage of growth
5
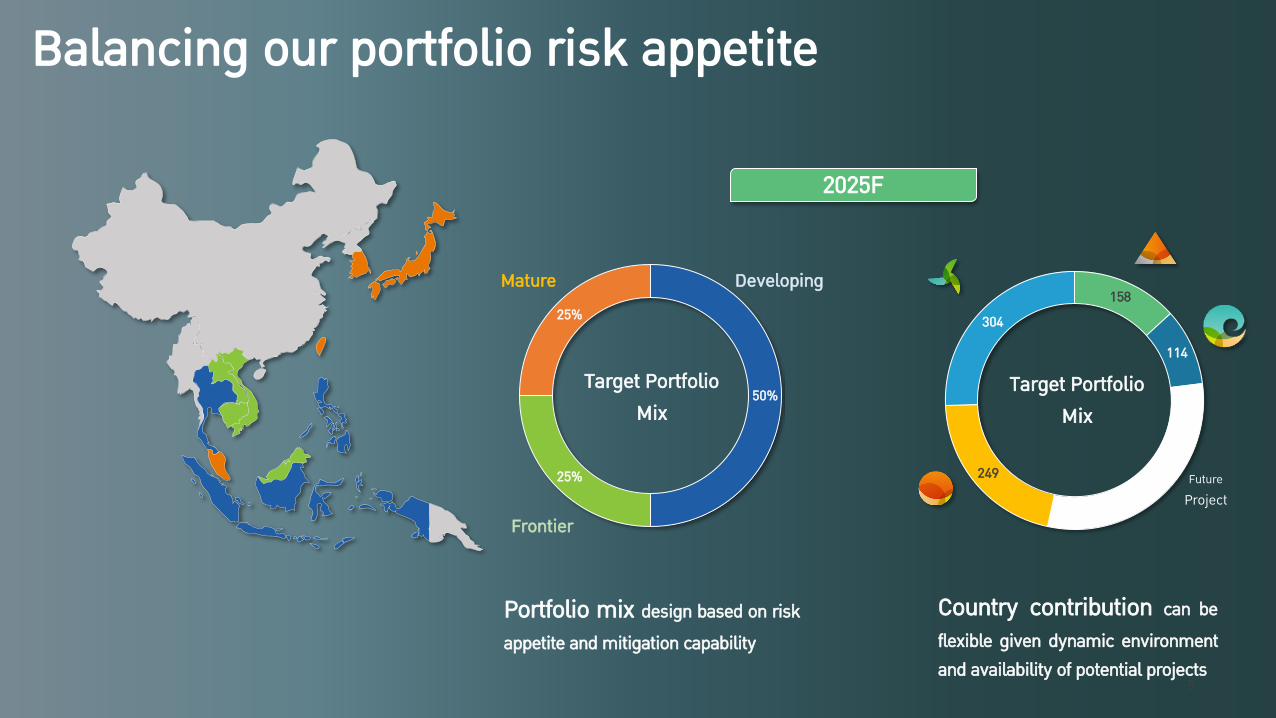
DevelopingMature
Frontier
158
114
249
304
Target PortfolioMix
Future Project
50%
25%
25%
Target PortfolioMix
2025F
Balancing our portfolio risk appetite
Country contribution can be flexible given dynamic environment and availability of potential projects
Portfolio mix design based on risk appetite and mitigation capability

6
Portfolio & Pipelines
Performance & Guidelines
Agenda
Key developments

7
Portfolio & Pipelines
Performance & Guidelines
Agenda
Key developments
8
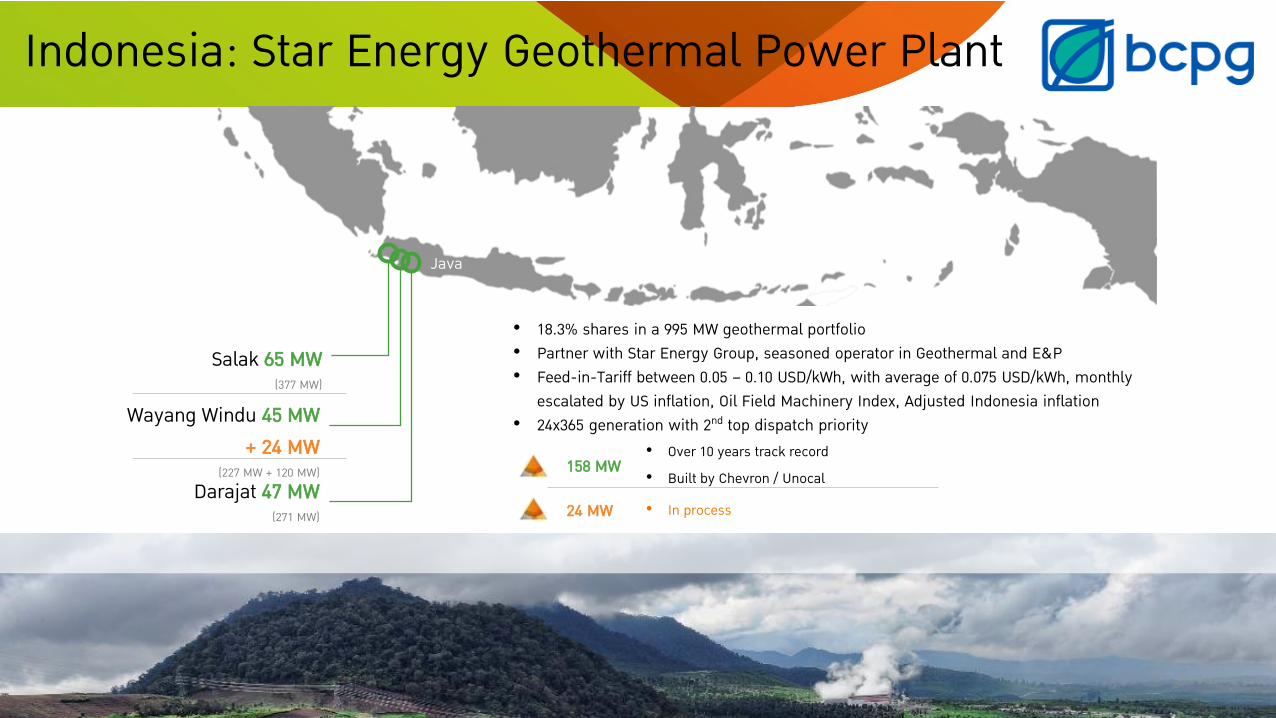
Darajat 47 MW(271 MW)
Salak 65 MW (377 MW)
Wayang Windu 45 MW + 24 MW
(227 MW + 120 MW)
Java
• 18.3% shares in a 995 MW geothermal portfolio• Partner with Star Energy Group, seasoned operator in Geothermal and E&P• Feed-in-Tariff between 0.05 – 0.10 USD/kWh, with average of 0.075 USD/kWh, monthly
escalated by US inflation, Oil Field Machinery Index, Adjusted Indonesia inflation• 24x365 generation with 2nd top dispatch priority
• Over 10 years track record• Built by Chevron / Unocal
158 MW
• In process 24 MW
Indonesia: Star Energy Geothermal Power Plant

Expenses related to refinance
THB -172 mn* Frees up cash dividend to BCPG USD 26 mn or THB 842 mn in 2020. Investment Grade Bond with better conditions e.g. longer tenor, lower interest rate & greater loan amount.The long-term bond have oversubscription of 3.5 times to the issuing amount.Additional cash during 2020-25 to enhance BCPG’s investment ability about THB 10,000 mn.
20202016 2026 2038
PREV
IOUS
REFI
NANC
E
Dividend steam to enhance investment ability.
ID refinancing accelerates dividend payout
Only 5-year tenor left Dividend is restricted until 2023
Free up cash dividend to BCPG
Remark: Above debt is related to Salak and Darajat.*About 35% was non-cash.
Developing: 24.0 MWOperating: 157.5 MW
Hold: 33.3%
Associates
Enhancing investment ability
Bond: Tenor 8.5 & 18 years, avg. rate 4%
Loan: Tenor 10 years, rate 4 - 5%
0200400600800
1,000
2020 2021E 2022E 2023E 2024E 2025E
THB
mn
Additional After Refinance Before Refinance
0
5,000
10,000
15,000
Before Refinance After Refinance
THB
mn
Dividend 2020-25E Investment ability
Gearing up to 4x

10
Philippines: Nabas Wind Farm
50 MW Wind Farm
Company PetroWind Energy Inc.
Location Nabas Town, Visayas, Philippines
Investment Up to USD 27.2 mn (THB 925 mn)
Installed Capacity • Phase 1 : Operating 36 MW (Equity of 14.4 MW)• Phase 2 : Developing 14 MW (Equity of 5.6 MW)
Turbine Gamesa G90 (Spain)
COD (Acqusition date) 10 June 2015 (May 2017) for 20 years
Current 2017 - 2020
Capacity Factor * 26% - 37% (Q1 39% - 53%)
FIT Rate 8.60 PHP/kWh since Nov 2020 with retroactive adjustment
*Range capacity factor after acquisition since May 2017
11
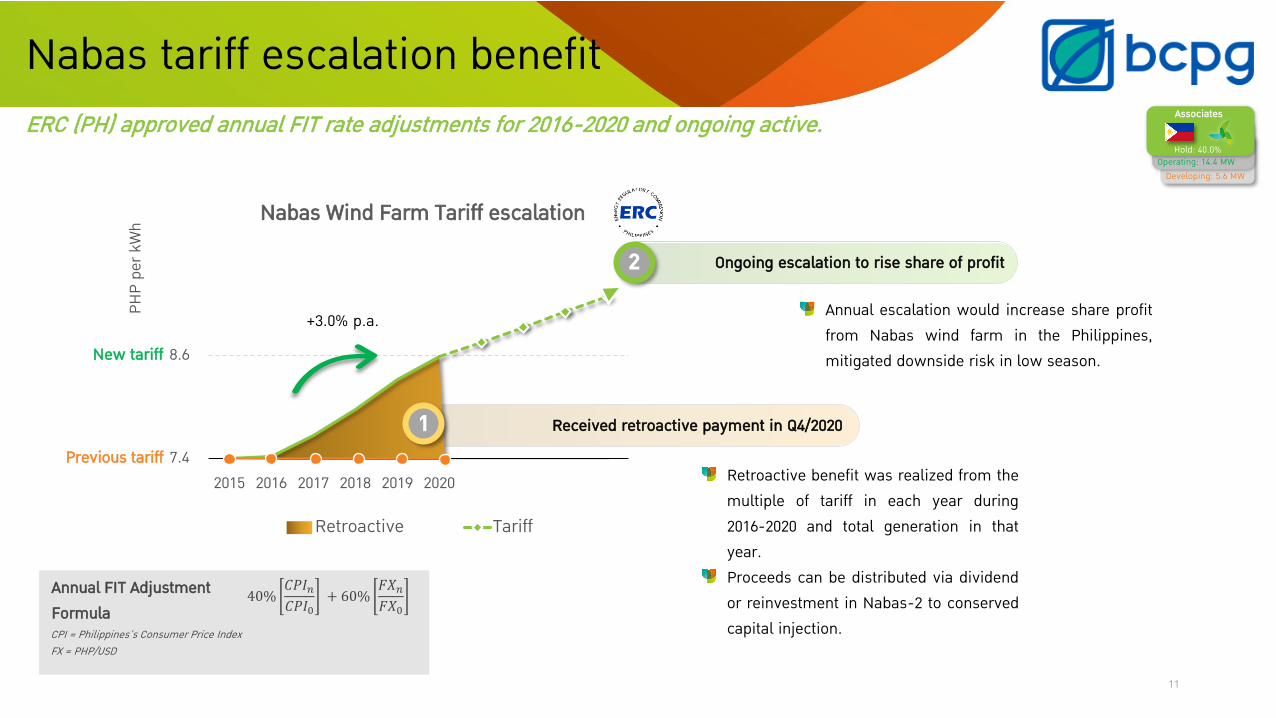
Nabas tariff escalation benefit
7.4
8.6
2015 2016 2017 2018 2019 2020
PHP
per k
Wh Nabas Wind Farm Tariff escalation
Retroactive Tariff
ERC (PH) approved annual FIT rate adjustments for 2016-2020 and ongoing active.
40%𝐶𝑃𝐼𝑛𝐶𝑃𝐼0
+ 60%𝐹𝑋𝑛𝐹𝑋0
Annual FIT Adjustment FormulaCPI = Philippines’s Consumer Price IndexFX = PHP/USD
2 Ongoing escalation to rise share of profit
Retroactive benefit was realized from the multiple of tariff in each year during 2016-2020 and total generation in that year.Proceeds can be distributed via dividend or reinvestment in Nabas-2 to conserved capital injection.
1Previous tariff
New tariff
+3.0% p.a.
Developing: 5.6 MWOperating: 14.4 MW
Hold: 40.0%
Associates
Received retroactive payment in Q4/2020
Annual escalation would increase share profit from Nabas wind farm in the Philippines, mitigated downside risk in low season.

12
Nam San 3A Nam San 3B
Type Run-of-the-river
Capacity 69 MW 45 MW
COD1 date 29 Jan 2016 25 Sep 2015
Acquisition date 20 Sep 2019 26 Feb 2020
PPA(Laos)
- Terms: 27 years from COD (2015 – 2042)- Tariff: 6.72 Uscent/kWh (2020)- Take-or-pay: 95%- Currency: 90% USD/10% KIP
PPA(Vietnam)
- Terms: 25 years from COD ([2022] – 2047)- Tariff: 6.95 Uscent/kWh- Take-or-pay: 90%- Currency: 100% USD
Thathom District
3A Powerhouse
3A Dam site
3B Powerhouse
Xiengkhouang, Laos PDR
1Commercial Operation Date
Nam San 3B siteNam San 3A site
3B Dam Site
Nam San 3A & 3BSteppingstone in hydro power plant with large potential collaborations

Developing: 0.0 MWOperating: 114.0 MW
Hold: 100.0%
Subsidiaries
13
220 kV transmission line: Foundation procedure
Transmission line 3A & 3B: LA-VNMilestones tracking to be COD within 2022
1
Substation construction2
Switching station at border379 km Transmission Line
BorderNam San 3A
Nam San 3B
1
23
60% of transmission line foundations are done.
Foundation excavation
Steel bindingFramework installation Concrete pouring
Completion
Land preparation & substation foundation work

14
Development on plan to COD within this year & output remote control to mitigate curtailment
25 MW
20 MWYabukiCOD 4Q21
Chiba 1COD 4Q21
Chiba 2COD 2H22
20 MW
10 MW
S1
S19
S11
TarumizuGotemba
KomaganeCOD 4Q21
Total developing capacity 75.0 MWppa
*Including developing projects
Curtailment impact
No curtailment impact
Projects update in Japan
Chiba 1: Pond development
Yabuki: Site clearing
Developing: 75.0 MWOperating: 14.7 MW
Hold: 100.0%
Subsidiaries
Total operating capacity 14.7 MWppa
15
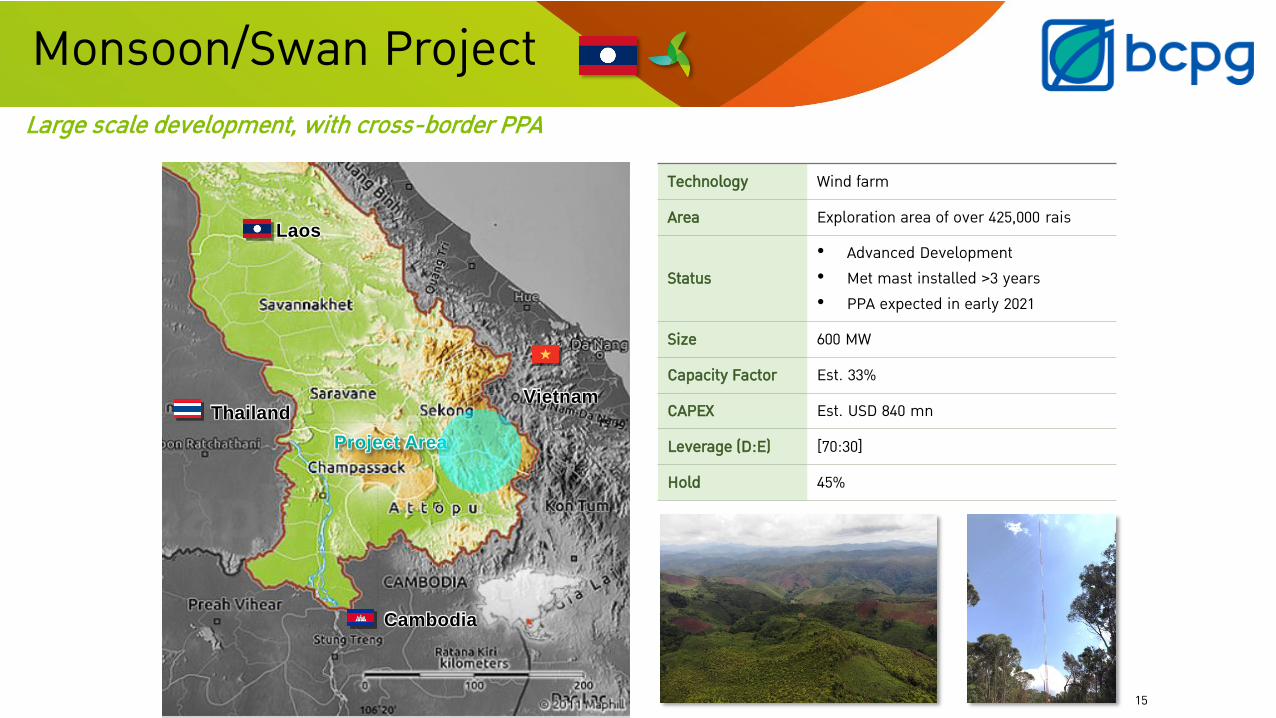
Technology Wind farm
Area Exploration area of over 425,000 rais
Status• Advanced Development• Met mast installed >3 years• PPA expected in early 2021
Size 600 MW
Capacity Factor Est. 33%
CAPEX Est. USD 840 mn
Leverage (D:E) [70:30]
Hold 45%
Thailand
Cambodia
Vietnam
Project Area
Laos
Monsoon/Swan ProjectLarge scale development, with cross-border PPA

16
Lao-VN 600MW Wind Farm milestones
Cross-border milestones: Wind farm
1
2
Project and transmission line construction
Aug-2020
16
34
Financial close
- EPC to be awarded- Financing in place
To b
e CO
D wi
thin
2023
Prime Minister’s Approval
- Acceptance of Grid Study- Tariff Negotiation Range- Project Timeline
- Inclusion of Energy Import into VN’s PDP - Construction of transmission line in VN- COD by 2022- Tariff Ceiling Price
Tariff MOU: Wind Farm✓
✓
PPA to be signed with EVN

17
Portfolio & Pipelines
Performance & Guidelines
Agenda
Key developments
18
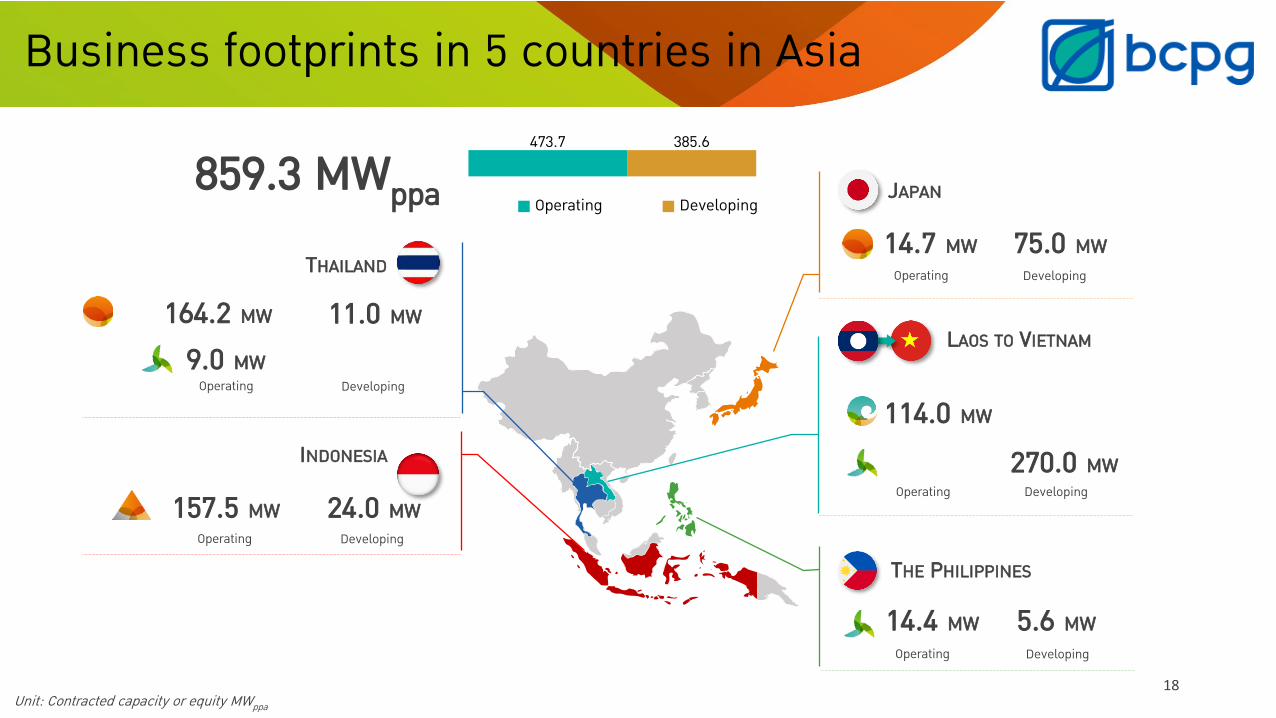
859.3 MWppa
164.2 MW 11.0 MW
THAILAND
Operating Developing
157.5 MW 24.0 MW
INDONESIA
Operating Developing
14.4 MW 5.6 MW
THE PHILIPPINES
Operating Developing
14.7 MW 75.0 MW
JAPAN
Operating Developing
114.0 MW
LAOS TO VIETNAM
Unit: Contracted capacity or equity MWppa
9.0 MW
473.7 385.6
Operating Developing
270.0 MWDevelopingOperating
Business footprints in 5 countries in Asia

19
299.0 MW, 34.7% (275.6 MW under
development)
181.5 MW, 21.1% (24.0 MW under
developing) 267.4 MW, 31.0%
(85.0 MW developing)
114.0 MW, 13.2%
61.0%
2.2%
14.9%
22.0%
Q1 Q2 Q3 Q4
3 hrs 4.1 hrs 4.3 hrs
8.7 hrs
14 hrs
22.5 hrs
Estimated Yearly Power Generation by technology *
Contracted MW by TechnologyY2020 Seasonality by Technology
(Capacity factor %)
859.3 MW
Geothermal (ID)
Hydro (LA)
Wind (PH)
Solar (TH)Solar (JP)
Wind (TH)
Average capacity factor in hours by TechnologyUnit: GWh
Unit: MW
Remarks : * Calculate base on capacity factor (%) & MW at the end of 2020 and subject to holding proportion
> 2,000 GWh / year
Well-diversified portfolio

254
835
1,608 1,651
2,065
2016 2017 2018 2019 2020 2021 202520
…......
Remarks : *Solar equivalent are calculated to be compared with solar power plant in Thailand
Unit: GWh
Current portfolio and pipelines
Current pipeline guarantees a growth of 50% in the next 5 years
Solar Equivalent *
11.0 MW TH75.0 MW JP 5.6 MW PH (Expansion)24.0 MW ID (Expansion)270.0 MW LA
Current pipeline1,450 MW
2,200 MWSolar
Equivalent *
Portfolio growth from existing pipelines
2,100
~3,200

21
Portfolio & Pipelines
Performance & Guidelines
Agenda
Key developments
22
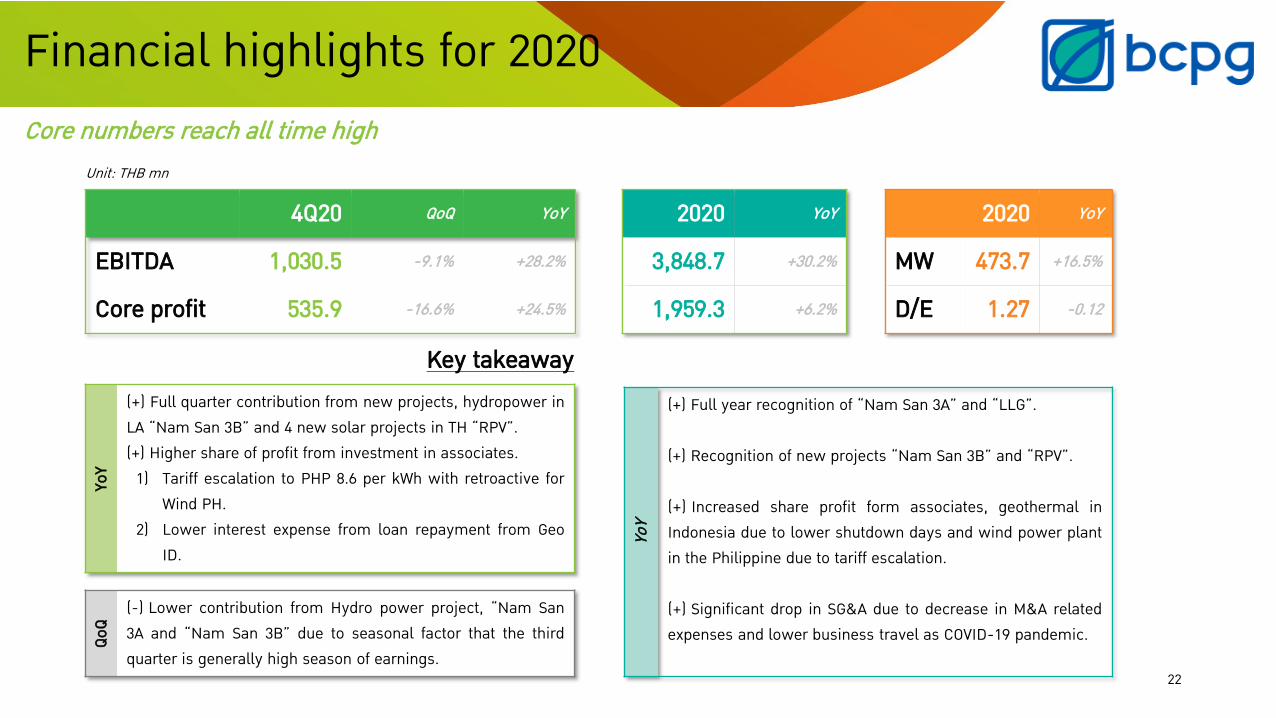
4Q20 QoQ YoY 2020 YoY 2020 YoY
EBITDA 1,030.5 -9.1% +28.2% 3,848.7 +30.2% MW 473.7 +16.5%
Core profit 535.9 -16.6% +24.5% 1,959.3 +6.2% D/E 1.27 -0.12
Unit: THB mn
YoY
(+) Full quarter contribution from new projects, hydropower in LA “Nam San 3B” and 4 new solar projects in TH “RPV”.(+) Higher share of profit from investment in associates.
1) Tariff escalation to PHP 8.6 per kWh with retroactive for Wind PH.
2) Lower interest expense from loan repayment from Geo ID.
QoQ
(-) Lower contribution from Hydro power project, “Nam San 3A and “Nam San 3B” due to seasonal factor that the third quarter is generally high season of earnings.
YoY
(+) Full year recognition of “Nam San 3A” and “LLG”.
(+) Recognition of new projects “Nam San 3B” and “RPV”.
(+) Increased share profit form associates, geothermal in Indonesia due to lower shutdown days and wind power plant in the Philippine due to tariff escalation.
(+) Significant drop in SG&A due to decrease in M&A related expenses and lower business travel as COVID-19 pandemic.
Key takeaway
Financial highlights for 2020Core numbers reach all time high

806.7 777.5 759.1
3,059.7 3,060.4
4Q19 3Q20 4Q20 2019 2020TH (Solar) TH (Wind) TH (Other)
+0.0% YoY-2.4% QoQ
-5.9% YoY
3.2 2.7 3.4
10.0 11.7
14.4%12.2%
15.5% 15.8%13.3%
4Q19 3Q20 4Q20 2019 2020Generation Capacity factor (%)
+16.4% YoY+27.2% QoQ
+6.9% YoY
75.6 73.7 73.5
286.6 290.5
18.2%16.4% 15.5%
17.4% 16.6%
4Q19 3Q20 4Q20 2019 2020Generation Capacity factor (%)
+1.4% YoY-0.3% QoQ
-2.8% YoY
Developing: 0.0 MWOperating: 9.0 MW
Hold: 100.0%
Subsidiaries
Developing: 11.0 MWOperating: 164.2 MW
Hold: 100.0%
Subsidiaries
TH performanceWind performance improved from higher wind speed while solar performance improve from newly acquired 20 MW Solar farm
23
Unit: GWh Unit: GWh
Power generation & Capacity factor (%)
In 4Q20, longer than usual of rainy season was impacted to the drop in electricity generationYE2020 generation improvement due to newly acquired 20 MW Solar farm “ RPV”.
Revenue (TH) Unit: THB million
Solar revenue decreased due to longer than usual of rainy season and offset higher revenue of wind power plant.
Wind speed rose YoY from more monsoon and QoQ from high season. YE2020 growth was driven by the full-year operation.
Solar Wind

64.3188.8 157.1
72.0
453.3
42.2%
75.0%62.4%
43.9% 46.4%
4Q19 3Q20 4Q20 2019 2020Generation Capacity factor (%)
+144.2% YoY
+529.2% YoY-16.8% QoQ
132.2
396.9322.2
148.2
948.4
4Q19 3Q20 4Q20 2019 2020
LA (Hydro)
+143.6% YoY
+539.8% YoY-18.8% QoQ
LA Performance
24
Growth from full-year operation of “Nam San 3A” and full quarter operation of “Nam San 3B”
Unit: GWh
4Q20 growth YoY came from full quarter recognition of “Nam San 3B” but seasonal factor impacted to the drop QoQ. YE2020 growth was supported by full-year recognition of “Nam San 3A” and recognition of “Nam San 3B”.
Unit: THB millionRevenue (LA) Power generation & Capacity factor (%)
Developing: 0.0 MWOperating: 114.0 MW
Hold: 100.0%
Subsidiaries
42.2 63.4 55.5
218.6 221.9
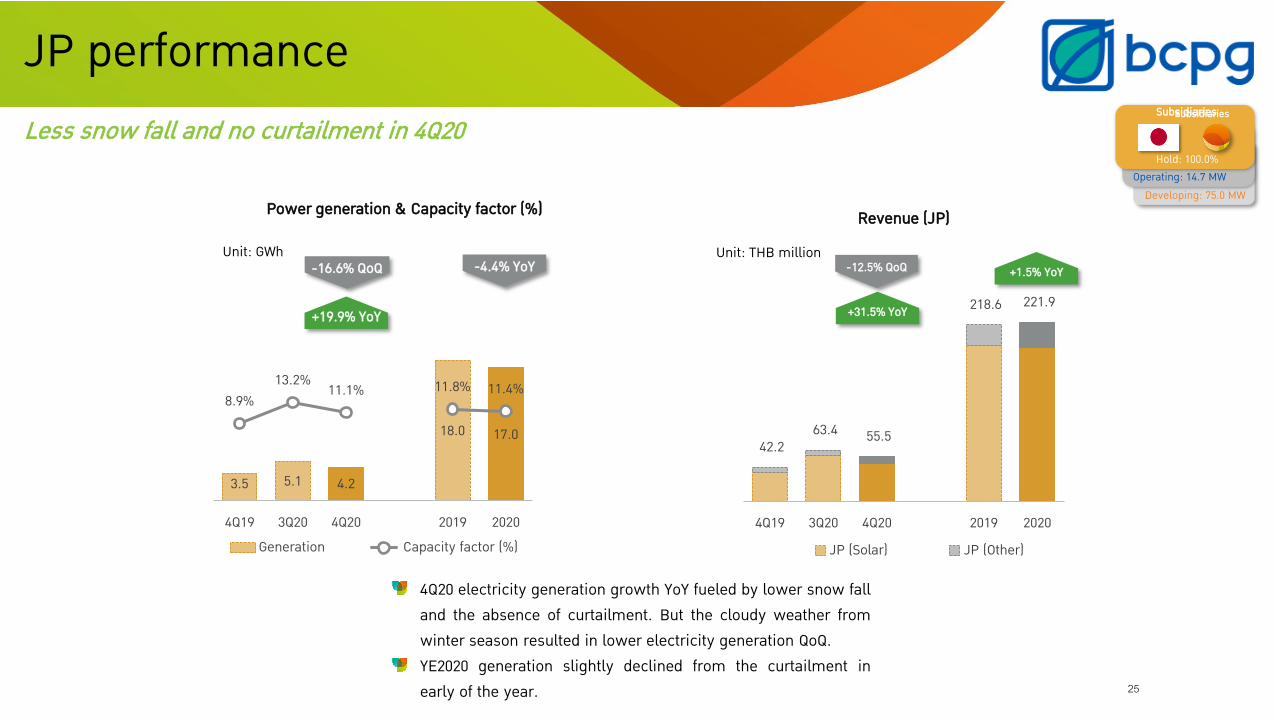
4Q19 3Q20 4Q20 2019 2020JP (Solar) JP (Other)
+31.5% YoY
+1.5% YoY-12.5% QoQ
3.5 5.1 4.2
18.0 17.0
8.9%13.2% 11.1% 11.8% 11.4%
4Q19 3Q20 4Q20 2019 2020Generation Capacity factor (%)
-4.4% YoY
+19.9% YoY
-16.6% QoQ
Developing: 75.0 MWOperating: 14.7 MW
Hold: 100.0%
Subsidiaries
JP performance
25
Less snow fall and no curtailment in 4Q20
Unit: THB million
4Q20 electricity generation growth YoY fueled by lower snow fall and the absence of curtailment. But the cloudy weather from winter season resulted in lower electricity generation QoQ.YE2020 generation slightly declined from the curtailment in early of the year.
Unit: GWh
Subsidiaries
Power generation & Capacity factor (%) Revenue (JP)

299.8 319.4 304.6
1,220.4 1,259.1
90.0% 95.9% 91.3% 92.4% 95.0%
4Q19 3Q20 4Q20 2019 2020Generation * Capacity factor (%)
+1.6% YoY
+3.3% YoY-4.6% QoQ
165.7 217.0 189.9
723.0 849.3
4Q19 3Q20 4Q20 2019 2020
+17.5% YoY
+14.6% YoY
-12.5% QoQ
Developing: 24.0 MWOperating: 157.5 MW
Hold: 33.3%
Associates
ID PerformanceGeothermal power plants in Indonesia
26Remark: *Generation based on holding percentage
Share of profit from operation rose from lower shutdown days.
Unit: GWh
Power generation & Capacity factor (%)
Unit: THB million
4Q20 and YE2020 operating results improved YoY from less planned maintenance days. However, net 4Q20 and YE2020 share of profit were pressure by expenses related to refinance scheme.
Amortization (91.4) (94.6) (92.5) (375.0) (378.0)
One-time items (20.0) - (171.5) (20.0) (238.2)*
Net share of profit 54.3 122.4 (74.1) 328.0 233.1*Including Refinance expenses THB171.5 mn, Tax provision THB 23.9 mn and Allowance for account receivable THB 42.8 mn.
Share of profit
27
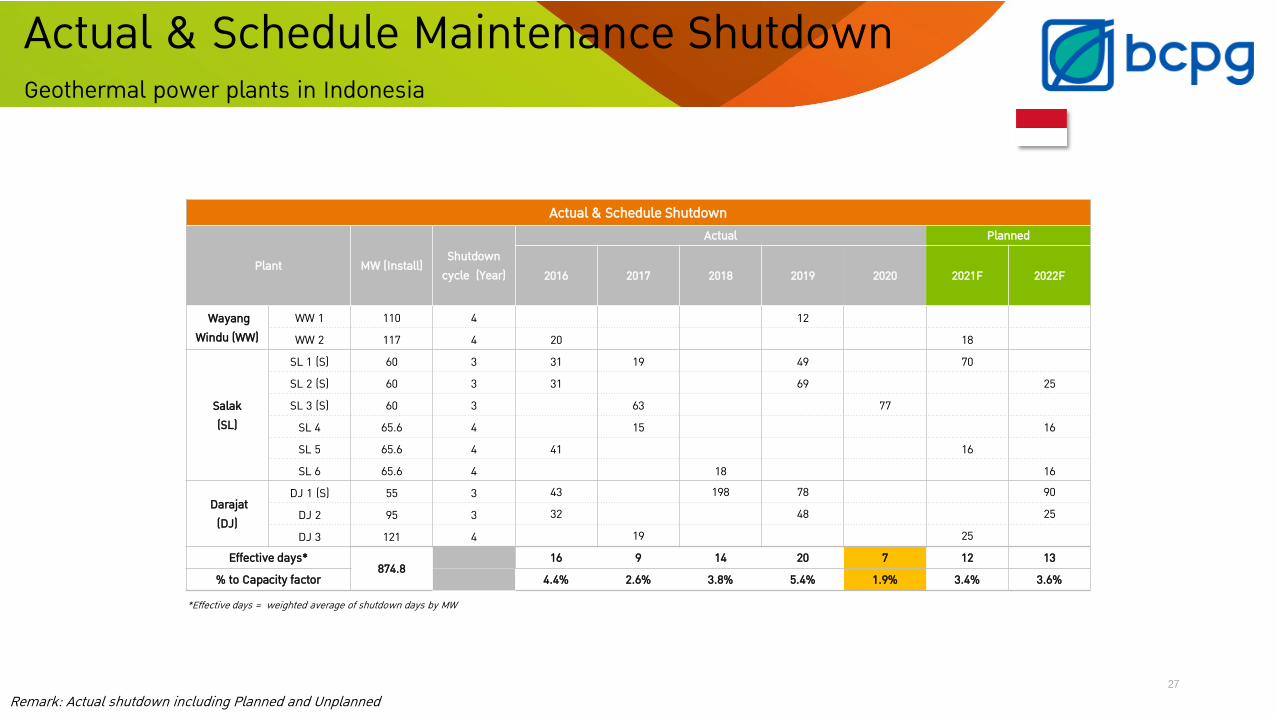
Actual & Schedule Maintenance ShutdownGeothermal power plants in Indonesia
Actual & Schedule Shutdown
Plant MW (Install)Shutdown
cycle (Year)
Actual Planned
2016 2017 2018 2019 2020 2021F 2022F
WayangWindu (WW)
WW 1 110 4 12WW 2 117 4 20 18
Salak (SL)
SL 1 (S) 60 3 31 19 49 70SL 2 (S) 60 3 31 69 25SL 3 (S) 60 3 63 77
SL 4 65.6 4 15 16SL 5 65.6 4 41 16SL 6 65.6 4 18 16
Darajat (DJ)
DJ 1 (S) 55 3 43 198 78 90DJ 2 95 3 32 48 25DJ 3 121 4 19 25
Effective days*874.8
16 9 14 20 7 12 13% to Capacity factor 4.4% 2.6% 3.8% 5.4% 1.9% 3.4% 3.6%
*Effective days = weighted average of shutdown days by MW
Remark: Actual shutdown including Planned and Unplanned

8.2 4.3 8.6
44.733.0
25.7%13.4%
26.9%35.5%
26.1%
4Q19 3Q20 4Q20 2019 2020Generation * Capacity factor (%)
-26.2% YoY+100.6% QoQ
+4.7% YoY 1.1
-13.6
57.4 58.7 69.2
4Q19 3Q20 4Q20 2019 2020
+18.0% YoY
+5,250.5% YoY
+n.a.% QoQ
Developing: 5.6 MWOperating: 14.4 MW
Hold: 40.0%
Associates
PH PerformanceWind power plant in the Philippines
28
Stronger monsoon in 4Q20 and received tariff escalation to PHP 8.6 per kWh.
Remark: *Generation based on holding percentage
Unit: GWh
Amortization (7.8) (8.1) (7.9) (32.0) (32.3)
One-time items - - - - -
Net share of profit (6.7) (21.5) 49.5 26.6 36.9
Higher electricity generation in 4Q20 YoY and QoQ from stronger monsoon. Received price escalation since November 2020 and the retroactive payment for 5 years (2016-2020) of THB 47.8 mn.
Unit: THB million
Power generation & Capacity factor (%) Share of profit

981.2 1,237.9 1,136.8
3,426.6
4,230.7
4Q19 3Q20 4Q20 2019 2020Thailand Japan Lao PDR
+23.5% YoY
+15.9% YoY
-8.2% QoQ
803.81,133.8 1,030.5
2,955.4
3,848.7
4Q19 3Q20 4Q20 2019 2020
+28.2% YoY
+30.2% YoY-9.1% QoQ
Remark: EBITDA from operation including share of profit from associates (after amortization and before one-time items)
Growth is persistent in Revenue and EBITDA
29
EBITDA (Incl. shares of profit)
4Q20 EBTIDA growth followed operating revenue and share of profit from operation. YE2020 EBTIDA growth followed operating revenue, share of profit from operation and lower administrative expenses.
Financial Performance: Revenue & EBITDA
4Q20 YoY growth from the full-quarter contribution of Nam Sam 3B and RPV (newly acquired 20 MW TH Solar). While the drop QoQ from hydropower seasonality. YE2020 growth from the full-year contribution of Nam San 3A and Lomligor as well as the contribution of Nam Sam 3B and RPV (newly acquired 20 MW TH Solar).
Unit: THB millionUnit: THB millionRevenue
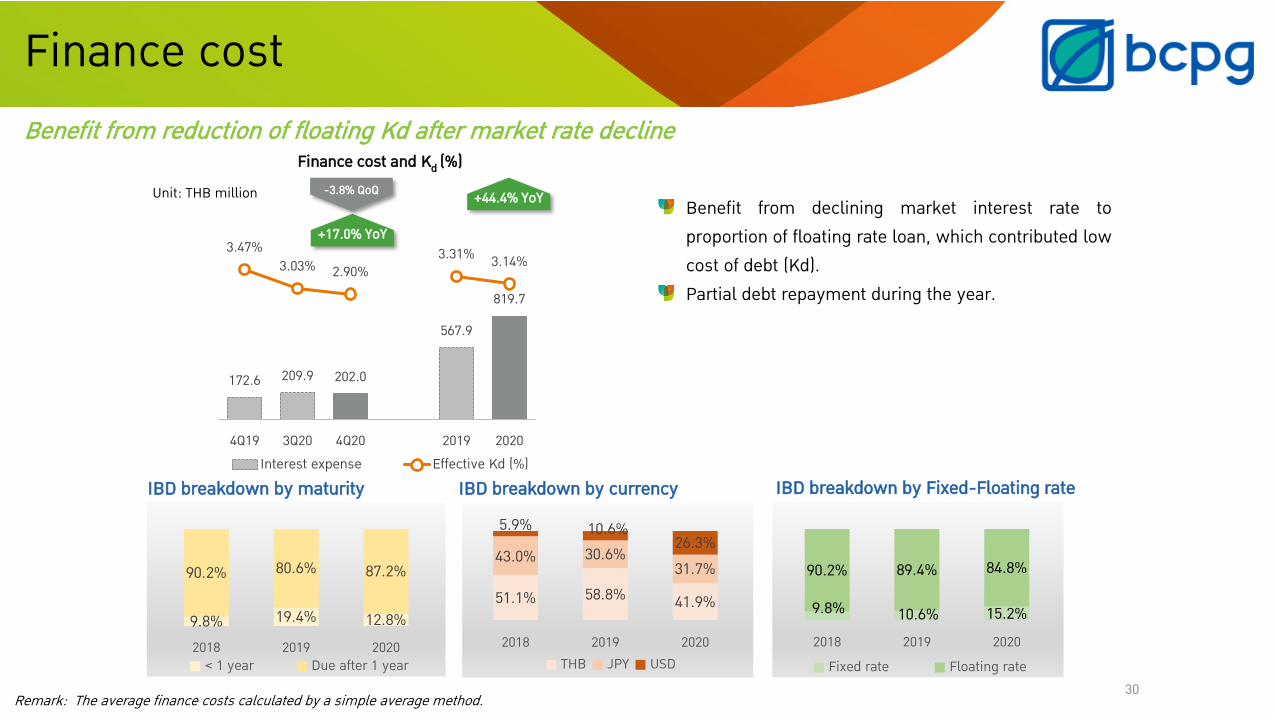
172.6 209.9 202.0
567.9
819.7
3.47%3.03% 2.90%
3.31% 3.14%
4Q19 3Q20 4Q20 2019 2020Interest expense Effective Kd (%)
+44.4% YoY
+17.0% YoY
-3.8% QoQ
30
Unit: THB million
IBD breakdown by maturity IBD breakdown by currency
9.8% 19.4% 12.8%
90.2% 80.6% 87.2%
2018 2019 2020< 1 year Due after 1 year
51.1% 58.8% 41.9%
43.0% 30.6%31.7%
5.9% 10.6%26.3%
2018 2019 2020THB JPY USD
IBD breakdown by Fixed-Floating rate
Benefit from declining market interest rate to proportion of floating rate loan, which contributed low cost of debt (Kd).Partial debt repayment during the year.
9.8% 10.6% 15.2%
90.2% 89.4% 84.8%
2018 2019 2020Fixed rate Floating rate
Finance cost and Kd (%)
Remark: The average finance costs calculated by a simple average method.
Benefit from reduction of floating Kd after market rate decline
Finance cost
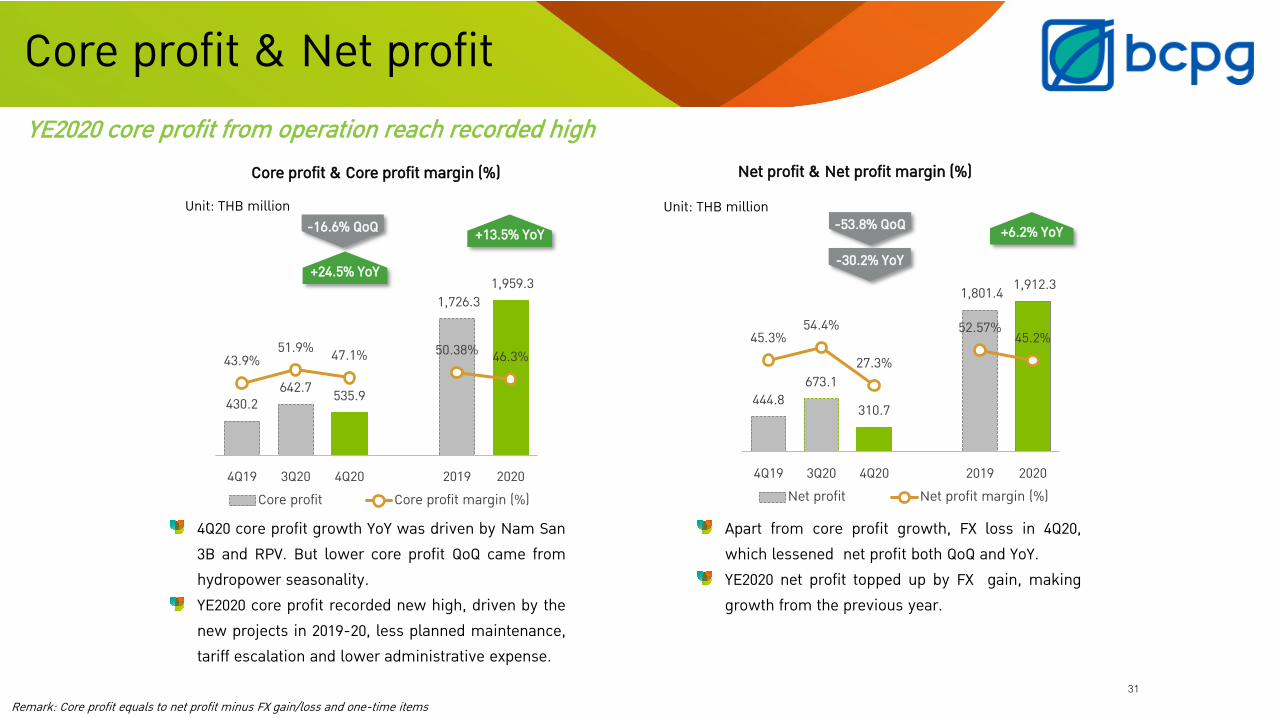
430.2642.7 535.9
1,726.3 1,959.3
43.9%51.9% 47.1% 50.38% 46.3%
4Q19 3Q20 4Q20 2019 2020Core profit Core profit margin (%)
+13.5% YoY
+24.5% YoY
-16.6% QoQ
444.8673.1
310.7
1,801.4 1,912.3
45.3%54.4%
27.3%
52.57% 45.2%
4Q19 3Q20 4Q20 2019 2020Net profit Net profit margin (%)
+6.2% YoY-53.8% QoQ
-30.2% YoY
31
YE2020 core profit from operation reach recorded highCore profit & Core profit margin (%)
Remark: Core profit equals to net profit minus FX gain/loss and one-time items
Unit: THB million
Net profit & Net profit margin (%)
Core profit & Net profit
Unit: THB million
4Q20 core profit growth YoY was driven by Nam San 3B and RPV. But lower core profit QoQ came from hydropower seasonality. YE2020 core profit recorded new high, driven by the new projects in 2019-20, less planned maintenance, tariff escalation and lower administrative expense.
Apart from core profit growth, FX loss in 4Q20, which lessened net profit both QoQ and YoY. YE2020 net profit topped up by FX gain, making growth from the previous year.

32
48.0% 41.9% 44.0%49.3% 53.5%
52.8%31,55837,137
51,220
2018 2019 2020Equity Other Liabilities Interest-bearing debt
1.08 1.39 1.27
2018 2019 2020
D/E Ratio
D/E Ratio Covenant
Covenant = 3.0x
Total assets
ROE (ex-capital raising proceeds) rise
15.1611.74 10.05 12.40
2018 2019 2020 2020(Adjusted)
ROE (%)
Financial position
Dividend payment 2020Type Per share (THB) Amount (THB mn)
Interim 0.16 326.7
Annual 0.17 442.1
Total 0.33 768.8
Payout ratio 40.2%
Dividend yield * 2.36%
(+) Warrant yield ** 3.70%
Total yield 6.06%
“For 2020, if excluding proceeds from capital increased which will mostly used in 2021, ROE will be 12.4%.”
Remark: Dividend policy = not less than 40% of the Company’s net profit based on separated yearly Financial Statement* Dividend yield is calculated based on volumed weighted average price (VWAP) / ** While warrant yield is calculated based on latest warrant price divided by weighted average of VWAP and RO price.
On top of dividend yield in this year, warrant yield would be additional return to investors who subscripted right offering shares.
33
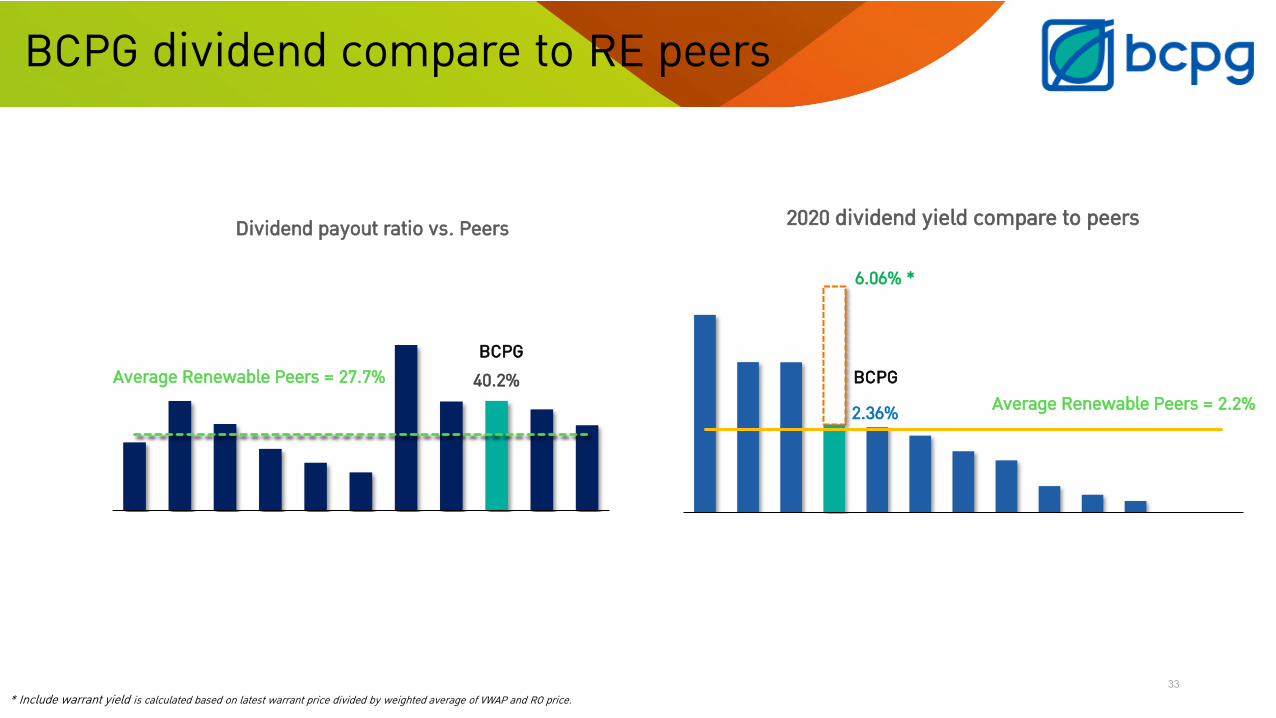
BCPG dividend compare to RE peers
40.2%
Dividend payout ratio vs. Peers
Average Renewable Peers = 27.7% BCPG
* Include warrant yield is calculated based on latest warrant price divided by weighted average of VWAP and RO price.
2.36%
6.06% *
2020 dividend yield compare to peers
BCPGAverage Renewable Peers = 2.2%

34
GuidanceActual Plan
2020 2021
EBITDA *
CAPEX THB 6,000 mn THB 18,000 mn
Dividend policy Not less than 40% of the Company’s net profit
Financial covenant Liability/Equity ≤ 3xDSCR ≥ 1.15x
Remark: *Share of profit from associates (after amortization but before one-time items) / For demonstration purposes only
Guideline 2021
>20% 30 - 40%
New acquisitions
>30%

2020 CollectionInvoiced Collected
35
EDL payment still collectable
Remark: Figure for demonstration purpose only
Gradually get paid from EDL since Sep 20
Continuing cash collection stream after Sep 20. We gradually paid currently from Aug 20 invoice. In general, 70% of account receivable collection still can be converted to USD.
A/R THB 592.6 mn
Cash received…

36
Q&A
37
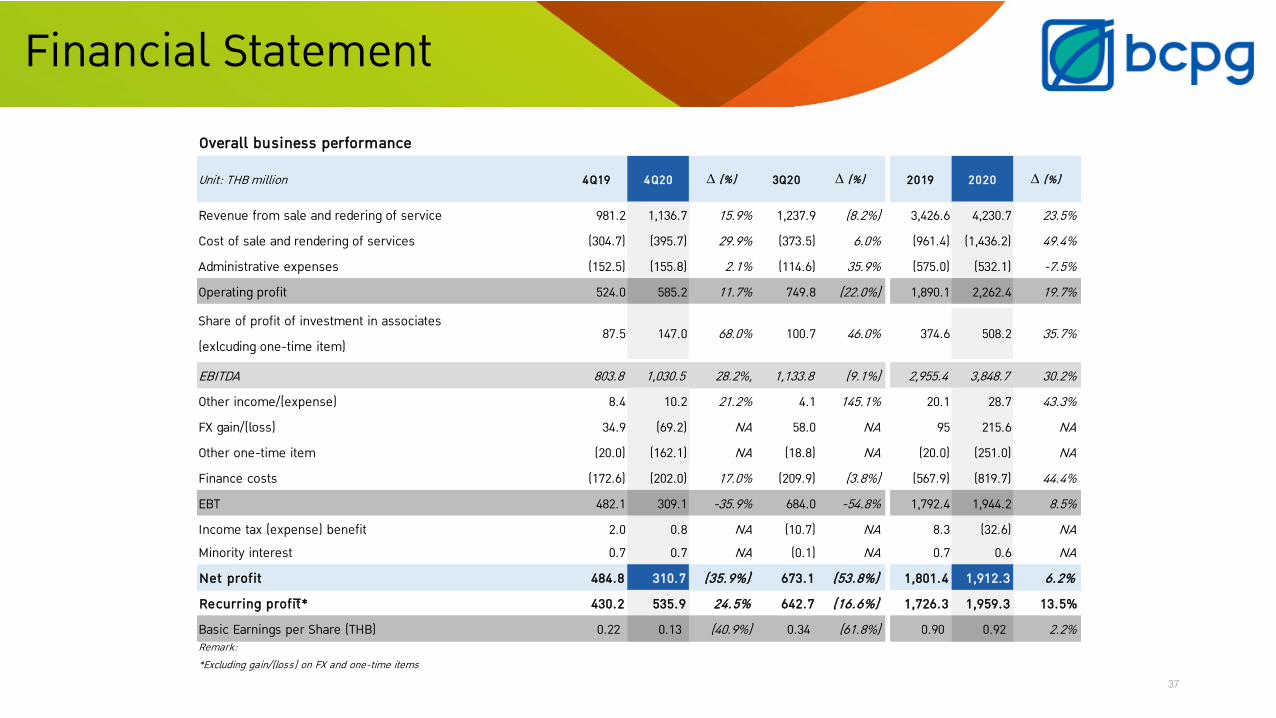
Financial StatementOverall business performance
Unit: THB million 4Q19 4Q20 ∆ (%) 3Q20 ∆ (%) 2019 2020 ∆ (%)
Revenue from sale and redering of service 981.2 1,136.7 15.9% 1,237.9 (8.2%) 3,426.6 4,230.7 23.5%Cost of sale and rendering of services (304.7) (395.7) 29.9% (373.5) 6.0% (961.4) (1,436.2) 49.4%Administrative expenses (152.5) (155.8) 2.1% (114.6) 35.9% (575.0) (532.1) -7.5%Operating profit 524.0 585.2 11.7% 749.8 (22.0%) 1,890.1 2,262.4 19.7%
Share of profit of investment in associates (exlcuding one-time item)
87.5 147.0 68.0% 100.7 46.0% 374.6 508.2 35.7%
EBITDA 803.8 1,030.5 28.2%, 1,133.8 (9.1%) 2,955.4 3,848.7 30.2%Other income/(expense) 8.4 10.2 21.2% 4.1 145.1% 20.1 28.7 43.3%FX gain/(loss) 34.9 (69.2) NA 58.0 NA 95 215.6 NAOther one-time item (20.0) (162.1) NA (18.8) NA (20.0) (251.0) NAFinance costs (172.6) (202.0) 17.0% (209.9) (3.8%) (567.9) (819.7) 44.4%EBT 482.1 309.1 -35.9% 684.0 -54.8% 1,792.4 1,944.2 8.5%Income tax (expense) benefit 2.0 0.8 NA (10.7) NA 8.3 (32.6) NAMinority interest 0.7 0.7 NA (0.1) NA 0.7 0.6 NANet profit 484.8 310.7 (35.9%) 673.1 (53.8%) 1,801.4 1,912.3 6.2%Recurring profitิ * 430.2 535.9 24.5% 642.7 (16.6%) 1,726.3 1,959.3 13.5%Basic Earnings per Share (THB) 0.22 0.13 (40.9%) 0.34 (61.8%) 0.90 0.92 2.2%Remark:*Excluding gain/(loss) on FX and one-time items
38
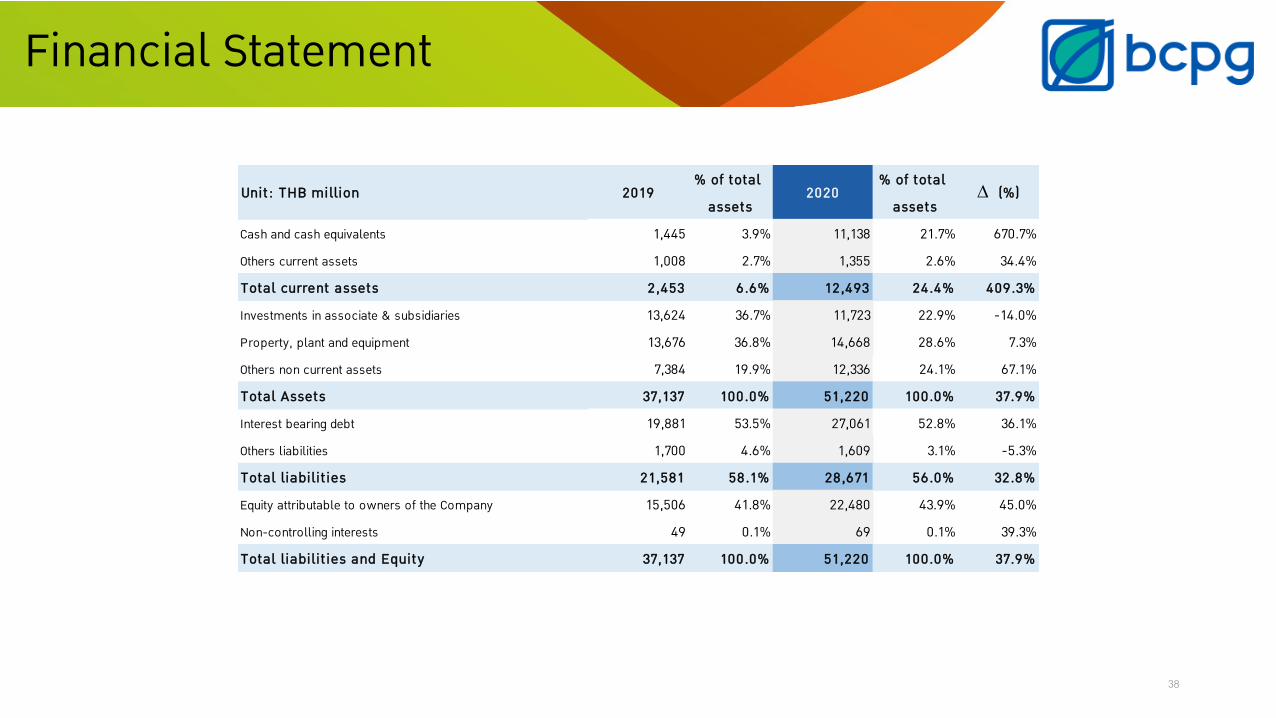
Financial Statement
Unit: THB million 2019% of total
assets2020
% of total assets
∆ (%)
Cash and cash equivalents 1,445 3.9% 11,138 21.7% 670.7%Others current assets 1,008 2.7% 1,355 2.6% 34.4%Total current assets 2,453 6.6% 12,493 24.4% 409.3%Investments in associate & subsidiaries 13,624 36.7% 11,723 22.9% -14.0%Property, plant and equipment 13,676 36.8% 14,668 28.6% 7.3%Others non current assets 7,384 19.9% 12,336 24.1% 67.1%Total Assets 37,137 100.0% 51,220 100.0% 37.9%Interest bearing debt 19,881 53.5% 27,061 52.8% 36.1%Others liabilities 1,700 4.6% 1,609 3.1% -5.3%Total liabilit ies 21,581 58.1% 28,671 56.0% 32.8%Equity attributable to owners of the Company 15,506 41.8% 22,480 43.9% 45.0%Non-controlling interests 49 0.1% 69 0.1% 39.3%Total liabilit ies and Equity 37,137 100.0% 51,220 100.0% 37.9%

39
Financial Statement
Unit: THB million 2019 2020 ∆ YoYNet cash from (used in) operating activities 2,120 3,079 959.4
Net cash from (used in) investing activities (6,001) (5,309) 691.6
Net cash from (repay to) financing activities 2,952 12,068 9,116.6
Net increase in cash and cash equivalents (930) 9,838 10,767.6
Cash and cash equivalents at 1 January 2,425 1,445 (980.1)
Effect of exchange rate changes on balances held in foreign currencies
(50) (145) (94.4)
Cash and cash equivalents at end period 1,445 11,138 9,693.1
CAPEX (5,852) (6,052) (200.0)
Consolidated Statement of Cash Flows

40
No. ProjectLocation
Operating Entity
% of Shareholding
Installed Capacity
(MW)
Contracted Capacity
(MW)Tariff Power Structure Off Taker CODDistrict Province
1 BCPG 1Bang Pa-in Ayutthaya BCPG N.A.
9.5 8
Adder THB 8/kWh
PEA 5/08/11BCPG 2 35.5 30 EGAT 16/07/12
2 BSE-BNN Bumnetnarong Chaiyaphum BSE 99.9 25.0 16
PEA
6/03/133 BSE-BPH Bang Pahan Ayutthaya BSE 99.9 25.0 16 5/04/134 BSE-BRM Prakonechai Buriram BSE-BRM 99.9 12.5 8 19/03/145 BSE-BRM1 Nongkee Buriram BSE-BRM 1 99.9 12.5 8 11/04/146 BSE-CPM1 Bumnetnarong Chaiyaphum BSE-CPM 1 99.9 12.5 8 24/04/147 BSE-NMA Dan Khun Tod NakhonRatchasima BSE-NMA 99.9 12.5 8 10/04/148 BSE-PRI Kabinburi Prachinburi BSE-PRI 99.9 25.0 16 21/04/14
9 Co-op: WSC Wiset Chai Chan Angthong BSE-PRI N.A. 5.0 5.0
FiT: THB 5.66/unit PEA(25 years)
23/12/16
10 Co-op: BPI Bang Pa-in Ayutthaya BSE-PRI N.A. 5.0 5.0 14/03/17
11 Co-op: AYA Phra Nakhon Si Ayutthaya
Ayutthaya BSE - PRI N.A. 2.0 2.0 23/12/16
12 Co-op (WVO)Saraburi Phra Phutthabat Saraburi BCPG N.A. 5.0 5.0
FiT: THB 4.12/unit PEA(25 years)
20/7/18
13 Co-op (WVO)Kanchanaburi Tha Muang Kanchanaburi BCPG N.A. 3.94 3.94 23/7/18
14 Lomligor Pak Panang Nakhon Sri Thammarat LLG 99.9 10.0 8.965 Adder THB 3.5/kWh PEA
(25 years) 11/4/19
15 Private floating solar Bang Pa-in Ayutthaya BCPG N.A. 2.1 2.1 Private PPA BBF 14/11/20
Conventional contracted capacity totaling of 150.0 MW
Conventional solar & wind projects in Thailand
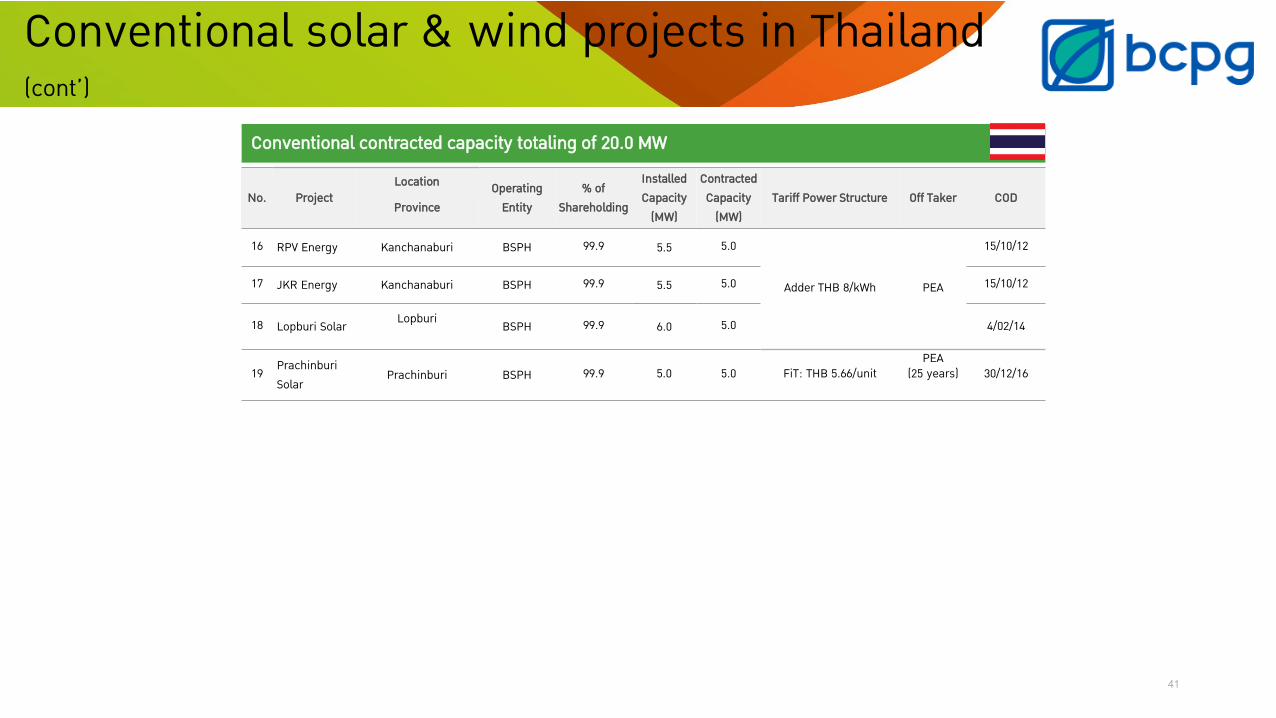
41
No. ProjectLocation Operating
Entity% of
Shareholding
Installed Capacity
(MW)
Contracted Capacity
(MW)Tariff Power Structure Off Taker COD
Province
16 RPV Energy Kanchanaburi BSPH 99.9 5.5 5.0
Adder THB 8/kWh PEA
15/10/12
17 JKR Energy Kanchanaburi BSPH 99.9 5.5 5.0 15/10/12
18 Lopburi Solar Lopburi BSPH 99.9 6.0 5.0 4/02/14
19 Prachinburi Solar
Prachinburi BSPH 99.9 5.0 5.0 FiT: THB 5.66/unitPEA
(25 years) 30/12/16
Conventional contracted capacity totaling of 20.0 MW
Conventional solar & wind projects in Thailand(cont’)

42
Total contracted capacity in pipeline of 15.2 MW as of 2Q20. COD target by 2021. Potential to be signed is another 17.6 MW
# Type Segment Relation-ship
Project Location Contracted Capacity
Terms (year)
Tariff power structure
Status/ COD
1 Rooftop Industrial Subsidiary Kingboard Uthai, Ayutthaya 0.752 MW 20 Private PPA COD 1/12/2018
2Rooftop Commercial Partner
Habito, T77, Sansiri
Wattana, Bangkok 0.053 MW 25 Private PPA COD 12/1/2019
3Rooftop
Commercial/Residential
Partner T77, Sansiri Wattana, Bangkok 0.376 MW 25 Private PPA COD 1/5/2019
4 Rooftop Commercial/Residential
Partner Escape, Sansiri
Lam Luk Ka, Phathum Thani
0.277 MW25 Private PPA COD 1/2/2020
5 Rooftop Industrial Partner PCF, Sansiri Pak Chong, Nakhon Ratchasima
0.063 MW25 Private PPA COD 1/2/2020
6 Rooftop Mix Others Lots Several cities 1.631 MW 15 – 20 Private PPA 4Q20
7 Rooftop Mix Others Lots Several cities 2.0 MW 15 – 20 Private PPA Under construction
8 Rooftop Commercial Partner (75%)
CMU Mueang, Chiangmai 9.0 MW 20 Private PPA Under construction
Other solar rooftop projects in Thailand

43
Contracted capacity of 14.7 MW
43
No. Project % ofInvestment Location Irradiation
(kWh/m2/year)Installed Capacity
(MW)
Contracted Capacity
(MW)
Feed-in Tariff (FiT)
(JPY/kWh)PPA Period
(Year) Off Taker Status
Operation1 S1
(Natkatsugawa) 100.0 Kagoshima, Japan 1,405 0.9 0.7 40 20
Kyushu Electric Power Company
COD 15/08/14
2 S11 (Takamori ) 100.0 Kumamoto, Japan 1,376 1.3 1.0 40 20 COD 16/02/15
3 S19 (Nojiri) 100.0 Miyazaki, Japan 1,433 1.1 0.9 40 20 COD 24/02/15
4 Tarumizu 100.0 Kagoshima, Japan 1,369 9.7 8.1 40 20 COD 31/08/15
5 Gotemba 100.0 Shizuoka, Japan 1,291 4.4 4.0 32 20 Tokyo Electric Power Company COD 16/04/18
Developing
6 Komagane 100.0 Nagano, Japan 1,472 32.0 25.0 36 20 Chubu Electric Power Company Expect to COD within 4Q21
7 Yabuki 100.0 Fukushima, Japan 1,294 27.9 20.0 36 20 Tohoku Electric Power Company Expect to COD within 4Q21
8 Chiba 1 100.0 Chiba, Japan 1,362 27.0 20.0 36 20 Tokyo Electric Power Company Expect to COD within 4Q21
9 Chiba 2 100.0 Chiba, Japan 1,362 13.0 10.0 32 20 Tokyo Electric Power Company Expect to COD within 2H22
Under development (Exclude from pipeline)10 Nagota 100.0 Kagoshima, Japan 1,448 30.0 24.0 36 20
Wait for Grid11 Isakida 100.0 Kagoshima, Japan 1,463 4.4 3.5 36 20
12 Shimoyunohira 100.0 Oita, Japan 1,330 9.6 8.0 36 20
13 S5 100.0 Kagoshima, Japan 1,371 7.2 6.0 36 20
Sold to IFFNikaho 100.0 Akita, Japan 1,136 13.2 8.8 40 20 Tohoku Electric Power Company COD 15/07/16
Nagi 100.0 Okayama, Japan 1,329 14.4 10.5 36 20 Chugoku Electric Power Company COD 02/03/17
Conventional solar projects in Japan

44
Public
BSE BSE-BRM BSE-BRM1 BSE-CPM1 BSE-NMA BSE-PRI LLG TDED
Thailand
Singapore
99.9% 99.9% 99.9% 99.9% 99.9% 99.9% 99.9% 75.0%
BSEH
100.0%
BCPGI SEGHPL
GreenergyHoldings
GreenergyPower
BCPG Wind
100.0% 100.0% 100.0%The Netherlands
JapanPetrowind
Energy
The Philippines 40.0%HMJ BCPGJ
EPC(1) AM(2) Investment(3) Project Under Development
Operating Projects
Operating Projects
Operating Projects
100.0% 100.0%
100.0% 51.0% 100.0% 100.0% 100.0% 100.0%
100.0%
(1) EPC = Groups of companies doing such business as (1) a turnkey EPC contractor and (2) an operation and maintenance contractor for solar power plants in Japan(2) AM = an Asset Management company rendering operation and maintenance service for the Tiramizu project and its remaining shares of 49.0% are held by a juristic person (3) Investment = companies investing in solar farms in Japan as TK investor
Laos
BCPGIndochina
99.9%
Nam San 3A
100.0%
IEAD
45.0%100.0% 33.33% Hong Kong
Nam San 3B
100.0%
Monsoon
100.0%
Group’s Business Structure
RPV
99.9%
JKRAQU
LS PS
99.9%99.9%
99.9% 99.9%
BSPH
99.9%
CDC
60.0%

45Survey link


