IATA 2016 KEEPING EUROPE COMPETITIVE IN AN IMPORT ENVIRONMENT
Andrew Bonnington Editorial Director, Strategic Oil Markets Development May 2016
• Jet fuel market weakness explained
• Examining trade flows – new supplies coming online
• Analysing European import infrastructure
• Pipeline networks
• Conclusions
AGENDA
PLATTS – AN INTRODUCTION
Enabling the markets to perform with greater Transparency & Efficiency
Since
PLATTS – AN INTRODUCTION
Editorial and market assessments are conducted with complete Independence & Impartiality
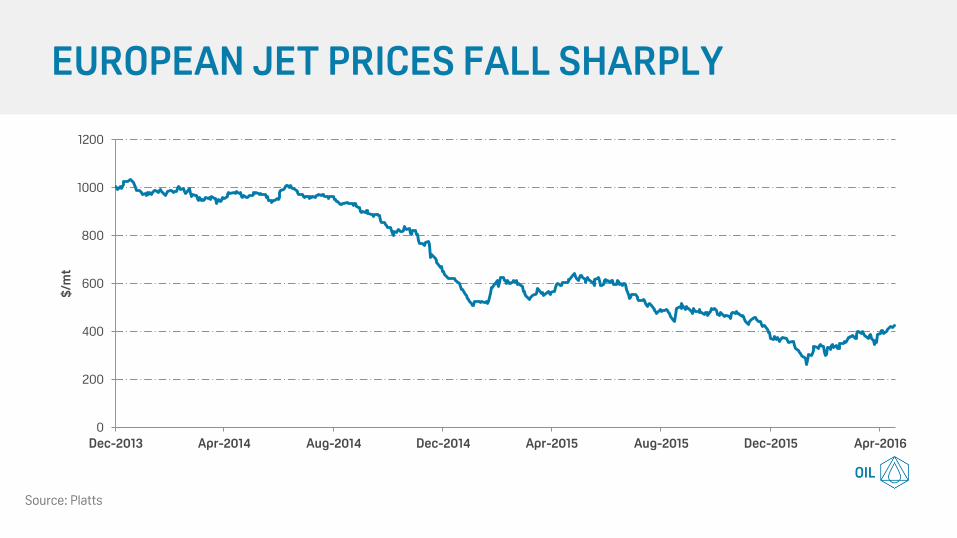
EUROPEAN JET PRICES FALL SHARPLY
0
200
400
600
800
1000
1200
Dec-2013 Apr-2014 Aug-2014 Dec-2014 Apr-2015 Aug-2015 Dec-2015 Apr-2016
$/m
t
Source: Platts
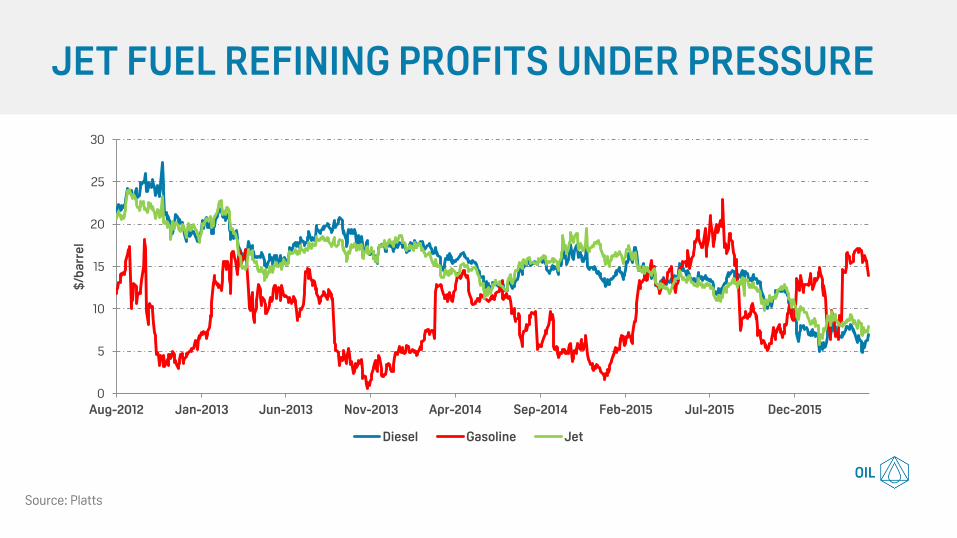
JET FUEL REFINING PROFITS UNDER PRESSURE
0
5
10
15
20
25
30
Aug-2012 Jan-2013 Jun-2013 Nov-2013 Apr-2014 Sep-2014 Feb-2015 Jul-2015 Dec-2015
$/b
arr
el
Diesel Gasoline Jet
Source: Platts
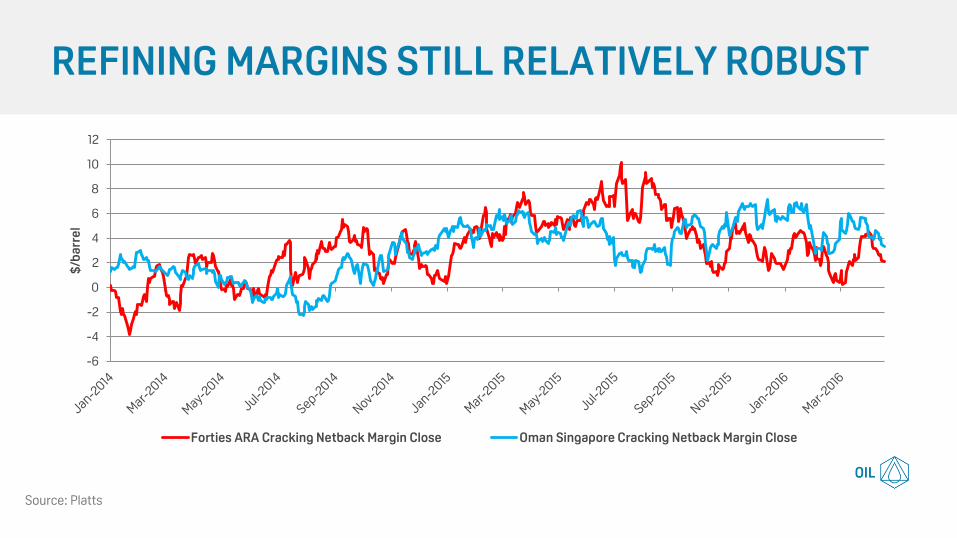
REFINING MARGINS STILL RELATIVELY ROBUST
-6
-4
-2
0
2
4
6
8
10
12
$/b
arr
el
Forties ARA Cracking Netback Margin Close Oman Singapore Cracking Netback Margin Close
Source: Platts
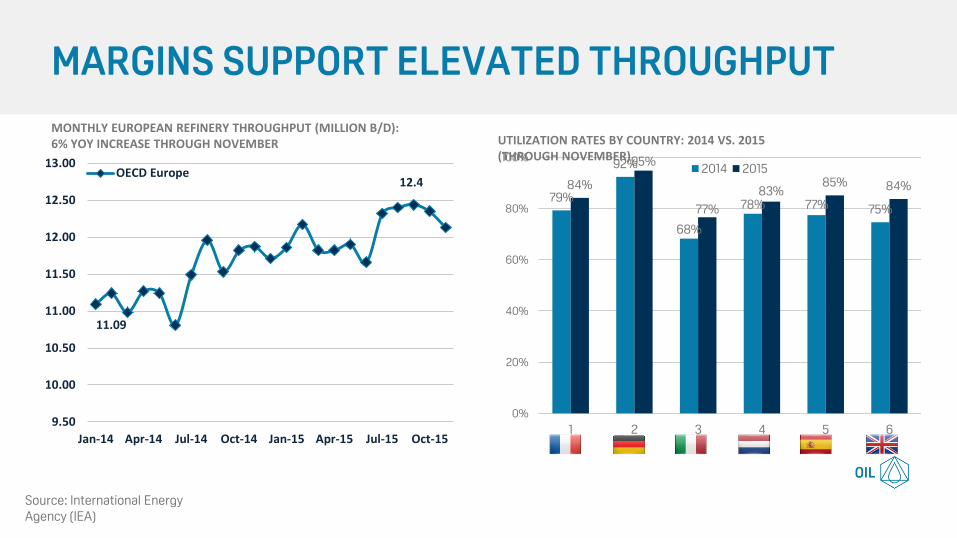
11.09
12.4
9.50
10.00
10.50
11.00
11.50
12.00
12.50
13.00
Jan-14 Apr-14 Jul-14 Oct-14 Jan-15 Apr-15 Jul-15 Oct-15
OECD Europe
MARGINS SUPPORT ELEVATED THROUGHPUT
MONTHLY EUROPEAN REFINERY THROUGHPUT (MILLION B/D): 6% YOY INCREASE THROUGH NOVEMBER UTILIZATION RATES BY COUNTRY: 2014 VS. 2015
(THROUGH NOVEMBER)
79%
92%
68%
78% 77% 75%
84%
95%
77%
83% 85% 84%
0%
20%
40%
60%
80%
100%
1 2 3 4 5 6
2014 2015
Source: International Energy Agency (IEA)
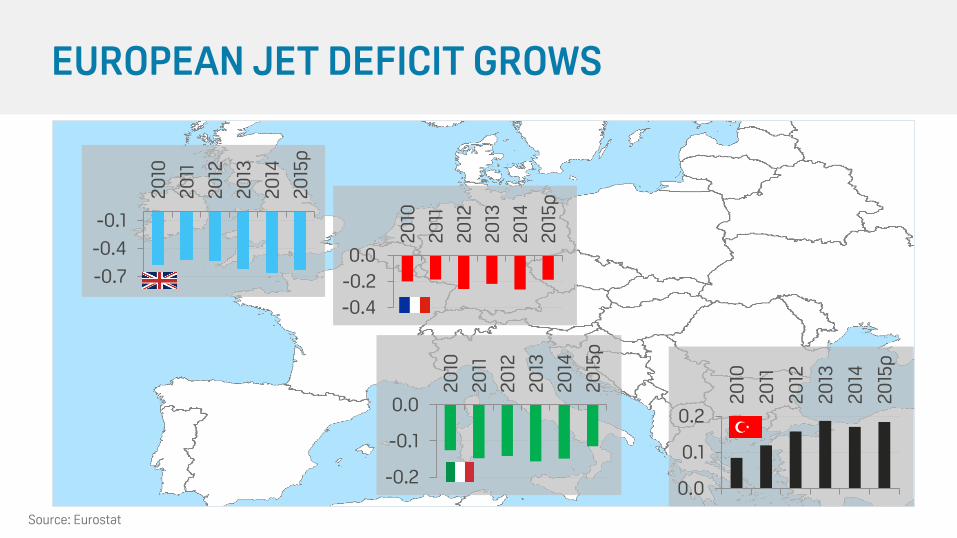
EUROPEAN JET DEFICIT GROWS
-0.7
-0.4
-0.1
20
10
20
11
20
12
20
13
20
14
20
15p
-0.4
-0.2
0.0
20
10
20
11
20
12
20
13
20
14
20
15p
0.0
0.1
0.2
20
10
20
11
20
12
20
13
20
14
20
15p
-0.2
-0.1
0.0
20
10
20
11
20
12
20
13
20
14
20
15p
Source: Eurostat
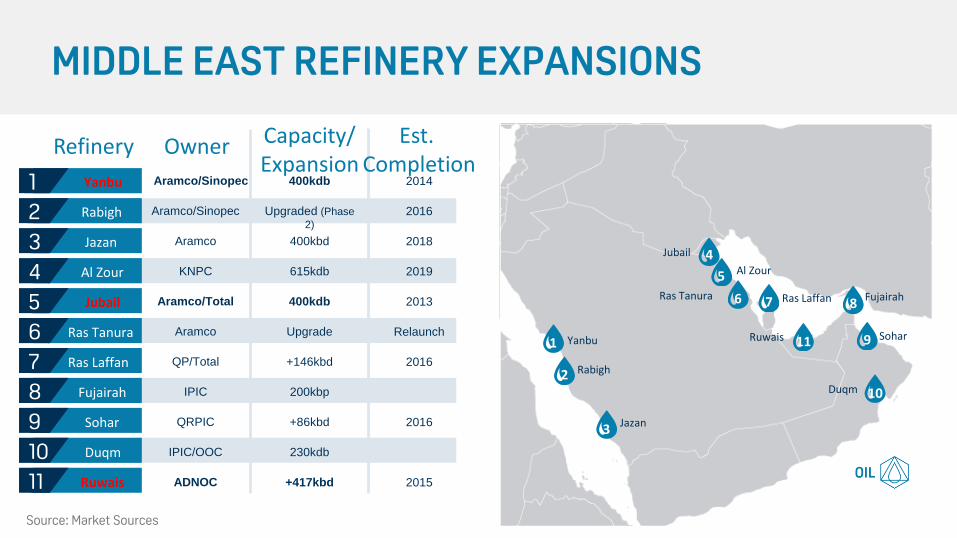
MIDDLE EAST REFINERY EXPANSIONS
Source: Market Sources
Yanbu
Jazan
Rabigh
Duqm
Sohar
Fujairah Ras Laffan
11
Ras Tanura
Jubail
Al Zour
Ruwais 1
2
3
4
5
6 7
11
8
9
10
Refinery
Yanbu
Rabigh
Jazan
Al Zour
Jubail
Ras Tanura
Ras Laffan
Fujairah
Sohar
Duqm
Ruwais
Aramco/Sinopec
Aramco/Sinopec
QP/Total
Aramco
KNPC
Aramco/Total
Aramco
IPIC
QRPIC
IPIC/OOC
ADNOC
400kdb
Upgraded (Phase
2)
+146kbd
400kbd
615kdb
400kdb
Upgrade
200kbp
+86kbd
230kdb
+417kbd
2014
2016
2016
2018
2019
2013
Relaunch
2016
2015
Owner Capacity/ Expansion
Est. Completion
1 2
3
4
5
6
7
8
9
10
11
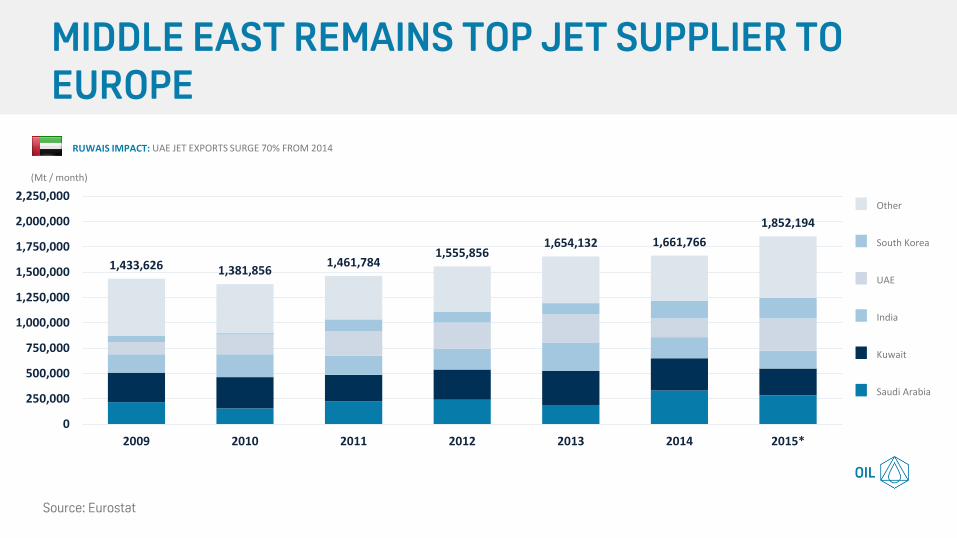
1,433,626 1,381,856 1,461,784
1,555,856 1,654,132 1,661,766
1,852,194
0
250,000
500,000
750,000
1,000,000
1,250,000
1,500,000
1,750,000
2,000,000
2,250,000
2009 2010 2011 2012 2013 2014 2015*
MIDDLE EAST REMAINS TOP JET SUPPLIER TO EUROPE
(Mt / month)
RUWAIS IMPACT: UAE JET EXPORTS SURGE 70% FROM 2014
Source: Eurostat
Saudi Arabia
Kuwait
India
UAE
South Korea
Other
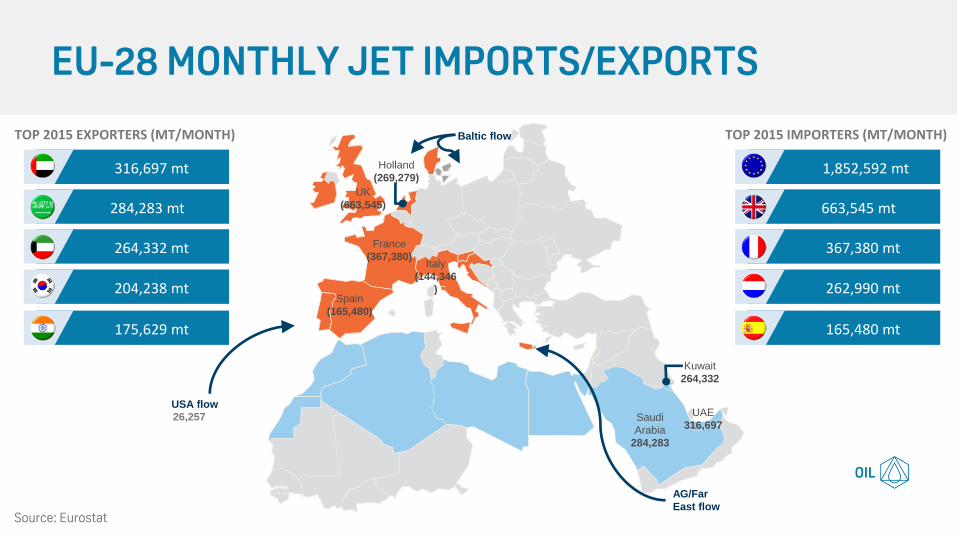
175,629 mt
204,238 mt
264,332 mt
284,283 mt
316,697 mt
EU-28 MONTHLY JET IMPORTS/EXPORTS
Source: Eurostat
TOP 2015 IMPORTERS (MT/MONTH)
UAE
316,697
Kuwait
264,332
Saudi
Arabia
284,283
AG/Far
East flow
USA flow
26,257
Baltic flow
Spain
(165,480)
France
(367,380)
UK
(663,545)
Holland
(269,279)
Italy
(144,346
)
1,852,592 mt
663,545 mt
367,380 mt
262,990 mt
165,480 mt
TOP 2015 EXPORTERS (MT/MONTH)
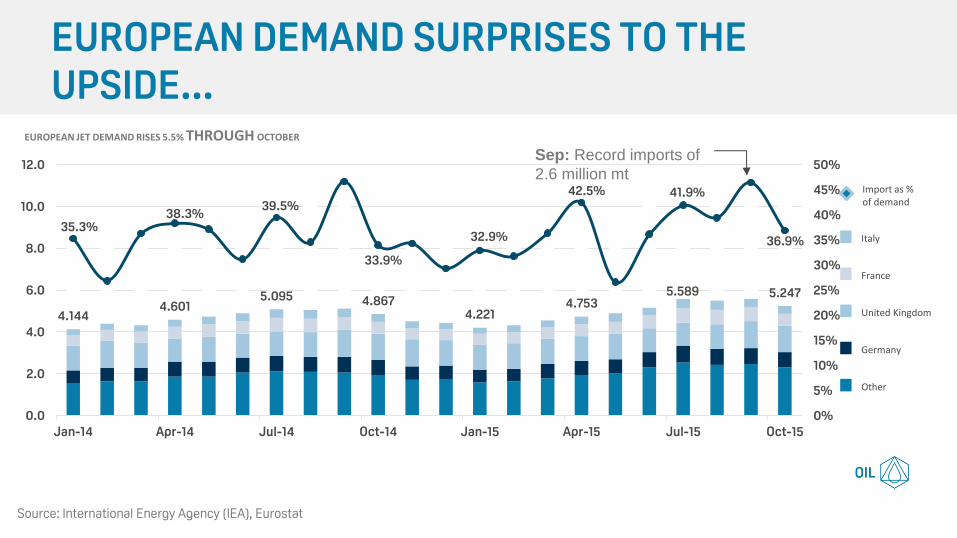
4.144 4.601
5.095 4.867 4.221
4.753 5.589 5.247
35.3% 38.3%
39.5%
33.9%
32.9%
42.5% 41.9%
36.9%
0%
5%
10%
15%
20%
25%
30%
35%
40%
45%
50%
0.0
2.0
4.0
6.0
8.0
10.0
12.0
Jan-14 Apr-14 Jul-14 Oct-14 Jan-15 Apr-15 Jul-15 Oct-15
EUROPEAN DEMAND SURPRISES TO THE UPSIDE...
Source: International Energy Agency (IEA), Eurostat
Sep: Record imports of
2.6 million mt
EUROPEAN JET DEMAND RISES 5.5% THROUGH OCTOBER
Other
Germany
United Kingdom
France
Italy
Import as % of demand

UK NOW HUGELY RELIANT ON IMPORTS
0
2
4
6
8
10
12
14
1998 1999 2000 2001 2002 2003 2004 2005 2006 2007 2008 2009 2010 2011 2012 2013 2014 2015
Mil
lio
n t
on
ne
s
Imports Domestic Production
Source: UK DECC
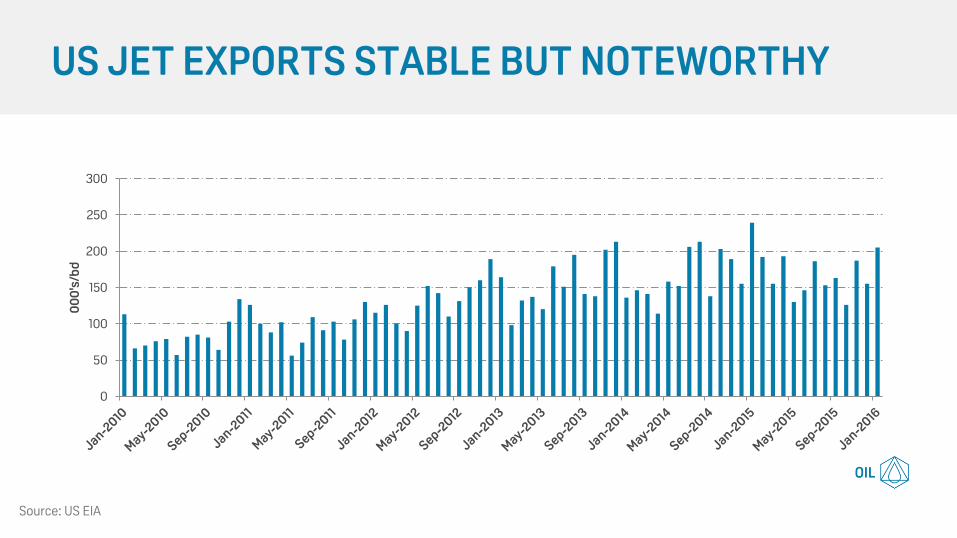
US JET EXPORTS STABLE BUT NOTEWORTHY
0
50
100
150
200
250
300
00
0's
/bd
Source: US EIA
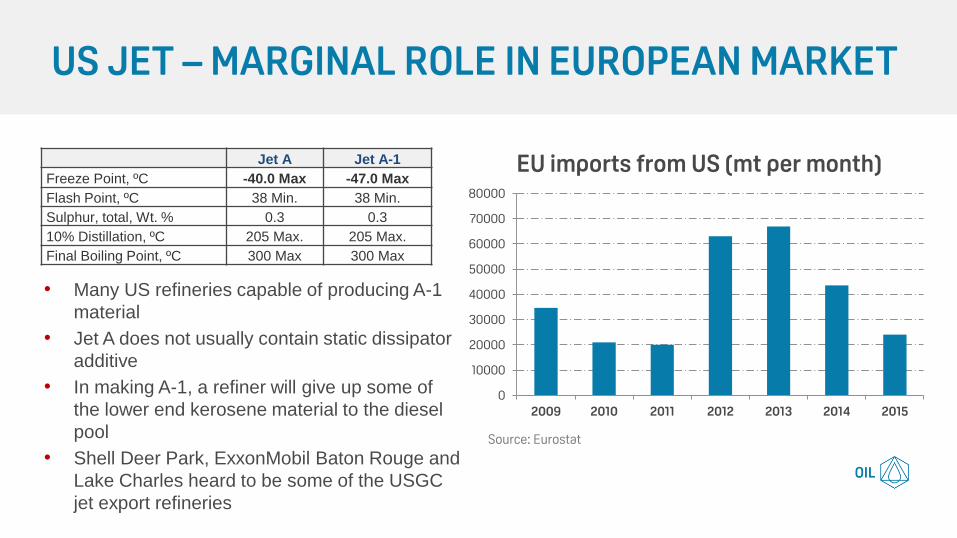
US JET – MARGINAL ROLE IN EUROPEAN MARKET
Jet A Jet A-1
Freeze Point, ºC -40.0 Max -47.0 Max
Flash Point, ºC 38 Min. 38 Min.
Sulphur, total, Wt. % 0.3 0.3
10% Distillation, ºC 205 Max. 205 Max.
Final Boiling Point, ºC 300 Max 300 Max
• Many US refineries capable of producing A-1
material
• Jet A does not usually contain static dissipator
additive
• In making A-1, a refiner will give up some of
the lower end kerosene material to the diesel
pool
• Shell Deer Park, ExxonMobil Baton Rouge and
Lake Charles heard to be some of the USGC
jet export refineries
0
10000
20000
30000
40000
50000
60000
70000
80000
2009 2010 2011 2012 2013 2014 2015
EU imports from US (mt per month)
Source: Eurostat
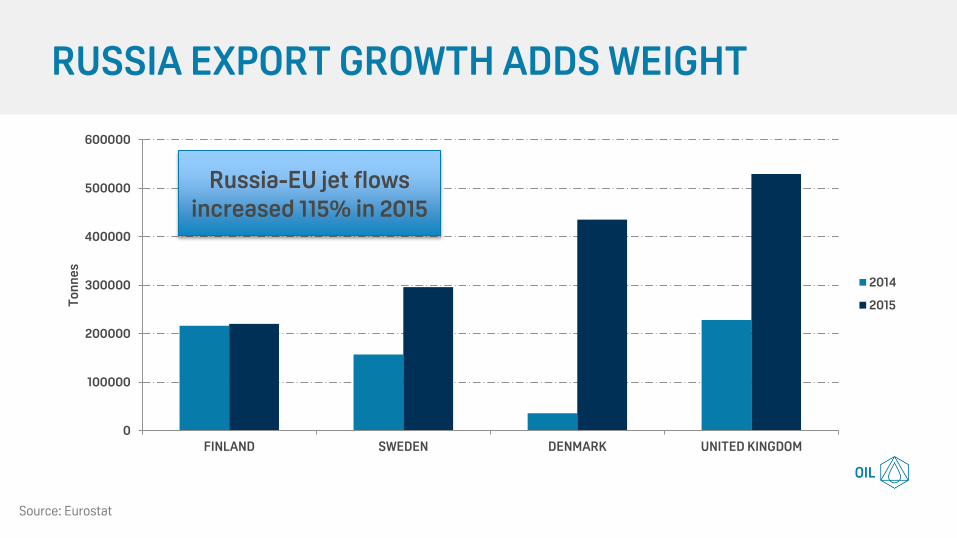
RUSSIA EXPORT GROWTH ADDS WEIGHT
0
100000
200000
300000
400000
500000
600000
FINLAND SWEDEN DENMARK UNITED KINGDOM
To
nn
es
2014
2015
Source: Eurostat
Russia-EU jet flows increased 115% in 2015
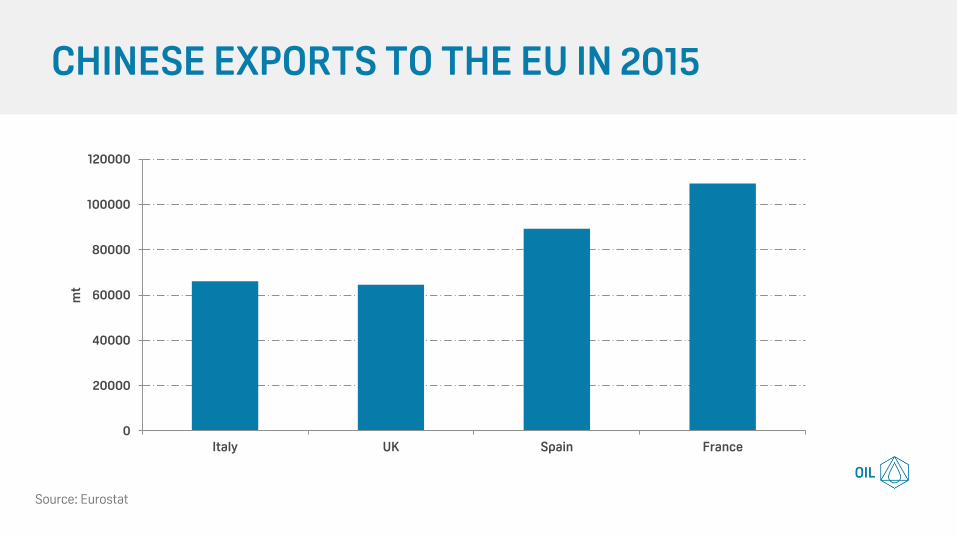
CHINESE EXPORTS TO THE EU IN 2015
0
20000
40000
60000
80000
100000
120000
Italy UK Spain France
mt
Source: Eurostat
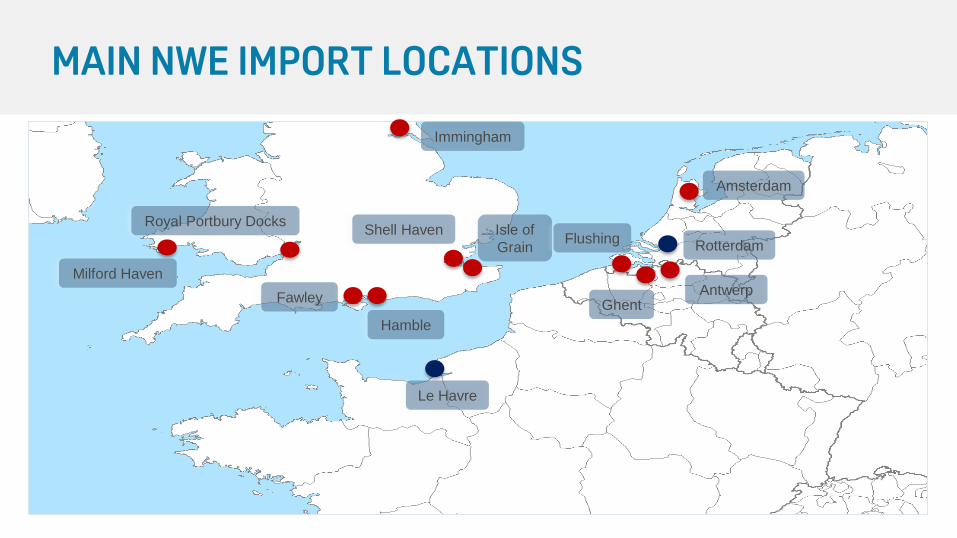
MAIN NWE IMPORT LOCATIONS
Immingham
Shell Haven
Isle of
Grain
Royal Portbury Docks
Hamble
Fawley
Le Havre
Ghent
Rotterdam
Amsterdam
Antwerp
Flushing
Milford Haven
• Puma Energy buying Milford Haven from Murco
• Isle of Grain and Shellhaven
• CLH buying GPSS in UK
• Vitol investment in Antwerp storage
• Floating storage
PORT INFRASTRUCTURE DEVELOPMENTS
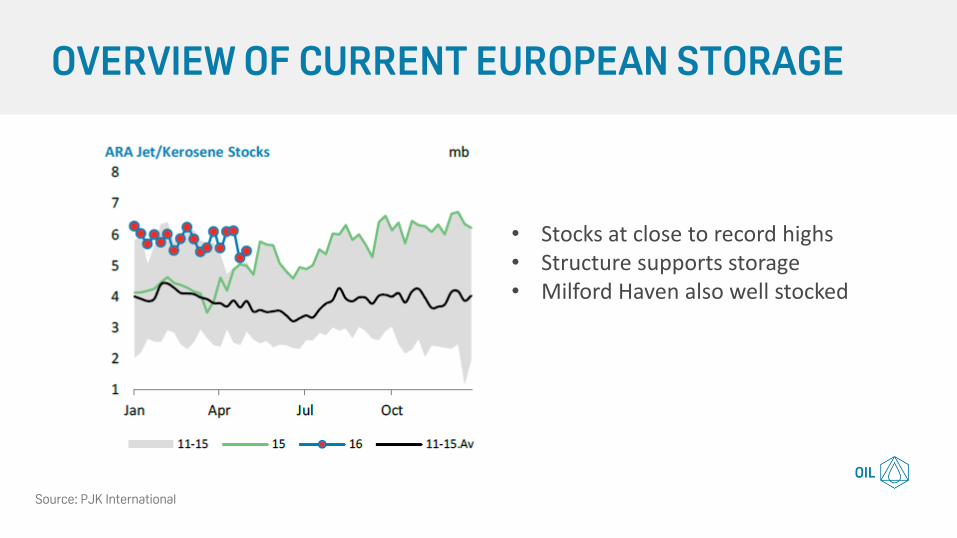
OVERVIEW OF CURRENT EUROPEAN STORAGE
• Stocks at close to record highs • Structure supports storage • Milford Haven also well stocked
Source: PJK International
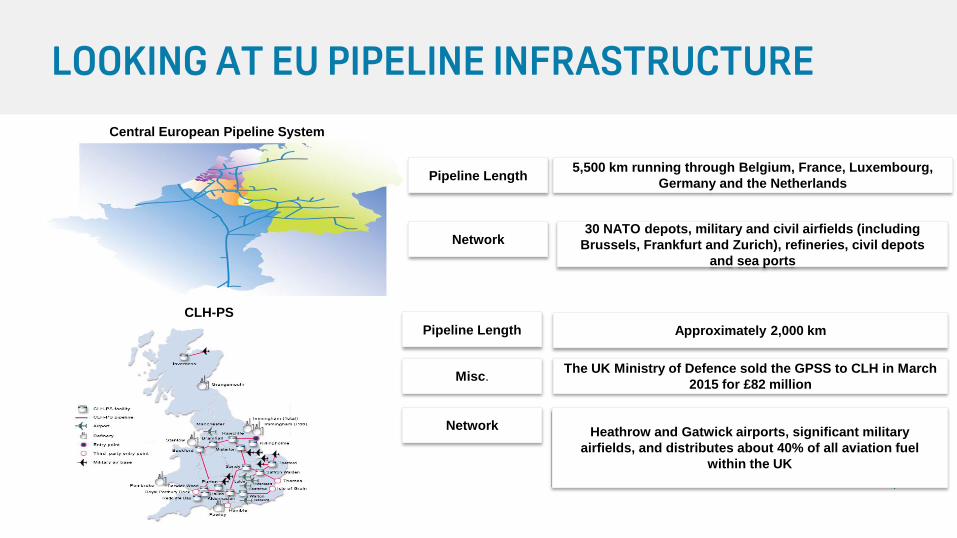
LOOKING AT EU PIPELINE INFRASTRUCTURE
5,500 km running through Belgium, France, Luxembourg,
Germany and the Netherlands Pipeline Length
30 NATO depots, military and civil airfields (including
Brussels, Frankfurt and Zurich), refineries, civil depots
and sea ports
Network
Approximately 2,000 km Pipeline Length
Heathrow and Gatwick airports, significant military
airfields, and distributes about 40% of all aviation fuel
within the UK
Network
The UK Ministry of Defence sold the GPSS to CLH in March
2015 for £82 million Misc.
Central European Pipeline System
CLH-PS
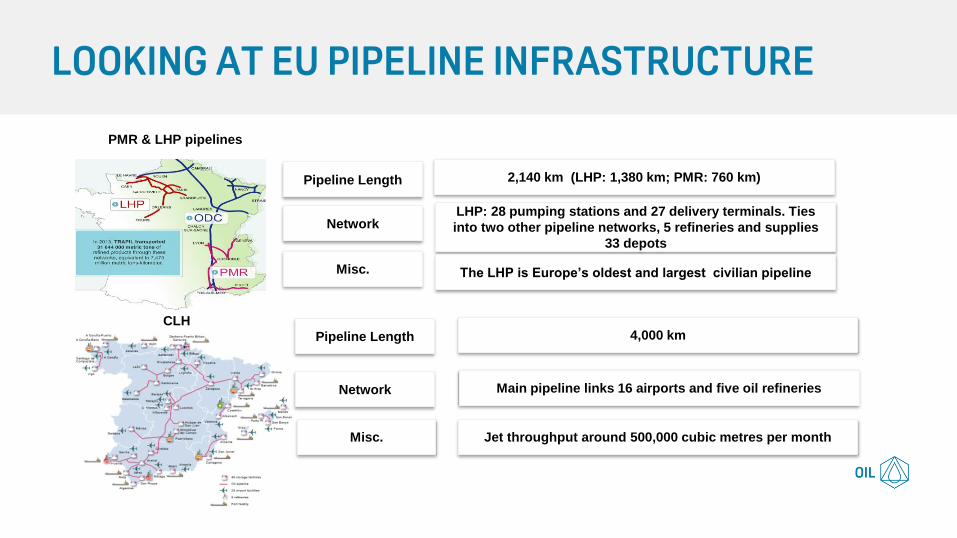
LOOKING AT EU PIPELINE INFRASTRUCTURE
2,140 km (LHP: 1,380 km; PMR: 760 km) Pipeline Length
LHP: 28 pumping stations and 27 delivery terminals. Ties
into two other pipeline networks, 5 refineries and supplies
33 depots
Network
The LHP is Europe’s oldest and largest civilian pipeline Misc.
Pipeline Length 4,000 km
Network Main pipeline links 16 airports and five oil refineries
Misc. Jet throughput around 500,000 cubic metres per month
PMR & LHP pipelines
CLH
• High refinery margins lead to higher domestic output
• Middle East remains largest supply to European market
• New supplies from US, Russia and China providing competition
• Infrastructure investments provide more competition of imports
• Complex pipeline infrastructure serves industry well
CONCLUSIONS


