
200 sec.
annual report2
00
8
I n c o r p o r a t e d re s e a r c h In s t i t u t i o n s f o r S e i s m o l o g y
2 Incorporated research Institutions for Seismology
voting MeMbersUniversity of Alabama Andrew Goodliffe • Antonio Rodriguez
University of Alaska, Fairbanks Douglas Christensen • Roger Hansen
University of Arizona Susan Beck • George Zandt
Arizona State University Matt Fouch • Ed Garnero
University of Arkansas at Little Rock Haydar J. Al-Shukri • Hanan Mahdi
Auburn University Lorraine W. Wolf
Boise State University Lee Liberty • James Zollweg
Boston College John Ebel • Alan Kafka
Boston University Colleen Dalton • Ulrich Faul
Brown University Karen Fischer • Donald Forsyth
California Institute of Technology Donald Helmberger • Thomas Heaton
California State University, East Bay Mitchell Craig • Joshua Kerr
University of California, Berkeley Barbara Romanowicz • Lane Johnson
University of California, Los Angeles Paul Davis
University of California, Riverside Stephen K. Park • David D. Oglesby
University of California, San Diego Gabi Laske • Jon Berger
University of California, Santa Barbara Chen Ji • Toshiro Tanimoto
University of California, Santa Cruz Thorne Lay • Susan Schwartz
Carnegie Institution of Washington Paul Silver • Selwyn Sacks
University of Colorado, Boulder Anne Sheehan • Mike Ritzwoller
Colorado School of Mines Roel Snieder • Thomas M. Boyd
Columbia University James Gaherty • Felix Waldhauser
University of Connecticut Vernon F. Cormier • Lanbo Liu
Cornell University Muawia Barazangi • Larry Brown
University of Delaware Susan McGeary
Duke University Eylon Shalev
Florida International University Dean Whitman
University of Florida Raymond Russo • Joseph Meert
University of Georgia Robert Hawman • James Whitney
Georgia Institute of Technology Zhigang Peng • Andrew Newman
Harvard University Miaki Ishii • Adam Dziewonski
University of Hawaii at Manoa Robert Dunn • Milton Garces
University of Houston Aibing Li
Idaho State University
IGPP/Lawrence Livermore National Laboratory Bill Walter • Peter Goldstein
IGPP/Los Alamos National Laboratory Hans Hartse • Leigh House
University of Illinois at Urbana Champaign Wang-Ping Chen • Xiaodong Song
Indiana University Gary L. Pavlis • Michael Hamburger
Indiana University/Purdue University at Fort Wayne Dipak Chowdhury
University of Kansas Ross A. Black
Kansas State University Charles Oviatt
University of Kentucky Edward W. Woollery • Zhenming Wang
Lamar University Joseph Kruger • James Jordan
Lawrence Berkeley Laboratory Don W. Vasco • E. L. Majer
Lehigh University Anne Meltzer • Stéphane Sol
Louisiana State University Juan Lorenzo • Roy Dokka
Macalester College John P. Craddock • Karl R. Wirth
Massachusetts Institute of Technology Robert Dirk van der Hilst • Bradford H. Hager
University of Memphis Heather DeShon • Beatrice Magnani
Miami University of Ohio Michael Brudzinski • Brian Currie
University of Miami Tim Dixon • Falk Amelung
University of Michigan Jeroen Ritsema • Larry Ruff
Michigan State University Kazuya Fujita • David W. Hyndman
Michigan Technological University Wayne D. Pennington • Gregory P. Waite
University of Minnesota Justin Revenaugh • Val Chandler
University of Missouri Eric Sandvol • Mian Liu
Missouri University of Science and Technology Stephen Gao • Kelly H. Liu
Montana Tech of the University of Montana Michael Stickney • Marvin Speece
University of Nevada, Las Vegas Jim O'Donnell
University of Nevada, Reno Glenn Biasi • John Louie
University of New Orleans Abu K.M. Sarwar
New Mexico Institute of Mining & Technology Richard C. Aster • Susan Bilek
New Mexico State University James Ni • Thomas Hearn
North Carolina State University DelWayne Bohnenstiehl • James Hibbard
State University of New York at Binghamton Francis T. Wu • Jeff Barker
State University of New York at Stony Brook William Holt • Daniel Davis
University of North Carolina, Chapel Hill Jonathan Lees • Jose Rial
Northern Illinois University Paul Stoddard • Philip Carpenter
Northwestern University Suzan van der Lee • Seth Stein
The University of Oklahoma Randy Keller • Roger Young
Oklahoma State University Surinder Sahai • Ibrahim Cemen
University of Oregon Eugene Humphreys • Doug Toomey
Oregon State University Anne Trehu • John Nabelek
Pennsylvania State University Chuck Ammon • Andy Nyblade
Princeton University Frederik Simons • Robert Phinney
University of Puerto Rico at Mayagüez Christa von Hillebrandt • Eugenio Asencio
Purdue University Lawrence W. Braile • Robert Nowack
Rensselaer Polytechnic Institite Steven Roecker • Robert McCaffrey
Rice University Alan R. Levander • Dale Sawyer
University of Rochester Cindy Ebinger • John Tarduno
Rutgers University Vadim Levin • Michael J Carr
Saint Louis University Lupei Zhu • Keith Koper
San Diego State University Robert Mellors • Steven M. Day
San Jose State University Donald L. Reed • Richard Sedlock
University of South Carolina Tom Owens • Pradeep Talwani
University of Southern California David Okaya • Thomas H. Jordan
Southern Methodist University Brian Stump • Eugene T. Herrin
Stanford University Simon Klemperer • Jesse Lawrence
Syracuse University Jeffrey A. Carson
University of Tennessee Richard T. Williams
Texas A&M University Richard Gibson • Philip D. Rabinowitz
Texas Tech University Harold Gurrola • Calvin Barnes
University of Texas at Austin Clifford A. Frohlich • Stephen P. Grand
University of Texas at Dallas George McMechan • John Ferguson
University of Texas at El Paso Kate Miller
University of Tulsa Kumar Ramachandran • Peter J. Michael
University of Utah Robert B. Smith • Gerald T. Schuster
Virginia Polytechnic Institute John Hole • Ying Zhou
Central Washington University Timothy Melbourne • Charles Rubin
University of Washington Kenneth Creager • John Vidale
Washington University, St. Louis Douglas Wiens • Michael Wysession
West Virginia University Thomas H. Wilson • Robert Behling
University of Wisconsin, Madison Clifford Thurber • Harold Tobin
University of Wisconsin, Milwaukee Keith A. Sverdrup • Brett Ketter
University of Wisconsin, Oshkosh Timothy Paulsen
Woods Hole Oceanographic Institution Ralph Stephen • Alan Chave
Wright State University Ernest C. Hauser • Paul J. Wolfe
University of Wyoming Scott B. Smithson
Yale University Jeffrey J. Park
Us AffiliAtesMaryland Geological Survey James P. Reger
Naval Air Weapons Station, Geothermal Program Office Francis Monastero
edUcAtionAl AffiliAtesArizona Western College Michael Conway
the Consortiumthe IrIS management structure is an interface between the scientific community, funding agencies, and the programs of IrIS. the structure is designed to focus scientific talent on common objectives, to encourage broad participation, and to efficiently manage IrIS programs.
educational and not-for-profit institutions in the united States, with a major commitment to research in seismology and related fields, may become Voting Members of IrIS. each Voting Member appoints a representative to receive notices and represent its interests at IrIS meetings. each representative, or appointed alternate, of a Voting Member is entitled to
vote at the annual meeting of Members and in elections of the Board of Directors.
the Voting Members or the Board of Directors may elect not-for-profit organizations in the united States that are engaged in seismological research and development as u.S. affiliates, not-for-profit institutions in the united States with a commitment to teaching in earth science including seismology as educational affiliates, and institutions outside of the united States as Foreign affiliates. each affiliate may send a nonvoting representative to IrIS Member meetings.
*new members in bold
2008 annual report 3
Bridgewater State College Robert Cicerone
California State University, Northridge Gerry Simila
Central Wyoming College Suzanne M (Suki) Smaglik
College of Charleston Steve JaumeDiné College Margaret Mayer
Eckerd College Laura Reiser Wetzel
IslandWood Greg Geehan
University of Missouri, Kansas City Tina Niemi
Moravian College Joseph Gerencher
State University of New York at Potsdam Frank Revetta
University of Pittsburgh William Harbert
University of Portland Rev. Ronald Wasowski
University of Wisconsin, Whitewater Prajukti Bhattacharyya
Trinity University Glenn C Kroeger
Waubonsee Community College David Voorhees
Westminster College Alan Goldin
foreign AffiliAtesAcademy of Sciences, Seismological Center, Albania Betim Muço
Instituto Nacional de Prevención Sísmica (INPRES), Argentina Patricia Alvarado
Central Queensland University, Australia Mike Turnbull
Australian National University Brian Kennett
The University of Queensland, Australia Peter Mora
University of Dhaka, Bangladesh Humayun Akhter
Royal Observatory of Belgium Michel van Camp
Observatório Nacional, Brazil Jorge Luis de Souza
Universidade de São Paulo, Brazil Marcelo Assumpção
Universidade de Brasilia, Brazil Joao Willy Rosa
Univ. Federal do Rio Grande do Norte, Brazil Joaquim Mendes Ferreira
Institute of Geophysics of the Bulgarian Academy of Sciences Svetlana Nikolova
Ecole Polytechnique, Canada
GEOTOP, Canada Fiona Darbyshire
Geological Survey of Canada Isa Asudeh
University of British Columbia, Canada Michael G. Bostock
University of Calgary, Canada David Eaton
University of Saskatchewan, Canada Igor B. Morozov
Simon Fraser University, Canada Andrew Calvert
University of Toronto, Ontario, Canada Kin-Yip Chun
Universidad Nacional, Costa Rica Marino Protti
Geophysical Institute, Czech Republic Jan Zednik
Masaryk University, Czech Republic Jan Svancara
Geological Survey of Denmark & Greenland Soren Gregersen
National Research Institute of Astronomy and Geophysics, Egypt Amin Ibrahim Hussein
University of Helsinki, Finland Pekka Heikkinen
University of Oulu, Finland Elena Kzlovskaya
Geosciences Azur, France Guust Nolet
Institut de Physique du Globe de Paris (IPGP), France Geneviève Roult
Universite Montpellier II, France Goetz Bokelmann
Seismological Monitoring Center of Georgia Tea Godoladze
AWE Blacknest, Great Britian Sheila Peacock
British Geological Survey, Great Britain Brian Baptie
University of Bristol, Great Britian George Helffrich
University of Cambridge, Great Britian Keith Priestley
University of Leeds, Great Britian Roger Clark
University of Leicester, Great Britian Alex Brisbourne
Hungarian Geological Survey Tamás Fancsik
International Institute of Earthquake Engineering and Seismology, Iran Manouchehr Bahavar
Geophysical Institute of Israel Rami Hofstetter
Instituto Nazionale di Geofisica e Vulcanologia, Italy Salvatore Mazza
National Institute of Oceanography and Experimental Geophysics, Italy Enrico Priolo
Jordan Seismological Observatory Tawfiq Al-Yazjeen
Indian Institute of Technology, Kharagpur Supriyo Mitra
Centro de Investigacion Cientifica y de Educacion Superior de Ensenada, Mexico Cecilio J. Rebollar
Universidad Nacional Autónoma de México Carlos Mendoza
KNMI /ORFEUS, Netherlands Bernard Dost
Technical University of Delft, Netherlands Kees Wapenaar
Utrecht University, Netherlands Hanneke Paulssen
Institute of Geological & Nuclear Sciences, New Zealand Mark Peter Chadwick
University of Otago, New Zealand Andrew Gorman
Victoria University, Institute of Geophysics, New Zealand Martha Kane Savage
University of Bergen, Norway Eystein S. Husebye
Quaid-i-Azam University, Pakistan Mona Lisa
Centro Regional de Sismología para América del Sur, Peru Daniel Huaco Oviedo
Instituto Geofisico del Peru Edmundo Norabuena
China Earthquake Networks Center, PRC Ruifeng Liu
Institute of Geomechanics, Chinese Academy Geological Sciences, PRC Meijian An
Institute of Earthquake Science, CEA, PRC Qi-fu Chen
Institute of Geology, CEA, PRC Qiyuan Liu
Institute of Geology and Geophysics, Chinese Academy of Sciences, PRC Ai Yinshuang
Institute of Geophysics, CEA, PRC Gongwei Zhou
Hong Kong Observatory, PRC Wong Wing Tak
University of Hong Kong, PRC Lung Sang Chan
Nanjing University, PRC Liang-shu Wang
Peking University, PRC Shao Xian Zang
Tongji University, PRC Kin-Yip Chun
University of Science and Technology of China, PRC Sidao Ni
Institute of Geophysics, Polish Academy of Sciences Pawel Wiejacz
Instituto Superior Tecnico, Portugal Joao F.B.D. Fonseca
Universidade do Porto, Portugal Rui Carneiro-Barros
Hanyang University, Seoul, Republic of Korea So Gu Kim
Meteorological Research Institute, KMA, Republic of Korea Young-Soo Jeon
University of Bucharest, Romania Marian Ivan
National Institute for Earth Physics, Romania Andrei Bala
Geophysical Survey of the Russian Academy of Sciences Alexey A. Malovichko
Institute of Dynamics of Geospheres, Russian Academy of Sciences Vitaly V. Adushkin
Kuban State University, Russia Vladimir A. Babeshko
King Fahd University Petroleum and Minerals, Saudi Arabia Ali Öncel
Council for Geoscience, South Africa Artur Cichowicz
Instituto de Ciències de la Terra ‘Jaume Almera’, Spain Antonio Villaseñor
Swiss Federal Institute of Technology, Switzerland Domenico Giardini
National Central University, Taiwan Kuo-Fong Ma
National Taiwan University Shu-Huei Hung
Academia Sinica, Institute of Earth Sciences, Taiwan Bor-Shouh Huang
Mahidol University, Thailand Passakorn Pananont
General Directorate of Disaster Affairs, Turkey Yildiz Iravul
Istanbul Technical University, Turkey Tuncay Taymaz
Kandilli Observatory, Bogazici University, Turkey Nurcan Özel
Tubitak-Marmara Research Center, Turkey M. Namik Yalçin
University of the West Indies Richard Roberts
4 Incorporated research Institutions for Seismology
Statement From the Chair
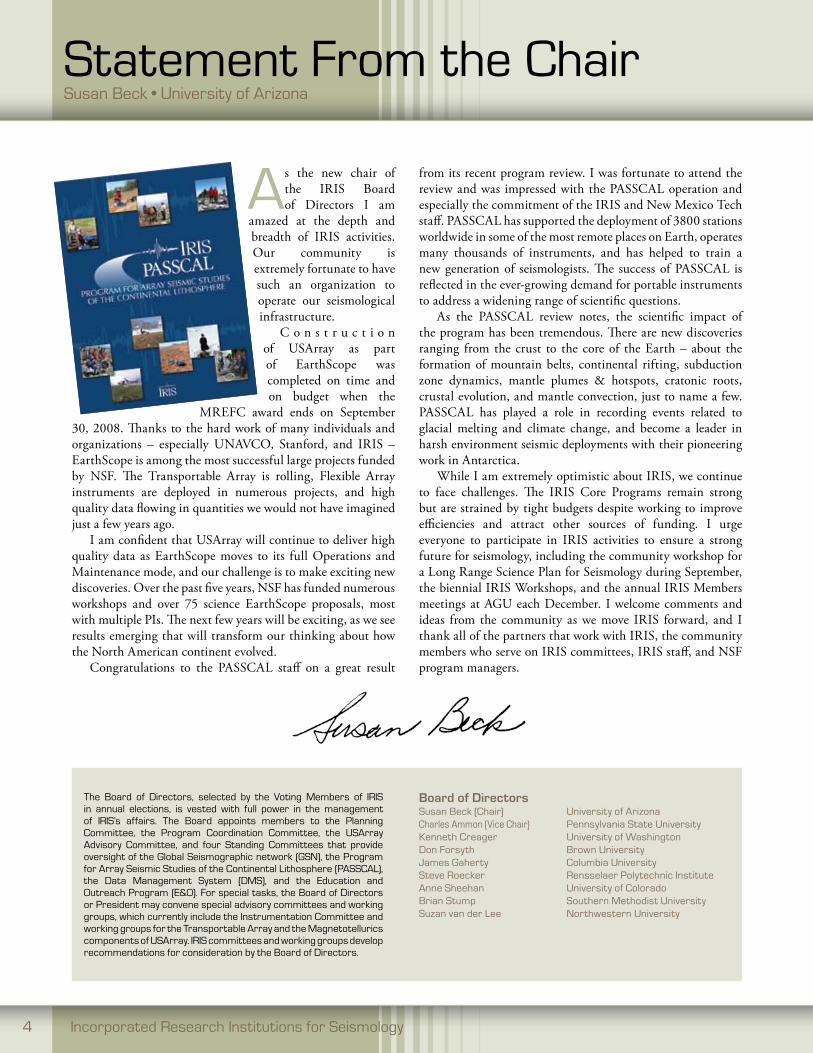
as the new chair of the IRIS Board of Directors I am
amazed at the depth and breadth of IRIS activities. Our community is extremely fortunate to have such an organization to operate our seismological infrastructure.
C o n s t r u c t i o n of USArray as part of EarthScope was completed on time and on budget when the
MREFC award ends on September 30, 2008. Thanks to the hard work of many individuals and organizations – especially UNAVCO, Stanford, and IRIS – EarthScope is among the most successful large projects funded by NSF. The Transportable Array is rolling, Flexible Array instruments are deployed in numerous projects, and high quality data flowing in quantities we would not have imagined just a few years ago.
I am confident that USArray will continue to deliver high quality data as EarthScope moves to its full Operations and Maintenance mode, and our challenge is to make exciting new discoveries. Over the past five years, NSF has funded numerous workshops and over 75 science EarthScope proposals, most with multiple PIs. The next few years will be exciting, as we see results emerging that will transform our thinking about how the North American continent evolved.
Congratulations to the PASSCAL staff on a great result
from its recent program review. I was fortunate to attend the review and was impressed with the PASSCAL operation and especially the commitment of the IRIS and New Mexico Tech staff. PASSCAL has supported the deployment of 3800 stations worldwide in some of the most remote places on Earth, operates many thousands of instruments, and has helped to train a new generation of seismologists. The success of PASSCAL is reflected in the ever-growing demand for portable instruments to address a widening range of scientific questions.
As the PASSCAL review notes, the scientific impact of the program has been tremendous. There are new discoveries ranging from the crust to the core of the Earth – about the formation of mountain belts, continental rifting, subduction zone dynamics, mantle plumes & hotspots, cratonic roots, crustal evolution, and mantle convection, just to name a few. PASSCAL has played a role in recording events related to glacial melting and climate change, and become a leader in harsh environment seismic deployments with their pioneering work in Antarctica.
While I am extremely optimistic about IRIS, we continue to face challenges. The IRIS Core Programs remain strong but are strained by tight budgets despite working to improve efficiencies and attract other sources of funding. I urge everyone to participate in IRIS activities to ensure a strong future for seismology, including the community workshop for a Long Range Science Plan for Seismology during September, the biennial IRIS Workshops, and the annual IRIS Members meetings at AGU each December. I welcome comments and ideas from the community as we move IRIS forward, and I thank all of the partners that work with IRIS, the community members who serve on IRIS committees, IRIS staff, and NSF program managers.
board of directorsSusan Beck (Chair) university of arizonaCharles ammon (Vice Chair) pennsylvania State universityKenneth Creager university of WashingtonDon Forsyth Brown universityJames Gaherty Columbia universitySteve roecker rensselaer polytechnic Instituteanne Sheehan university of ColoradoBrian Stump Southern Methodist universitySuzan van der lee northwestern university
the Board of Directors, selected by the Voting Members of IrIS in annual elections, is vested with full power in the management of IrIS’s affairs. the Board appoints members to the planning Committee, the program Coordination Committee, the uSarray advisory Committee, and four Standing Committees that provide oversight of the Global Seismographic network (GSn), the program for array Seismic Studies of the Continental lithosphere (paSSCal), the Data Management System (DMS), and the education and outreach program (e&o). For special tasks, the Board of Directors or president may convene special advisory committees and working groups, which currently include the Instrumentation Committee and working groups for the transportable array and the Magnetotellurics components of uSarray. IrIS committees and working groups develop recommendations for consideration by the Board of Directors.
Susan Beck • University of Arizona
2008 annual report 5
the Year in review
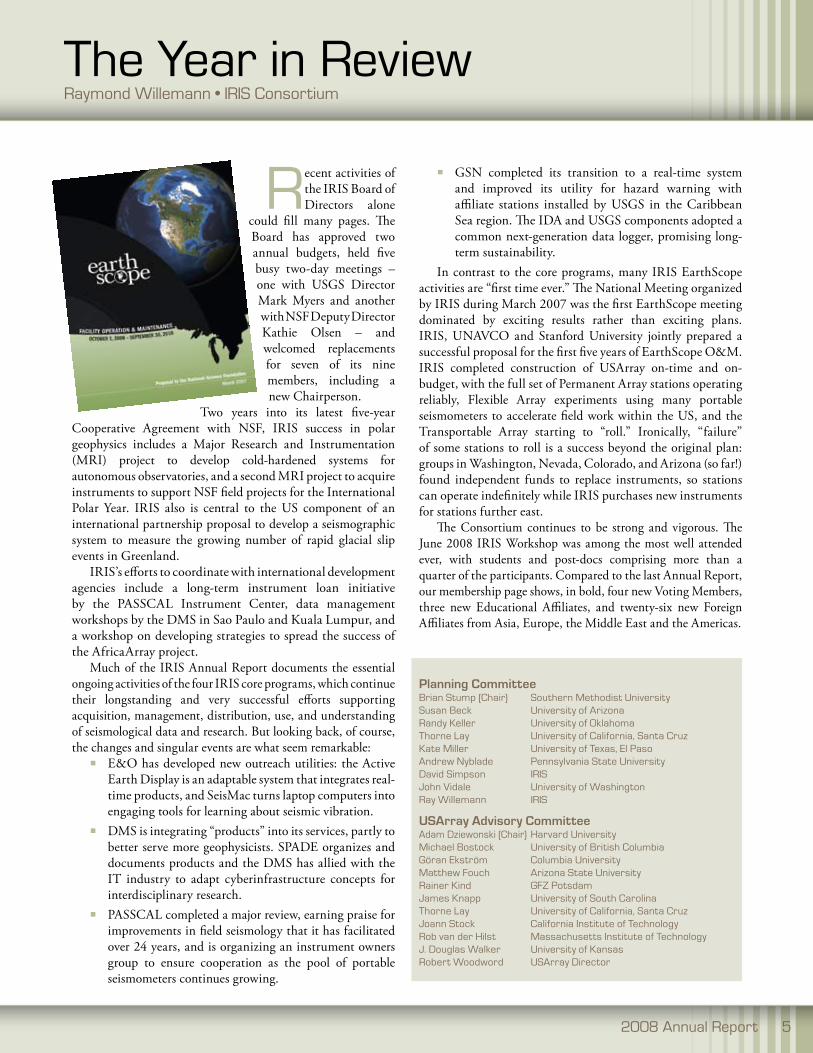
Recent activities of the IRIS Board of Directors alone
could fill many pages. The Board has approved two annual budgets, held five busy two-day meetings – one with USGS Director Mark Myers and another with NSF Deputy Director Kathie Olsen – and welcomed replacements for seven of its nine members, including a new Chairperson.
Two years into its latest five-year Cooperative Agreement with NSF, IRIS success in polar geophysics includes a Major Research and Instrumentation (MRI) project to develop cold-hardened systems for autonomous observatories, and a second MRI project to acquire instruments to support NSF field projects for the International Polar Year. IRIS also is central to the US component of an international partnership proposal to develop a seismographic system to measure the growing number of rapid glacial slip events in Greenland.
IRIS’s efforts to coordinate with international development agencies include a long-term instrument loan initiative by the PASSCAL Instrument Center, data management workshops by the DMS in Sao Paulo and Kuala Lumpur, and a workshop on developing strategies to spread the success of the AfricaArray project.
Much of the IRIS Annual Report documents the essential ongoing activities of the four IRIS core programs, which continue their longstanding and very successful efforts supporting acquisition, management, distribution, use, and understanding of seismological data and research. But looking back, of course, the changes and singular events are what seem remarkable:
E&O has developed new outreach utilities: the Active Earth Display is an adaptable system that integrates real-time products, and SeisMac turns laptop computers into engaging tools for learning about seismic vibration.
DMS is integrating “products” into its services, partly to better serve more geophysicists. SPADE organizes and documents products and the DMS has allied with the IT industry to adapt cyberinfrastructure concepts for interdisciplinary research.
PASSCAL completed a major review, earning praise for improvements in field seismology that it has facilitated over 24 years, and is organizing an instrument owners group to ensure cooperation as the pool of portable seismometers continues growing.
GSN completed its transition to a real-time system and improved its utility for hazard warning with affiliate stations installed by USGS in the Caribbean Sea region. The IDA and USGS components adopted a common next-generation data logger, promising long-term sustainability.
In contrast to the core programs, many IRIS EarthScope activities are “first time ever.” The National Meeting organized by IRIS during March 2007 was the first EarthScope meeting dominated by exciting results rather than exciting plans. IRIS, UNAVCO and Stanford University jointly prepared a successful proposal for the first five years of EarthScope O&M. IRIS completed construction of USArray on-time and on-budget, with the full set of Permanent Array stations operating reliably, Flexible Array experiments using many portable seismometers to accelerate field work within the US, and the Transportable Array starting to “roll.” Ironically, “failure” of some stations to roll is a success beyond the original plan: groups in Washington, Nevada, Colorado, and Arizona (so far!) found independent funds to replace instruments, so stations can operate indefinitely while IRIS purchases new instruments for stations further east.
The Consortium continues to be strong and vigorous. The June 2008 IRIS Workshop was among the most well attended ever, with students and post-docs comprising more than a quarter of the participants. Compared to the last Annual Report, our membership page shows, in bold, four new Voting Members, three new Educational Affiliates, and twenty-six new Foreign Affiliates from Asia, Europe, the Middle East and the Americas.
Planning committeeBrian Stump (Chair) Southern Methodist universitySusan Beck university of arizonarandy Keller university of oklahomathorne lay university of California, Santa CruzKate Miller university of texas, el pasoandrew nyblade pennsylvania State universityDavid Simpson IrISJohn Vidale university of Washingtonray Willemann IrIS
UsArray Advisory committeeadam Dziewonski (Chair) Harvard universityMichael Bostock university of British ColumbiaGöran ekström Columbia universityMatthew Fouch arizona State universityrainer Kind GFZ potsdamJames Knapp university of South Carolinathorne lay university of California, Santa CruzJoann Stock California Institute of technologyrob van der Hilst Massachusetts Institute of technologyJ. Douglas Walker university of Kansasrobert Woodword uSarray Director
Raymond Willemann • IRIS Consortium

GSn
the Global Seismographic Network is a permanent network of state of the art seismological and
geophysical sensors connected by available telecommunications to serve the scientific research and monitoring requirements of our national and international community. All GSN data are freely and openly available to anyone via the Internet. Installed to provide broad, uniform global coverage of Earth, 151 GSN stations are now sited from the South Pole to Siberia and from the Amazon basin to islands in the Indian Ocean, in cooperation with over 100 host organizations and seismic networks in 69 countries worldwide. The GSN coordinates closely with other international networks through the International Federation of Digital Seismograph Networks (FDSN), of which the IRIS is a founding member.
The GSN is primarily operated and maintained through the USGS Albuquerque Seismological Laboratory (ASL) and through the University of California at San Diego IRIS/IDA group. Twenty GSN-Affiliate stations and arrays contribute to the network, including the 9-station USGS Caribbean Network (see Program Highlight) and a new USGS/AFTAC station in Afghanistan. In collaboration with the U.S. National Earthquake Information Center, the GSN and NEIC are principal global sources of data and information for earthquake locations, earthquake hazard mitigation, and earthquake emergency response. In collaboration with National Oceanic and Atmospheric Administration (NOAA) Tsunami Warning Centers and Japanese Meteorological Agency, the GSN provides essential data for tsunami warning response globally. The GSN is an official observing system within the Global Earth Observing System of Systems (GEOSS).
6 Incorporated research Institutions for Seismology
gsn standing committeeXiaodong Song (Chair) university of Illinois urbana, ChampaignSusan Bilek new Mexico techemile okal northwestern universityMiaki Ishii Harvard universitylaura Kong uneSCoDavid McCormack natural resources CanadaJeff McGuire Woods Hole oceanographic InstitutionFenglin niu rice universityJeroen ritsema university of MichiganBill lieth uS Geological Surveyrhett Butler GSn program Manager
rhett Butler and Kent anderson, IrIS Consortium
1/2007–6/2008
& INTERNATIONAL FEDERATION OF DIGITAL SEISMOGRAPHIC NETWORKS
A
A
A
A
A
sμ
A
AffiliateArray
IRISCurrent
I R I S I n t e r n a t i o n a l & N a t i o n a l C o o p e r a t i v e S i t e sGeoscope Japan Mednet Geofon/AWI/BGR/BFO China/USGS Mexico Singapore Botswana Andes Australia USGS AFTAC
A
SMUs
GLOBAL SEISMOGRAPHIC NETWORK6/2008
1/2007–6/2008
+
++
++
+
+
+
+
+
++
++ +++
+
+
++
+
+
+
+
++
++
++++
+
+
+
++
++
+
+
+
++
+
+++
+
+
+
+
+
+ +
++
+++
+
++
+
+
+
+
+++++
+
+
+
+
+
+
+
+
+
-
-
-
-
-
Internet
VSAT
IRIS/NSF NWS USGS China Australia Russia AFTAC/DoD CTBTO GSN Host
GSN COMMUNICATIONS
+ ++ ++ +
6/2008
Data shipped via mail-
Delayedor blocked

Eight new seismic stations were installed in 2007-08 including Kiribati (2), Cuba, Antigua and Barbuda, Jamaica, and Turks and Caicos Islands, and Canary Islands by ASL, and Madagascar by IRIS/IDA. About a third of the GSN are island stations. All new sites have real-time telemetry. GSN stations were restored to operational status on Wake, Johnston, and Kiritimati Atolls by ASL. Caltech re-located its Pasadena station. The Hawaii-2 Observatory was closed. Site preparation for a new GSN site at the tip of Baja Mexico was completed, with installation awaiting customs clearance. The IRIS/IDA group upgraded hardware at several sites and prepared for a new site in the United Arab Emirates.
Our transition from air-mailed data media and dial-up telephone access to continuous, real time telemetry of all GSN data is nearly complete. Only 5 sites now lack real-time telemetry (~96% connectivity). Fifteen new or upgraded telemetry circuits were established in 2007-08. Internet connectivity to GSN stations was established by USGS in Ethiopia and Afghanistan, by IRIS/IDA in the Madagascar, Saudi Arabia, and Fiji. Caribbean Network stations use VSAT telemetry, and the new site in the Canary Islands utilizes telemetry provided by our Spanish hosts.
The GSN is working closely with the International Monitoring System (IMS) for the Comprehensive Nuclear Test Ban Treaty Organization (CTBTO). Thirty-one GSN stations and five GSN Affiliates are now linked directly to the CTBTO International Data Centre, mostly via their global communication infrastructure (GCI). This shared satellite infrastructure enables remote operations, maintenance, and quality control for the IMS, and provides for real-time GSN data access for the scientific community. At eleven sites the GCI link is available as a redundant backup for GSN telecommunication infrastructure. New GCI VSAT links have been established this past year in Gabon, Sri Lanka, and Brazil.
In the Pacific, close coordination with the NOAA National Weather Service (NWS) brings GSN data directly to the Oahu hub at the Pacific Tsunami Warning Center (PTWC). From PTWC the GSN data are forwarded to the Internet. NWS is funding the satellite space-segment costs for GSN data access. Three new VSAT systems installed by USGS in the central Pacific at GSN stations in Kiribati—Tarawa, Kanton, and Kiritmati—now augment coverage from Western Samoa, Tuvalu, and Papua New Guinea, Johnston and Midway Atolls, and Easter Island.
With funding from GSN, Metrozet LLC and UC Berkeley have successfully developed new feedback electronics for the STS-1 seismometer, the primary surface sensor for GSN which is no longer
in production or supported by the manufacturer, Streckeisen. These STS1-E300 units can replace existing Streckeisen VBB electronics, and serve to upgrade STS-1 BB systems. GSN will begin to deploy E300 units in 2008 to repair/replace STS-1 electronics. ASL has completed a new isolated installation technique for the STS-2 seismometer, using a warpless baseplate and steel bell jar, which will permit the replacement and re-location of STS-1s at GSN sites that have relatively high background noise. UCSD IDA and USGS ASL have collaborated in the design and development of standard interface boxes for both sensor interfaces and power distribution for the GSN next-generation data acquisition system (NGS). NGS are being fielded in 2008 and have been already deployed at 7 sites by ASL and IDA.
Many GSN sites have evolved into geophysical observatories. A variety of geophysical instrumentation now uses GSN logistical and telemetry infrastructure, including GPS, gravimeters, magnetometers, microbarographs, and meteorological sensors. Microbarographs were installed in 2007-08 at GSN stations in Madagascar, Costa Rica, Fiji and in the central Pacific at Tarawa and Kanton. The 54 microbarographs installed globally at GSN sites are the largest open data source of its kind. In collaboration with IRIS/IDA and sharing GSN site and telecommunications infrastructure, UNAVCO installed real-time GPS at the GSN station in Madagascar, and GeoForschungsZentrum Potsdam installed a geomagnetic observatory at the GSN station on St Helena Island in the South Atlantic.
The Earthscope USArray Permanent Array continues its high performance as the fiducial reference network for USArray, and as a component of Advanced National Seismic System (ANSS) Backbone. Under joint ANSS and GSN funding in 2007, three new Backbone stations in Montana, Utah, and Mississippi were completed.
2008 annual report 7
Seismologists and engineers all have a part to play in the installations.
Seismic instruments at the Canary Islands installation.
the uSGS Caribbean Seismic networklind Gee1, Dan Mcnamara2, Jean Weaver3, Harley Benz2, Doug Ford4, Gary Gyure4.
8 Incorporated research Institutions for Seismology
Jamaica, Cuba, Turks and Caicos, Domincan Republic, Antigua-Barbuda, Grenada, Barbados, Panama, Honduras—what an itinerary! Palm trees, beaches,
iguanas … and seismic stations.Over the last three years, the U.S. Geological Survey (USGS)
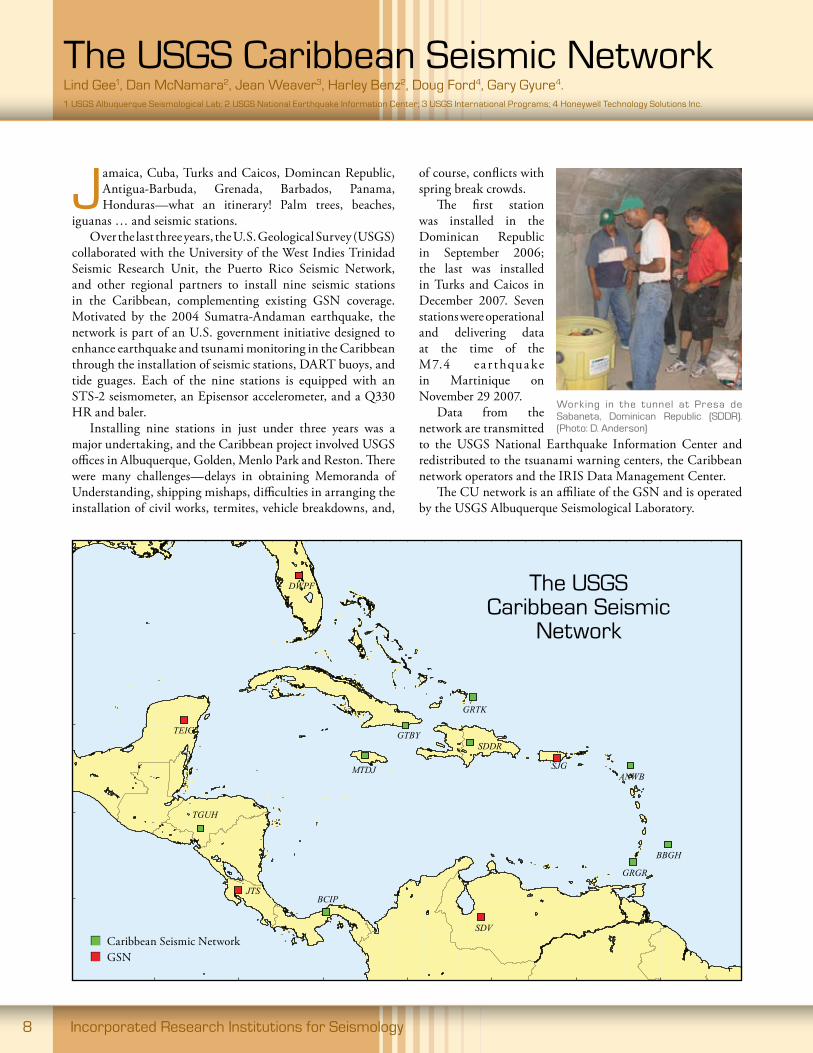
collaborated with the University of the West Indies Trinidad Seismic Research Unit, the Puerto Rico Seismic Network, and other regional partners to install nine seismic stations in the Caribbean, complementing existing GSN coverage. Motivated by the 2004 Sumatra-Andaman earthquake, the network is part of an U.S. government initiative designed to enhance earthquake and tsunami monitoring in the Caribbean through the installation of seismic stations, DART buoys, and tide guages. Each of the nine stations is equipped with an STS-2 seismometer, an Episensor accelerometer, and a Q330 HR and baler.
Installing nine stations in just under three years was a major undertaking, and the Caribbean project involved USGS offices in Albuquerque, Golden, Menlo Park and Reston. There were many challenges—delays in obtaining Memoranda of Understanding, shipping mishaps, difficulties in arranging the installation of civil works, termites, vehicle breakdowns, and,
of course, conflicts with spring break crowds.
The first station was installed in the Dominican Republic in September 2006; the last was installed in Turks and Caicos in December 2007. Seven stations were operational and delivering data at the time of the M7.4 ea r thqua ke in Martinique on November 29 2007.
Data from the network are transmitted to the USGS National Earthquake Information Center and redistributed to the tsuanami warning centers, the Caribbean network operators and the IRIS Data Management Center.
The CU network is an affiliate of the GSN and is operated by the USGS Albuquerque Seismological Laboratory.
GTBY
GRTK
BCIP
TGUH
MTDJ
SDDR
ANWB
BBGH
GRGR
SJG
TEIG
DWPF
SDV
JTS
Caribbean Seismic Network GSN
Working in the tunnel at presa de Sabaneta, Dominican republic (SDDr). (photo: D. anderson)
the uSGS Caribbean Seismic
network
1 uSGS albuquerque Seismological lab; 2 uSGS national earthquake Information Center; 3 uSGS International programs; 4 Honeywell technology Solutions Inc.

2008 annual report 9
the Caribbean seismic network is a collaborative effort among the uSGS and:
Jamaican Seismic network: university of the West Indies, Mona
Jamaica Ministry of local Government and environment
turks and Caicos Department of Disaster Management
antigua and Barbuda national office of Disaster Services
Grenada national Disaster Management agency
Barbados Coastal Management authority
Barbados Ministry of Home affairs
puerto rico Seismic network
Seismic research unit of the university of the West Indies, trinidad
Departamento de Fisica, universidad nacional autonoma de Honduras
Honduras Ministry of natural resources
Instituto de Geociencias, universidad de panama
Smithsonian tropical research Institute
uS navy, Guantanamo Bay naval Base
Instituto Sismológico universitario universidad autónoma de Santo Domingo
Santa Domingo Ministry of environment and natural resources
national oceanic and atmospheric administration
Incorporated research Institutions in Seismology
Station performance probability density function (pDF) for Gun Hill, Barbados (BBGH). the short periods (left) show a diurnal variation typical of most Caribbean sites, while the long period performance (right) approaches the low noise model. (D. Mcnamara)
Station operator training at the aSl, July 2007. (photo: t. Kromer)
Completed station at tegucigalpa, Honduras (tGuH). (photo: D. Croker)
Hard at work in Isla Barro Colorado, panama (BCIp). (photo: M. robertson)
pASSCAL provides and supports a range of portable seismographic instrumentation and expertise to diverse scientific and educational communities. Scientific
data collected with PASSCAL instruments are required to be archived at the IRIS Data Management Center. The access to professionally supported state-of-the-art equipment and archived, standardized data has revolutionized the way seismological research is conducted in the US. By integrating planning, logistical, instrumentation and engineering services and supporting the efforts with full-time professional staff, PASSCAL has enabled the seismology community to mount hundreds of large-scale experiments throughout the United
States and around the globe at scales far exceeding the capabilities of individual research groups. Individual scientists and project teams can now focus on optimizing science productivity, rather than supporting basic technology and engineering. Small departments and institutions can now compete with large ones on a equal footing in instrumentation capabilities. Scientists working outside of traditional seismological subfields now have the ability to undertake new and multidisciplinary investigations. Standardized equipment and data formats greatly advanced long-term data archiving and data re-use for novel purposes.
PASSCAL has also influenced academic seismology in all parts of the world explored by US seismologists, and the program has on many occasions provided significant instrumentation to spur or augment international collaborations. Many of the standards and facilities pioneered by IRIS for instrumentation and data collection, archival and open exchange have been adopted by other groups in the United States and by seismological networks and organizations worldwide. This open-data culture has been embraced by other US data collection groups, and obligatory data archival requirements and standards have increasingly been stipulated by federal agencies.
PASSCAL facilitates portable array seismology world-wide with end-to-end experiment support services, state-of-the-art portable seismic instrumentttion, and advanced field and database management tools. Over its history, PASSCAL has supported more than 600 deployments to image plate boundaries, cratons, orogenic systems, rifts, faults, and magmatic systems. Data from over 4,000 PASSCAL stations are now in the Data Management Center.
This last year the program supported over 60 new experiments and roughly 35 ongoing experiments. Over 30 support trips were taken ranging in length from 2 weeks to 12 weeks to support these experiments. 800 broadband sensors were tested and 450 broadband stations prepared and tested for the PASSCAL core support and the Flexible Array. Three large Asian active source experiments were conducted during the last year. Portable broadband experiments continue to utilize more and more stations and there are currently two large broadband experiments in the US. The NSF sponsored High Lava Plains (HLP) experiment has 100 broadband instruments deployed in the western US and the Flexible Array Mendocino Experiment (FAME) has ~80 broadband stations in the Mendocino region of California.
The PASSCAL Instrument Center (PIC) staff helped archive 4 TB of data from PASSCAL supported experiments..
PAsscAl standing committeealan levander (Chair) rice universityrichard allen university of California, BerkeleyMatthew Fouch arizona State universitytom pratt u.S. Geological Survey, SeattleStephane rondenay Massachusettes Institute of technologyarthur rodgers lawrence livermore national labray russo university of Floridalara Wagner university of north Carolina, Chapel HillGeorge Zandt university of arizonaJames Fowler paSSCal program Manager
paSSCalJim Fowler • IRIS Consortium
10 Incorporated research Institutions for Seismology
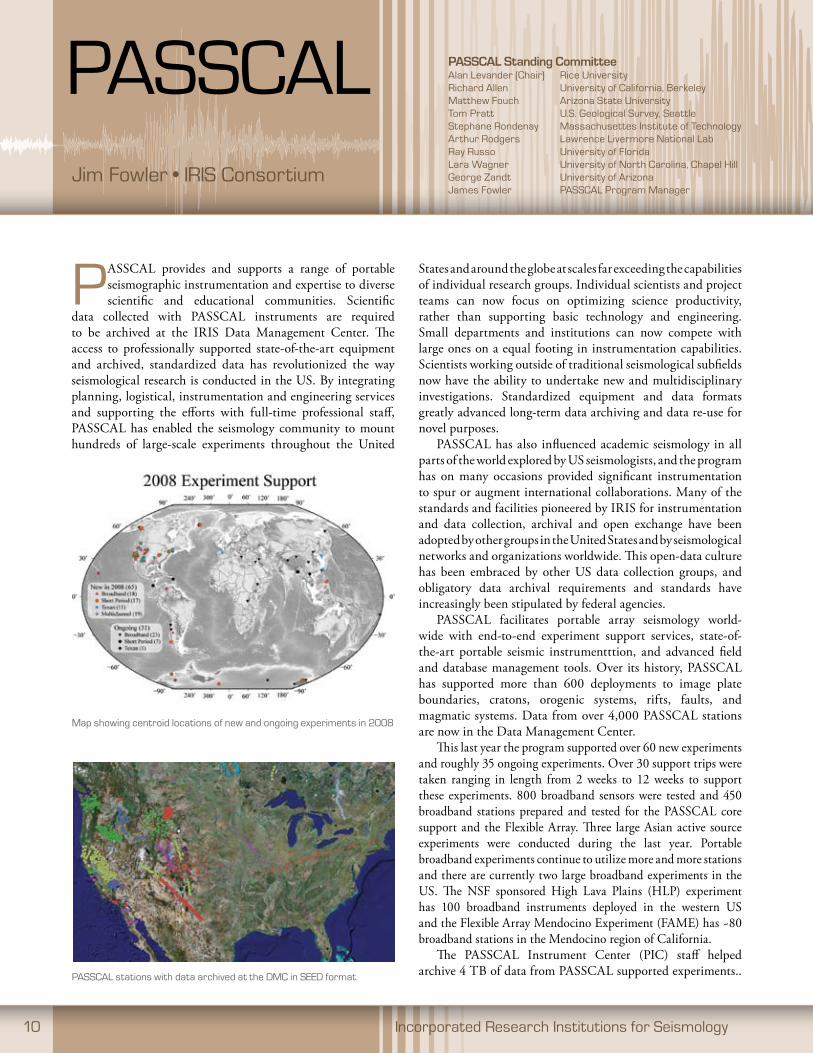
paSSCal stations with data archived at the DMC in SeeD format.
Map showing centroid locations of new and ongoing experiments in 2008

Figure 2
0 50 100 150 200
0
20
40
60
80
100
120
140
160
180
200
-10 S -Velocity Perturbation [%]
10
Dep
th [k
m]
continental crust
Horizontal Distance [km]
Dep
th [k
m]
0 50 100 150 200
0
20
40
60
80
100
120
140
160
180
200
A A'
moho
oceanic crust
0
20
40
60
80
100
120
140
160
180
2000 50 100 150 200 250
0
20
40
60
80
100
120
140
160
180
2000 50 100 150 200 250B B'Horizontal Distance [km]
Dep
th [k
m]
Dep
th [k
m]
a) b)
c) d)
mohocontinental crust
oceanic crust
hydrated
eclogite
The archiving process has been streamlined with full implementation of a new data delivery system. An integral part of the new system is a web interface that allows both PIC staff and PI’s to track the progress of the data archiving process. In addition to the data progress, the new system provides the staff with tools to access statistics and maintain a history of data archived.
PASSCAL Polar Program is supporting a growing community of high latitude researchers. This Austral season PASSCAL will send 6 staff in support of 8 deployments of International Polar Year (IPY) experiments in Antarctica. 124 temporary seismic stations will be deployed anlong with 20 new broad band stations and servicing 48 existing stations. See http://www.passcal.nmt.edu/Polar/index.html
The major purchasing phase of the Flexible Array is now entering the last 7 months of the 5 year Major Research
Equipment (MRE) EarthScope award. The program has remained on schedule and slightly under budget. A major priority for the Flexible Array from now until October 1, 2008 is to receive all planned equipment procurements. The final numbers of stations which will comprise the Flexible Array are 326 broadband stations, 120 short period stations and 1700 active source stations.
Over the last 6 month TA entered a phase where the design and procedures are not changing greatly. However, PIC support has changed in that we are now supplying equipment for removal activities and supplementary equipment to installations. TA shipments remain at a steady 18 constructions and 18 installs per month. Starting in December of 2007, and continuing for the next several months, the PIC is the central depot for the Transportable Array as it moves through New Mexico and southwestern Texas.
2008 annual report 11
High-resolution seismic images across central alaska (a and C) and Cascadia (B and D). upper panels show raw profiles and lower panels show interpreted profiles. red to blue color scale represents negative (slower) to positive (faster) S-velocity perturbations relative to a one-dimensional background model. In alaska, seismic velocities in the upper crustal layer (hashed region in Figure C) increase progressively with increasing depth, whereas the lower crustal layer remains relatively unperturbed (uniform low velocity). Dashed line in panel C denotes a continental upper-mantle discontinuity at 60 km depth. (rondenay, abers, and Van Keken, Geology, april 2008; v. 36; no. 4; p 275-278)
pnina Miller from paSSCal and paul Murphy of pHI helicopters install one of 100 temporary seismic station on Mt erebus Volcano in support of the MeVo project to image the summit conduit of the volcano. (photo: Brian Bonnet 11/08)
Flexible array deployment of broadband stations as part of the la Barge experiment. experiment participants, noah Fay and oak rankin install an air cell powered station in western Wyoming. the university of arizona led la Barge experiment explores the viability of closely spaced broadband stations over a producting gas field for imaging and monitoring.

12 Incorporated research Institutions for Seismology
Based on previous geological and geophysical research in Taiwan tectonic models have been proposed that differ significantly in details. From
these models many deductions, especially those regarding the structures at depth, can be subjected to empirical tests. The age of the emergence of Taiwan from the edge of the continental shelf is not much older than 5 million years and its rapid rise may have occurred within one million years. The current convergence rate between the Philippine Sea and the Eurasian plates is measured to be ~80 mm/yr and the rate of uplift exceeds 10 cm/yr in the high ranges. The ongoing TAIGER (TAiwan Integrated Geodynamics Research) project is conducting a series of geophysical experiments designed to obtain critical data for testing the models and exploring the geodynamical processes that are operating in the active orogeny. We want to catch the mountain building in action!
Currently 20 broadband ocean bottom seismometers (BBOBS) are offshore of east and southwest of Taiwan and an extensive plan of multichannel seismics and sea-land profiling with R/V Langseth are scheduled for March-June of 2009. Magnetotelluric sounding, laboratory measurement of anisotropic rocks, passive broadband (IRIS/PASSCAL) deployment and active source profiling has already been completed.
The planned northern and the southern active source transects were completed in February and March, 2008. Four shots ranging from 500 Kg to 750 Kg charges and one large shot (3000 Kg in the south and 1500 Kg in the north) along each line were used; the large shot was designed to be recorded in the Taiwan Strait by short period OBS and also on the Mainland. 800 IRIS/PASSCAL Texans were deployed along these transects to record theses shots; they were also deployed along the central transect without any shots. The Texan arrays recorded shots as well as many local earthquakes and during the central transect deployment two teleseisms, the mainshock and an aftershock in the southwestern Pacific, were recorded. The multichannel recording of these earthquakes show excellent coherent arrivals. The joint interpretation and inversion of active and passive seismic data allow us to confirm important details of crustal and mantle structures.
To complete the characterization of the internal structure of the Taiwan orogen we have conducted magetotelluric measurements to obtain the electric resistivity structures in the orogen and laboratory measurement of seismic anisotropy of rocks in Taiwan. The US TAIGER team began to explore the geodynamical implications of the key observations we have gathered already. The challenge of the sea-land experiment is still ahead.
taIGer experimentsFrancis Wu and the taIGer team*
taiwan and vicinity. the inverted triangles in the offshore area shows the locations of the broadband ocean bottom seismographs. Currently 20 of them are being occupied. the inverted triangles on land marked the site of taIGer stations from paSSCal.
teleseismic events recorded at the texan recorder sites roughly 200 m apart. although the 4.5 Hz sensors are not optimum for teleseismic recording the coherence of the arrivals allow highly precise travel time residuals to be calculated. the residuals shown at right indicate the delay (black) or advance (red). at points a-F we see rapid changes of residuals. they coincide with known locations of rapid changes crustal structures. the dataset is incorporated in tomography using local and teleseismic arrivals.

2008 annual report 13
*taIGer uS team members are David okaya (uSC), Kirk McIntosh, luc lavier, Harm avendonk, Yosio nakamura (ut austin), larry Brown (Cornell), Steve roecker (rpI), nik Christensen (Wisconsin) and Martyn unsworth (alberta); Collaborative scientists in taiwan are led by B.S. Huang (IeS), C.Y. Wang.
on the left the 2-D inversion of first arrival data show the top 10 km of the structures under taiwan. By joint inversion of the active source and local earthquake arrival time data we have a better resolved tomographic image. the rise of the higher velocity material above the 50 km distance marker is evidently related to the formation of the Hsueshan range in northern taiwan.
a segment of the northern taiwan active source profile (along the northern line shown in Fig. 1; with source located at the third from the left), without automatic gain control, shows a strong mid-crustal reflector under the northern Central range. the nature of the reflector is one of key targets of our study.
T6 - North Test Tomography using Explosion First Arrical Picks
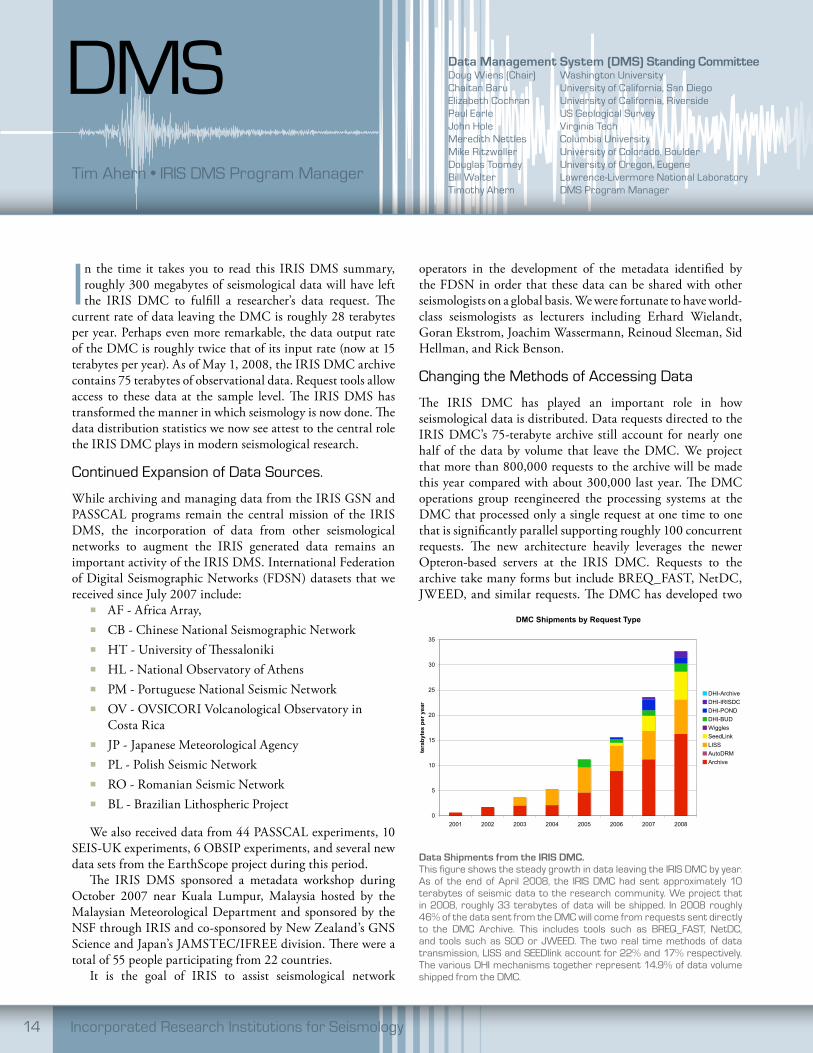
DMC Shipments by Request Type
0
5
10
15
20
25
30
35
2001 2002 2003 2004 2005 2006 2007 2008
tera
byte
s p
er
year
DHI-Archive
DHI-IRISDC
DHI-POND
DHI-BUD
Wiggles
SeedLink
LISS
AutoDRM
Archive
14 Incorporated research Institutions for Seismology
data Management system (dMs) standing committeeDoug Wiens (Chair) Washington universityChaitan Baru university of California, San Diegoelizabeth Cochran university of California, riversidepaul earle uS Geological SurveyJohn Hole Virginia techMeredith nettles Columbia universityMike ritzwoller university of Colorado, BoulderDouglas toomey university of oregon, eugeneBill Walter lawrence-livermore national laboratorytimothy ahern DMS program Manager
DMSTim Ahern • IRIS DMS Program Manager
In the time it takes you to read this IRIS DMS summary, roughly 300 megabytes of seismological data will have left the IRIS DMC to fulfill a researcher’s data request. The
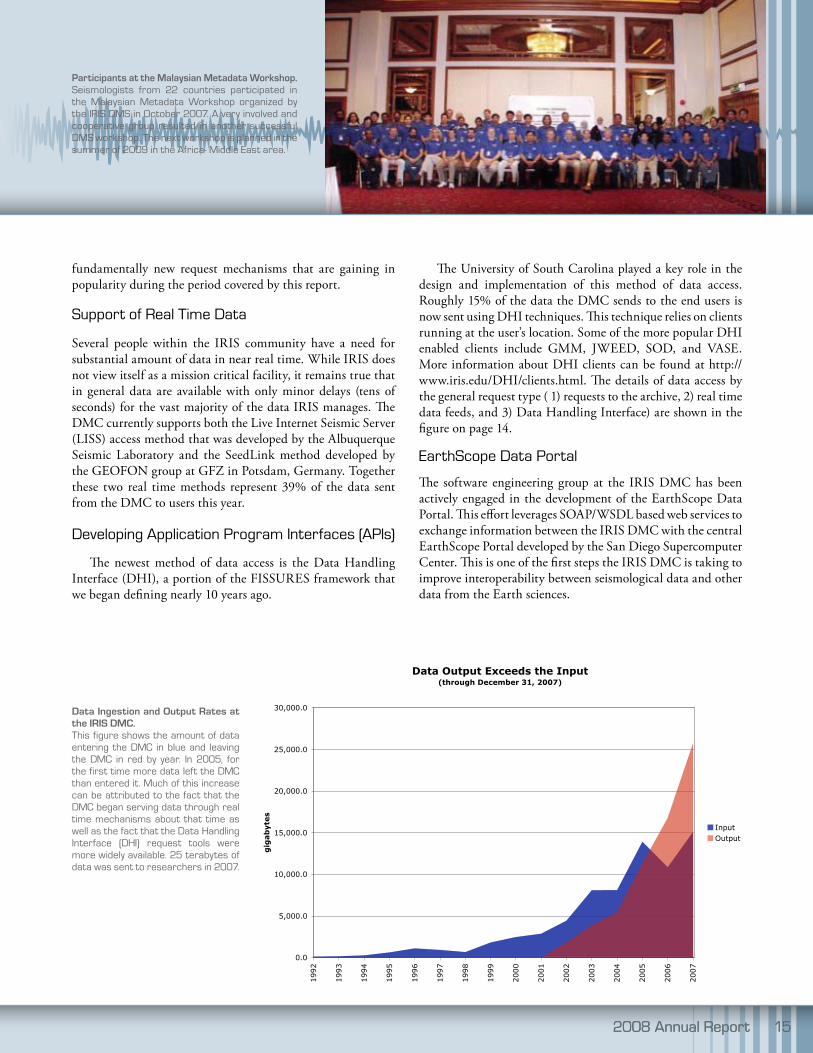
current rate of data leaving the DMC is roughly 28 terabytes per year. Perhaps even more remarkable, the data output rate of the DMC is roughly twice that of its input rate (now at 15 terabytes per year). As of May 1, 2008, the IRIS DMC archive contains 75 terabytes of observational data. Request tools allow access to these data at the sample level. The IRIS DMS has transformed the manner in which seismology is now done. The data distribution statistics we now see attest to the central role the IRIS DMC plays in modern seismological research.
Continued expansion of Data Sources.
While archiving and managing data from the IRIS GSN and PASSCAL programs remain the central mission of the IRIS DMS, the incorporation of data from other seismological networks to augment the IRIS generated data remains an important activity of the IRIS DMS. International Federation of Digital Seismographic Networks (FDSN) datasets that we received since July 2007 include:
AF - Africa Array, CB - Chinese National Seismographic Network HT - University of Thessaloniki HL - National Observatory of Athens PM - Portuguese National Seismic Network OV - OVSICORI Volcanological Observatory in
Costa Rica JP - Japanese Meteorological Agency PL - Polish Seismic Network RO - Romanian Seismic Network BL - Brazilian Lithospheric Project
We also received data from 44 PASSCAL experiments, 10 SEIS-UK experiments, 6 OBSIP experiments, and several new data sets from the EarthScope project during this period.
The IRIS DMS sponsored a metadata workshop during October 2007 near Kuala Lumpur, Malaysia hosted by the Malaysian Meteorological Department and sponsored by the NSF through IRIS and co-sponsored by New Zealand’s GNS Science and Japan’s JAMSTEC/IFREE division. There were a total of 55 people participating from 22 countries.
It is the goal of IRIS to assist seismological network
operators in the development of the metadata identified by the FDSN in order that these data can be shared with other seismologists on a global basis. We were fortunate to have world-class seismologists as lecturers including Erhard Wielandt, Goran Ekstrom, Joachim Wassermann, Reinoud Sleeman, Sid Hellman, and Rick Benson.
Changing the Methods of accessing Data
The IRIS DMC has played an important role in how seismological data is distributed. Data requests directed to the IRIS DMC’s 75-terabyte archive still account for nearly one half of the data by volume that leave the DMC. We project that more than 800,000 requests to the archive will be made this year compared with about 300,000 last year. The DMC operations group reengineered the processing systems at the DMC that processed only a single request at one time to one that is significantly parallel supporting roughly 100 concurrent requests. The new architecture heavily leverages the newer Opteron-based servers at the IRIS DMC. Requests to the archive take many forms but include BREQ_FAST, NetDC, JWEED, and similar requests. The DMC has developed two
data shipments from the iris dMc.this figure shows the steady growth in data leaving the IrIS DMC by year. as of the end of april 2008, the IrIS DMC had sent approximately 10 terabytes of seismic data to the research community. We project that in 2008, roughly 33 terabytes of data will be shipped. In 2008 roughly 46% of the data sent from the DMC will come from requests sent directly to the DMC archive. this includes tools such as BreQ_FaSt, netDC, and tools such as SoD or JWeeD. the two real time methods of data transmission, lISS and SeeDlink account for 22% and 17% respectively. the various DHI mechanisms together represent 14.9% of data volume shipped from the DMC.
2008 annual report 15
Data Output Exceeds the Input(through December 31, 2007)
0.0
5,000.0
10,000.0
15,000.0
20,000.0
25,000.0
30,000.0
1992
1993
1994
1995
1996
1997
1998
1999
2000
2001
2002
2003
2004
2005
2006
2007
gig
ab
yte
s
Input
Output
2008 annual report 15
fundamentally new request mechanisms that are gaining in popularity during the period covered by this report.
Support of real time Data
Several people within the IRIS community have a need for substantial amount of data in near real time. While IRIS does not view itself as a mission critical facility, it remains true that in general data are available with only minor delays (tens of seconds) for the vast majority of the data IRIS manages. The DMC currently supports both the Live Internet Seismic Server (LISS) access method that was developed by the Albuquerque Seismic Laboratory and the SeedLink method developed by the GEOFON group at GFZ in Potsdam, Germany. Together these two real time methods represent 39% of the data sent from the DMC to users this year.
Developing application program Interfaces (apIs)
The newest method of data access is the Data Handling Interface (DHI), a portion of the FISSURES framework that we began defining nearly 10 years ago.
The University of South Carolina played a key role in the design and implementation of this method of data access. Roughly 15% of the data the DMC sends to the end users is now sent using DHI techniques. This technique relies on clients running at the user’s location. Some of the more popular DHI enabled clients include GMM, JWEED, SOD, and VASE. More information about DHI clients can be found at http://www.iris.edu/DHI/clients.html. The details of data access by the general request type ( 1) requests to the archive, 2) real time data feeds, and 3) Data Handling Interface) are shown in the figure on page 14.
earthScope Data portal
The software engineering group at the IRIS DMC has been actively engaged in the development of the EarthScope Data Portal. This effort leverages SOAP/WSDL based web services to exchange information between the IRIS DMC with the central EarthScope Portal developed by the San Diego Supercomputer Center. This is one of the first steps the IRIS DMC is taking to improve interoperability between seismological data and other data from the Earth sciences.
Participants at the Malaysian Metadata Workshop.Seismologists from 22 countries participated in the Malaysian Metadata Workshop organized by the IrIS DMS in october 2007. a very involved and cooperative group resulted in another successful DMS workshop. the next workshop is planned in the summer of 2009 in the africa- Middle east area.
data ingestion and output rates at the iris dMc.this figure shows the amount of data entering the DMC in blue and leaving the DMC in red by year. In 2005, for the first time more data left the DMC than entered it. Much of this increase can be attributed to the fact that the DMC began serving data through real time mechanisms about that time as well as the fact that the Data Handling Interface (DHI) request tools were more widely available. 25 terabytes of data was sent to researchers in 2007.
16 Incorporated research Institutions for Seismology
new Data products at the DMC: animations of the Seismic Wavefield from uSarray DataCharles J. Ammon and Thorne Lay • Department of Geosciences, The Pennsylvania State University, Department of earth and planetary Sciences, university of California, Santa Cruz
the NSF-funded EarthScope USArray project is deploying an array of seismometers with unprecedented station density and aperture. Individual seismometers record
the passage of seismic waves through a given point near Earth’s surface. Classically, these seismograms are analyzed to deduce properties of the Earth’s structure and of the earthquake itself. These data can also be combined to create visualizations of the actual seismic waves sweeping across the array, providing new insights into complex wave propagation effects.
Dense recording of Seismic Waves on a Continental Scale
The Transportable Array (TA) component of USArray, with its 400 broadband seismographs spaced 70-km apart, is transforming many aspects of seismological analysis. Unlike traditional seismic wavefield studies that use sparse networks of isolated stations and/or relatively small aperture seismometer arrays, the TA is illuminating the underlying lithosphere and deeper mantle structure with unprecedented resolution by collecting seismic recordings over a continent-wide array. This is revolutionizing our understanding of the structure, evolution, and dynamics of North America and of continents in general.
The TA stations produce roughly five gigabytes of continuous data per day over a seismic wavefield area extending about 1500 km by 1000 km. The quality of the observations is obvious when the data are displayed in a traditional seismic record section. This presentation effectively conveys travel times of specific wave types as a function of propagation distance, but the spatial/temporal aspects of the wavefield are not fully revealed. These shortcomings can be addressed by displaying the same data via computer animations.
Ground-Displacement animations
The spatial density of the TA station deployments allows the visualization of ground motions as a wave phenomenon rather than focusing on point samples or static images. This technique is used in numerical models that compute complete synthetic wavefields. Viewing wave phenomena using actual data helps to convey fundamental seismic-wave interactions and reveals complexities that cannot be recognized in individual seismograms.
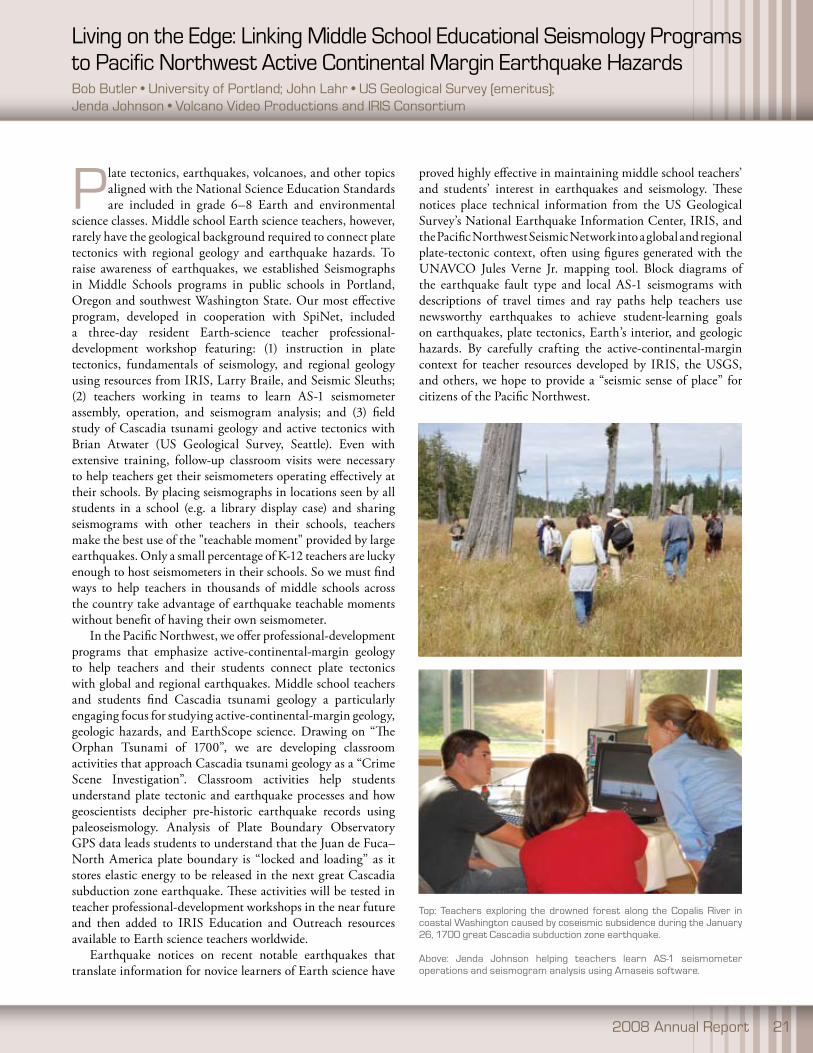
Animations of the seismic waves at the TA stations capture both expected and unexpected wave interactions with geologic structures beneath the surface. Features of commonly available digital movie tools (e.g., QuickTime) provide direct, interactive feedback on the nature of wave propagation and enable detailed evaluation of how ground motions evolve over time. The movies show the progressive passage of wave after wave across the array, primarily sweeping one way or another along the great-circle direction. The full space-time evolution of the wavefield is revealed, recapturing much of the essence of the wave phenomena
Snapshot from animation showing ground motion during the passage of the seismic waves across western north america from the large Solomon Islands earthquake of april 2007. each circle represents a ta station for which ground motions were recorded. Blue circles show downward displacements and red circles indicate upward displacements. the gray arrow shows the predicted direction of wave motion if the earth is radially symmetric. the alternating blue and red regions show large amplitude surface wave motion about 2,800 seconds (~ 47 minutes) after the event origin.
10
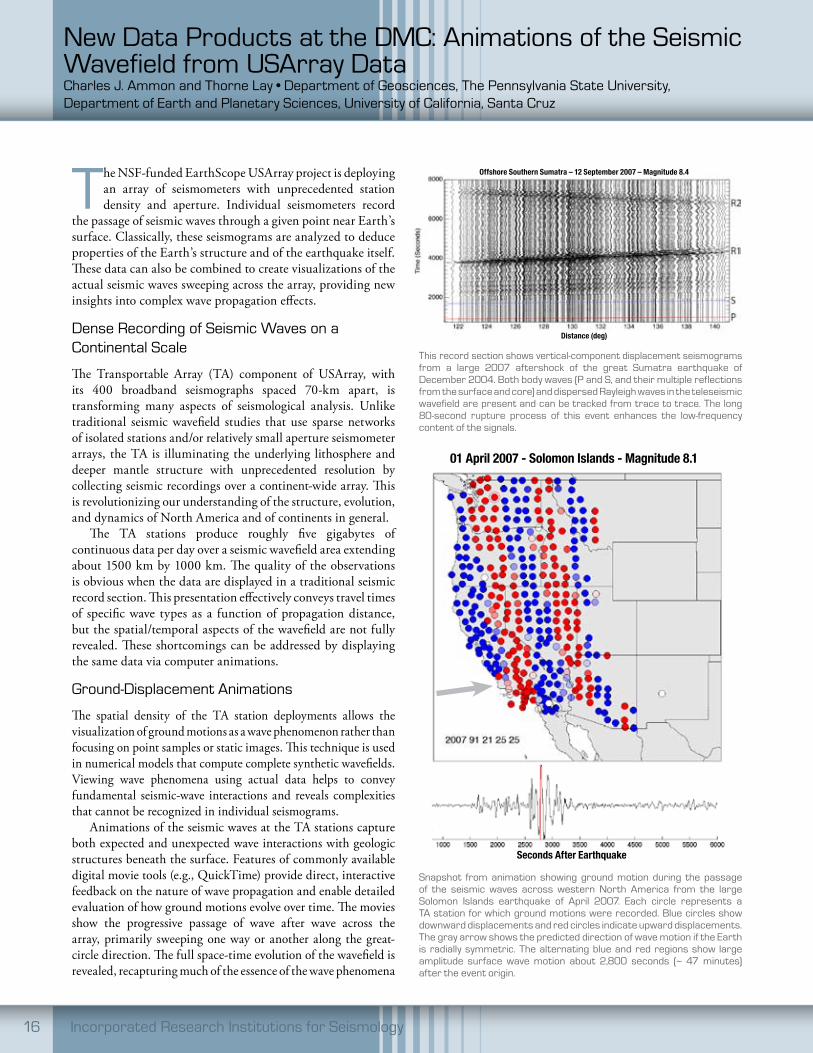
Figure 1. A traditional seismic record section showing the consistency of observations
across the large-aperture TA. Theoretical iasp91 arrival times are indicated (the event
had a rupture duration of roughly a minute). The short-arc arrivals (P, S, R1) travel the
shorter distance from the source to the array; the longer arc arrivals (R2) leave the
source region and travel the long-wave around the planet.
this record section shows vertical-component displacement seismograms from a large 2007 aftershock of the great Sumatra earthquake of December 2004. Both body waves (p and S, and their multiple reflections from the surface and core) and dispersed rayleigh waves in the teleseismic wavefield are present and can be tracked from trace to trace. the long 80-second rupture process of this event enhances the low-frequency content of the signals.
Offshore Southern Sumatra – 12 September 2007 – Magnitude 8.4
Distance (deg)
01 April 2007 - Solomon Islands - Magnitude 8.1
Seconds After Earthquake

that is suppressed in traditional static seismic profiles. The wavelengths of the propagating signals can be observed as well as the geometries and irregularities of the wavefronts produced by three-dimensional heterogeneity along the wave’s path. Effects such as amplitude focusing are directly visible.
long-period Scattered rayleigh Waves
The animations of TA data are typically dominated by wave phenomena that are expected and predictable with existing Earth models and computational procedures. One of the advantages of the animations is that they can reveal subtle anomalies in the wave patterns that might otherwise go unrecognized. This is partly because it is straightforward to see waves that sweep across the array with directions other than along the great-circle path. Such waves can arise either from superimposed signals from multiple earthquakes in different locations or from scattering of waves from a single earthquake that results in waves traveling on different paths. Since spatially separated earthquakes can be individually located even if they are closely spaced in time, it is possible to distinguish between these scenarios.
Several examples of scattered arrivals are apparent in animations of the April 2007 great Solomon Islands earthquake. The animations reveal times when wavefronts
sweep across the array with trajectories substantially different from the great-circle path along which the wavefronts are expected to propagate. Standard array processing procedures applied to the continental-scale TA can quantify these late anomalous wavefronts. The scattered waves are associated with features far off the great-circle path based on the arrival times of the anomalous waves and their periods as well as direct measurement of their propagation direction and phase velocity. In the Solomon Islands case, the likely cause of the scattering is associated with the subducting slab structure in the northwest Pacific or ocean/continent lateral transition gradients. Observations like these can be used to constrain three-dimensional heterogeneities in the mantle.
Wavefield animations as a Data product
The wavefield animations from the TA are one of the data products currently being developed by the DMC. Wavefield animations are generated as a routine data product by adapting the original wavefield animation research work of one of us (C. Ammon) to an operational production environment. Animations will be routinely prepared and made openly available for large earthquakes as they occur. Prototype animations are available on-line via the DMC’s Searchable Product Archive and Discovery Engine (SPADE; http://www.iris.edu/dms/spade.htm). Original research animations for a limited number of events are available at http://eqseis.geosc.psu.edu/~cammon/QA/. With the TA progressively migrating eastward across the conterminous states, and then on to Alaska, there will be many new views of the seismic wavefield for a host of geometries.
2008 annual report 17
13
Figure 4. Snapshot of scattered waves observable in the R1 coda. The arrivals are not
clear in a single frame, but the animation clearly shows propagation of waves well away
from the expected direction (the light gray arrow). The image on the right is a slowness
spectrum computed for a time centered on the frame (gray box on the seismogram). The
slowness spectrum allows us to estimate the direction of wave propagation, and the phase
velocity of the wave (given by the distance from the plot origin). This time window is rich
in arrivals, including two waves with body-wave slowness, and a swath of energy
arriving from the northwest with surface-wave slownesses.
Snapshot from animation showing scattered waves observable in the coda of the Solomon Islands earthquake. the arrivals are not clear in a single frame (left image), but the animation plainly shows propagation of waves well away from the expected direction (the light gray arrow). the image on the right is a slowness spectrum computed for a time centered on the frame (gray box on the seismogram). the slowness spectrum shows an estimate of the wave propagation direction and the phase velocity of the wave (given by the distance from the plot center). this time window is rich in arrivals, including two waves with body-wave slowness and a swath of energy arriving from the northwest with surface-wave slownesses.
01 April 2007 - Solomon Islands - Magnitude 8.1
Seconds After Earthquake

18 Incorporated research Institutions for Seismology
e&o education and outreach (e&o)Michael Wysession (Chair) Washington university, St. louisInes Cifuentes american Geophysical unionKevin Furlong pennsylvania State universitySue Hough uSGS, pasadenaGlen Kroeger trinity universityGary pavlis Indiana universitylaura Serpa university of texas, el pasolaura Wetzel eckerd CollegeJohn taber e&o program Manager
the Education and Outreach (E&O) program is committed to using seismology and the unique resources of the IRIS Consortium to make significant and lasting
contributions to science education, science literacy and the general public’s understanding of the Earth. The E&O program has continued its development and dissemination of a well-rounded suite of educational activities designed to impact a spectrum of learners, ranging from 5th grade students to adults. These learning experiences transpire in a variety of educational settings ranging from self-exploration in front of one’s own computer, to the excitement of an interactive museum exhibit, a major public lecture, or in-depth exploration of the Earth’s
interior in a formal classroom. The efforts of the IRIS E&O
program have recently been focused on the refinement and enhancement of ongoing core activities, and the expansion of their impact. For example the Educational Affiliate membership category and the Undergraduate Internship program have increased IRIS’ impact among their respective audiences of undergraduate faculty and students. The objective of Educational Affiliate membership is to cultivate a base of non-research colleges and universities committed to excellence in undergraduate geoscience education through the co-development of E&O activities designed to address their needs.
Our summer internship program continues to be successful through a Research Experiences for Undergraduates grant from NSF. Students begin the summer with a one
week orientation hosted by New
Mexico Tech where the students are introduced to some of the most exciting aspects of modern seismology, as well as to computer tools and seismic equipment that they may use during their internship. Classroom labs and lectures are led by senior scientists and instructors from within the IRIS community, who generously donate their time to participate. The week provides a chance for the students to bond together as a group and to provide a common starting point for them. The ten undergraduates then spent the rest of the summer engaged in research at nine different IRIS institutions, where they kept in touch with each other via Internet blogs and discussion boards. Through their participation in the program, these students gain experience in and exposure to Earth science as a potential career path. Of the 71 students who have participated in the program since 1998, over 85% have gone on to graduate school in the geosciences, often at school where they did their internship.
The E&O web pages remain a primary means of dissemination of information and resources and the new IRIS web site has greatly improved access to this material. The Seismic Monitor is the most popular IRIS Web page and we continue to add new material with a recent focus on animations and short instructional videos. IRIS E&O has worked with software developer Dan Griscom to expand the educational capabilities of SeisMac, a free application that turns Mac laptops into a 3-component seismograph. SeisMac can be used to help students get a better physical understanding of seismology concepts and several classroom activities are available on the IRIS web site.
Millions of people potentially interact annually with the IRIS/USGS museum displays, many of them at the American Museum of Natural History in New York and the Smithsonian Institution National Museum of Natural History in Washington, D.C. However, a growing number of people annually explore seismological concepts through our newest display, the Active Earth Display (AED). The AED is a new smaller, more flexible version of the museum display, and is now in use at universities and visitor centers throughout the US. The display is based on an evaluation of our large displays, which showed that audiences are particularly interested in the presentation of near real-time seismic information. Served via a web browser, the display is customizable for each site and the software is available to anyone who applies via the IRIS E&O web pages. Touch screens provide an interactive experience and new content continues to be developed. Another program aimed at general audiences is the IRIS/SSA Distinguished Lecture Series. In the past 18 months, four speakers presented the IrIS active earth Display.
John taber and Michael Hubenthal IrIS Consortium

2008 annual report 19
a total of over 25 lectures at major museums and universities throughout the country to audiences of up to 400 people.
The E&O Program continues to refine its highly effective set of professional development experiences designed to support the background and curricular needs of formal educators. Leveraging the expertise of Consortium members, IRIS delivers content such as: plate tectonics, propagation of seismic waves, seismographs, earthquake locations, and Earth’s interior structure, in workshop formats ranging from ½ to 6 days. For example, a 2.5 day workshop has been held annually in collaboration with Penn State and North Carolina A&T as part of the AfricaArray project. In addition a series of short workshops exploring novel approaches to seismology instruction at the high school level are held each year as part of the National Science Teachers Association annual meeting. Similarly, a 2.5 day operators workshop was also offered to teachers who use AS1 seismographs in their classroom that they received through the IRIS seismographs in schools program. To date, more than 140 such seismographs have been distributed to schools around the US.
The third and final in a series of professional development sessions for high school and middle school teachers in Yuma, AZ was conducted this spring. The effort, designed in collaboration with the Yuma Union High School District has been part of a systemic reform endeavor, which supports the district’s need to prepare its Earth Science teachers to adequately address the newly adopted Arizona state science standards, as well as developing a scope and sequence of resources to support all of the district’s Earth Science teachers. The short and long-term assessment of all the workshops continues to provide IRIS with critical data to document the impact the program has on educators. Using
this information as a guide, IRIS will continue to monitor and alter its curricular resources and implementation style in an effort to maximize this impact.
Additional audiences are reached via collaboration with other regional and national geoscience programs. For example, 16,000 copies of an animated postcard showing the Earth's normal modes were provided for AGI’s Earth Science Week packets along with an earthquake activity in the Earth Science Week calendar. We also leverage our resources by providing materials for workshops organized by other organizations. EarthScope related activities are and will continue to be an important focus and we are working closely with the EarthScope National Office and the UNAVCO E&O program to maximize our impact. For example, we have jointly led teacher workshops to promote use of EarthScope data at a variety of venues and we are jointly developing EarthScope related content for the Active Earth Display.
IrIS summer interns work with faculty from university of nevada, las Vegas to collect reflection data during the intern orientation week at new Mexico tech.
teachers practice setting up and operating an aS1 seismograph as part of a 2.5 day seismographs in schools training course.

20 Incorporated research Institutions for Seismology
An intriguing challenge facing the IRIS Seismographs in Schools program is how to overcome the disconnect between the
open, inquiry-based culture underlying scientific research and the rigid curriculum schedules and “teaching to the standardized tests” environment that is all too common in K-12 schools. To achieve the IRIS E&O goal of making lasting contributions to science literacy, it will be necessary to bridge this divide between the cultures of science research and K-12 schools (e.g., Kafka et al., 2006).
Bridging this divide is not easy, but a refreshing exception to this predicament is the Sea Lab Marine Science Education Center in New Bedford, MA, where the Boston College Educational Seismology Project (BC-ESP) operates an AS1 seismograph and conducts an educational seismology program in partnership with Weston Observatory. Although Sea Lab is part of the New Bedford public school system, the learning environment there is quite different from what we typically find in public schools. It is an inspiring environment for teaching scientific inquiry in the context of students recording earthquakes in their school. Our BC-ESP curriculum at Sea Lab begins with an exercise in which the students are asked to build their own seismograph based on their own ideas regarding what it might take to create an instrument that records ground motion. The students are given a variety of materials and are given minimal instructions other than to build an instrument that would detect and record motion. They are encouraged to think through this problem from first principles to determine what attributes a seismograph should have in order to detect motion.
Our curriculum then moves on to a variety of other exercises in which students learn about seismology via directly working with seismograms recorded at Sea Lab and other schools. When the students see the seismograph screen (prominently displayed in the lobby) on the day of a very well-recorded earthquake, it is hard to miss that an earthquake was recorded. However, most of the time the screen shows much less dramatic vibrations, such as students walking near the seismograph and natural non-earthquake vibrations such as wind. By observing the seismograph screen on a regular basis, the students learn to recognize when an earthquake has been recorded, and to recognize the different types of earthquake waves that propagate through the Earth. To help them with this inquiry, we developed an exercise in which they are shown examples of earthquakes, ranging from dramatic recordings of large earthquakes to very subtle ones that are hard to identify. With these examples as a guide, they practice identifying different types of signals and learn how to recognize the “fingerprints” of an earthquake and to distinguish earthquake
signals from other types of recorded vibrations. This exercise is later followed by more formal instruction on seismic waves.
Building upon the “science of the sea” base of the Sea Lab curriculum, the students also investigate microseisms recorded on their seismograph, and thus learn about how seismologists record vibrations generated by ocean waves. This enables us to connect our seismology curriculum with the marine science roots of Sea Lab. Teachers bring their students to the seismograph on a daily basis, thus integrating seismology and the physics of waves into the daily lives of students.
In the unique environment that Sea Lab provides, we are making progress towards bridging the cultural divide between science research and K-12 schools. But, can this type of endeavor reach the larger audience that the IRIS E&O program seeks to reach? Although there is no substitute for real seismologists working with teachers in the classroom, we are currently working to incorporate the culture of inquiry into our BC-ESP on-line curriculum, which will soon be available to teachers throughout the US.
For more information about the BC-ESP, and the online BC-ESP curriculum, go to:www2.bc.edu/~kafka/SeismoEd/BC_ESP_Home.html
For more information about Sea Lab, go to:www.newbedford.k12.ma.us/sealab
reference:
Kafka, A.L., J.E. Ebel, M. Barnett, A. Macherides Moulis, L. Campbell, and S.E. Gordon (2006). Classroom seismographs and the challenge of encouraging a culture of scientific inquiry in K–12 schools, Seismological Research Letters, 77(6), 74-86 (www2.bc.edu/~kafka/SeismoEd_SRL/SRL776_EduQuakes.htm).
educational Seismology at the Sea lab Marine Science education Center:a unique opportunity for Scientific Inquiry in a K-12 School environmentAlan L. Kafka • Weston Observatory, Boston College
Students at Sea lab in new Bedford, Ma working on “Build Your own Seismograph” exercise.
2008 annual report 21
plate tectonics, earthquakes, volcanoes, and other topics aligned with the National Science Education Standards are included in grade 6–8 Earth and environmental
science classes. Middle school Earth science teachers, however, rarely have the geological background required to connect plate tectonics with regional geology and earthquake hazards. To raise awareness of earthquakes, we established Seismographs in Middle Schools programs in public schools in Portland, Oregon and southwest Washington State. Our most effective program, developed in cooperation with SpiNet, included a three-day resident Earth-science teacher professional-development workshop featuring: (1) instruction in plate tectonics, fundamentals of seismology, and regional geology using resources from IRIS, Larry Braile, and Seismic Sleuths; (2) teachers working in teams to learn AS-1 seismometer assembly, operation, and seismogram analysis; and (3) field study of Cascadia tsunami geology and active tectonics with Brian Atwater (US Geological Survey, Seattle). Even with extensive training, follow-up classroom visits were necessary to help teachers get their seismometers operating effectively at their schools. By placing seismographs in locations seen by all students in a school (e.g. a library display case) and sharing seismograms with other teachers in their schools, teachers make the best use of the "teachable moment" provided by large earthquakes. Only a small percentage of K-12 teachers are lucky enough to host seismometers in their schools. So we must find ways to help teachers in thousands of middle schools across the country take advantage of earthquake teachable moments without benefit of having their own seismometer.
In the Pacific Northwest, we offer professional-development programs that emphasize active-continental-margin geology to help teachers and their students connect plate tectonics with global and regional earthquakes. Middle school teachers and students find Cascadia tsunami geology a particularly engaging focus for studying active-continental-margin geology, geologic hazards, and EarthScope science. Drawing on “The Orphan Tsunami of 1700”, we are developing classroom activities that approach Cascadia tsunami geology as a “Crime Scene Investigation”. Classroom activities help students understand plate tectonic and earthquake processes and how geoscientists decipher pre-historic earthquake records using paleoseismology. Analysis of Plate Boundary Observatory GPS data leads students to understand that the Juan de Fuca–North America plate boundary is “locked and loading” as it stores elastic energy to be released in the next great Cascadia subduction zone earthquake. These activities will be tested in teacher professional-development workshops in the near future and then added to IRIS Education and Outreach resources available to Earth science teachers worldwide.
Earthquake notices on recent notable earthquakes that translate information for novice learners of Earth science have
proved highly effective in maintaining middle school teachers’ and students’ interest in earthquakes and seismology. These notices place technical information from the US Geological Survey’s National Earthquake Information Center, IRIS, and the Pacific Northwest Seismic Network into a global and regional plate-tectonic context, often using figures generated with the UNAVCO Jules Verne Jr. mapping tool. Block diagrams of the earthquake fault type and local AS-1 seismograms with descriptions of travel times and ray paths help teachers use newsworthy earthquakes to achieve student-learning goals on earthquakes, plate tectonics, Earth’s interior, and geologic hazards. By carefully crafting the active-continental-margin context for teacher resources developed by IRIS, the USGS, and others, we hope to provide a “seismic sense of place” for citizens of the Pacific Northwest.
living on the edge: linking Middle School educational Seismology programs to pacific northwest active Continental Margin earthquake HazardsBob Butler • University of Portland; John Lahr • US Geological Survey (emeritus); Jenda Johnson • Volcano Video Productions and IRIS Consortium
top: teachers exploring the drowned forest along the Copalis river in coastal Washington caused by coseismic subsidence during the January 26, 1700 great Cascadia subduction zone earthquake.
above: Jenda Johnson helping teachers learn aS-1 seismometer operations and seismogram analysis using amaseis software.
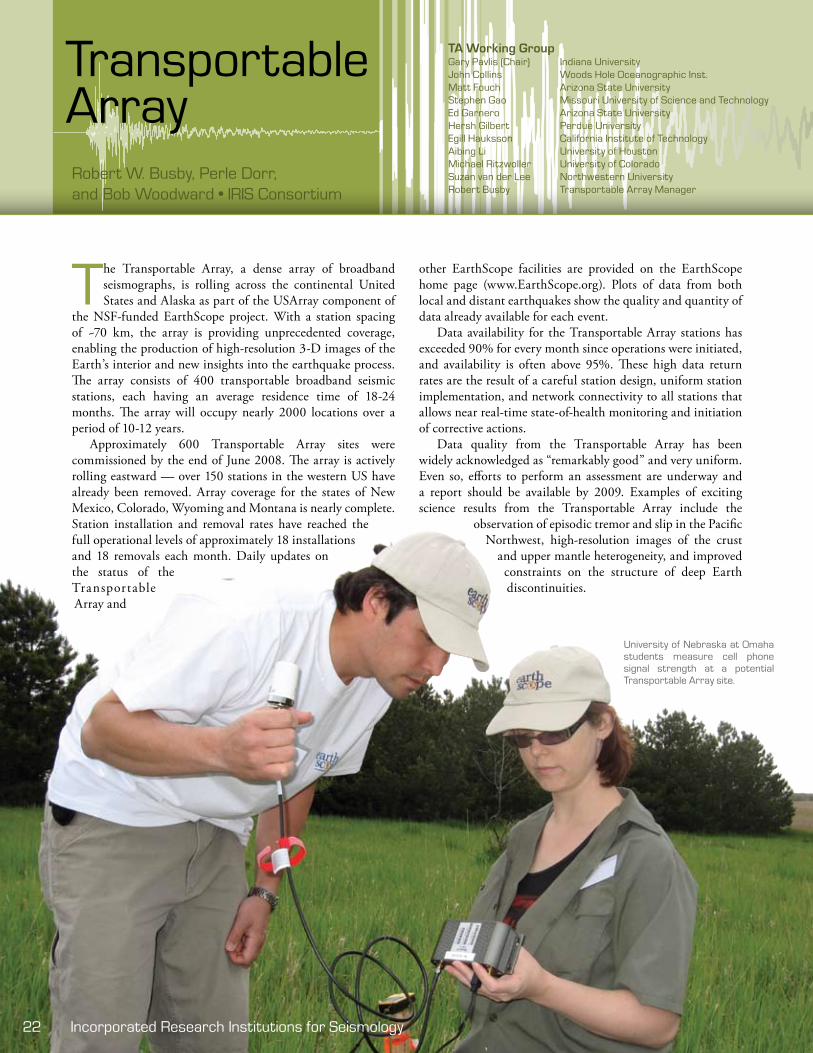
22 Incorporated research Institutions for Seismology
transportablearray
the Transportable Array, a dense array of broadband seismographs, is rolling across the continental United States and Alaska as part of the USArray component of
the NSF-funded EarthScope project. With a station spacing of ~70 km, the array is providing unprecedented coverage, enabling the production of high-resolution 3-D images of the Earth’s interior and new insights into the earthquake process. The array consists of 400 transportable broadband seismic stations, each having an average residence time of 18-24 months. The array will occupy nearly 2000 locations over a period of 10-12 years.
Approximately 600 Transportable Array sites were commissioned by the end of June 2008. The array is actively rolling eastward — over 150 stations in the western US have already been removed. Array coverage for the states of New Mexico, Colorado, Wyoming and Montana is nearly complete. Station installation and removal rates have reached the full operational levels of approximately 18 installations and 18 removals each month. Daily updates on the status of the Transportable Array and
other EarthScope facilities are provided on the EarthScope home page (www.EarthScope.org). Plots of data from both local and distant earthquakes show the quality and quantity of data already available for each event.
Data availability for the Transportable Array stations has exceeded 90% for every month since operations were initiated, and availability is often above 95%. These high data return rates are the result of a careful station design, uniform station implementation, and network connectivity to all stations that allows near real-time state-of-health monitoring and initiation of corrective actions.
Data quality from the Transportable Array has been widely acknowledged as “remarkably good” and very uniform. Even so, efforts to perform an assessment are underway and a report should be available by 2009. Examples of exciting science results from the Transportable Array include the
observation of episodic tremor and slip in the Pacific Northwest, high-resolution images of the crust
and upper mantle heterogeneity, and improved constraints on the structure of deep Earth discontinuities.
robert W. Busby, perle Dorr, and Bob Woodward • IRIS Consortium
tA Working groupGary pavlis (Chair) Indiana universityJohn Collins Woods Hole oceanographic Inst.Matt Fouch arizona State universityStephen Gao Missouri university of Science and technologyed Garnero arizona State universityHersh Gilbert perdue universityegill Hauksson California Institute of technologyaibing li university of HoustonMichael ritzwoller university of ColoradoSuzan van der lee northwestern universityrobert Busby transportable array Manager
university of nebraska at omaha students measure cell phone signal strength at a potential transportable array site.
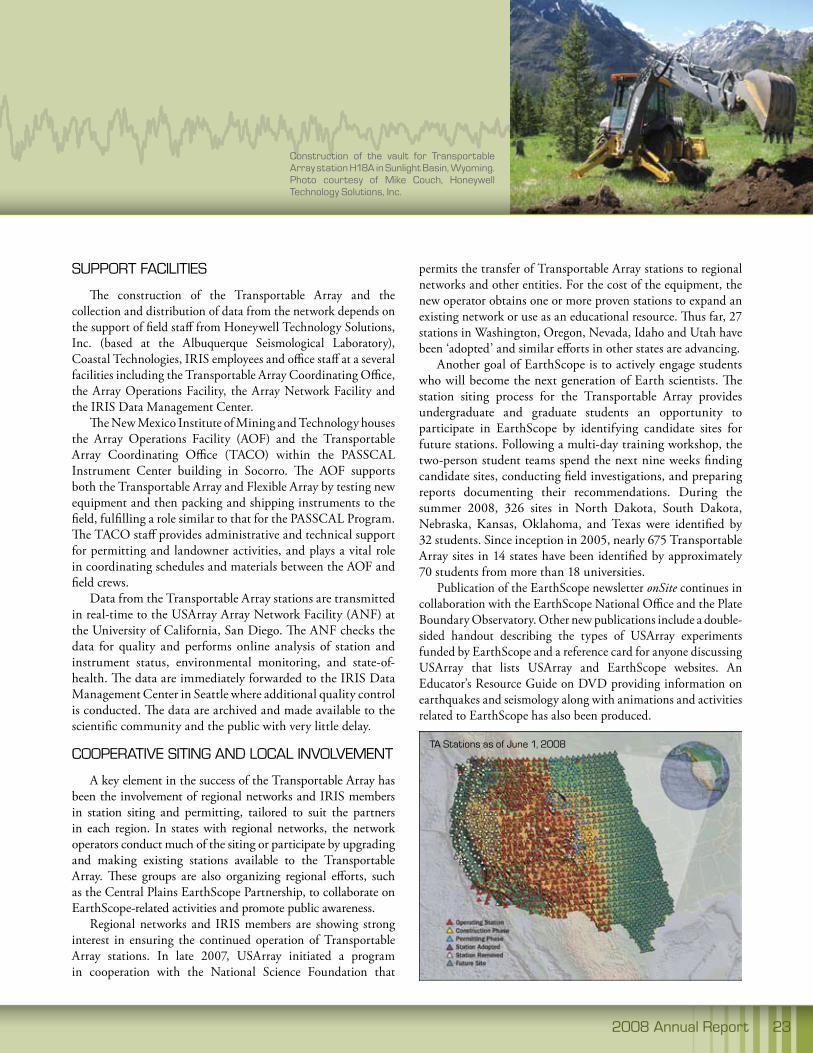
2008 annual report 23
Support FaCIlItIeS
The construction of the Transportable Array and the collection and distribution of data from the network depends on the support of field staff from Honeywell Technology Solutions, Inc. (based at the Albuquerque Seismological Laboratory), Coastal Technologies, IRIS employees and office staff at a several facilities including the Transportable Array Coordinating Office, the Array Operations Facility, the Array Network Facility and the IRIS Data Management Center.
The New Mexico Institute of Mining and Technology houses the Array Operations Facility (AOF) and the Transportable Array Coordinating Office (TACO) within the PASSCAL Instrument Center building in Socorro. The AOF supports both the Transportable Array and Flexible Array by testing new equipment and then packing and shipping instruments to the field, fulfilling a role similar to that for the PASSCAL Program. The TACO staff provides administrative and technical support for permitting and landowner activities, and plays a vital role in coordinating schedules and materials between the AOF and field crews.
Data from the Transportable Array stations are transmitted in real-time to the USArray Array Network Facility (ANF) at the University of California, San Diego. The ANF checks the data for quality and performs online analysis of station and instrument status, environmental monitoring, and state-of-health. The data are immediately forwarded to the IRIS Data Management Center in Seattle where additional quality control is conducted. The data are archived and made available to the scientific community and the public with very little delay.
CooperatIVe SItInG anD loCal InVolVeMent
A key element in the success of the Transportable Array has been the involvement of regional networks and IRIS members in station siting and permitting, tailored to suit the partners in each region. In states with regional networks, the network operators conduct much of the siting or participate by upgrading and making existing stations available to the Transportable Array. These groups are also organizing regional efforts, such as the Central Plains EarthScope Partnership, to collaborate on EarthScope-related activities and promote public awareness.
Regional networks and IRIS members are showing strong interest in ensuring the continued operation of Transportable Array stations. In late 2007, USArray initiated a program in cooperation with the National Science Foundation that
permits the transfer of Transportable Array stations to regional networks and other entities. For the cost of the equipment, the new operator obtains one or more proven stations to expand an existing network or use as an educational resource. Thus far, 27 stations in Washington, Oregon, Nevada, Idaho and Utah have been ‘adopted’ and similar efforts in other states are advancing.
Another goal of EarthScope is to actively engage students who will become the next generation of Earth scientists. The station siting process for the Transportable Array provides undergraduate and graduate students an opportunity to participate in EarthScope by identifying candidate sites for future stations. Following a multi-day training workshop, the two-person student teams spend the next nine weeks finding candidate sites, conducting field investigations, and preparing reports documenting their recommendations. During the summer 2008, 326 sites in North Dakota, South Dakota, Nebraska, Kansas, Oklahoma, and Texas were identified by 32 students. Since inception in 2005, nearly 675 Transportable Array sites in 14 states have been identified by approximately 70 students from more than 18 universities.
Publication of the EarthScope newsletter onSite continues in collaboration with the EarthScope National Office and the Plate Boundary Observatory. Other new publications include a double-sided handout describing the types of USArray experiments funded by EarthScope and a reference card for anyone discussing USArray that lists USArray and EarthScope websites. An Educator’s Resource Guide on DVD providing information on earthquakes and seismology along with animations and activities related to EarthScope has also been produced.
Construction of the vault for transportable array station H18a in Sunlight Basin, Wyoming. photo courtesy of Mike Couch, Honeywell technology Solutions, Inc.
ta Stations as of June 1, 2008

ambient noise tomography in the Western uS using Data from the earthScope/uSarray transportable array
24 Incorporated research Institutions for Seismology
a recent innovation in seismic imaging reveals high-resolution information about the structure of the earth without the occurrence of discrete natural events. This
technique, Ambient Noise Tomography (ANT), is based on using long time series of ambient seismic noise – noise that is omnipresent at all seismic stations – and applied predominantly to seismic surface waves. The application of ANT to data from ambitious new deployments of seismic arrays, such as the EarthScope USArray in the United States, has led to the development of large-scale seismic models of the Earth’s crust and uppermost mantle at unprecedented resolution. In addition, new methods of data analysis and interpretation of ambient noise data that exploit the array nature of the Transportable Array (TA) are currently under development and have the potential to provide more reliable information about crustal and uppermost mantle anisotropy.
ambient noise tomography
The production of maps of the speed of Rayleigh or Love waves as a function of frequency is called surface wave tomography. Ambient noise tomography (ANT) is the generation of such maps from inter-station cross-correlations of ambient (background)
noise. The first ambient noise tomographic images of Rayleigh wave group speeds in the microseismic band were based on some of the earliest data from the TA in 2004 and on data from the ANSS network. This research was followed by a multiplicity of applications around the world, including studies in Europe, New Zealand, South Africa, Korea, Japan, Iceland, Canada, Australia, and China (e.g., Bensen et al., 2008; Moschetti et al., 2007; Lin et al., 2008). Both Rayleigh and Love wave dispersion maps are now commonly obtained at periods of 6 sec to 100 sec with the spatial extent of study ranging up to the continental scale. Long time series (a year or more) are essential for ANT, as this homogenizes the azimuthal content of ambient noise. In some cases, time series lengths of more than four years have been used. Uncertainties are estimated from the temporal repeatability of the measurements.
ANT is most powerful when applied to large deployments of seismometers such as the TA component of EarthScope. This array, which is presently rolling across the US, consists of 400 broadband seismometers deployed concurrently with a station separation of about 70 km. Lin et al. (2008) showed that the resolution of ANT applied to EarthScope TA data is better than the inter-station spacing. This result is unprecedented over an area the size of the western US.
3-D images of earth’s Interior
The promise of ANT is to unveil the three-dimensional (3-D) variation of seismic wave speeds in the Earth’s interior. This will advance our knowledge of temperature, composition, and fluid content in the crust and upper mantle and thus enhance our understanding of Earth processes. Recent studies invert ambient noise and earthquake-derived information from TA data to provide 3-D images over large areas in great detail. ANT not only provides better lateral resolution over traditional surface wave methods in regions with good station coverage, but its broad frequency content, which extends to periods below 10 sec, also gives the vertical resolution needed to distinguish crustal from mantle structures.
-10.0 -5.0 -3.0 -2.0 -1.0 -0.5 0.5 1.0 2.0 3.0 5.0 10.0
Vs anomaly (%)
-124˚ -120˚ -116˚32˚
36˚
40˚
44˚
48˚
0
50
100
150-124 -122 -120 -118 -116 -114
0
50
100
150-124 -122 -120 -118 -116 -114
dept
h (k
m)
(a)
(b)
Michael H. Ritzwoller • University of Colorado at Boulder
Map and profile of the 3-D variation of shear wave speed (Vs) in the crust and uppermost mantle (at 100 km depth) determined from ambient noise and earthquake information. the vertical profile shows Vs underlying the white line on the map at (left) 46ºn, and displays vertically exaggerated surface topography. In the profile (right), the high Vs subducting plate is overlain by low Vs speeds (high temperature and volatile content) beneath active volcanoes in the Cascade range. (Figure courtesy of Yingjie Yang.)
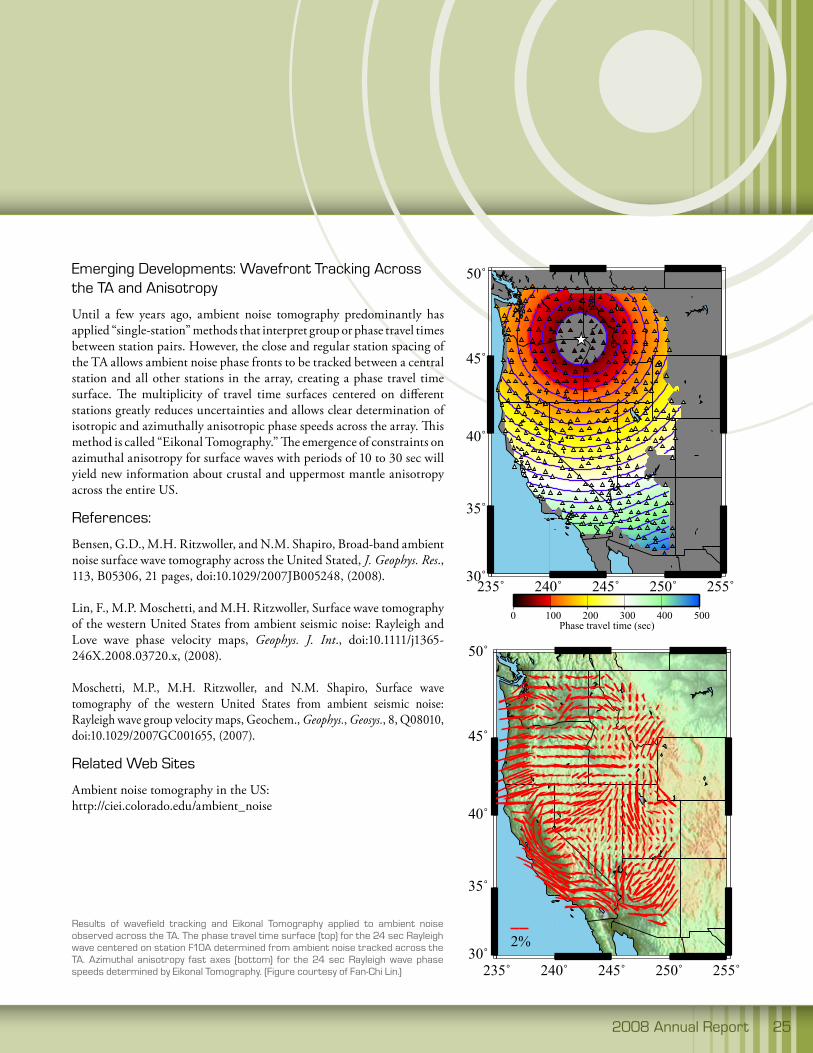
2008 annual report 25
emerging Developments: Wavefront tracking across the ta and anisotropy
Until a few years ago, ambient noise tomography predominantly has applied “single-station” methods that interpret group or phase travel times between station pairs. However, the close and regular station spacing of the TA allows ambient noise phase fronts to be tracked between a central station and all other stations in the array, creating a phase travel time surface. The multiplicity of travel time surfaces centered on different stations greatly reduces uncertainties and allows clear determination of isotropic and azimuthally anisotropic phase speeds across the array. This method is called “Eikonal Tomography.” The emergence of constraints on azimuthal anisotropy for surface waves with periods of 10 to 30 sec will yield new information about crustal and uppermost mantle anisotropy across the entire US.
references:
Bensen, G.D., M.H. Ritzwoller, and N.M. Shapiro, Broad-band ambient noise surface wave tomography across the United Stated, J. Geophys. Res., 113, B05306, 21 pages, doi:10.1029/2007JB005248, (2008).
Lin, F., M.P. Moschetti, and M.H. Ritzwoller, Surface wave tomography of the western United States from ambient seismic noise: Rayleigh and Love wave phase velocity maps, Geophys. J. Int., doi:10.1111/j1365-246X.2008.03720.x, (2008).
Moschetti, M.P., M.H. Ritzwoller, and N.M. Shapiro, Surface wave tomography of the western United States from ambient seismic noise: Rayleigh wave group velocity maps, Geochem., Geophys., Geosys., 8, Q08010, doi:10.1029/2007GC001655, (2007).
related Web Sites
Ambient noise tomography in the US: http://ciei.colorado.edu/ambient_noise
results of wavefield tracking and eikonal tomography applied to ambient noise observed across the ta. the phase travel time surface (top) for the 24 sec rayleigh wave centered on station F10a determined from ambient noise tracked across the ta. azimuthal anisotropy fast axes (bottom) for the 24 sec rayleigh wave phase speeds determined by eikonal tomography. (Figure courtesy of Fan-Chi lin.)
235˚ 240˚ 245˚ 250˚ 255˚30˚
35˚
40˚
45˚
50˚
235˚ 240˚ 245˚ 250˚ 255˚30˚
35˚
40˚
45˚
50˚
0 100 200 300 400 500Phase travel time (sec)
(a) (b)
3.30 3.40 3.45 3.50 3.55 3.60 3.65 3.70 3.80Phase speed (km/s)
235˚ 240˚ 245˚ 250˚ 255˚30˚
35˚
40˚
45˚
50˚
235˚ 240˚ 245˚ 250˚ 255˚30˚
35˚
40˚
45˚
50˚
2%
(c) (d)
235˚ 240˚ 245˚ 250˚ 255˚30˚
35˚
40˚
45˚
50˚
235˚ 240˚ 245˚ 250˚ 255˚30˚
35˚
40˚
45˚
50˚
0 100 200 300 400 500Phase travel time (sec)
(a) (b)
3.30 3.40 3.45 3.50 3.55 3.60 3.65 3.70 3.80Phase speed (km/s)
235˚ 240˚ 245˚ 250˚ 255˚30˚
35˚
40˚
45˚
50˚
235˚ 240˚ 245˚ 250˚ 255˚30˚
35˚
40˚
45˚
50˚
2%
(c) (d)
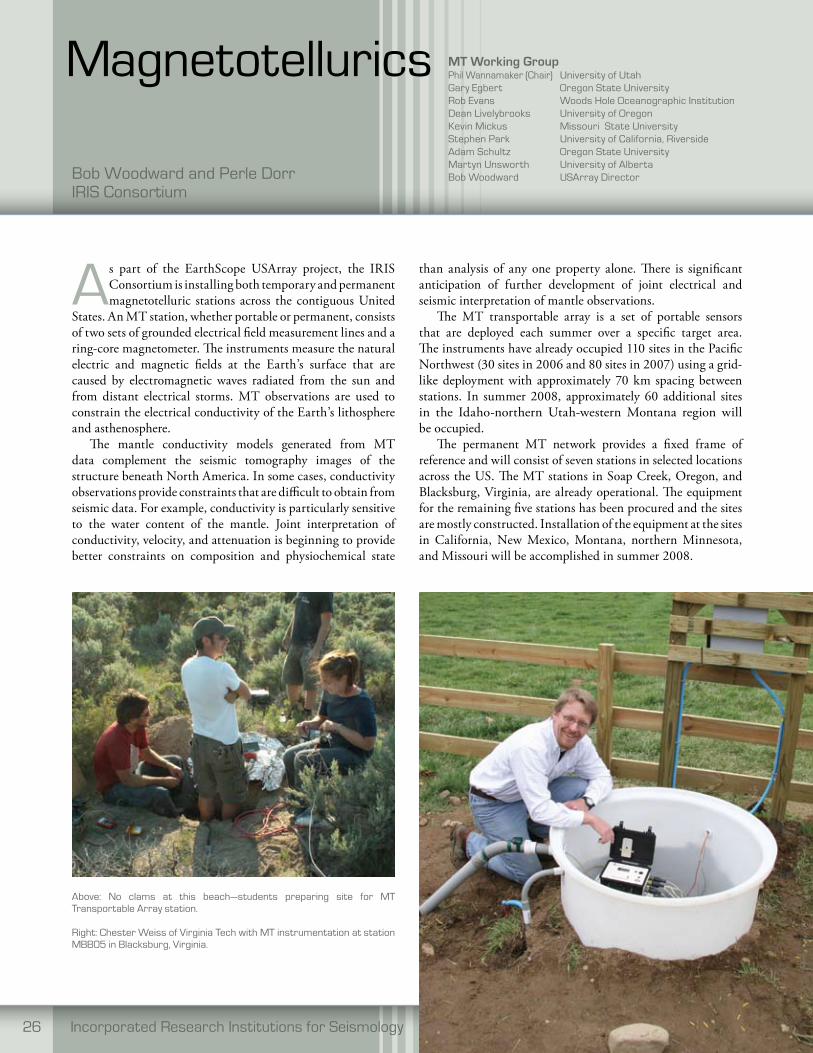
26 Incorporated research Institutions for Seismology
Magnetotellurics Mt Working groupphil Wannamaker (Chair) university of utahGary egbert oregon State universityrob evans Woods Hole oceanographic InstitutionDean livelybrooks university of oregonKevin Mickus Missouri State universityStephen park university of California, riversideadam Schultz oregon State universityMartyn unsworth university of albertaBob Woodward uSarray Director
above: no clams at this beach—students preparing site for Mt transportable array station.
right: Chester Weiss of Virginia tech with Mt instrumentation at station MBB05 in Blacksburg, Virginia.
as part of the EarthScope USArray project, the IRIS Consortium is installing both temporary and permanent magnetotelluric stations across the contiguous United
States. An MT station, whether portable or permanent, consists of two sets of grounded electrical field measurement lines and a ring-core magnetometer. The instruments measure the natural electric and magnetic fields at the Earth’s surface that are caused by electromagnetic waves radiated from the sun and from distant electrical storms. MT observations are used to constrain the electrical conductivity of the Earth’s lithosphere and asthenosphere.
The mantle conductivity models generated from MT data complement the seismic tomography images of the structure beneath North America. In some cases, conductivity observations provide constraints that are difficult to obtain from seismic data. For example, conductivity is particularly sensitive to the water content of the mantle. Joint interpretation of conductivity, velocity, and attenuation is beginning to provide better constraints on composition and physiochemical state
than analysis of any one property alone. There is significant anticipation of further development of joint electrical and seismic interpretation of mantle observations.
The MT transportable array is a set of portable sensors that are deployed each summer over a specific target area. The instruments have already occupied 110 sites in the Pacific Northwest (30 sites in 2006 and 80 sites in 2007) using a grid-like deployment with approximately 70 km spacing between stations. In summer 2008, approximately 60 additional sites in the Idaho-northern Utah-western Montana region will be occupied.
The permanent MT network provides a fixed frame of reference and will consist of seven stations in selected locations across the US. The MT stations in Soap Creek, Oregon, and Blacksburg, Virginia, are already operational. The equipment for the remaining five stations has been procured and the sites are mostly constructed. Installation of the equipment at the sites in California, New Mexico, Montana, northern Minnesota, and Missouri will be accomplished in summer 2008.
Bob Woodward and perle Dorr IrIS Consortium

2008 annual report 27
Magnetotelluric (MT) data are being acquired by a series of arrays deployed across the continental US as part of the USArray component of EarthScope. These
long-period data (periods from 10-10,000 s) have already been collected from 110 sites covering the Pacific Northwest and are being used to constrain the conductivity structure of the crust and upper mantle to depths exceeding 100 km. The MT arrays have occupied sites on a quasi-uniform 70 km grid, in contrast to traditional MT surveys where sites are concentrated along one or a few profiles. Both the site distribution and the relatively dense station spacing traverse a wide range of geologic environments, such as the Juan de Fuca subduction zone along the west coast, the Cascade volcanoes, the Columbia Plateau, and the high desert transitioning into the Basin and Range Province, demand three-dimensional (3-D) inversion and interpretation of the data.
The 3-D inversion of the current MT dataset reveals
extensive areas of high conductivity in the lower crust beneath the northwest Basin and Range and beneath the Cascade Mountains. This contrasts with the very resistive crust in Siletzia, the accreted thick ocean crust which forms the basement rocks in the Cascadia forearc and the Columbia Embayment. The conductive lower crust beneath southeastern Oregon is inferred to result from fluids, including possibly partial melt at depth, associated with magmatic underplating. The high conductivities beneath the Cascades probably result from fluids released by the subducting Juan de Fuca slab. Resistive Siletzia represents a stronger crustal block, accommodating deformation in the surrounding crust by rigid rotation. Significant variations in upper mantle conductivity are also revealed by the inversions, with the most conductive mantle beneath the northern part of the array in the backarc and the most resistive corresponding to subducting oceanic mantle under the western edge of the array.
3-D resistivity structure of pacific northwest derived from inversion of uSarray Mt data. C1: conductive lower crust in the Basin and range, High lava plains, and Blue Mountains; C2: conductive features beneath the Cascades; r1: resistive Siletzia; r2: resistive oceanic mantle. Dashed white line marks contact interpreted as the southern boundary of Siletzia.
three-Dimensional Conductivity Structure of the pacific northwestGary egbert and prasanta patro, oregon State university
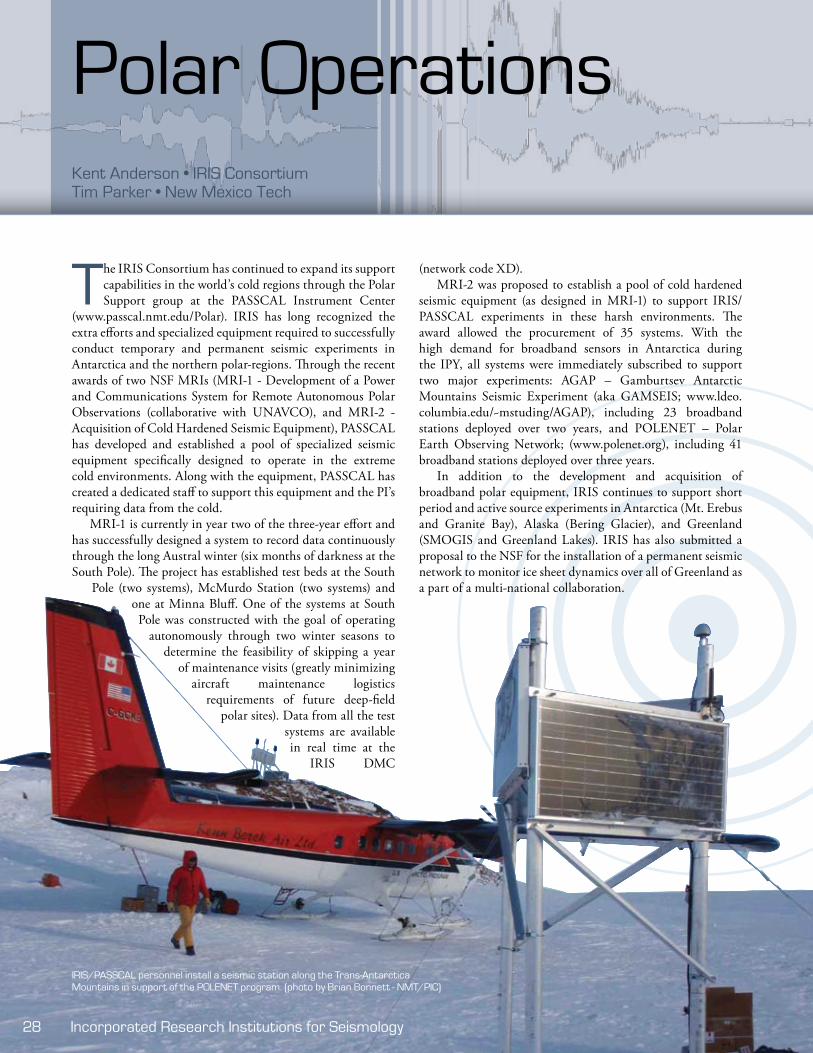
28 Incorporated research Institutions for Seismology
polar operations
the IRIS Consortium has continued to expand its support capabilities in the world’s cold regions through the Polar Support group at the PASSCAL Instrument Center
(www.passcal.nmt.edu/Polar). IRIS has long recognized the extra efforts and specialized equipment required to successfully conduct temporary and permanent seismic experiments in Antarctica and the northern polar-regions. Through the recent awards of two NSF MRIs (MRI-1 - Development of a Power and Communications System for Remote Autonomous Polar Observations (collaborative with UNAVCO), and MRI-2 - Acquisition of Cold Hardened Seismic Equipment), PASSCAL has developed and established a pool of specialized seismic equipment specifically designed to operate in the extreme cold environments. Along with the equipment, PASSCAL has created a dedicated staff to support this equipment and the PI’s requiring data from the cold.
MRI-1 is currently in year two of the three-year effort and has successfully designed a system to record data continuously through the long Austral winter (six months of darkness at the South Pole). The project has established test beds at the South
Pole (two systems), McMurdo Station (two systems) and one at Minna Bluff. One of the systems at South Pole was constructed with the goal of operating
autonomously through two winter seasons to determine the feasibility of skipping a year
of maintenance visits (greatly minimizing aircraft maintenance logistics
requirements of future deep-field polar sites). Data from all the test
systems are available in real time at the
IRIS DMC
(network code XD).MRI-2 was proposed to establish a pool of cold hardened
seismic equipment (as designed in MRI-1) to support IRIS/PASSCAL experiments in these harsh environments. The award allowed the procurement of 35 systems. With the high demand for broadband sensors in Antarctica during the IPY, all systems were immediately subscribed to support two major experiments: AGAP – Gamburtsev Antarctic Mountains Seismic Experiment (aka GAMSEIS; www.ldeo.columbia.edu/~mstuding/AGAP), including 23 broadband stations deployed over two years, and POLENET – Polar Earth Observing Network; (www.polenet.org), including 41 broadband stations deployed over three years.
In addition to the development and acquisition of broadband polar equipment, IRIS continues to support short period and active source experiments in Antarctica (Mt. Erebus and Granite Bay), Alaska (Bering Glacier), and Greenland (SMOGIS and Greenland Lakes). IRIS has also submitted a proposal to the NSF for the installation of a permanent seismic network to monitor ice sheet dynamics over all of Greenland as a part of a multi-national collaboration.
IrIS/paSSCal personnel install a seismic station along the trans-antarctica Mountains in support of the polenet program. (photo by Brian Bonnett - nMt/pIC)
Kent Anderson • IRIS ConsortiumTim Parker • New Mexico Tech

2008 annual report 29
Datagrams used in this report
Vertical broadband record of the MW
6.1 deep crustal (h > 20 km) earthquake on october 11, 2008 by uSGS Caribbean network station anWB (Willy Bob, antigua and Barbuda) at Δ = 3.2°. Seismically triggered tsunami alerts for puerto rico and countries around the Caribbean Sea are based on real time telemetry to quickly analyze large amplitude arrivals at anWB and at other broadband stations in the region.
Vertical record of the MW
6.9 earthquake on February 8, 2008 located off the coast of South america and recorded in argentina. paSSCal experiment name: Sierras pampeanas. pI’s: Susan Beck and George Zandt
this seismogram is from the M 6.0 nevada earthquake of Feb 21, 2008. the nevada earthquake occurred virtually in the center of the transportable array footprint at the time, providing remarkable distance and azimuthal station coverage. the seismogram shown is from station n12a, one of the closest stations to the event, at roughly 36 km. the recording shows approximately 3 minutes of unfiltered 40 samples per second vertical channel data.
recording from an IrIS paSSCal instrument (Q330-Guralp 40t) placed on a large iceberg near McMurdo station antarctica. the odd signal results from two large icebergs coming into contact with one another as the tides come in and go out. the “eye” of the contact storm is coincidental with the change in direction of the tide flow (Macayeal, D. r., e. okal, r. aster, and J. Bassis (2008), Seismic and hydroacoustic tremor generated by colliding icebergs, /J. Geophys. res.,/ doi:10.1029/2008JF001005, in press).
Vertical broadband record of the MW
7.9 Wenchuan, China, earthquake on May 12, 2008 by station KuM.MY at Δ = 26.3°. The station at Kulim belongs to the Malaysian national Seismic network, operated by Malaysian Meteorological Department. Malaysia has provide open access to its data in near-real-time through the DMS since 2005, shortly after the Sumatra great earthquake on December 26, 2004.
Vertical record of the MW
5.2 Illinois earthquake on april 18, 2008 by thompson Middle School in St. Charles, Il on their aS1 seismograph (tMIl), at 3.5 degrees. While causing only minor damage, the earthquake was felt in parts of 16 states. Given the relatively small number of research seismographs in much of the region, recordings from local educational seismographs were popular with the news media.

30 Incorporated research Institutions for Seismology
activities and publications
In addition to program oversight and administration, the Consortium also serves the role of an ongoing forum for exchanging ideas, setting community priorities, and fostering
cooperation. To enhance this role, IRIS engages the broader community through the use of publications and workshops. Our publications, which are widely distributed without charge, are organized around topical issues that highlight emerging opportunities for seismology. The IRIS Workshop and the EarthScope National Meeting are used to assess the state of the science, introduce programs, and provide training. Through a student grant program, young scientists attend the IRIS Workshop at little or no cost, and are introduced to the programs and services of the Consortium. As a Consortium, IRIS also serves as a representative for the Geoscience community. IRIS staff and Committee members serve on White House Committees, State Department Advisory Boards, US Geological Survey panels, and testify before Congress. Such broad interactions raise the profile of Geosciences and provide a direct societal return from the federal investment in IRIS.
IrIS Workshop
The 19th IRIS Workshop was held on June 4-6 at Skamania Lodge in Stevenson, Washington, and attracted about 300 participants. The plenary sessions and posters on integrating data from different disciplines and on USArray science showed how, with a wealth of data, seismologists are collaborating with
other Earth scientists to move far beyond cliché
Raymond Willemann • IRIS Consortium
not your average 3-D movie: attendees don special 3-D googles to view the KeckCaVeS demonstration at the 2008 IrIS Workshop.
attendees of the 2008 IrIS Workshop enjoy a field trip through the Columbia river Gorge.

2008 annual report 31
tomograms of “reddite” and “bluite”. Sessions on nonvolcanic tremor and slip and on synergy in event monitoring and research featured breakthroughs in understanding the myriad natural processes that generate seismic waves. Talks and posters on recent advances in polar seismology emphasized that ice and water are not just good media for emplacing sources and receivers, but also vessels of incompletely understood phenomena with important effects on humanity.
The Workshop also provides an opportunity for groups with overlapping interests to hold complementary gatherings. On the days before and after this year’s main event there were symposia on EarthScope magnetotelluric stations, controlled source seismology, DMC data access tools, multinode computing, and Antelope seismic processing software.
publications
Publication of the IRIS Newsletter continued, including articles on IPY-related IRIS activities, use of strong motion data from the built environment, and IRIS long-term instrument loans. E&O publications include an animated postcard illustrating normal mode oscillations of the earth and a growing volume of material for the Active Earth Display. In a collaborative effort, IRIS and UNAVCO continued publishing onSite, a quarterly newsletter for EarthScope station hosts and the general public that provides a brief update of the EarthScope facilities and features articles on how the station they are hosting contributes to expanding our knowledge of the North American continent. IRIS’s web site — effectively, the Consortium’s updatable on-line publication — was completely redesigned to provide a more intuitive interface and facilitate regular updates to keep the content relevant to recent, newsworthy events from seismology.
2006 Annual Report
I n c o r p o r a t e d R e s e a r c h I n s t i t u t i o n s f o r S e i s m o l o g y
above: the new and improved IrIS Web site launched in the Spring of 2008
at right: a sample of the various publications published by IrIS.
32 Incorporated research Institutions for Seismology
Financial overviewCandy Shin • IRIS Consortium
the Incorporated Research Institutions for Seismology (the IRIS Consortium) is a 501(c)(3) non-profit consortium of research institutions founded in 1984 to develop
scientific facilities, distribute data, and promote research. IRIS is incorporated in the State of Delaware.
GSn
The Global Seismographic Network is operated in partnership with the USGS. Funding from NSF for the GSN supports the installation and upgrade of new stations, and the operation and maintenance of stations of the IDA Network at University of California, San Diego and other stations not funded directly within the budget of the USGS. Operation and maintenance of USGS/GSN stations is funded directly through the USGS budget. Subawards include the University of California, San Diego, the University of California, Berkeley, the California Institute of Technology, Columbia University, USGS (Albuquerque Seismological Laboratory), and Synapse Science Center, Moscow.
paSSCal
Funding for PASSCAL is used to purchase new instruments, support the Instrument Center at the New Mexico Institute of Mining and Technology, train scientists to use the instruments, and provide technical support for instruments in the field. Subawards include the New Mexico Institute of Mining and Technology (New Mexico Tech), and University of Texas at El Paso.
DMS
Funding for the Data Management System supports data collection, data archiving, data distribution, communication links, software development, data evaluation, and Web interface systems. Major subawards include the University of Washington, the University of California, San Diego, Columbia University, and the Institute for Geophysical Research, Kazakstan.
education and outreach
Funding for the Education and Outreach Program is used to support teacher and faculty workshops, undergraduate internships, the production of hard-copy, video and Web-based educational materials, a distinguished lecturer series, educational seismographs, and the development of museum displays. Subawards are issued to IRIS institutions for software and classroom material development, summer internship support and support of educational seismology networks.
earthScope
EarthScope awards include funding for USArray and EarthScope E&O activities. Subawards include the University of California, San Diego, New Mexico Tech, the University of California, Berkeley, the California Institute of Technology, Arizona State University, Oregon State University, University of Nevada, Reno, UNAVCO, and other siting and partnership subawards. Contracts for USArray TA and MT station construction and installation are to Honeywell, GSY-USA, and Coastal Technical Services.
Indirect expenses
Costs include corporate administration and business staff salaries; audit, human resources and legal services; headquarters and Seattle office expenses; insurance; and corporate travel costs.
other activities
Other activities include IRIS workshops, publications and special projects such as the Kyrghyz Seismic Network.
A complete copy of IRIS' financial statements and auditor's reports are available from the IRIS business office by contacting [email protected].
budget and finance subcommitteeanne Sheehan (Chair) university of Colorado, BoulderKen Creager university of WashingtonDon Forsyth Brown universityCandy Shin IrISray Willemann IrIS
Program coordinating committee (cocoM)Charles ammon (Chair) pennsylvania State universitytim ahern IrISrobert Busby IrISrhett Butler IrISJim Fowler IrISJames Gaherty Columbia universityalan lavender rice universityCandy Shin IrISDavid Simpson IrISXiaodong Song university of Illinois urbana, ChampaignJohn taber IrISDouglas Wiens Washington university, St. louisBob Woodward IrISrobert Woolley IrISMichael Wysession Washington university, St. louis
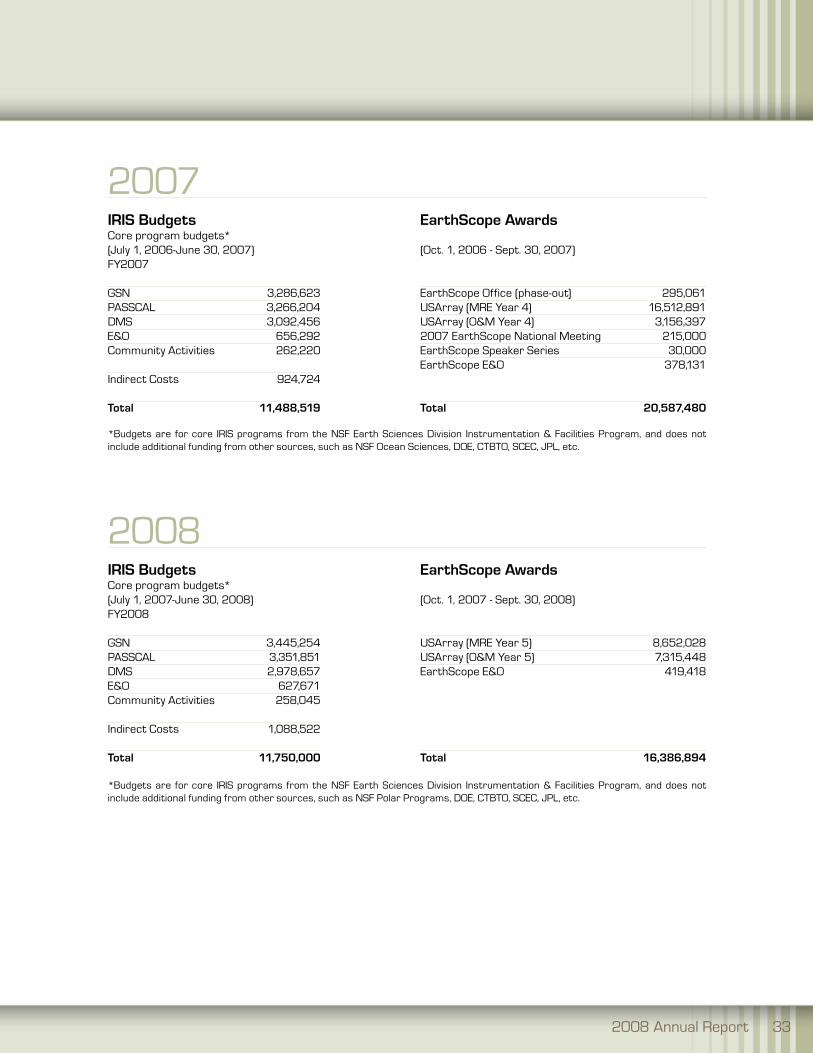
2008 annual report 33
2007 iris budgets earthscope Awards Core program budgets* (July 1, 2006-June 30, 2007) (oct. 1, 2006 - Sept. 30, 2007) FY2007 GSn 3,286,623 earthScope office (phase-out) 295,061paSSCal 3,266,204 uSarray (Mre Year 4) 16,512,891DMS 3,092,456 uSarray (o&M Year 4) 3,156,397e&o 656,292 2007 earthScope national Meeting 215,000Community activities 262,220 earthScope Speaker Series 30,000 earthScope e&o 378,131Indirect Costs 924,724
total 11,488,519 total 20,587,480
*Budgets are for core IrIS programs from the nSF earth Sciences Division Instrumentation & Facilities program, and does not include additional funding from other sources, such as nSF ocean Sciences, Doe, CtBto, SCeC, Jpl, etc.
2008 iris budgets earthscope Awards Core program budgets*(July 1, 2007-June 30, 2008) (oct. 1, 2007 - Sept. 30, 2008)FY2008 GSn 3,445,254 uSarray (Mre Year 5) 8,652,028paSSCal 3,351,851 uSarray (o&M Year 5) 7,315,448DMS 2,978,657 earthScope e&o 419,418e&o 627,671Community activities 258,045 Indirect Costs 1,088,522 total 11,750,000 total 16,386,894 *Budgets are for core IrIS programs from the nSF earth Sciences Division Instrumentation & Facilities program, and does not include additional funding from other sources, such as nSF polar programs, Doe, CtBto, SCeC, Jpl, etc.

34 Incorporated research Institutions for Seismology
StaFF
IrIS Headquarters1200 new York ave. nW, Suite 800Washington, DC 20005Telephone (202) 682-2220 • Fax (202) 682-2444 • www.iris.edu
Josephine aka Business analystrobert austin Staff accountant/procurement Coordinatorrick Callender Media and Graphics Specialistperle Dorr uSarray project associatelisa Green Senior accounting analystMichael Hubenthal education Specialistleslie linn executive assistantpatrick McQuillan education and outreach Specialistanthony Mctier accounting Managerrobin Morris Business analyst/Contractsteresa Saavedra office Manager/receptionistCandy Shin Director of Finance and administrationDavid Simpson presidentruth Sobel Business projects ManagerJohn taber e&o program ManagerMatt toigo Web Developerruss Welti Software engineer - education and outreachray Willemann Director of planningrobert Woodward uSarray Directorrob Woolley Director of project administration
Kent anderson GSn operations Managerrhett Butler GSn program Manager
robert Busby transportable array Manageranthony Gonzales uSarray lead Construction engineerKatrin Hafner transportable array Chief of operationsHoward peavey Station SpecialistGraylan Vincent reconnaissance Specialist
Data Management Center1408 ne 45th Street, Suite 201Seattle, Washington 98105-4505Telephone (206) 547-0393 • Fax (206) 547-1093
rick Benson Director of operationsrick Braman unIX Systems administratorMatthew Canfield Data Control technicianrob Casey Director of Software engineeringMary edmunds Data Control technicianGale eschete office Manager (travel questions)un Joe Data Control technicianpeggy Johnson uSarray Data Control analystlonny Jones uSarray Systems administratorlinus Kamb uSarray Software engineertim Knight Information Services Coordinator/WebmasterChris laughbon Senior Software engineeranh ngo operations programmerthani rojanaparpai Data Control technicianSue Schoch Senior Software engineer (database specialization)Gillian Sharer uSarray Data Control analystSandy Stromme Software engineerMary templeton uSarray Data Control analystChad trabant uSarray lead Data Control analystBruce Weertman Software engineerMaryann Wood Data Control techniciantimothy ahern program Manager
paSSCalnew Mexico tech100 east roadSocorro, nM 87801Telephone (505) 835-5070 • Fax (505) 835-5079
Marcos alvarez Deputy program ManagerJames Fowler program Manager
IrIS partners operating major facilities with separately employed staffs include project IDa (http://ida.ucsd.edu), new Mexico tech (http://www.passcal.nmt.edu), the uSGS albuquerque Seismological laboratory (http://earthquake.usgs.gov/regional/asl), and the uS array network Facility (http://anf.ucsd.edu).
2008 annual report 35
the iris mission, actively supported by each Member and Affiliate institution, is to:
• Facilitate and conduct geophysical investigation of seismic sources and earth properties using seismic and other geophysical methods.
• Promote exchange of geophysical data and knowledge, both through use of standards for network operations, data formats and exchange protocols, and through pursuing policies of free and unrestricted data access.
• Foster cooperation among IRIS Members, Affiliates, and other organizations in order to advance geophysical research and convey benefits from geophysical progress to all of humanity.

I n c o r p o r a t e d re s e a r c h In s t i t u t i o n s f o r S e i s m o l o g y
IRIS Consortium1200 New York Avenue, NWSuite 800Washington, D.C. 20005
ADDReSS SeRVICe ReQueSteD
Non Profit Org.u.S. Postage
PAIDWashington, DCPermit No. 1227
Founded in 1984 with support from the national Science Foundation, IrIS is a consortium of over 100 uS universities dedicated to the operation of science facilities for the acquisition, management, and distribution of seismological data. IrIS programs contribute to scholarly research, education, earthquake hazard mitigation, and the verification of a Comprehensive test Ban treaty.
IrIS is a 501 (c) (3) nonprofit organization incorporated in the state of Delaware with its primary headquarters office located in Washington, DC.


