
Annual Results 2004
January 27, 2005

2
Forward Looking StatementsForward Looking StatementsThis document contains certain forward-looking statements with respect to the financial condition, results of operations and business of Philips and certain of the plans and objectives of Philips with respect to these items (including, but not limited to, cost savings) in particular the outlook paragraph in this report. By their nature, forward-looking statements involve risk and uncertainty because they relate to events and depend on circumstances that will occur in the future. There are a number of factors that could cause actual results and developments to differ materially from those expressed or implied by these forward-looking statements. These factors include, but are not limited to, levels of consumer and business spending in major economies, changes in consumer tastes and preferences, changes in law, the performance of the financial markets, pension costs, the levels of marketing and promotional expenditures by Philips and its competitors, raw materials and employee costs, changes in exchange and interest rates (in particular changes in the euro and the US dollar can materially affect results), changes in tax rates and future business combinations, acquisitions or dispositions and the rate of technological changes. Statements regarding market share, including as to Philips’ competitive position, contained in this document are based on outside sources such as specialized research institutes, industry and dealer panels in combination with management estimates. Where information is not yet available to Philips, those statements may also be based on estimates and projections prepared by outside sources or management. Rankings are based on sales unless otherwise stated.
Use of non-GAAP InformationIn presenting and discussing the Philips Group’s financial position, operating results and cash flows, management uses certain non-GAAP financial measures. These non-GAAP financial measures should not be viewed in isolation as alternatives to the equivalent GAAP measures and should be used in conjunction with the most directly comparable US GAAP measure(s). A discussion of the non-GAAP measures included in this document and a reconciliation of such measures to the most direc tly comparable US GAAP measure(s) are contained in this document.

3
Gerard Kleisterlee
Jan Hommen
Gerard Kleisterlee

4
20032002
31,820
420
(3,206)
2,228
(940)
11.1
27 : 73
170,087
Performance of the Philips GroupEUR million
29,037
488
695
1,992
(856)
11.0
18 : 82
164,438
2004
Sales
Income from operations
Net income (loss)
Cash flow from operations
Net capital expenditures
Inventories as % of sales
Net debt to group equity
Employees
30,319
1,607
2,836
2,697
(1,198)
10.7
1 : 99
161,586
5
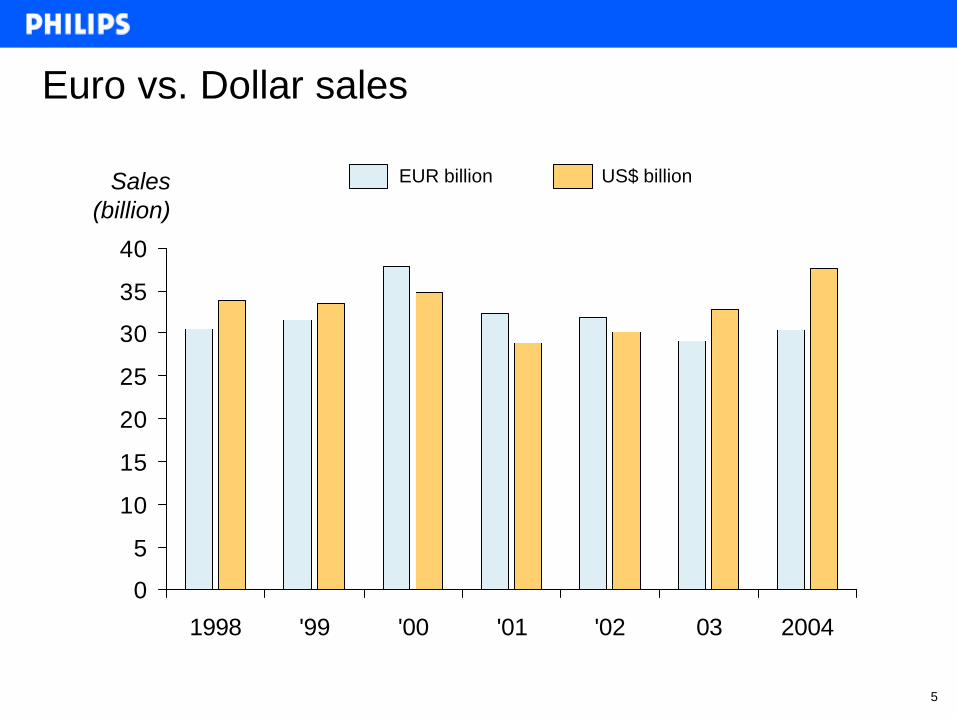
Euro vs. Dollar sales
0
5
10
15
20
25
30
35
40
1998 '99 '00 '01 '02 03 2004
EUR billion US$ billionSales (billion)

6
20032002
31,820
420
(3,206)
2,228
(940)
11.1
27 : 73
170,087
Performance of the Philips GroupEUR million
29,037
488
695
1,992
(856)
11.0
18 : 82
164,438
2004
Sales
Income from operations
Net income (loss)
Cash flow from operations
Net capital expenditures
Inventories as % of sales
Net debt to group equity
Employees
30,319
1,607
2,836
2,697
(1,198)
10.7
1 : 99
161,586

7
Gerard Kleisterlee
Jan Hommen
Gerard Kleisterlee

8
Agenda
• Financial performance FY 2004
• Currency Exposure
• Key Financial Management Actions
• Summary

9
Summary – FY amounts in EUR million
20042003
29,037
488
506
695
2,734
18 : 82
30,319
1,607
1,422
2,836
3,350
1 : 99
Sales
Income from operations
Result relating to UCCs
Net Income
Cash flow before financing activities
Net debt / Group equity ratio
10
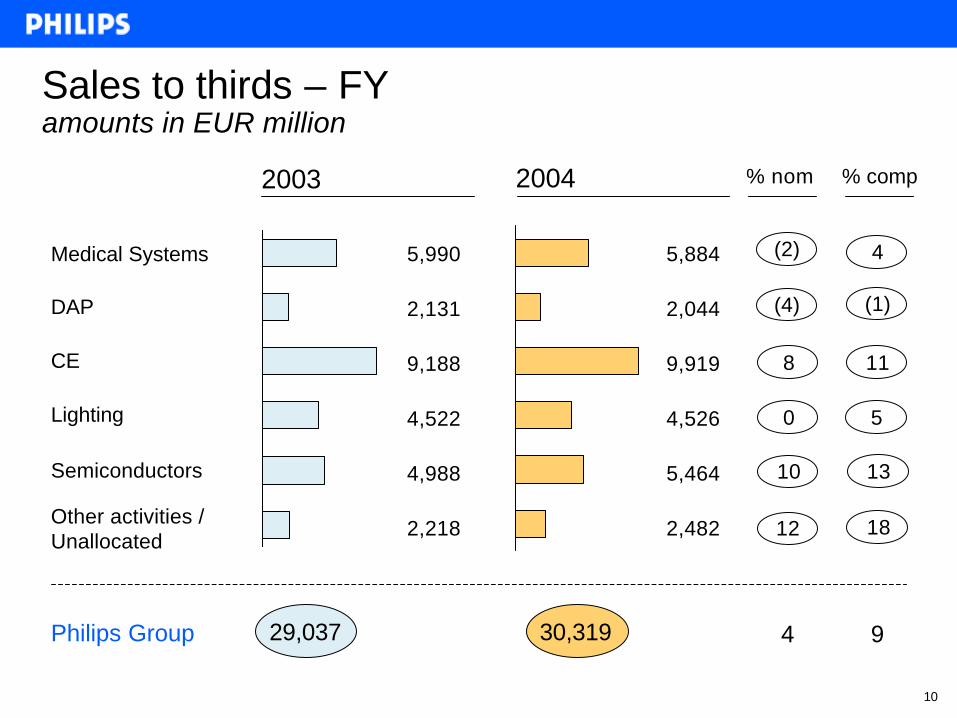
Sales to thirds – FY amounts in EUR million
Medical Systems
DAP
CE
Lighting
Semiconductors
Other activities / Unallocated
Philips Group
0
8
(4)
10
(2)
2003 2004
4
5
11
(1)
13
4
9
% nom
29,037
12 18
% comp
30,319
5,990
2,131
9,188
4,522
4,988
2,218
5,884
2,044
9,919
4,526
5,464
2,482

11
IFO – FY amounts in EUR million
Medical Systems
DAP
CE (of which Licenses)
Lighting
Semiconductors
Other Activities
Unallocated
Philips Group
20042003
431
398
248
577
(342)
(263)
(561)
488
34
323
361
591
450
366
(518)
1,607
297 478

12
IFO – FY breakdown Other Activities amounts in EUR million
Corporate Investments
Technology Cluster
Optical Storage
Other
Total Other Activities
20042003
(63)
(293)
51
42
(263)
35
(323)
68
586
366

13
IFO – FY breakdown Unallocated amounts in EUR million
Corporate & Regional Overheads
Pensions / postretirement benefit costs
Total Unallocated
20042003
(307)
(254)
(561)
(367)
(151)
(518)

14
EBITA target surpassed in Medical Systems amounts in EUR million
Revenues
IFO
Goodwill impairments MedQuist
Amortisation of intangibles
EBITA
Volumetrics settlement
EBITA (adjusted for Volumetrics)
as % of revenues
2004
5,897
34
590
90
714
133
847
14.4%
+
+
+

15
Results relating to unconsolidated companiesamounts in EUR million
1,422
506
(1,346)
(608)
2001 2002 2003 2004

16
Cash Flow – FYamounts in EUR million
2003
695
2,787
(987)
(569)
307
(241)
1,992
(980)
1,722
2,734
Net Income
Depreciation / Amortization / Impairments
Net gain on sale of investments
Income from UCCs
Decrease in WC / other current assets
Other
CF from operations
Gross capital expenditures
Acquisitions/Divestments/Other
CF before financing activities
2004
2,836
2,301
(1,328)
(1,178)
354
(288)
2,697
(1,286)
1,939
3,350
17
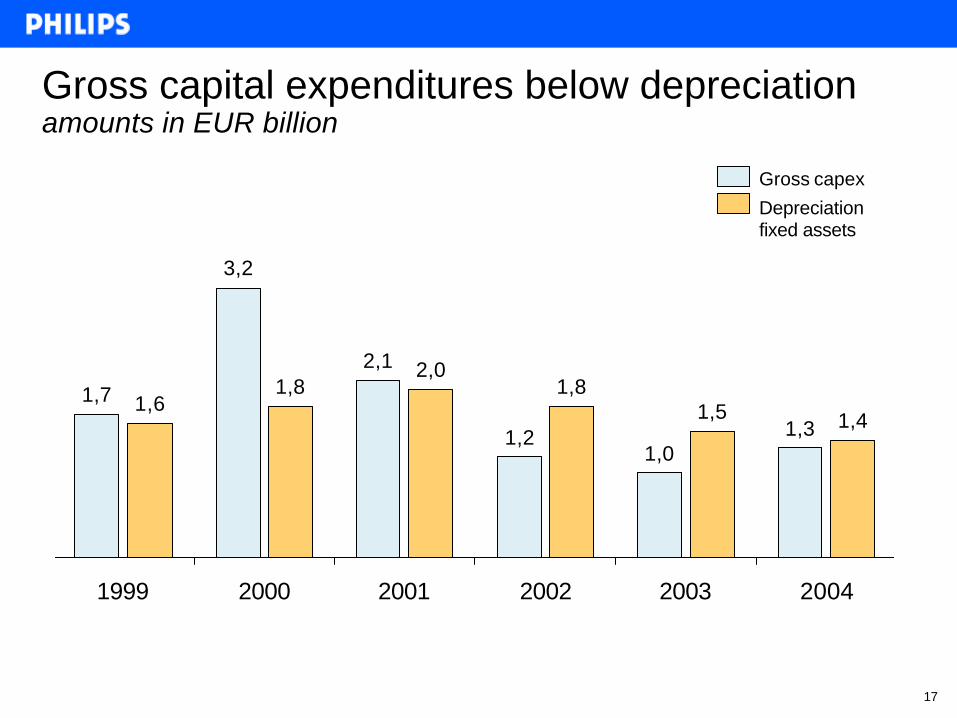
Gross capital expenditures below depreciationamounts in EUR billion
Gross capex
Depreciation fixed assets
1,7
3,2
2,1
1,21,0
1,31,6
1,82,0
1,81,5 1,4
1999 2000 2001 2002 2003 2004

18
10.7
13.4
12.512.1
11.0
13.4
12.8
12.1
11.1
14.1
13.4
14.0
13.3
14.9
16.0
15.6
10
17
1Q 2Q 3Q 4Q 1Q 2Q 3Q 4Q 1Q 2Q 3Q 4Q 1Q 2Q 3Q 4Q
Inventoriesas % of MAT sales
20022001 2003 2004

19
Net debt / Group equity ratioamounts in EUR billion
18:82 18:82 21:79 1:99
12,9 13,6 14,315,3 15,1
2,8 3,0 3,7 3,2
0,2
4Q03 1Q04 2Q04 3Q04 4Q04
17:83Net debt / group equity ratio
Group equity
Net debt
20
Agenda
• Financial performance FY 2004
• Currency Exposure
• Key Financial Management Actions
• Summary

21
Transaction exposure on the P&L account
• The effect of mismatch between revenues and costs for the Philips group is approx. 4% of the group sales
• This exposure is hedged for an average period of 6 months
• Trying to match our revenues with a cost structure in the same currency

22
Foreign exchange exposures Hedging policy
Transactions
Loans and cash deposits
Equity holdings and investments
Translation of results
Hedged
Hedged
Not hedged
Not hedged

23
Translation impact on the P&L account% reported in USD or USD related
Sales
IFO
Financial expenses
Unconsolidated companies
50 – 55%
40 – 45%
75 – 80%
90 – 95%

2432004-01-22
Translation exposure on the Balance Sheet
• Philips equity is partially exposed to the USD
• Most of our debt is in USD or swapped into USD

25
Agenda
• Financial performance FY 2004
• Currency Exposure
• Key Financial Management Actions
• Summary

26
Total Return to Shareholders – 1 YearCAGR Jan 04’ – Dec ’04 - %
6538
2825
231615
1298
53
10
(1)(5)
(10)(13)(14)
(22)(24)
(32)(37)
(89)
EMERSON
WHIRLPOOL
GILETTE
IBM
ELECTROLUX
SANYO
ROYAL PHILIPS ELECTRONICS
SIEMENS
GENERAL ELECTRIC
TYCO
SHARP
SAMSUNG
INTEL
MATSUSHITA
NOKIA
SONY
HITACHI
MOTOROLA
NEC
LG
TEXAS INSTRUMENTS
ERICSSON
LUCENT
MARCONI

27
5214
(2)(8)(9)
(13)(13)(14)(15)
(34)(37)(37)(38)
(42)(43)
(46)(51)(51)
(56)(60)(61)(61)(61)
(100)
Total Return to Shareholders – 3 YearCAGR Jan 02’ – Dec ’04 - %
EMERSON
WHIRLPOOL
GILETTE
IBM
ELECTROLUX
SANYO
ROYAL PHILIPS ELECTRONICS
SIEMENS
GENERAL ELECTRIC
TYCO
SHARP
SAMSUNG
INTEL
MATSUSHITA
NOKIA
SONY
HITACHI
MOTOROLA
NEC
LG
TEXAS INSTRUMENTS
ERICSSONLUCENT
MARCONI

28
Dividend paidamounts in EUR
1 – Proposal subject to approval in the General Shareholders Meeting on March 31, 2005
0.400.360.360.360.36
0.300.250.23
0.180.180.14
1995 '96 '97 '98 '99 '00 '01 '02 '03 '04 2005
1

29
Financial assets: Cash generated from sale of participationsamounts in EUR million
Sale securities
Sale Atos Origin shares
NAVTEQ IPO
TSMC preference shares
Sale TSMC ADRs
Total
20042003
272
–
–
357
908
1,537
883
552
672
–
–
2,107

30
Publicly quoted investments: market valueamounts in EUR million
TSMC
JDS Uniphase
FEI
Great Nordic
Atos Origin
LG.Philips LCD
NAVTEQ
Total
Dec, 2004Dec, 2003
5,748
114
150
35
1,081
-
-
7,961
5,174
91
124
56
516
4,031
1,043
11,035
Jan 24, 2005
4,995
72
120
55
496
4,840
969
11,547

31
Indirect cost reductions in 2004 – EUR 250 m.amounts in EUR million
Target Realization
250274
SellingG&AR&D
SellingG&AR&D

32
New ambition level after benchmarking Best-in-Class
Philips
25% - 30%Potential savings
Best-in-
ClassSuperior
Processes

33
Agenda
• Financial performance FY 2004
• Currency Exposure
• Key Financial Management Actions
• Summary

34
Summary
We are now a company with following characteristics:
– Lower costs
– Simpler to understand
– Growing stability and predictability
– Strong financial position
– Many more “best-in-class” processes
– Desire for greater improvements

35
Gerard Kleisterlee
Jan Hommen
Gerard Kleisterlee

36
P
P
+ –
2004 Management Agenda
PPAchieve 14% EBITA in Medical Systems
Implement CE renewal program to achieve stable 4 - 4.5% IFO by the end of 2005
Accelerate profitable growth through sustained transformation of Philips into a market driven organization
Extend number of product leadership positions and increase innovation rate across the group
Continued focus on indirect costs to achieve additional savings of € 250M PP

37
Medical Systems -14% EBITA target surpassedEBITA as % of sales
14,4%
11,9%9,9%
2002 2003 20041 2 3
1 – Excluding the HCP business which was sold in 20022 – Excluding restructurings3 – Excluding the settlement for the litigation with Volumetrics Inc. of EUR 133 m.

38
Implement CE renewal program to achieve stable 4 - 4.5% IFO by the end of 2005
• Implementation of strategy including business renewal on-track– Signed Letter of Intent with TPV – Acquired Gemini accessories business– Cost savings ahead of schedule – Strong Q4 with excellent cash flow
• Strong collection of past due licenses more than compensated forrestructuring - resulting in 3.6% combined IFO
• Fast commoditization of digital products leading to increased pressure on margins
• Margin pressure will remain through 2005, with less compensation from license income

39
Becoming a more market driven organization
• Launched Board–led cross-PD Key Account management
• Extensive deployment of the brand pillars across the organization
– Advanced – Easy to experience – Designed around you
• Successful launch of “Sense and Simplicity”

40
R&D drives innovation and product leadership
Group revenues from new productsAllocation of Group R&D budget
2003 2004E
25%
45%
30% 20%
30%
50%
Emerging markets
Growth markets
Mature markets
2003 2004E 2005 Target
25%
~38%~42%
+52%
+10%

41
Consumer Electronics
Ambilight Wireless music center
Significant new product introductions in 2004 /2005U 22
DAP
Perfective IntelliClean PerfectDraft
SemiconductorsNear Field Communication
Medical Systems
Precedence SPECT/CT
Panorama MR 1.0T
Brilliance CT
Lighting
UHP Mini CDMMastercolour
Nightguide Xenon

42
219480
1020
3,4312,420
980
'02 '04 '06
Strong progress in further reducing costs –surpassing €250M in 2004
Headcount reduction from local Finance operations to SSC
3,650
2,900
2,000
Shared service centers
CAGR‘00-’06
- 14%
+47%
- 27%Local operations
Reduction of the numbers of ERPs used in Philips
2859
229
508
1997 2002 2004 2006
CAGR-28%
Target Target

43
Philips Strategy
• Increase profitability through allocation of resources towards higher return opportunities
• Leverage the Philips brand and our core competencies in the areas of Healthcare, Lifestyle and Technology to grow in selected categories and geographies
• Build partnerships with key customers and suppliers for B2B and B2C markets
• Continue to invest in world class innovation and leverage strong IP position
• Strengthen our leadership competencies
• Drive productivity through Business Transformation and Operational Excellence

44
2005 Management Agenda
• Grow Healthcare as part of the portfolio
• Continue the transformation of Philips into a market driven organization
• Focus on innovation across the Group
• Reduce earnings volatility of cyclical businesses
• Further simplifying Philips – reducing overall costs by an additional € 500M in savings (3-4 years)

45
2005 Management Agenda
• Grow Healthcare as part of the portfolio
• Continue the transformation of Philips into a market driven organization
• Focus on innovation across the Group
• Reduce earnings volatility of cyclical businesses
• Further simplifying Philips – reducing overall costs by an additional € 500M in savings (3-4 years)

46
Philips Group Objectives
• IFO margins 7-10% in the next 1-2 years
• Consistent returns in excess of the cost of capital
• Reduce earnings volatility of cyclical businesses
• Improve stability / predictability across the portfolio

47
Summary
• Grow in Healthcare
• Focus on Innovation
• Higher margin products & markets
• Improving predictability in results
• Strong operational cashflow


