
Axiata Group Berhad
2Q 2018 Results
24 August 2018
Tan Sri Jamaludin Ibrahim, President & Group CEO
Vivek Sood, Group CFO

2Q 2018 2
IntroductionOne of the most eventful quarters
Idea at final stages of regulatory approval for the Vodafone-Idea merger, to become the largest
telco in India, and one of the largest in the world.
All opcos outperformed their respective markets, with three performing best in the industry.
Validation of one of three ADS core verticals, with Sumitomo Corp. investment of USD20m in
ADA (analytics.data.advertising), implying valuation of USD109m.
Dividend commitment for FY18: back to FY15 level of 85% DPR.
Significant disparity between reported financials and underlying performance.
2Q 2018 3
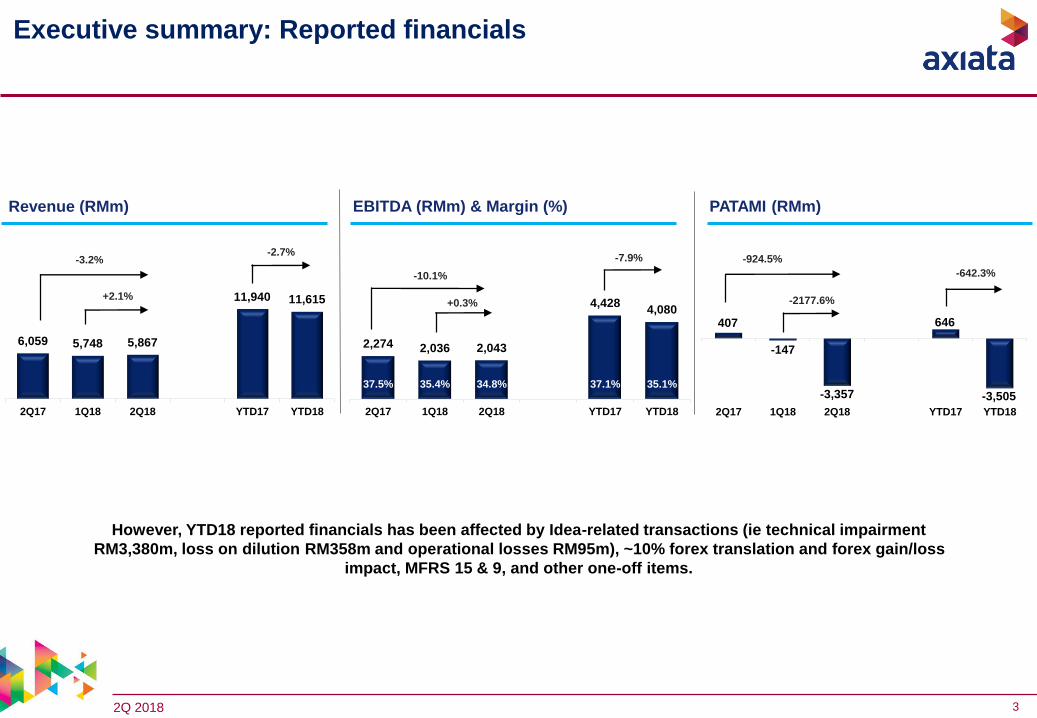
Executive summary: Reported financials
Revenue (RMm) EBITDA (RMm) & Margin (%) PATAMI (RMm)
6,059 5,748 5,867
11,940 11,615
2Q17 1Q18 2Q18 YTD17 YTD18
-3.2%
+2.1%
-2.7%
2,274 2,036 2,043
4,4284,080
37.5% 35.4% 34.8% 0 37.1% 35.1%
2Q17 1Q18 2Q18 YTD17 YTD18
-10.1%
+0.3%
-7.9%
407
-147
-3,357
646
-3,505
2Q17 1Q18 2Q18 YTD17 YTD18
-924.5%
-2177.6%
-642.3%
However, YTD18 reported financials has been affected by Idea-related transactions (ie technical impairment
RM3,380m, loss on dilution RM358m and operational losses RM95m), ~10% forex translation and forex gain/loss
impact, MFRS 15 & 9, and other one-off items.

2Q 2018 4
5,601 5,815
11,940 12,551
1Q18 2Q18 YTD17 YTD18
+3.8%
+5.1%
2,044 2,159
4,428 4,629
1Q18 2Q18 YTD17 YTD18
+5.6%
+4.6%
36.5% 37.1% 37.1% 36.9% 306 237
779591
1Q18 2Q18 YTD17 YTD18
-24.1%
-22.5%
Executive summary: Underlying performance*Good QoQ and YTD revenue and EBITDA growth; normalized PATAMI impacted by digital investments,
higher D&A and tax credit in previous year.
Revenue (RMm) EBITDA (RMm) & Margin (%) Normalised PATAMI (RMm)
Note: * Pre-MFRS at constant currency, ex-Idea (discontinuing operation)
Improved YTD18 underlying performance from all opcos, with revenue market share gains for all opcos; with Celcom, XL and Dialog
performed best in industry on QoQ and YTD.
Digital investments lifted YTD18 revenue growth by 0.3% pts, but diluted EBITDA growth by 1.7% pts.
YTD18 normalised PATAMI –24.1% is boosted by improved EBITDA (+RM285m), offset by digital investments (-RM135m), higher D&A (-
RM292m) and tax credit in previous years (-RM54m).
Cost optimisation programme on track to deliver target of RM1.4bn for 2018 with 1H18 achievement of RM800m.
Balance sheet remains healthy with gross debt/EBITDA of 2.29x in 2Q18 (forex adjusted is 2.07x). In line with internal guidelines, ~50% of
debt in USD debt, off which ~50% is hedged; and 67% of debt is on fixed rate.
Provision on de-recognition of Idea from associate to simple investment of RM3.4bn in 2Q18 arising from Vodafone-Idea merger; from 16th
August 2018, cease equity accounting of Idea.
Axiata Digital secures USD20m funding for its digital advertising business, from new strategic partner Sumitomo Corp.
Mitsui exercises call option of 10% on Smart at USD92.4m, taking their stake to 20%.
Long stop date for completion of Deodar has been extended to 14th September 2018.
Declared 5sen interim dividend, translating into 86% DPR.

2Q 2018 5
646 779 591
(3,505)
134 135 285
8 106 49
358 80 112 47 11
89 47 292 54 135
47
PA
TAM
I YTD
17
FOR
EX g
ain
XL
tow
er
gain
s
Oth
ers
Ide
a (o
pe
rati
on
al lo
sse
s)
No
rm P
ATA
MI Y
TD1
7(u
nd
erl
yin
g p
erf
orm
ance
)
EBIT
DA
D&
A
Tax
Oth
ers
Dig
ital
inve
stm
en
ts
No
rm P
ATA
MI Y
TD1
8(u
nd
erl
yin
g p
erf
orm
ance
)
Ide
a (o
pe
rati
on
al lo
sse
s)
FOR
EX lo
ss
XL
tow
er
gain
s
Ide
a: p
rovi
sio
n o
fd
ere
cogn
itio
n
Ide
a: lo
ss o
n d
iluti
on
No
n-c
ore
dig
ital
: Lo
ss o
nd
iluti
on
/im
pai
rme
nt
Oth
ers
Fore
x tr
ansl
atio
n
MFR
S
PA
TAM
I YTD
18
Underlying performance normalised PATAMI : YTD Jun’17 YTD Jun’18Normalised PATAMI impacted by digital investments, higher D&A and tax credit in previous year.
Underlying YTD growth: -24.1%
RM Million 3,380
Norm PATAMI
(underlying
performance)
YTD17
Norm PATAMI
(underlying
performance)
YTD18
Celcom 407 -63 -15.4% Celcom 344
XL (27) -32 -116.8% XL (59)
Dialog 111 +45 40.2% Dialog 156
Robi (29) -39 -135.2% Robi (68)
Smart 158 -46 -29.2% Smart 112
Ncell 314 -3 -1.1% Ncell 311
Others (155) -50 -31.3% Others (205)
GROUP 779 -188 -24.1% GROUP 591
YTD Growth Rates

2Q 2018 6
Key Group highlights (1/6)CELCOM: Good execution on its strategy to focus on high-value customers, as Celcom delivers
ARPU increase and subscriber growth.
• On QoQ basis, service revenue and total revenue growth of 3.0% and 2.8% respectively, whichare ahead of industry largely driven by solid prepaid growth momentum.
• QoQ EBITDA growth of 6.8% largely due to lower direct expenses.
• YTD18 revenue, EBITDA and PATAMI growth was 3.6%, -1.7% and -37.8%, respectively. EBITDAimpacted by change in revenue mix and higher staff cost; PATAMI decline was impacted byhigher D&A charges in 1H18, and gain on disposal of 11st in 2Q17.
• Second consecutive quarter of positive net addition, pushed by improved sales distribution andsimplified product offerings.
• Celcom continues to focus on high value customers (HVC) as 2Q18 ARPUs improved YoY forboth postpaid (+RM5 to RM87) and prepaid (+RM4 to RM35).
• In 2Q18, 4G and 4G LTE-A population coverage are at 89% and 76%, respectively.
• Ongoing cost takeout and rationalisation of spends.
Note: Growth number based on results in local currency in respective operating markets
Pre-MFRS basis

2Q 2018 7
Key Group highlights (2/6)XL: Positive revenue growth and gained further traction in data in 1H18, amidst challenging market
dynamics and prepaid SIM registration.
• XL continues to benefit from its Transformation Strategy, as it delivers revenue growth aheadof industry driven by a strong data-led product proposition through its dual brand strategy,supported by continuous network investment.
• YTD18 revenue and EBITDA growth was 1.1% and 1.7%, respectively, both outperforming theindustry; normalised PAT slipped into losses due to higher D&A charges from its 4G networkexpansion.
• YTD18 data revenue grew 20% YoY, accounting for 73% of XL’s service revenue, the highestin the market. Smartphone penetration rose 10% pts YoY to 77% as XL continues to attractdata-savvy customers.
• In the recent SIM registration process, XL achieved the highest percentage of registered SIMof ~97%.
• 4G network now covers 380 cities, with ~25k 4G BTS stations (+4,496 in 2Q18); >50% ofcapex is allocated to ex-Java strategy.
Note: Growth number based on results in local currency in respective operating markets
Pre-MFRS basis

2Q 2018 8
• YTD18 revenue and EBITDA growth was 2.0% and 39.0%, respectively; YTD18 losses widened toBDT2.2bn (vs proforma BDT0.8bn in YTD17), due to higher finance cost in YTD18, andrecognition of tax credit and gain on disposal of edotco in YTD17.
• YTD18 service revenue grew by 9.4% driven by 4G; YTD18 service revenue market sharerecorded at 27.9% (+1.9% pts).
• YTD18 data revenue grew by 35.6%, accounting for 24% of total revenue (vs. 18% in YTD17).
• 4G rollout ahead of competition, achieving >6,000 4G sites to-date.
Key Group highlights (3/6)DIALOG: Market leader continues to gain revenue market share and reports double digit YTD growth.
ROBI: 4G drives service revenue growth; bottomline impacted by higher finance cost.
• Strong YTD18 performance with revenue, EBITDA and PAT growth at 16.1%, 25.8% and 41.2%,respectively, driven by growth across all key business segments.
• YTD18 revenue growth for mobile, fixed and pay-TV operations at 15.8%, 24.5% and 5.6%,respectively.
• Mobile and home broadband segments continue to capture market share.
• Data revenue accounted for 34% of YTD18 mobile revenue (vs. 30% in YTD17); 2Q18 smartphonepenetration rose by 6% pts YoY to 55%.
Note: Growth number based on results in local currency in respective operating markets
Pre-MFRS basis

2Q 2018 9
Key Group highlights (4/6)NCELL: Good performance with strong growth in data and EBITDA margin maintained at 63.0%.
SMART: Improved QoQ results as price war stabilises.
Nepal
• Ncell’s consolidated (ie mobile + ILD) YTD18 revenue, EBITDA and PAT growth was 4.9%, 0.5%and -14.8%, respectively; PAT decline largely due to one-off prior year tax assessment andprovision of asset impairment in 1H18.
• YTD18 mobile revenue and EBITDA grew 12.3% and 10.2% respectively.
• YTD18 data revenue grew by 34.2%, accounting for 22% of total revenue; smartphone penetrationrate rose to 58% (+11% pts YoY) and 47.3% of Ncell subscribers are data subscribers.
• As expected ILD usage continues its downtrend, translating into ILD revenue decline of 13.8%YTD. Nonetheless Ncell maintains overall EBITDA margins of 63.0% in 1H18.
Note: Growth number based on results in local currency in respective operating markets
• On QoQ basis, Smart’s revenue grew 11.5% as price war stabilises.
• Smart’s YTD18 revenue, EBITDA and PAT growth was 0.1%, -4.4% and -16.0%, respectively;EBITDA and PAT impacted by increased regulatory charges.
• YTD18 data revenue grew by 20.2%, as data accounted for 57.5% of Smart’s total revenue.
• Mitsui exercises call option of 10% on Smart at USD92.4m, taking their stake to 20%.
Pre-MFRS basis

2Q 2018 10
Key Group highlights (5/6): Business unitsedotco: Continued strong operational performance across the group.
ADS & ABS: Continue to build momentum for Boost; ADA secures USD20m funding.
• For YTD18, edotco accounts for 7.4% and 7.7% of group revenue and EBITDA, respectively.
• edotco’s YTD18 revenue, EBITDA and PAT growth was 12.2%, -8.2% and -8.6%, respectively,largely due to forex translation impact.
• On constant currency, edotco’s YTD18 revenue, EBITDA and PAT growth was 20.1%, 1.5%and -13.0%, respectively; EBITDA was impacted by non-operational, one-off items for thequarter. As at 2Q18, edotco owns 17.3k towers (+11.1% YoY), and manages 11.2k sites(+4.1% YoY).
• 2Q18 tenancy ratio rose to 1.59x (vs 1.47x in 2Q17).
• Long stop date for completion of Deodar has been extended to 14th September 2018.
• Boost grows user and merchant base to 2.9m and ~35k respectively
• ADA (analytics.data.advertising) secures USD20m funding for digital advertising businessfrom new strategic partner Sumitomo Corp.
• Non-core digital business: Rationalisation of non-core portfolio of RM80m, comprising loss indilution in 11st and impairment in Unlockd.
Note: Growth number based on results in local currency in respective operating markets
Pre-MFRS basis
2Q 2018 11
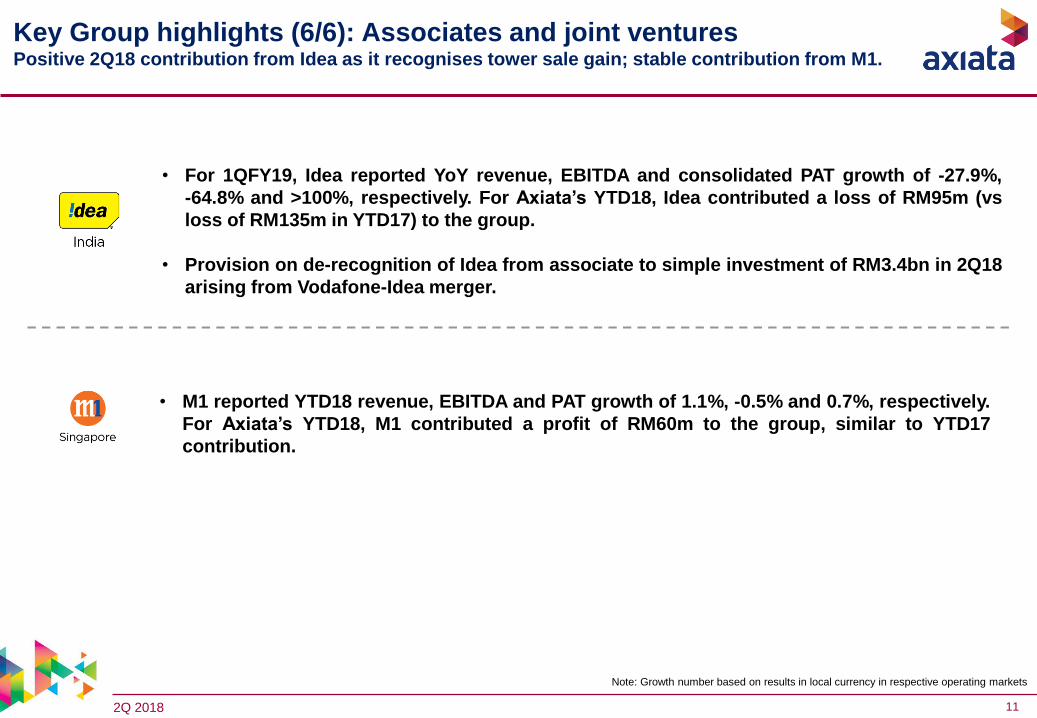
Key Group highlights (6/6): Associates and joint venturesPositive 2Q18 contribution from Idea as it recognises tower sale gain; stable contribution from M1.
• For 1QFY19, Idea reported YoY revenue, EBITDA and consolidated PAT growth of -27.9%,
-64.8% and >100%, respectively. For Axiata’s YTD18, Idea contributed a loss of RM95m (vs
loss of RM135m in YTD17) to the group.
• Provision on de-recognition of Idea from associate to simple investment of RM3.4bn in 2Q18
arising from Vodafone-Idea merger.
• M1 reported YTD18 revenue, EBITDA and PAT growth of 1.1%, -0.5% and 0.7%, respectively.
For Axiata’s YTD18, M1 contributed a profit of RM60m to the group, similar to YTD17
contribution.
Note: Growth number based on results in local currency in respective operating markets
2Q 2018 12
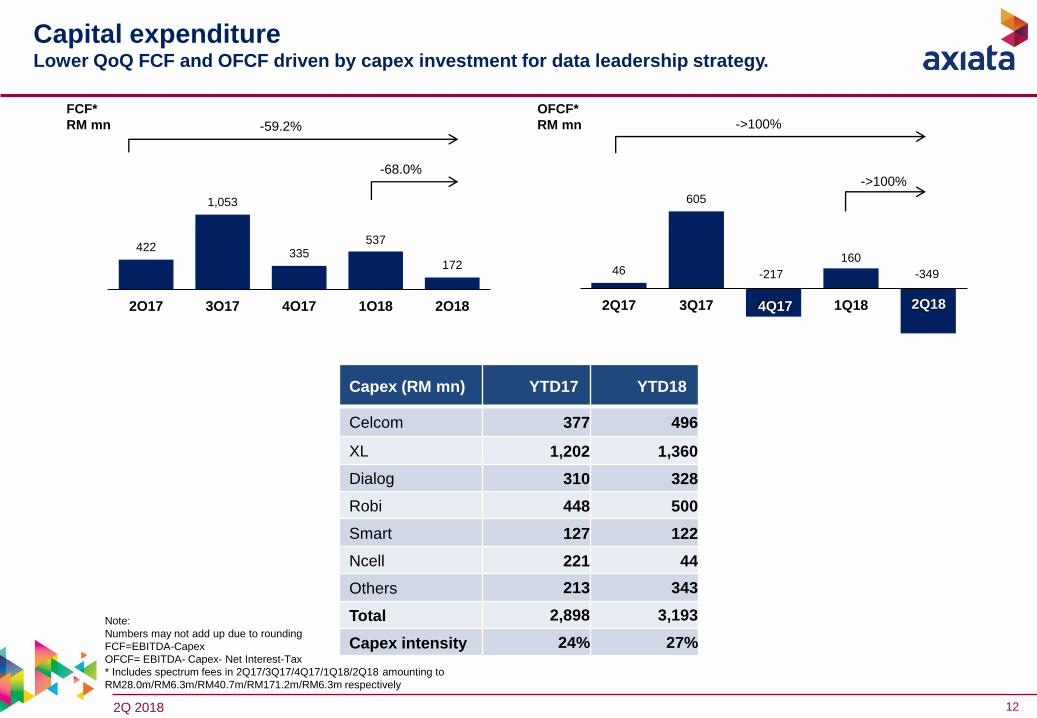
Capital expenditureLower QoQ FCF and OFCF driven by capex investment for data leadership strategy.
Capex (RM mn) YTD17 YTD18
Celcom 377 496
XL 1,202 1,360
Dialog 310 328
Robi 448 500
Smart 127 122
Ncell 221 44
Others 213 343
Total 2,898 3,193
Capex intensity 24% 27%
Note:
Numbers may not add up due to rounding
FCF=EBITDA-Capex
OFCF= EBITDA- Capex- Net Interest-Tax
* Includes spectrum fees in 2Q17/3Q17/4Q17/1Q18/2Q18 amounting to
RM28.0m/RM6.3m/RM40.7m/RM171.2m/RM6.3m respectively
422
1,053
335537
172
2Q17 3Q17 4Q17 1Q18 2Q18
46
605
-217
160
-349
2Q17 3Q17 4Q17 1Q18 2Q18
FCF*
RM mn
OFCF*
RM mn-59.2% ->100%
-68.0%->100%
4Q17 2Q18

2Q 2018 13
7,374 6,873 6,813
5,715 6,234
3,196
2,499 2,046 2,144 2,343
30-Jun-17 30-Sep-17 31-Dec-17 31-Mar-18 30-Jun-18
Total cash Holdco & non opco cash
Group statements of financial position Healthy balance sheet with gross debt/EBITDA at 2.29x. In line with internal guidelines, ~50% of debt
in USD, off which ~50% is hedged; and 67% of debt is on fixed rate.
Group borrowings – by currency Group borrowings - hedged / unhedged loans
Cash (RM million)Gross and net debt/EBITDA (x)
2.272.10 2.08
2.23 2.29
1.44 1.35 1.34 1.53 1.52
30-Jun-17 30-Sep-17 31-Dec-17 31-Mar-18 30-Jun-18
Gross debt to EBITDA Net debt to EBITDA
In million Loan Currency USD Local Total (RM)
Hold co & Non OpCoUSD 1,557 6,289
Sub-total 1,557 6,289
OpCos USD 657 2,741
RM 5,049 5,049
IDR 8,981,974 2,533
BDT 33,885 1,631
SLR 15,849 404
PKR 744 25
Sub-Total 657 12,383
Total Group 2,214 18,672
Local currencies loans52%
Hedged USD loans26%
Unhedged USD loans22%
2Q 2018 14
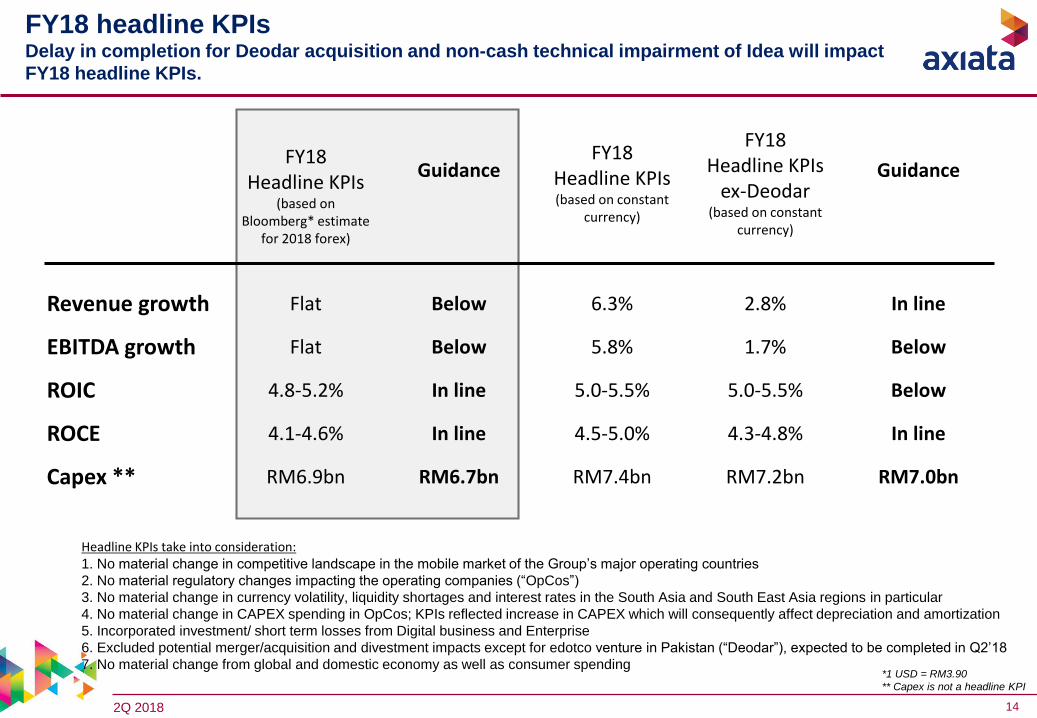
FY18 headline KPIsDelay in completion for Deodar acquisition and non-cash technical impairment of Idea will impact
FY18 headline KPIs.
*1 USD = RM3.90
** Capex is not a headline KPI
FY18Headline KPIs
(based on Bloomberg* estimate
for 2018 forex)
GuidanceFY18
Headline KPIs(based on constant
currency)
FY18Headline KPIs
ex-Deodar(based on constant
currency)
Guidance
Revenue growth Flat Below 6.3% 2.8% In line
EBITDA growth Flat Below 5.8% 1.7% Below
ROIC 4.8-5.2% In line 5.0-5.5% 5.0-5.5% Below
ROCE 4.1-4.6% In line 4.5-5.0% 4.3-4.8% In line
Capex ** RM6.9bn RM6.7bn RM7.4bn RM7.2bn RM7.0bn
Headline KPIs take into consideration:1. No material change in competitive landscape in the mobile market of the Group’s major operating countries
2. No material regulatory changes impacting the operating companies (“OpCos”)
3. No material change in currency volatility, liquidity shortages and interest rates in the South Asia and South East Asia regions in particular
4. No material change in CAPEX spending in OpCos; KPIs reflected increase in CAPEX which will consequently affect depreciation and amortization
5. Incorporated investment/ short term losses from Digital business and Enterprise
6. Excluded potential merger/acquisition and divestment impacts except for edotco venture in Pakistan (“Deodar”), expected to be completed in Q2’18
7. No material change from global and domestic economy as well as consumer spending
2Q 2018 15
Opportunities and risks
Key opportunities:
Improved competitive landscape in Indonesia and Cambodia.
Growth momentum in Sri Lanka and Nepal.
Key risks:
Currency and interest rate volatility especially in Sri Lanka, Bangladesh and Indonesia.
Regulatory uncertainty in Malaysia ie SST.
Weak enforcement of prepaid SIM registration in Indonesia.
Rationalisation of non-core digital portfolio.

2Q 2018 16
Appendix

2Q 2018 17
Group revenue: YTD17 → YTD18 YTD18 revenue decline of 2.7% mainly due to forex translation impact, offsetting good underlying
performance from all OpCos except Smart.
RM Million
YTD Reported Growth: -2.7%
5.1%YTD Constant Growth Pre MFRS:
Revenue YTD17
Revenue
(underlying
performance)
YTD18
Celcom 3,226 +92 2.9% Celcom 3,318
XL 3,597 +37 1.0% XL 3,634
Dialog 1,307 +210 16.0% Dialog 1,517
Robi 1,776 +29 1.7% Robi 1,805
Smart 615 -16 -2.7% Smart 599
Ncell 1,175 +54 4.6% Ncell 1,229
Others 244 +205 84.0% Others 449
GROUP 11,940 +611 5.1% GROUP 12,551
YTD Growth Rates
11,940 12,551 11,615 92 37 210 29 54 205 266 16 1,202
YT
D1
7
Ce
lco
m XL
Dia
log
Ro
bi
Smar
t
Nce
ll
Oth
ers
YT
D1
8 (
un
der
lyin
gp
erf
orm
ance
)
Fore
x tr
ansl
atio
n
MFR
S
YT
D1
8

2Q 2018 18
Group EBITDA: YTD17 → YTD18YTD18 EBITDA declined by 7.9% due to forex translation, MFRS, digital investments, and lower
contribution from Smart, Celcom and Ncell.
YTD Reported Growth: -7.9%
YTD Constant Growth Pre MFRS: 4.6%
EBITDA YTD17 EBITDA
(underlying performance) YTD18
Celcom 1,102 -29 -2.7% Celcom 1,073
XL 1,339 +58 4.3% XL 1,397
Dialog 444 +129 29.1% Dialog 573
Robi 297 +87 29.6% Robi 384
Smart 311 -36 -11.3% Smart 275
Ncell 785 -15 -1.9% Ncell 770
Others 150 +7 4.7% Others 157
GROUP 4,428 +202 4.6% GROUP 4,629
YTD Growth Rates
4,428 4,629 4,080 58 129 87 7 29 36 15 458 91
YT
D1
7
Ce
lco
m XL
Dia
log
Ro
bi
Smar
t
Nce
ll
Oth
ers
YT
D1
8 (
un
der
lyin
gp
erf
orm
ance
)
Fore
x
MFR
S
YT
D1
8
Fore
x tr
ansl
atio
n
RM Million
2Q 2018 19
646
(3,447) (3,505)
39 36 204 49 33 46
389
358 98 47 11
YT
D1
7
Ce
lco
m XL
Dia
log
Ro
bi
Smar
t
Nce
ll
Ide
a: p
rovi
sio
n o
fd
ere
cogn
itio
n
Ide
a: lo
ss o
n d
iluti
on
Oth
ers
YT
D1
8 (
Pre
-MFR
S, C
C)
Fore
x
MFR
S
YT
D1
8
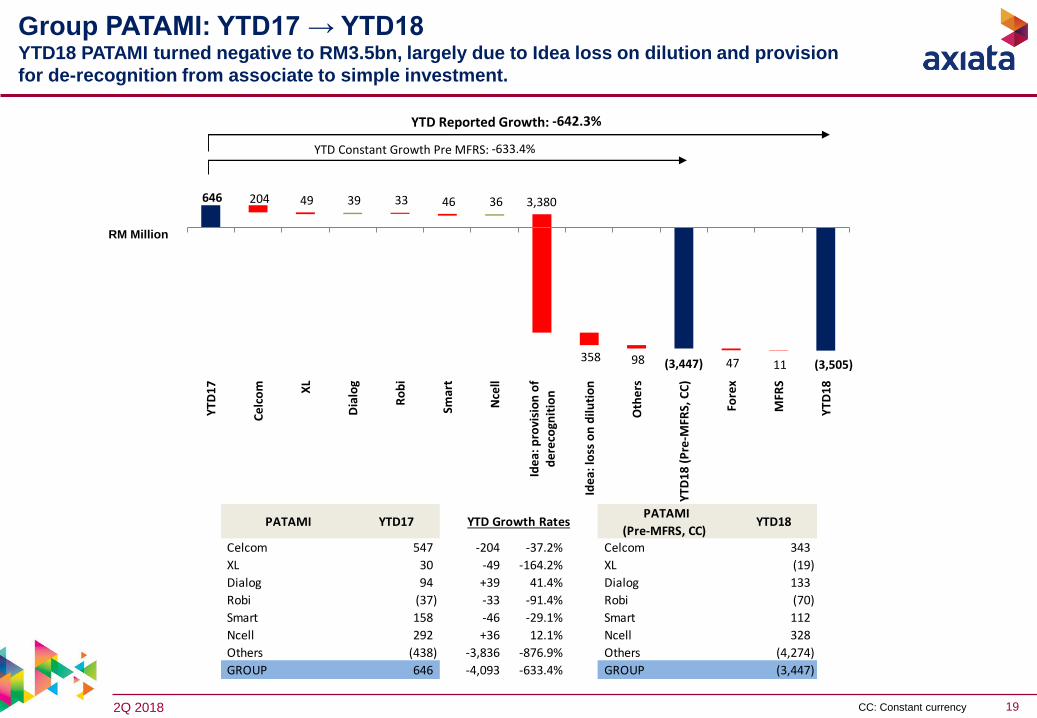
Group PATAMI: YTD17 → YTD18YTD18 PATAMI turned negative to RM3.5bn, largely due to Idea loss on dilution and provision
for de-recognition from associate to simple investment.
YTD Constant Growth Pre MFRS: -633.4%
YTD Reported Growth: -642.3%
RM Million
3,380
PATAMI YTD17 PATAMI
(Pre-MFRS, CC) YTD18
Celcom 547 -204 -37.2% Celcom 343
XL 30 -49 -164.2% XL (19)
Dialog 94 +39 41.4% Dialog 133
Robi (37) -33 -91.4% Robi (70)
Smart 158 -46 -29.1% Smart 112
Ncell 292 +36 12.1% Ncell 328
Others (438) -3,836 -876.9% Others (4,274)
GROUP 646 -4,093 -633.4% GROUP (3,447)
YTD Growth Rates
CC: Constant currency

2Q 2018 20
5,748 5,601 5,815 5,867 46 13 12 11 29 24 80 117 148 65
1Q
18
MFR
S
1Q
18
(P
re M
FRS)
Ce
lco
m XL
Dia
log
Ro
bi
Smar
t
Nce
ll
Oth
ers
2Q
18
(U
nd
erl
yin
gp
erf
orm
ance
)
Fore
x tr
ansl
atio
n
MFR
S
2Q
18
Group revenue: 1Q18 → 2Q18 QoQ revenue growth of 2.1% lifted by improved performance from all opcos and MFRS impact.
RM Million
QoQ Reported Growth: 2.1%
3.8%QoQ Constant Growth Pre MFRS:
Revenue (Pre-MFRS) 1Q18 Revenue (underlying
performance) 2Q18
Celcom 1,636 +46 2.8% Celcom 1,682
XL 1,590 +13 0.8% XL 1,603
Dialog 659 +12 1.9% Dialog 671
Robi 770 +11 1.4% Robi 780
Smart 253 +29 11.5% Smart 282
Ncell 550 +24 4.3% Ncell 574
Others 143 +80 56.3% Others 223
GROUP 5,601 +215 3.8% GROUP 5,815
QoQ Growth Rates

2Q 2018 21
Group EBITDA: 1Q18 → 2Q18QoQ EBITDA growth of 0.3% due to improved performance from all opcos, offset by forex
translation and MFRS.
QoQ Reported Growth: 0.3%
QoQ Constant Growth Pre MFRS: 5.6%
RM Million
EBITDA (Pre-MFRS) 1Q18 EBITDA (underlying
performance) 2Q18
Celcom 518 +36 6.8% Celcom 554
XL 603 +21 3.5% XL 624
Dialog 242 +19 7.7% Dialog 261
Robi 139 +52 37.6% Robi 191
Smart 118 +10 7.8% Smart 128
Ncell 343 +18 5.5% Ncell 361
Others 81 -41 -50.6% Others 40
GROUP 2,044 +115 5.6% GROUP 2,159
QoQ Growth Rates
2,036 2,044 2,159 2,043 8 36 21 19 52 10 18 41 29 87
1Q
18
MFR
S
1Q
18
(P
re M
FRS)
Ce
lco
m XL
Dia
log
Ro
bi
Smar
t
Nce
ll
Oth
ers
2Q
18
(u
nd
erl
yin
gp
erf
orm
ance
)
Fore
x tr
ansl
atio
n
MFR
S
2Q
18

2Q 2018 22
Group PATAMI: 1Q18 → 2Q182Q18 PATAMI of -RM3.4bn, largely due to Idea provision for de-recognition from associate to
simple investment.
QoQ Reported Growth: -2177.6%
QoQ Constant Growth Pre MFRS: -2106.3%
RM Million
PATAMI (Pre-MFRS) 1Q18 PATAMI (Pre-MFRS,
CC) 2Q18
Celcom 187 -31 -16.7% Celcom 156
XL 2 -21 -922.6% XL (19)
Dialog 60 -3 -5.1% Dialog 57
Robi (52) +44 84.8% Robi (8)
Smart 48 +3 6.1% Smart 51
Ncell 144 +12 8.8% Ncell 156
Others (540) -3,188 -590.3% Others (3,728)
GROUP (151) -3,185 -2106.3% GROUP (3,336)
QoQ Growth Rates
(147) (151)
(3,336) (3,357)
44 3 12 4 31 21 3
3,189 5 16
1Q
18
MFR
S
1Q
18
(P
re M
FRS)
Ce
lco
m XL
Dia
log
Ro
bi
Smar
t
Nce
ll
Oth
ers
2Q
18
(p
re M
FRS,
CC
)
Fore
x tr
ansl
atio
n
MFR
S
2Q
18
CC: Constant currency


![Mobile Internet Fulfillment Exchange [MIFE] Keynote by Amos Manasseh, Axiata Group](https://cdn.vdocument.in/doc/165x107/5589d9fad8b42a3f1d8b4643/mobile-internet-fulfillment-exchange-mife-keynote-by-amos-manasseh-axiata-group.jpg)