
BMEG/ELEG 479/679 Homework 1 Solutions
1. The following input/output relations describe systems with input v(x) and output w(x) . Which systems are linear? Which are space-invariant? [6 pts.] (a) w(x) = a ⋅ v(x) + b i. test linearity by testing linear superposition let there be two input signals v1(x) and v2(x) (1) output as the sum of the outputs from each signal individually
( ) bxvxvabxvabxvaxwxwxwbxvaxwbxvaxw
2)()()()()()()(
)()()()(
212121'
22
11
++⋅=+⋅++⋅=+=
+⋅=+⋅=
(2) output as the sum of the two inputs
( ) bxvxvaxw ++⋅= )()()( 21"
Since )(")(' xwxw ≠ the system is NOT linear
ii. test shift invariance by shifting both the output and input and see if the result is the same (1) shift the output
bxxvaxxw oo +−⋅=− )()(1
(2) shift the input bxxvaxxw oo +−⋅=− )()(2
Since the output stays the same in both cases the system IS shift invariant
(b) w(x) = a ⋅ v(x + b) i. test linearity by testing linear superposition let there be two input signals v1(x) and v2(x) (1) output as the sum of the outputs from each signal individually
( ))()()()()()()(
)()()()(
212121'
22
11
bxvbxvabbxvabxvaxwxwxwbxvaxwbxvaxw
+++⋅=++⋅++⋅=+=
+⋅=+⋅=
(2) output as the sum of the two inputs
( ))()()( 21" bxvbxvaxw +++⋅=
since )(")(' xwxw = the system IS linear
1

BMEG/ELEG 479/679 Homework 1 Solutions
ii. test shift invariance by shifting both the output and input and see if the result is the same (a) shift the output
)()(1 oo xbxvaxxw −+⋅=−
(b) shift the input )()(2 oo xbxvaxxw −+⋅=−
Since the output stays the same in both cases the system IS shift invariant
(c) w(x) = sin(2π ax)v(x) i. test linearity by testing linear superposition let there be two input signals v1(x) and v2(x) (1) output as the sum of the outputs from each signal individually
( ))()()2sin()()2sin()()2sin()()()(
)()2sin()()()2sin()(
212121'
22
11
xvxvaxxvaxxvaxxwxwxwxvaxxwxvaxxw
+⋅=⋅+⋅=+=
⋅=⋅=
πππ
ππ
(2) output as the sum of the two inputs
( ))()()2sin()( 21" xvxvaxxw +⋅= π
since )(")(' xwxw = the system IS linear
ii. test shift invariance by shifting both the output and input and see if the result is the same (a) shift the output
)())(2sin()(1 ooo xxvxxaxxw −⋅−=− π
(b) shift the input )()2sin()(2 oo xxvaxxxw −⋅=− π
Since the outputs are different in the two cases the system is NOT shift invariant
2

BMEG/ELEG 479/679 Homework 1 Solutions
2.10 Given a continuous signal f(x,y)=x+y2 evaluate the following; [6 pts.] (a) )2,1(),( −− yxyxf δ
==
=−−otherwise
yxfyxyxf
02,1)0,0()2,1(
)2,1(),(δ
δ
(b) )2,1(),( −−∗ yxyxf δ
[ ] ( )22 21)2,1()2,1(),( −+−=−−−−⋅+=−−∗ ∫ ∫∞
∞−
∞
∞−
yxddyxyxyxf ηξηξδηξδ
(c) ∫ ∫∞
∞−
∞
∞−
−− dxdyxfyx )3,()2,1(δ
10)9)(2,1()3,()2,1( =+−−=−− ∫ ∫∫ ∫∞
∞−
∞
∞−
∞
∞−
∞
∞−
dxdyxyxdxdyxfyx δδ
(d) )2,1()2,1( −−∗++ yxyxf δ
( )[ ] 22 )1,1()2(1)2,1()2,1( yxddyxyxyxf +=−−−−⋅+++=−−∗++ ∫ ∫∞
∞−
∞
∞−
ηξηξδηξδ
3

BMEG/ELEG 479/679 Homework 1 Solutions
2.13 Find the Fourier transforms of the following continuous signals [10 pts.]
(a) ∑ ∑∞
−∞=
∞
−∞=
−−=m n
s nymxyx ),(),( δδ
[ ] [ ] [ ]∑ ∑∑ ∑∑ ∑∞
−∞=
∞
−∞=
⋅+⋅−∞
−∞=
∞
−∞=
∞
−∞=
∞
−∞=
ℑ=−−ℑ=
−−ℑ=
m n
nvmuj
m nm neyxnymxnymxvuF )(2),(),(),(, πδδδ
[ ] [ ] ∑ ∑∑ ∑∑ ∑∞
−∞=
∞
−∞=
∞
−∞=
∞
−∞=
⋅+⋅−∞
−∞=
∞
−∞=
⋅+⋅− −−==ℑ=m nm n
nvmuj
m n
nvmuj nvmueeyxvuF ),(),(, )(2)(2 δδ ππ
(b) ∑ ∑∞
−∞=
∞
−∞=
∆−∆−=m n
s ynyxmxyx ),(),( δδ
[ ] [ ] [ ]∑ ∑∑ ∑∑ ∑∞
−∞=
∞
−∞=
∆⋅+∆⋅−∞
−∞=
∞
−∞=
∞
−∞=
∞
−∞=
ℑ=∆−∆−ℑ=
∆−∆−ℑ=
m n
ynvxmuj
m nm neyxynyxmxynyxmxvuF )(2),(),(),(, πδδδ
[ ] [ ] ∑ ∑∑ ∑∑ ∑∞
−∞=
∞
−∞=
∞
−∞=
∞
−∞=
∆⋅+∆⋅−∞
−∞=
∞
−∞=
∆⋅+∆⋅− ∆−∆−∆∆
==ℑ=m nm n
ynvxmuj
m n
ynvxmuj ynvxmuyx
eeyxvuF )/,/(1),(, )(2)(2 δδ ππ
(c) ( ))2sin(),( yvxuyxs oo += π
[ ] ( )∫ ∫∞
−∞=
∞
−∞=
+−+=ℑ=y x
vyuxjoo dxdyeyvxuyxsvuF )(2)2sin(),(),( ππ
( )( ) ( )[ ]
∫ ∫∫ ∫∞
−∞=
∞
−∞=
+−+−+∞
−∞=
∞
−∞=
+− −=+=
y x
vyuxjyvxujyvxuj
y x
vyuxjoo dxdye
jeedxdyeyvxuvuF
oooo)(2
22)(2
2)2sin(),( π
ππππ
( ) ( )[ ] ( ) ( )[ ]∫ ∫∫ ∫∞
−∞=
∞
−∞=
+++−−+−−∞
−∞=
∞
−∞=
+−+−+
−=−
=y x
yvvxuujyvvxuuj
y x
vyuxjyvxujyvxuj
dxdyeej
dxdyejeevuF oooo
oooo))()(2))()(2)(2
22
21
2),( πππ
ππ
[ ]),(),(21),( oooo vvuuvvuuj
vuF ++−−−= δδ
Commented [K1]: Corrected Answer
4
BMEG/ELEG 479/679 Homework 1 Solutions
(d) ( ))2cos(),( yvxuyxc oo += π
[ ] ( )∫ ∫∞
−∞=
∞
−∞=
+−+=ℑ=y x
vyuxjoo dxdyeyvxuyxcvuF )(2)2cos(),(),( ππ
( )( ) ( )[ ]
∫ ∫∫ ∫∞
−∞=
∞
−∞=
+−+−+∞
−∞=
∞
−∞=
+− +=+=
y x
vyuxjyvxujyvxuj
y x
vyuxjoo dxdyeeedxdyeyvxuvuF
oooo)(2
22)(2
2)2cos(),( π
ππππ
( ) ( )[ ] ( ) ( )[ ]∫ ∫∫ ∫∞
−∞=
∞
−∞=
+++−−+−−∞
−∞=
∞
−∞=
+−+−+
+=+
=y x
yvvxuujyvvxuuj
y x
vyuxjyvxujyvxuj
dxdyeedxdyeeevuF oooooooo
))()(2))()(2)(222
21
2),( πππ
ππ
[ ]),(),(21),( oooo vvuuvvuuvuF +++−−= δδ
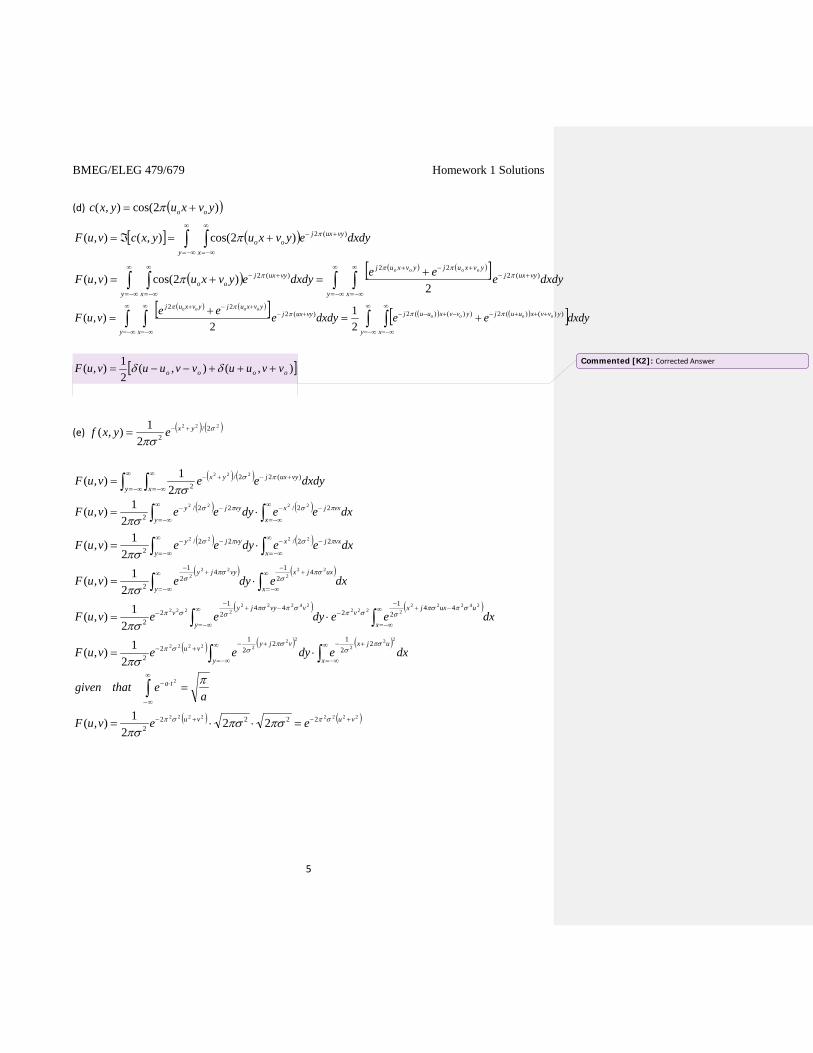
(e) ( ) ( )222 2/22
1),( σ
πσyxeyxf +−=
( ) ( )∫ ∫∞
−∞=
∞
−∞=
+−+−=y x
vyuxjyx dxdyeevuF )(22/2
222
21),( πσ
πσ( ) ( )∫ ∫
∞
−∞=
∞
−∞=
−−−− ⋅=y x
vxjxvyjy dxeedyeevuF πσπσ
πσ22/22/
2
2222
21),(
( ) ( )
( ) ( )
( ) ( )
( ) ( ) ( )
( ) ( )22222222
2
222
2222222
242222222
242222222
222
222
2222
22222
22
122
12
2
442
12
442
12
2
42
142
1
2
22/22/2
222
1),(
21),(
21),(
21),(
21),(
vuvu
ta
y x
ujxvjyvu
y x
uuxjxv
vvyjyv
y x
uxjxvyjy
y x
vxjxvyjy
eevuF
aethatgiven
dxedyeevuF
dxeedyeevuF
dxedyevuF
dxeedyeevuF
+−+−
∞
∞−
⋅−
∞
−∞=
∞
−∞=
+−+−+−
∞
−∞=
∞
−∞=
−+−
−−+
−−
∞
−∞=
∞
−∞=
+−
+−
∞
−∞=
∞
−∞=
−−−−
=⋅⋅=
=
⋅=
⋅=
⋅=
⋅=
∫
∫ ∫
∫ ∫
∫ ∫
∫ ∫
σπσπ
πσσ
πσσσπ
σππσσσπ
σππσσσπ
πσσ
πσσ
πσπσ
πσπσπσ
ππσ
πσ
πσ
πσ
Commented [K2]: Corrected Answer
5

BMEG/ELEG 479/679 Homework 1 Solutions
2.21 A new imaging system with which you are experimenting has anisotropic properties. You
measure the impulse response function as ( ) 4/22
),( yxeyxh +−= π [6 pts] (a) Sketch the impulse response
(b) What is the transfer function ( )
( ) ( )2222
22
vu4π)(24/
)(24/)(2
4e),(
),(),(
+−∞
−∞=
∞
−∞=
+−+−
∞
−∞=
∞
−∞=
+−+−∞
−∞=
∞
−∞=
+−
==
==
∫ ∫
∫ ∫∫ ∫
y x
vyuxjyx
y x
vyuxjyx
y x
vyuxj
dxdyeevuH
dxdyeedxdyeyxhvuH
ππ
πππ
Commented [K3]: Corrected answer
6

BMEG/ELEG 479/679 Homework 1 Solutions
2.25. We want to sample the 2-D continuous signal ( )22
),( yxeyxf +−= πby means of a rectangular
sampling scheme to obtain 1.5 samples per millimeter. Determine the PSF h(x,y) of an ideal low-pass anti-aliasing filter with the maximum possible frequency content. What percentage of the spectrum energy of f(x,y) is preserved by this filter? In practice, can we sample f(x,y) alias-free without using an anti-aliasing filter? [6 pts.] (a) The sampling rate is given as 1.5 samples per millimeter. Assume x and y are in units of millimeters.
This would mean mmyx 667.05.1
1==∆=∆
To avoid aliasing
maxmax 21,
21
vy
ux ≤∆≤∆
this means that the maximum spatial frequency of the signals are
mmyv
mmxu 1750.0
21,1750.0
21
maxmax =∆
==∆
=
To ensure there is no aliasing we would need to implement an anti-aliasing low-pass filter with the maximum spatial frequencies shown above. (b) What percentage of the spectral energy of f(x,y) is preserved by this filter
∫ ∫
∫ ∫
− −
∞
∞−
∞
∞−
=
=
max
max
max
max
2
2
),(
),(
v
v
u
ufiltered
total
dudvvuFE
dudvvuFE
( ) ( )2222 )(2),( vu
y x
vyuxjyx edxdyeevuF +−∞
−∞=
∞
−∞=
+−+−∫ ∫ == πππ
( )
( )
( ) ( ) %44.98200200100%
),(
21),(
750.0
750.0
750.0
750.0
22
22
22
22max
max
max
max
22
max
max
max
max
22max
max
max
max
22
===×=
==
===
∫ ∫∫ ∫
∫ ∫∫ ∫
∫ ∫∫ ∫
− −
+−
− −
+−
− −
+−
− −
∞
∞−
∞
∞−
+−∞
∞−
∞
∞−
dudvedudveE
Epreserved
dudvedudvvuFE
dudvedudvvuFE
vuv
v
u
u
vu
total
filtered
v
v
u
u
vuv
v
u
ufiltered
vutotal
ππ
π
π
∆
∆⋅
∆
∆=y
y
yy
xx
xxyxh
2
)2
sin(
2
)2
sin(),( π
π
π
π
7

BMEG/ELEG 479/679 Homework 1 Solutions
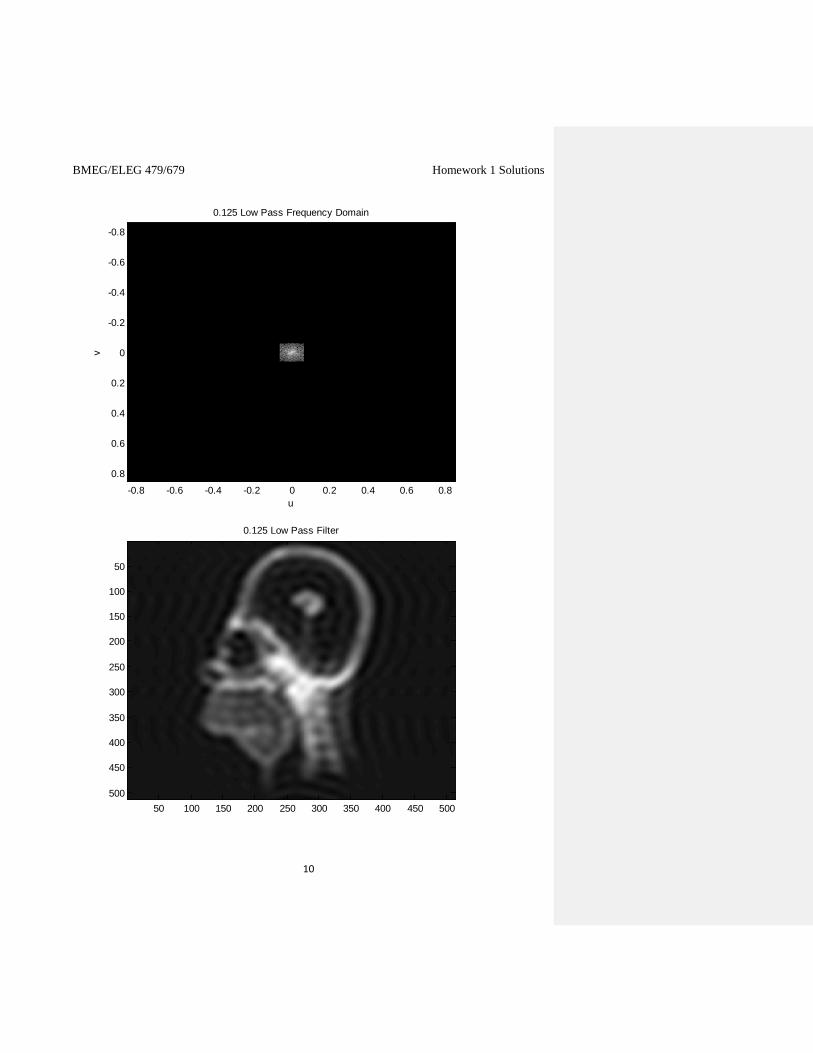
6. Matlab assignment Write a Matlab script file that does the following: (1) Loads in the input image found in homer.mat (file on the website) (2) Compute the 2D Fourier Transform (using the fft2 command) (3) Create a modified version of the Fourier Transform by forcing coefficients within certain regions (described in the figures below) to be zero (4) Calculate the reconstructed image using the modified Fourier Transform and plot the result. In your homework you should provide; a) commented copy of your Matlab code, b) imaging results for the 3 windows shown on the next page. [16 pts]
8

BMEG/ELEG 479/679 Homework 1 Solutions
Problem 6:
0.25 Low Pass Frequency Domain
u
v
-0.8 -0.6 -0.4 -0.2 0 0.2 0.4 0.6 0.8
-0.8
-0.6
-0.4
-0.2
0
0.2
0.4
0.6
0.8
0.25 Low Pass Filter
50 100 150 200 250 300 350 400 450 500
50
100
150
200
250
300
350
400
450
500
9
BMEG/ELEG 479/679 Homework 1 Solutions
0.125 Low Pass Frequency Domain
u
v
-0.8 -0.6 -0.4 -0.2 0 0.2 0.4 0.6 0.8
-0.8
-0.6
-0.4
-0.2
0
0.2
0.4
0.6
0.8
0.125 Low Pass Filter
50 100 150 200 250 300 350 400 450 500
50
100
150
200
250
300
350
400
450
500
10

BMEG/ELEG 479/679 Homework 1 Solutions
High Pass Frequency Domain
u
v
-0.8 -0.6 -0.4 -0.2 0 0.2 0.4 0.6 0.8
-0.8
-0.6
-0.4
-0.2
0
0.2
0.4
0.6
0.8
High Pass Filter
50 100 150 200 250 300 350 400 450 500
50
100
150
200
250
300
350
400
450
500
11
BMEG/ELEG 479/679 Homework 1 Solutions
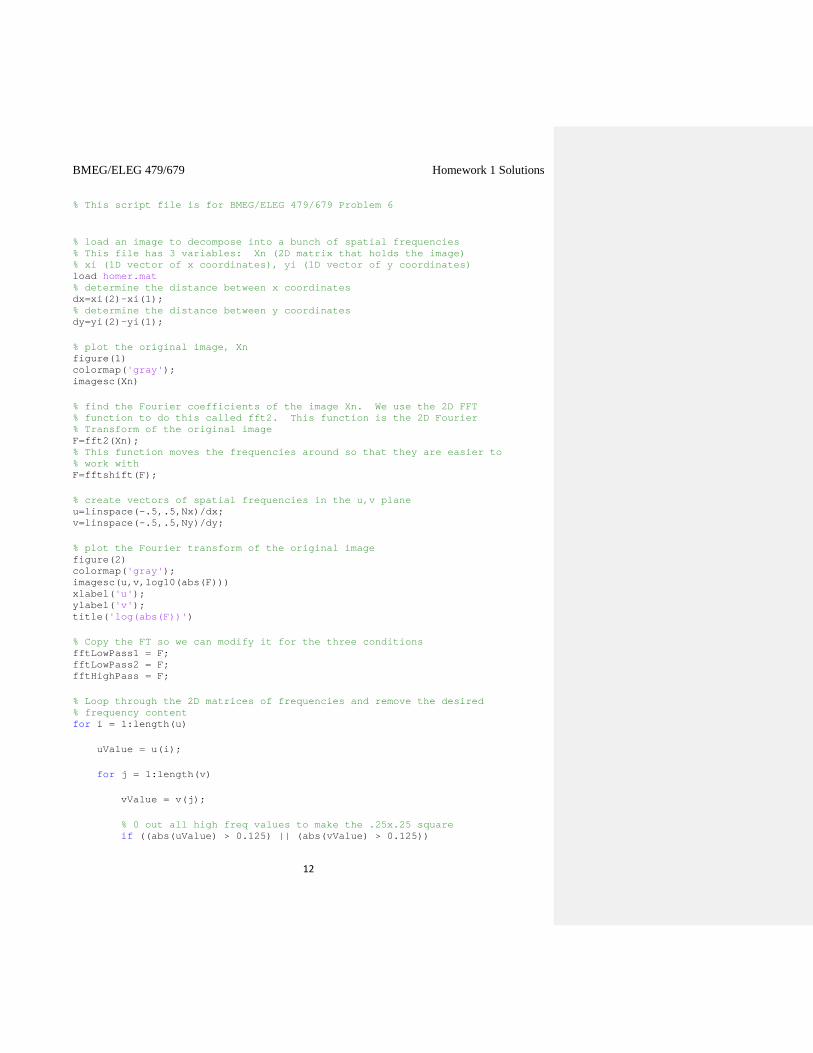
% This script file is for BMEG/ELEG 479/679 Problem 6
% load an image to decompose into a bunch of spatial frequencies % This file has 3 variables: Xn (2D matrix that holds the image) % xi (1D vector of x coordinates), yi (1D vector of y coordinates) load homer.mat % determine the distance between x coordinates dx=xi(2)-xi(1); % determine the distance between y coordinates dy=yi(2)-yi(1); % plot the original image, Xn figure(1) colormap('gray'); imagesc(Xn) % find the Fourier coefficients of the image Xn. We use the 2D FFT % function to do this called fft2. This function is the 2D Fourier % Transform of the original image F=fft2(Xn); % This function moves the frequencies around so that they are easier to % work with F=fftshift(F); % create vectors of spatial frequencies in the u,v plane u=linspace(-.5,.5,Nx)/dx; v=linspace(-.5,.5,Ny)/dy; % plot the Fourier transform of the original image figure(2) colormap('gray'); imagesc(u,v,log10(abs(F))) xlabel('u'); ylabel('v'); title('log(abs(F))') % Copy the FT so we can modify it for the three conditions fftLowPass1 = F; fftLowPass2 = F; fftHighPass = F; % Loop through the 2D matrices of frequencies and remove the desired % frequency content for i = 1:length(u) uValue = u(i); for j = 1:length(v) vValue = v(j); % 0 out all high freq values to make the .25x.25 square if ((abs(uValue) > 0.125) || (abs(vValue) > 0.125))
12

BMEG/ELEG 479/679 Homework 1 Solutions
fftLowPass1(j, i) = 0; end % 0 out all high freq values to make the .125x.125 square if ((abs(uValue) > 0.0625) || (abs(vValue) > 0.0625)) fftLowPass2(j, i) = 0; end % 0 out all low freq values to remove the .25x.25 square if ((abs(uValue) < 0.125) && (abs (vValue) < 0.125)) fftHighPass(j, i) = 0; end end end % Plot FT for the .25x.25 square figure(3) colormap('gray'); imagesc(u, v, log10(abs(fftLowPass1))); title ('0.25 Low Pass Frequency Domain') xlabel('u'); ylabel('v'); % Plot reconstructed image after removing frequencies figure(4) colormap('gray'); % ifftshift undoes fftshift imagesc(ifft2(ifftshift(fftLowPass1))) title ('0.25 Low Pass Filter') % Plot FT for the .125x.125 square figure(5) colormap('gray'); imagesc(u, v, log10(abs(fftLowPass2))); title ('0.125 Low Pass Frequency Domain') xlabel('u'); ylabel('v'); % Plot reconstructed image after removing frequencies figure(6) colormap('gray'); % ifftshift undoes fftshift imagesc(ifft2(ifftshift(fftLowPass2))) title ('0.125 Low Pass Filter') % Plot the FT for the the high pass filter figure(7) colormap('gray'); imagesc(u, v, log10(abs(fftHighPass))); title ('High Pass Frequency Domain') xlabel('u'); ylabel('v'); % Plot reconstructed image after removing frequencies
13

BMEG/ELEG 479/679 Homework 1 Solutions
figure(8) colormap('gray'); % ifftshift undoes fftshift imagesc(ifft2(ifftshift(fftHighPass))) title ('High Pass Filter')
14


