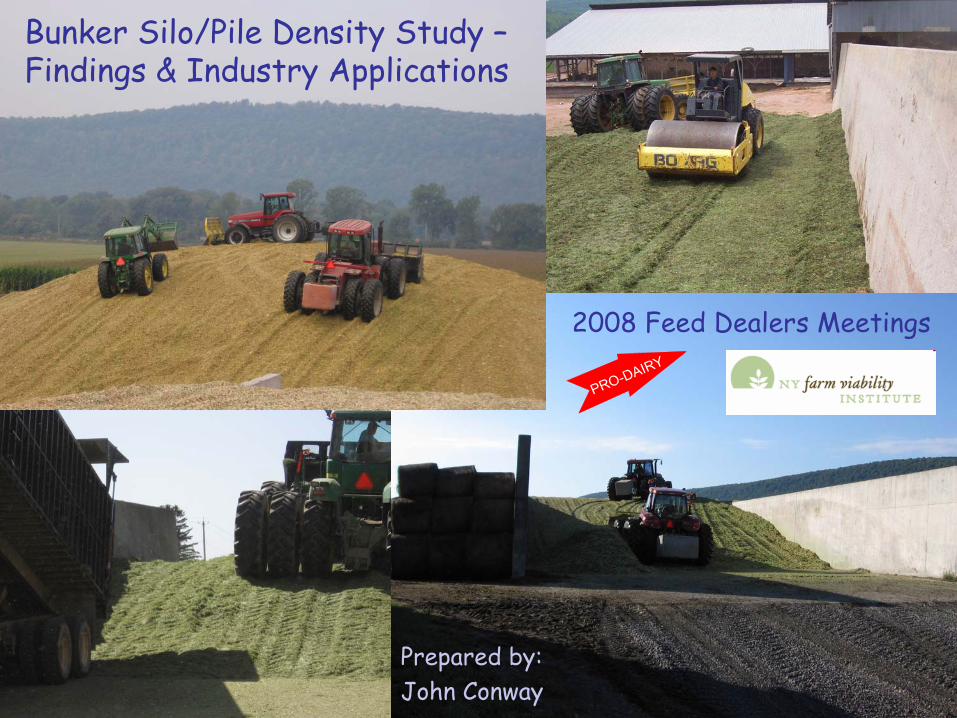
Bunker Silo/Pile Density Study –Findings & Industry Applications
2008 Feed Dealers Meetings
Prepared by:John Conway

Will we have adequate packing?Major influencers of silage density --
•Tractor weight•Packing time per ton•Layer thickness•Crop DM---------------------------(lesser extent)•Particle length•Height of silo
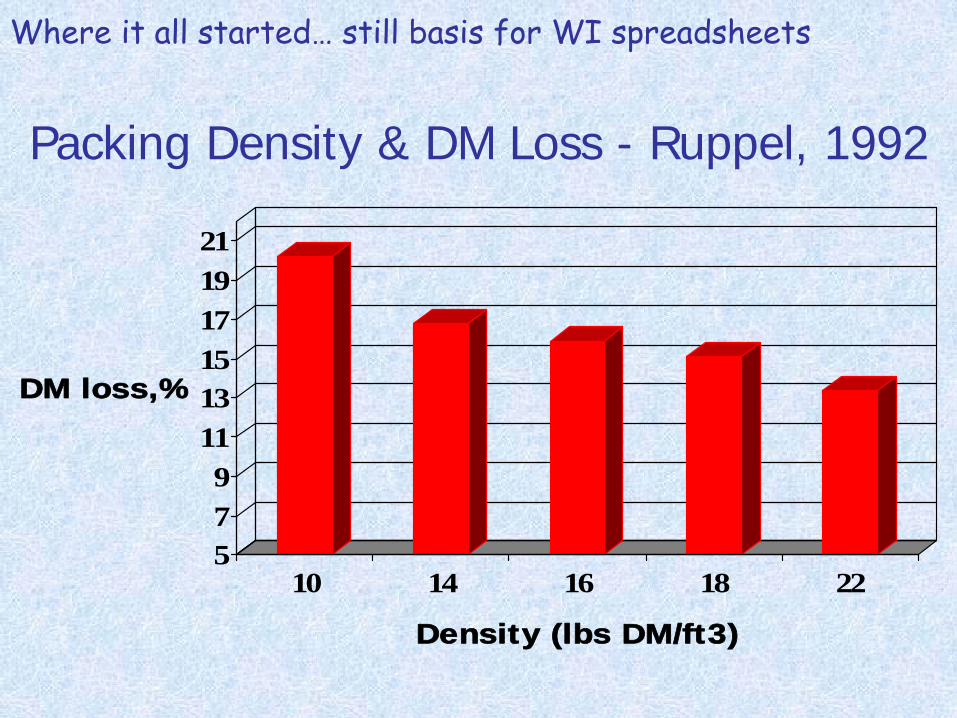
Packing Density & DM Loss - Ruppel, 1992
579
111315171921
DM loss,%
10 14 16 18 22
Density (lbs DM/ft3)
Where it all started…
still basis for WI spreadsheets

Bunker Silo Densities - Holmes, 1999
• Hay crop silage (87 silos)• Average = 14.8 lbs/cu ft (6.6 - 27.1)
• Corn silage (81 silos)• Average = 14.5 lbs/cu ft (7.8 - 23.6)
(note that these were single samples, “chest high”)

124 Samples from 68 Silo FacesLegume, Grass, Mixed, Corn Silage & BMR CS2004 2008, Most in 2006 & 2007 Crop SeasonsLed us to these conclusions…
Bunker Silo/Pile Density Study – Describe Silo Filling Dynamic Relative to DM Densities:
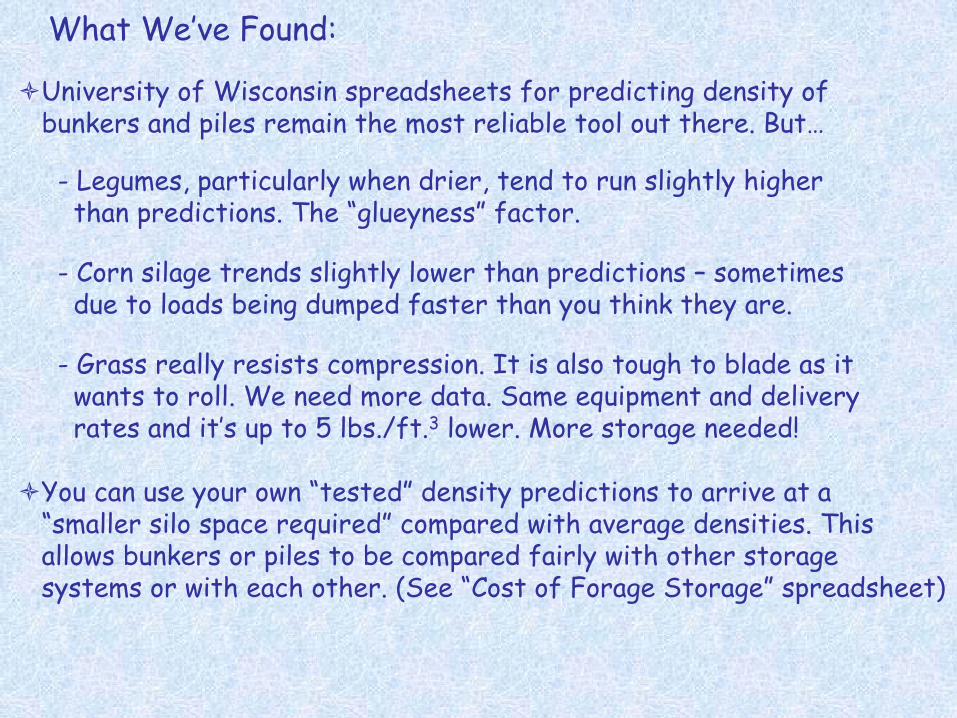
What We’ve Found:
University of Wisconsin spreadsheets for predicting density ofbunkers and piles remain the most reliable tool out there. But…
-
Legumes, particularly when drier, tend to run slightly higherthan predictions. The “glueyness”
factor.
-
Corn silage trends slightly lower than predictions –
sometimesdue to loads being dumped faster than you think they are.
-
Grass really resists compression. It is also tough to blade as itwants to roll. We need more data. Same equipment and deliveryrates and it’s up to 5 lbs./ft.3
lower. More storage needed!
You can use your own “tested” density predictions to arrive at a “smaller silo space required”
compared with average densities. Thisallows bunkers or piles to be compared fairly with other storagesystems or with each other. (See “Cost of Forage Storage”
spreadsheet)
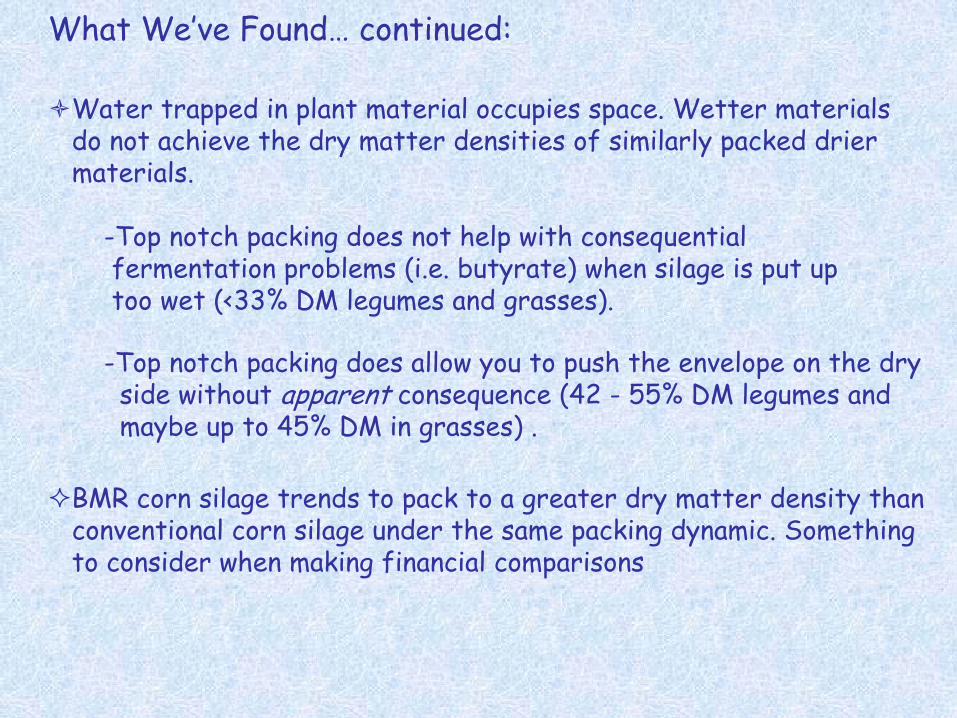
What We’ve Found…
continued:
Water trapped in plant material occupies space. Wetter materialsdo not achieve the dry matter densities of similarly packed driermaterials.
-Top notch packing does not help with consequentialfermentation problems (i.e. butyrate) when silage is put
uptoo wet (<33% DM legumes and grasses).
-Top notch packing does allow you to push the envelope on the dryside without apparent consequence (42 -
55% DM legumes andmaybe up to 45% DM in grasses) .
BMR corn silage trends to pack to a greater dry matter density thanconventional corn silage under the same packing dynamic. Something to consider when making financial comparisons
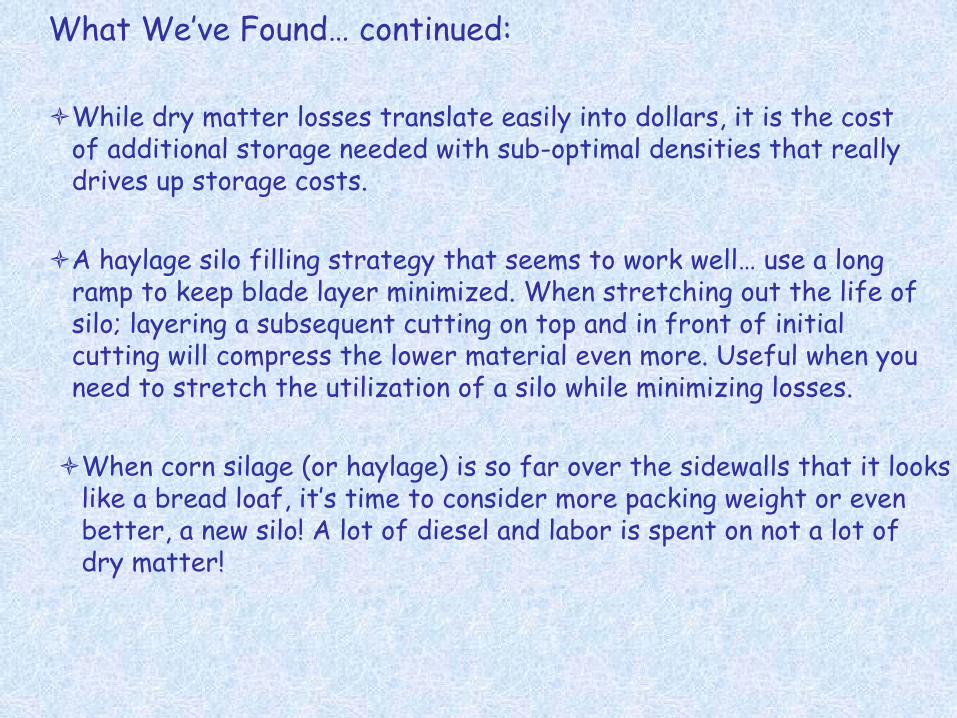
While dry matter losses translate easily into dollars, it is the costof additional storage needed with sub-optimal densities that really drives up storage costs.
What We’ve Found…
continued:
A haylage silo filling strategy that seems to work well… use a longramp to keep blade layer minimized. When stretching out the life ofsilo; layering a subsequent cutting on top and in front of initialcutting will compress the lower material even more. Useful when you need to stretch the utilization of a silo while minimizing losses.
When corn silage (or haylage) is so far over the sidewalls that it looks like a bread loaf, it’s time to consider more packing weight or evenbetter, a new silo! A lot of diesel and labor is spent on not
a lot of dry matter!

Grass “Rolling” , “Ridging”
& “Springing Back”
Mvi_0240.avi
Closer L k – Straight Grass
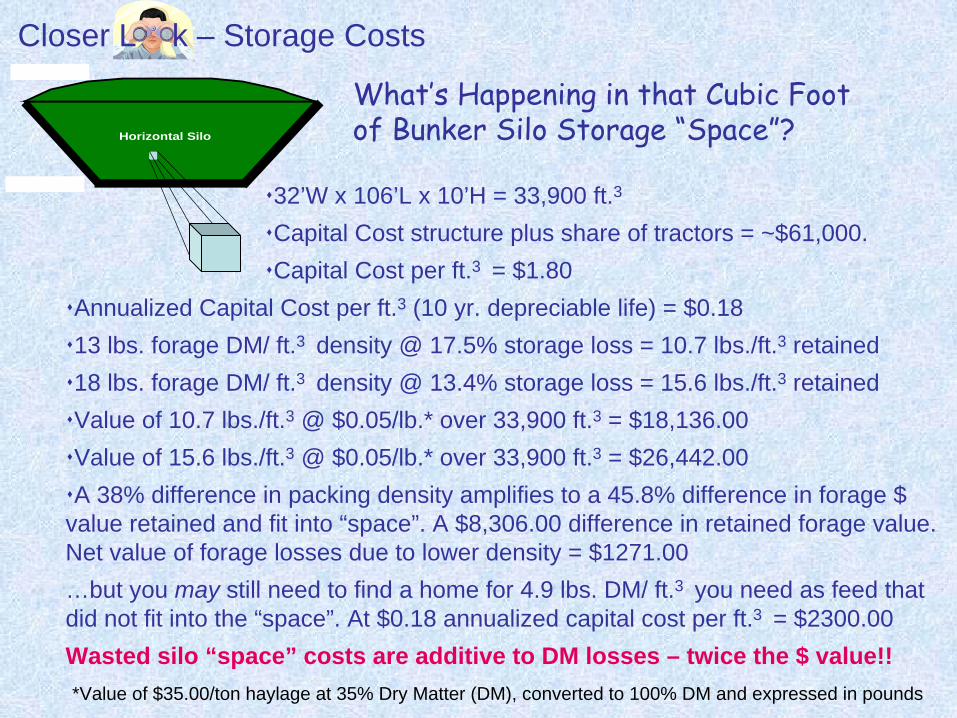
What’s Happening in that Cubic Foot of Bunker Silo Storage “Space”?Horizontal Silo
32’W x 106’L x 10’H = 33,900 ft.3
Capital Cost structure plus share of tractors = ~$61,000.Capital Cost per ft.3 = $1.80
Annualized Capital Cost per ft.3 (10 yr. depreciable life) = $0.1813 lbs. forage DM/ ft.3 density @ 17.5% storage loss = 10.7 lbs./ft.3 retained18 lbs. forage DM/ ft.3 density @ 13.4% storage loss = 15.6 lbs./ft.3 retainedValue of 10.7 lbs./ft.3 @ $0.05/lb.* over 33,900 ft.3 = $18,136.00Value of 15.6 lbs./ft.3 @ $0.05/lb.* over 33,900 ft.3 = $26,442.00A 38% difference in packing density amplifies to a 45.8% difference in forage $
value retained and fit into “space”. A $8,306.00 difference in retained forage value.Net value of forage losses due to lower density = $1271.00 …but you may still need to find a home for 4.9 lbs. DM/ ft.3 you need as feed that did not fit into the “space”. At $0.18 annualized capital cost per ft.3 = $2300.00Wasted silo “space” costs are additive to DM losses – twice the $ value!!*Value of $35.00/ton haylage at 35% Dry Matter (DM), converted to 100% DM and expressed in pounds
Closer L k – Storage Costs
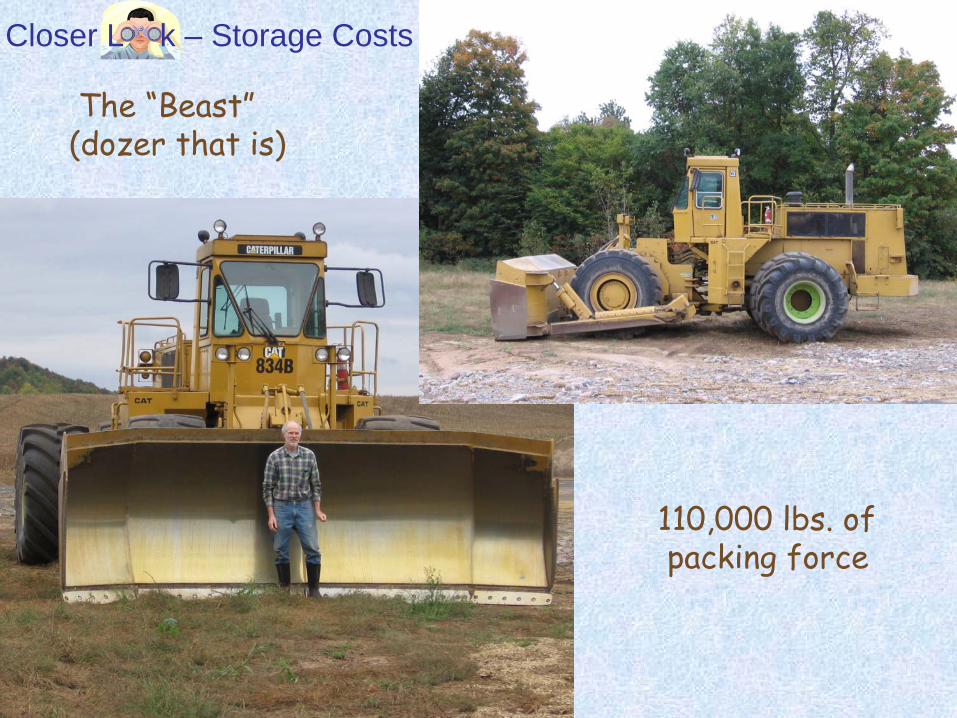
The “Beast”(dozer that is)
110,000 lbs. ofpacking force
Closer L k – Storage Costs

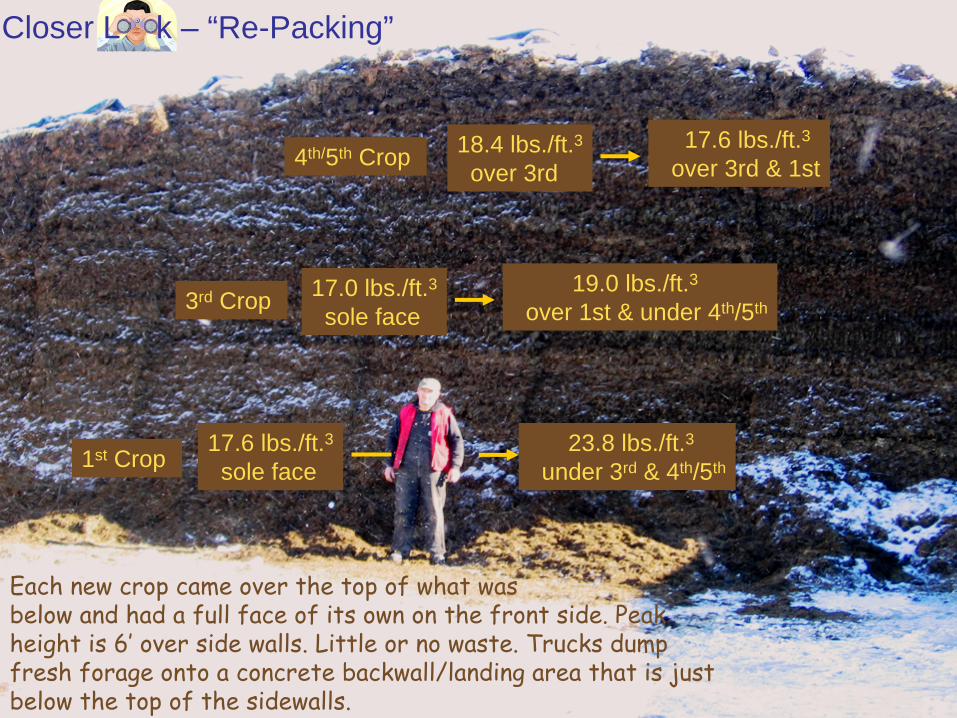
1st Crop 17.6 lbs./ft.3sole face
23.8 lbs./ft.3under 3rd & 4th/5th
3rd Crop 17.0 lbs./ft.3sole face
19.0 lbs./ft.3over 1st & under 4th/5th
4th/5th Crop 18.4 lbs./ft.3over 3rd
17.6 lbs./ft.3over 3rd & 1st
Each new crop came over the top of what was below and had a full face of its own on the front side. Peak height is 6’
over side walls. Little or no waste. Trucks dump fresh forage onto a concrete backwall/landing area that is just below the top of the sidewalls.
Closer L k – “Re-Packing”
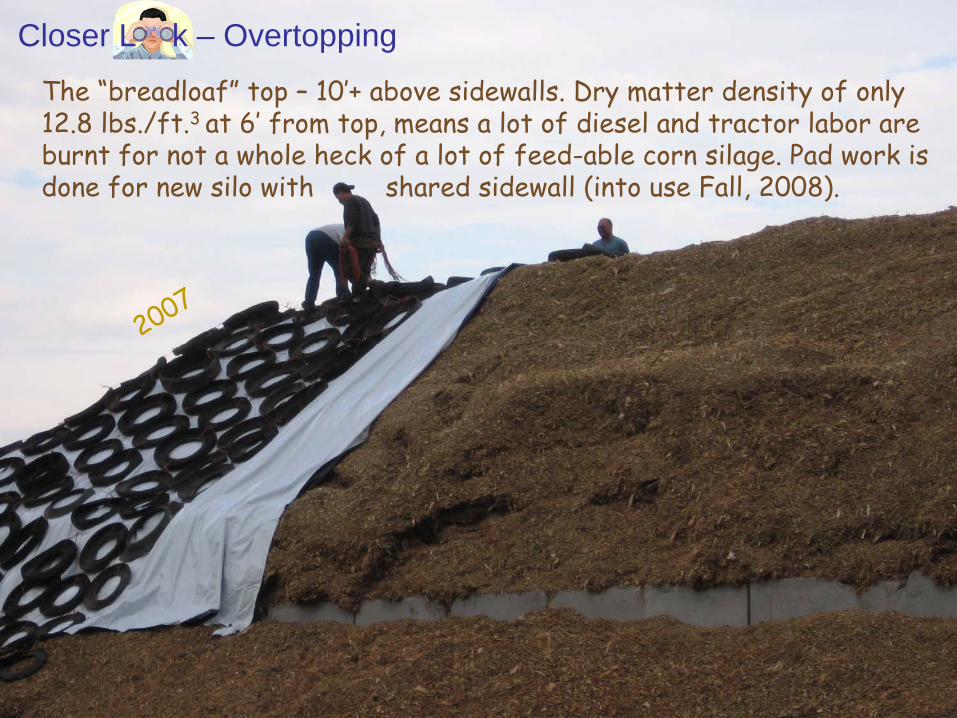
The “breadloaf”
top –
10’+ above sidewalls. Dry matter density of only12.8 lbs./ft.3 at 6’
from top, means a lot of diesel and tractor labor are burnt for not a whole heck of a lot of feed-able corn silage. Pad work isdone for new silo with shared sidewall (into use Fall, 2008).
Closer L k – Overtopping
2007
Useful Tools to Integrate Forage Production with Feeding System at the Silo
(CD of Related Wisconsin Spreadsheets)
Useful Tools to Integrate Forage Production with Feeding System at the Silo (continued)
(CD of Related Wisconsin Spreadsheets)
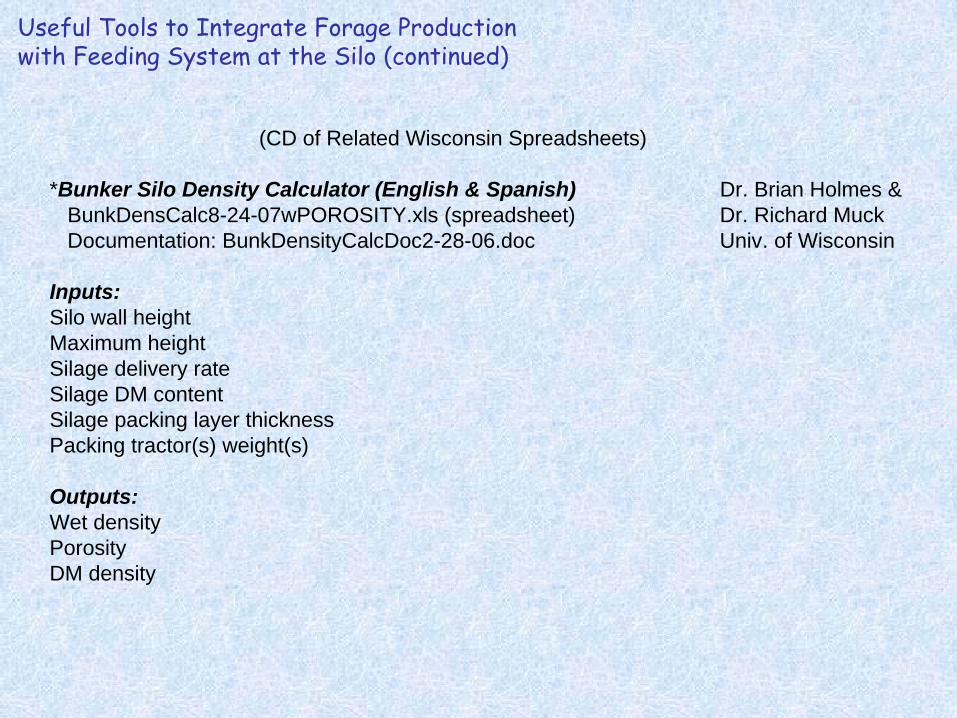
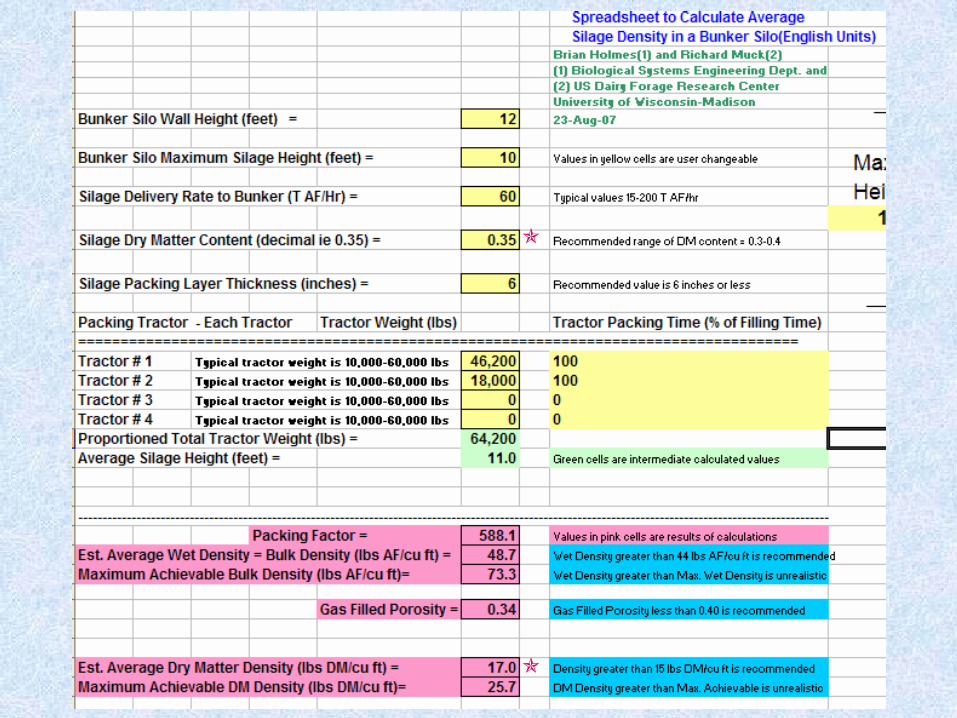
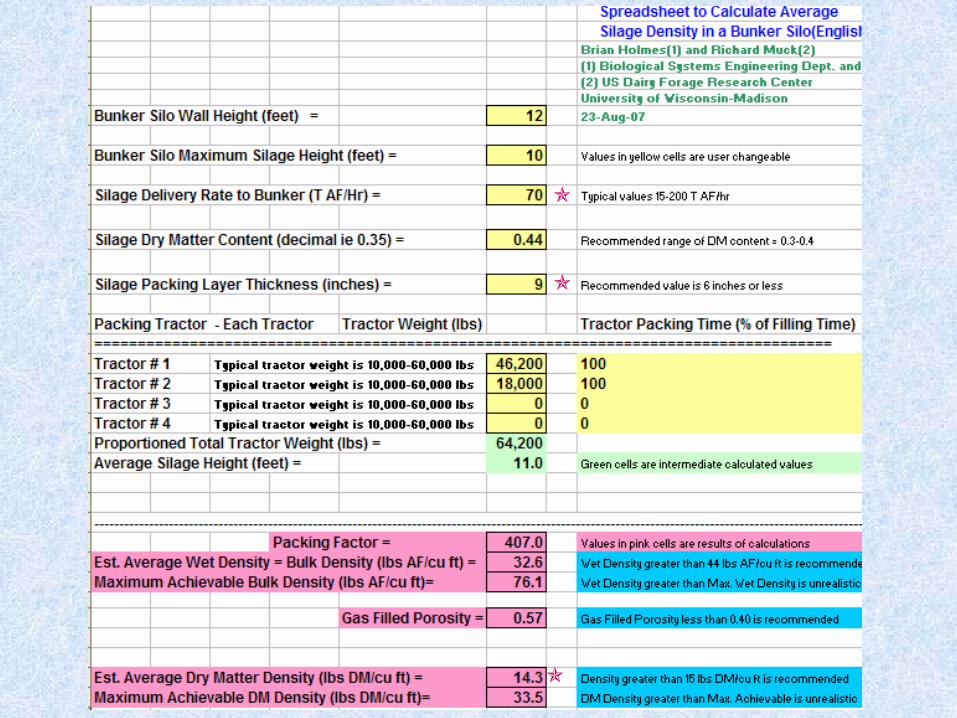
*Bunker Silo Density Calculator (English & Spanish) Dr. Brian Holmes &BunkDensCalc8-24-07wPOROSITY.xls (spreadsheet) Dr. Richard MuckDocumentation: BunkDensityCalcDoc2-28-06.doc Univ. of Wisconsin
Inputs:Silo wall heightMaximum heightSilage delivery rateSilage DM contentSilage packing layer thicknessPacking tractor(s) weight(s)
Outputs:Wet densityPorosityDM density


Useful Tools to Integrate Forage Production with Feeding System at the Silo (continued)
(CD of Related Wisconsin Spreadsheets)
*Silage Pile Density Calculator (English & Spanish) Dr. Brian Holmes &PileDensCalcwPOROSITY8-24-07.xls (spreadsheet) Dr. Richard MuckDocumentation: PileDensityCalculatorDoc2-28-06.doc Univ. of Wisconsin
Inputs:Bottom widthHeightTop widthSide slope (if known)Silage delivery rateSilage DM contentSilage packing layer thicknessPacking tractor(s) weight(s)
Outputs:Wet densityPorosityDM density

Packed pile with same tonnage stored as last bunker silo –best density achievable is 9% lower (16.6 vs. 18.1 lbs./ft.3)
Useful Tools to Integrate Forage Production with Feeding System at the Silo (continued)
(CD of Related Wisconsin Spreadsheets)
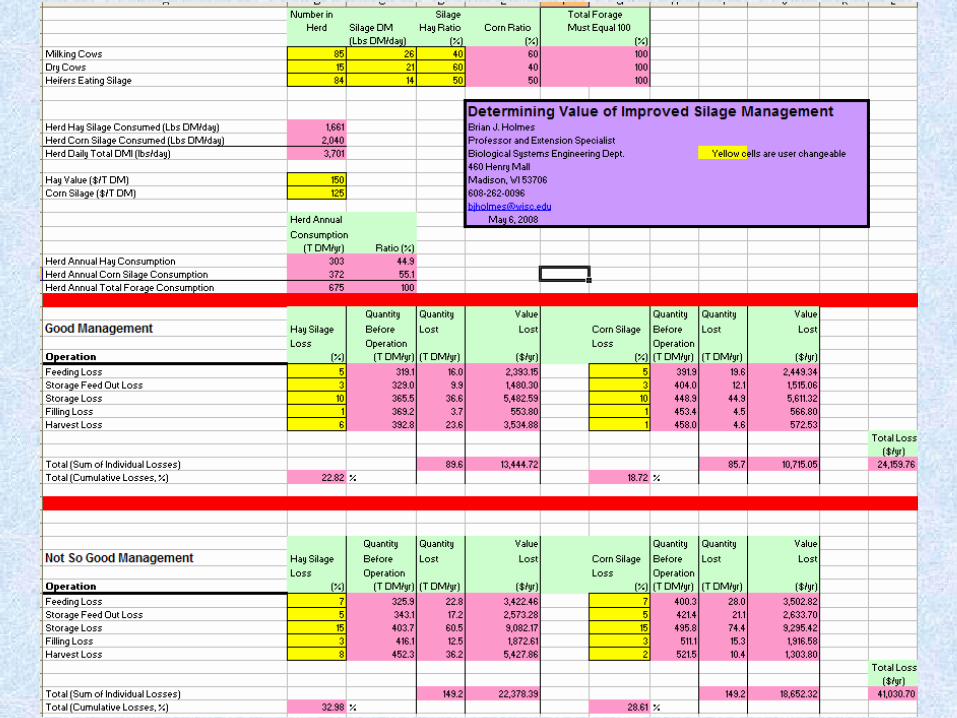
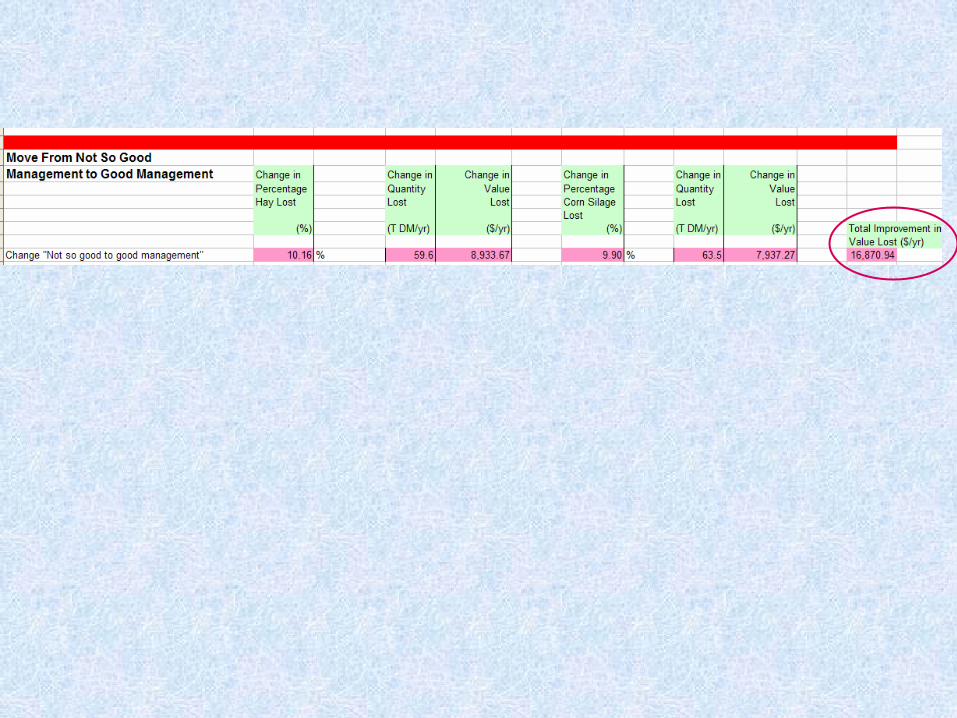
*Determining Value of Improved Silage Management Dr. Brian Holmes, FeedLo$$5-6-08.xls (spreadsheet) Univ. of WisconsinDocumentation is a sheet (tab) within spreadsheet
Inputs:Animal numbersDM consumptionRation ratio of haylage:corn silageHaylage $ valueCorn silage $ valueLoss values – beforeLoss values – after
Output:Bottom line – Total improvement in value lost, $/year
Useful Tools to Integrate Forage Production with Feeding System at the Silo (continued)
(CD of Related Wisconsin Spreadsheets)
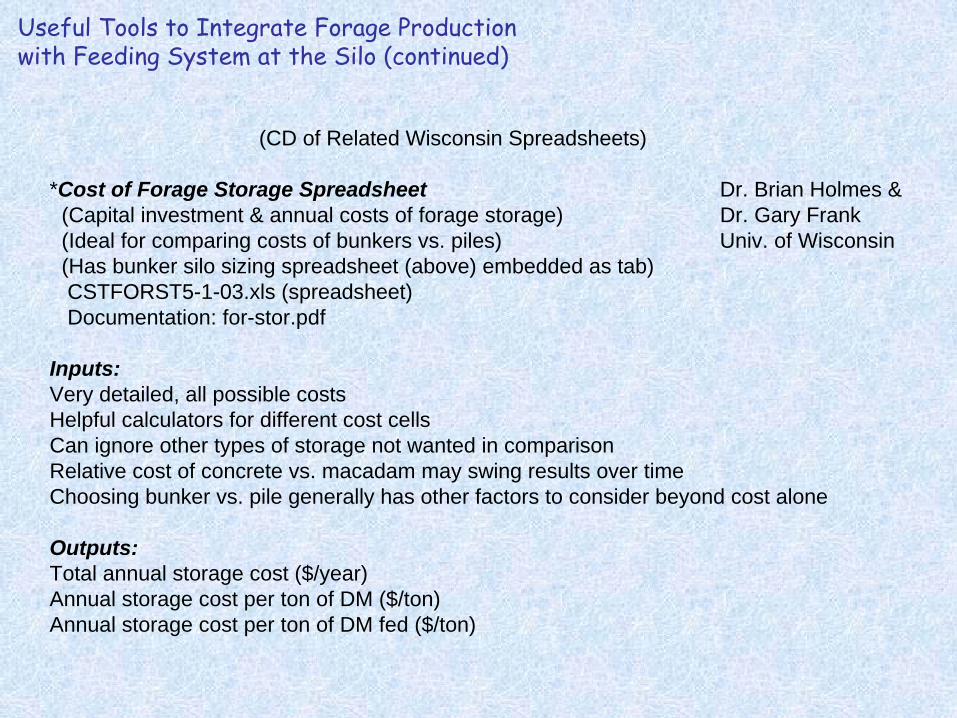
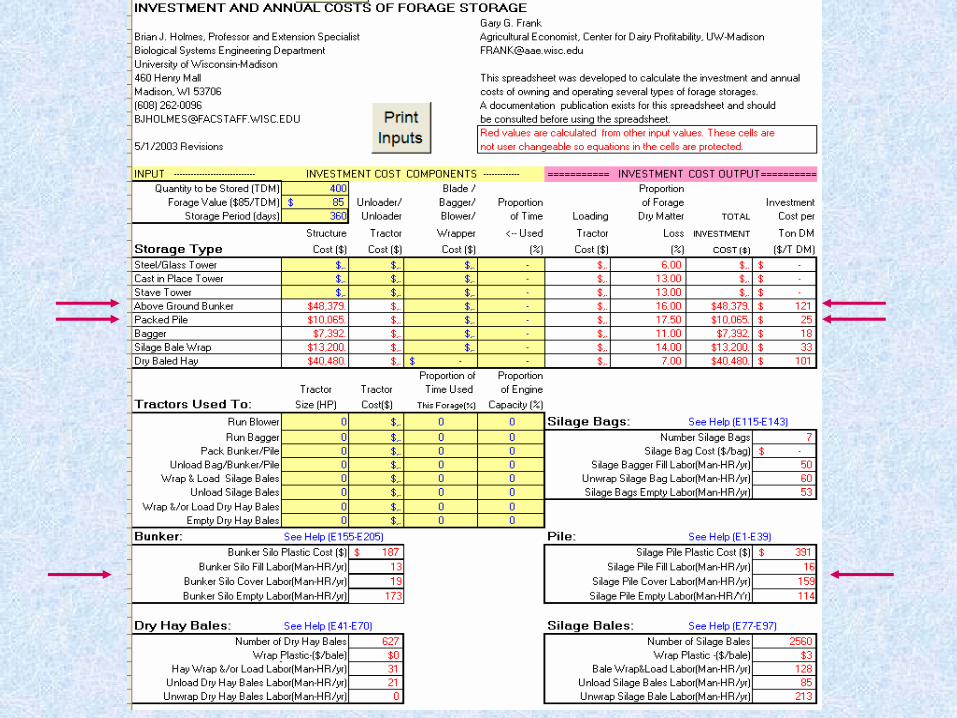
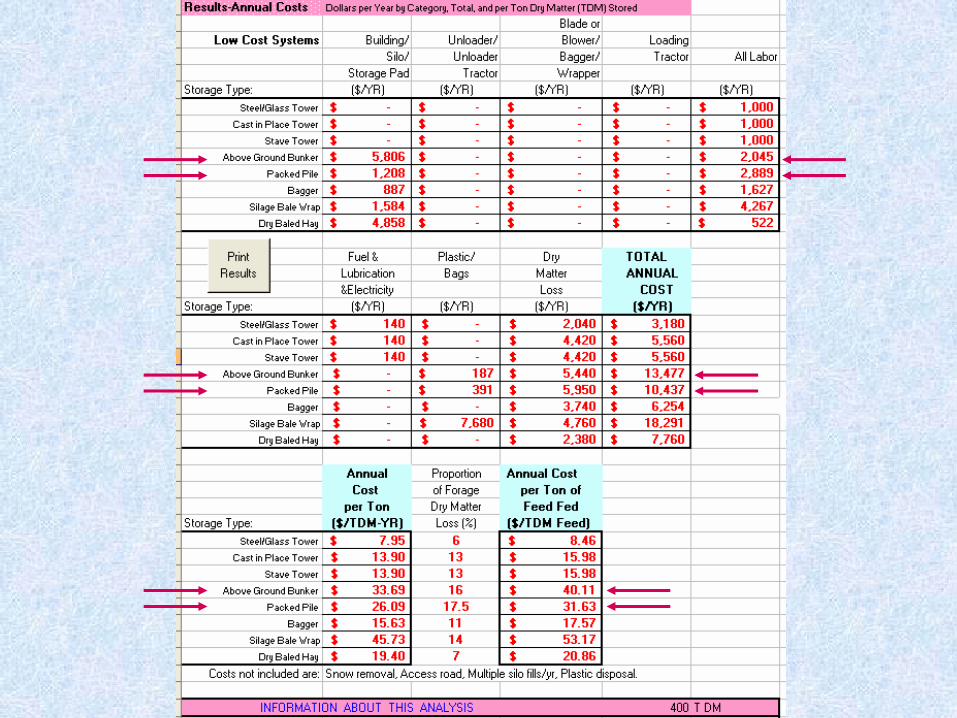
*Cost of Forage Storage Spreadsheet Dr. Brian Holmes &(Capital investment & annual costs of forage storage) Dr. Gary Frank(Ideal for comparing costs of bunkers vs. piles) Univ. of Wisconsin(Has bunker silo sizing spreadsheet (above) embedded as tab)CSTFORST5-1-03.xls (spreadsheet)Documentation: for-stor.pdf
Inputs:Very detailed, all possible costsHelpful calculators for different cost cellsCan ignore other types of storage not wanted in comparisonRelative cost of concrete vs. macadam may swing results over timeChoosing bunker vs. pile generally has other factors to consider beyond cost alone
Outputs:Total annual storage cost ($/year)Annual storage cost per ton of DM ($/ton)Annual storage cost per ton of DM fed ($/ton)


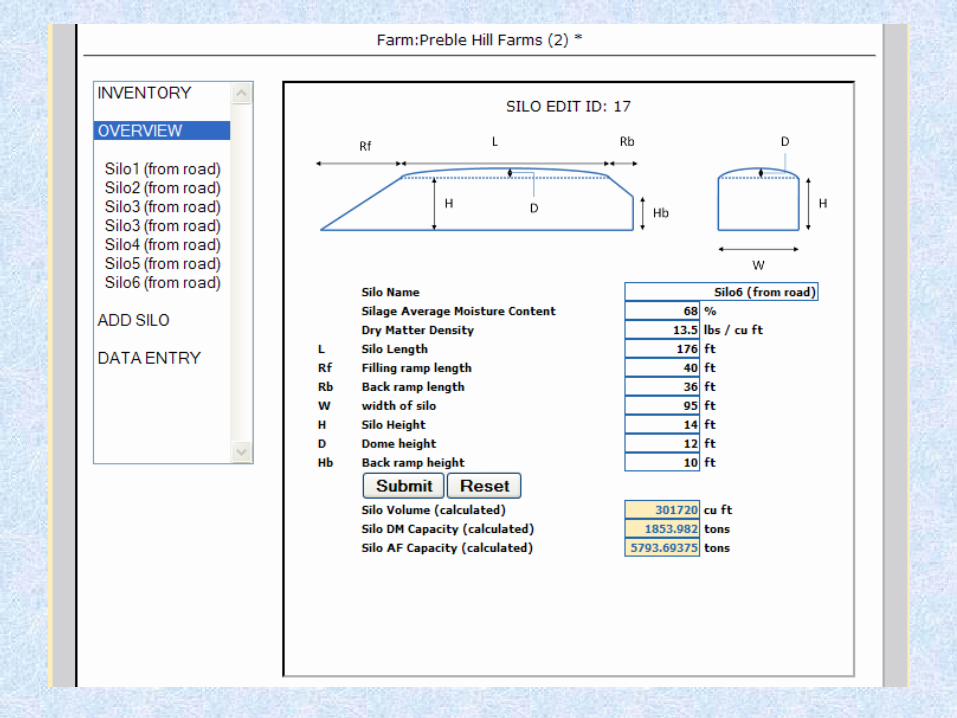
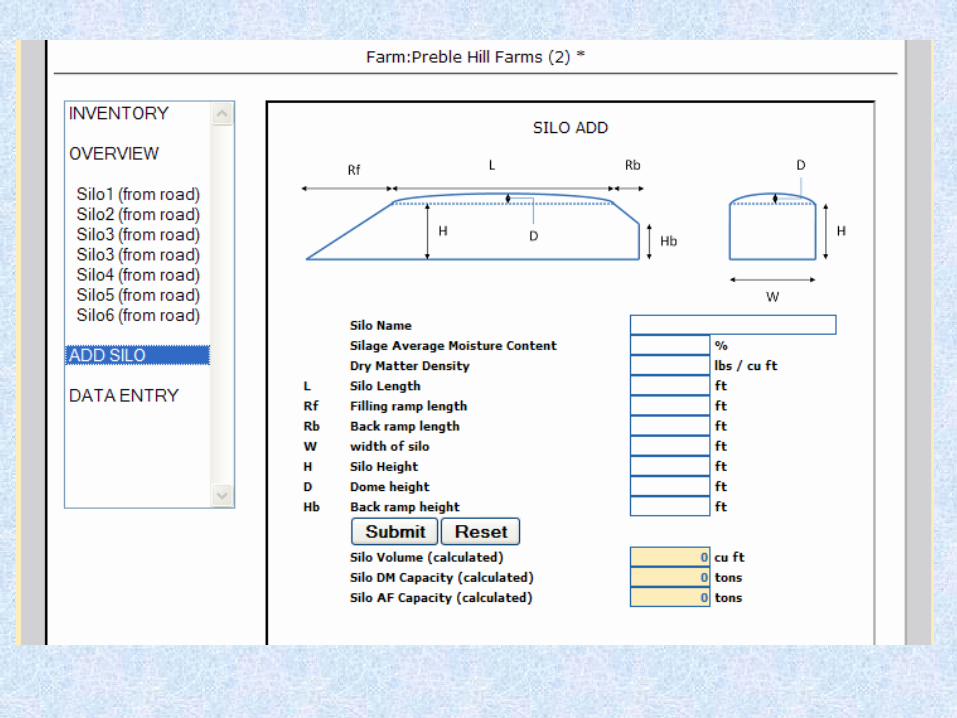
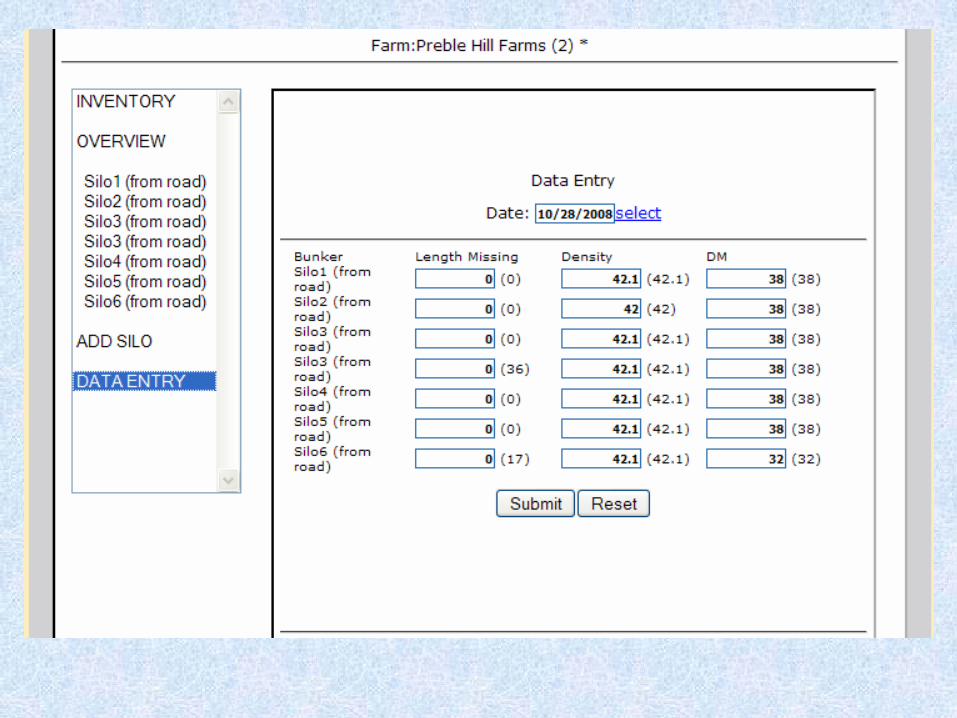
http://www.agmodels.com/clients/silostor/
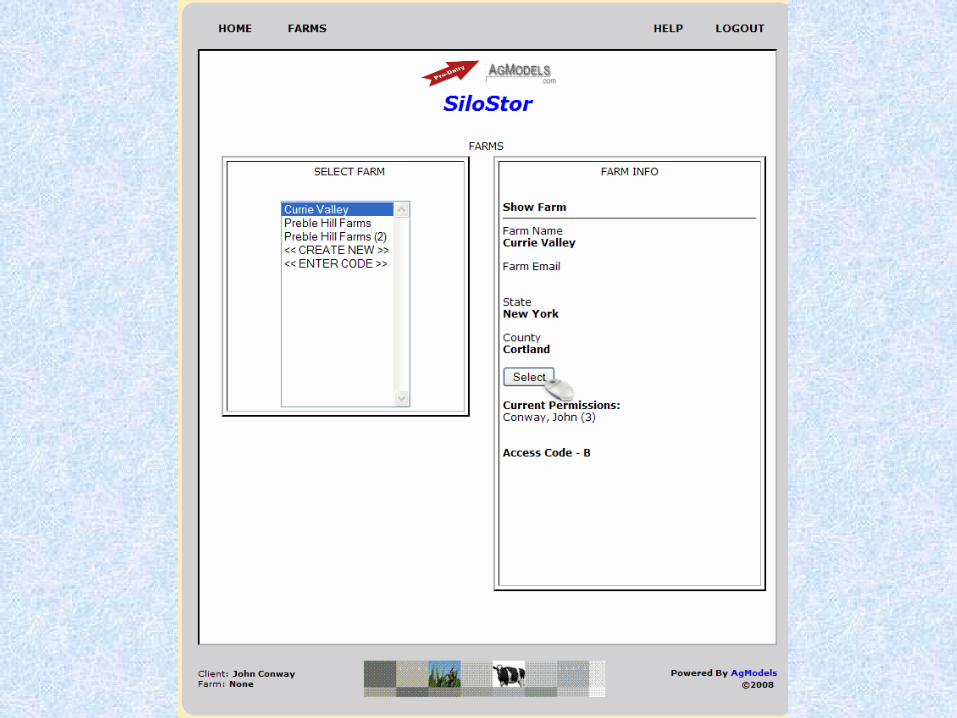
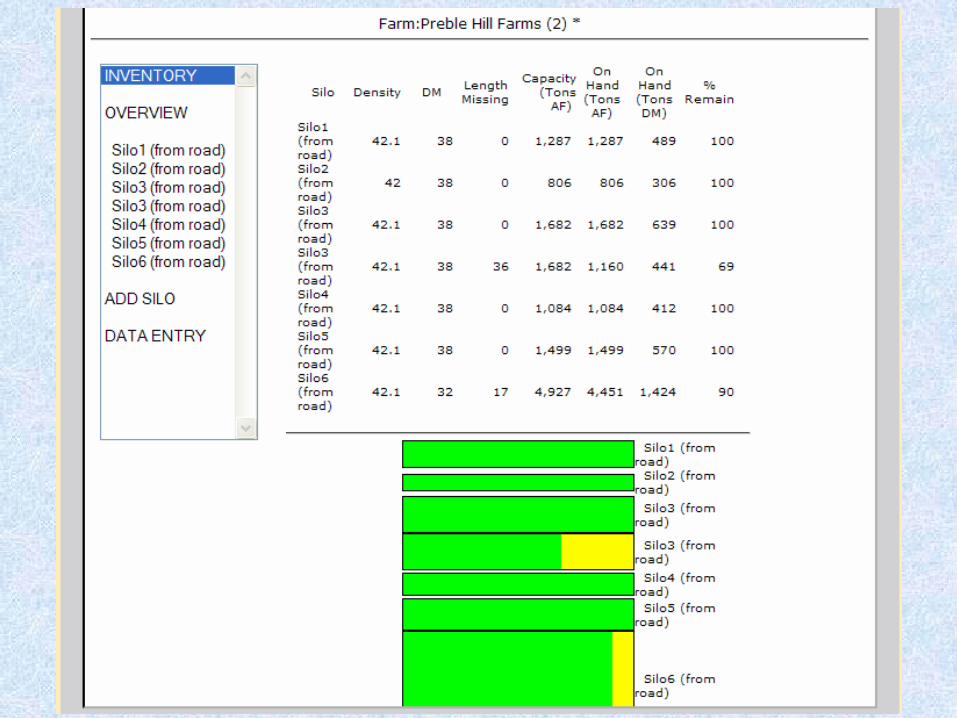
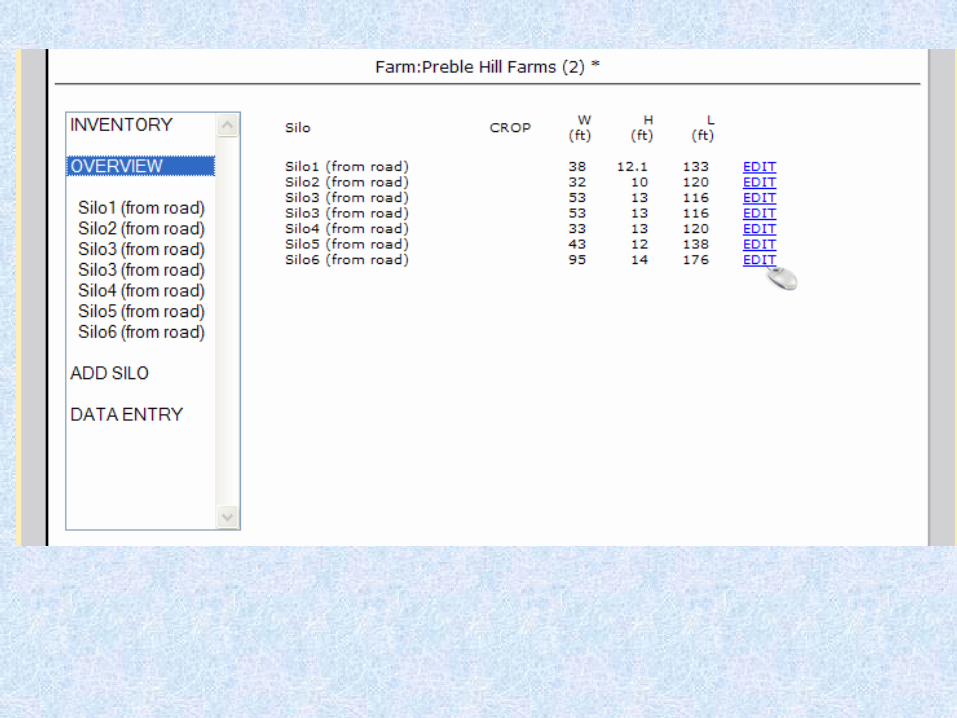
Real time, web-based,silo inventory managementsoftware.
Project’s contribution tofarm’s Forage Feed Flowoperations management:
Why web-based?Speed & capacity of serverGreater programming flexibility & efficiencyContinuous enhancements/upgrading without user disruptions

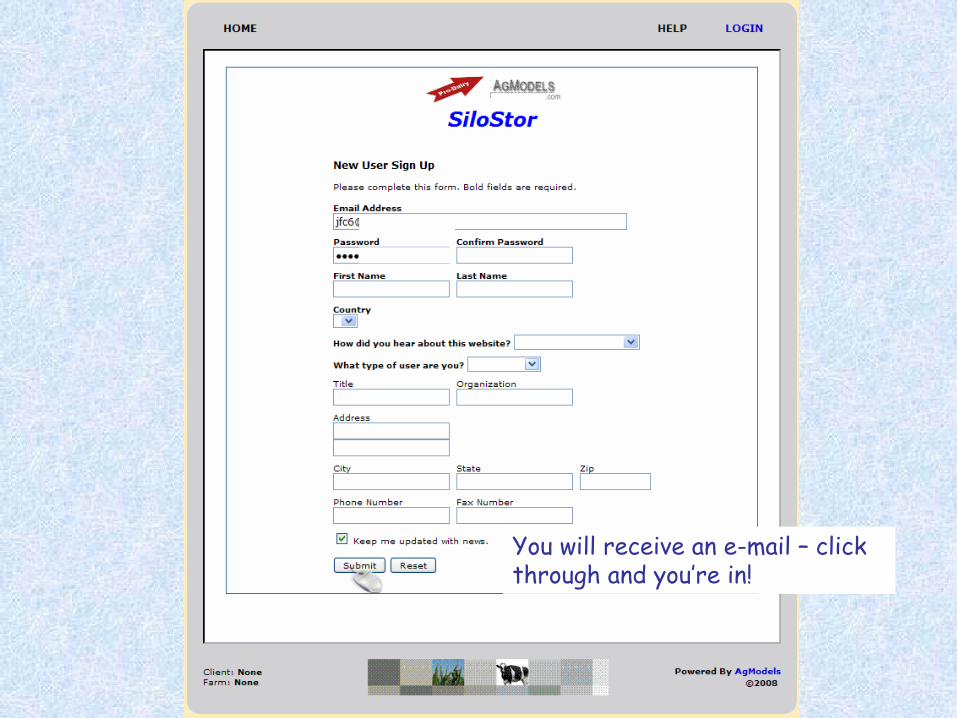
You will receive an e-mail –
click through and you’re in!

Spend Laborand/or Machinery Dollars on More
Intensive Packing?
*Current Operational Bottleneck(s)-Mowing capacity-Merging capacity-Chopping capacity-Hauling capacity-”Blading”
capacity-Packing capacity-Available quality labor for all above
-Functional silo capacity
Have Competing RelatedInvestment Needs and Wants?
*Are you willing to gamble on 1st
crop weather window “length”
in days? 2006 wasreally only 4 –
5! *Soil related constraints under saturated conditions
Want to Mitigate Risks Associated with Mother Nature?
*Need to get more storageout of existing space. (Pack it in tighter)
*Want to limit DM losses*Both of the above
What are Short/Long Term Goals?
Why use tools?
Help in Complicated
Decision Making
Dynamic
*Acres available*Yield per acre*Total Herd Forage DM Needs-Current “steady state”+ with optimum quality+ at maximum inclusion rate+ want/need future expansion
What’s Driving Demand toConserve the Most Possible?
Benefits Experienced by Project Farms“Guy with clipboard” effect; big response in added tractorweight and packing intensity.
Gains in inventory carried over – even in modest yield years like 2006 & 2007 crop seasons.
Inventory gains are very real. Opens door to some interesting options:
-
Grow herd if in position to do so-Shift rotations to mix of hay and corn that best suitsland resource
-Divert some acreage to energy and/or protein grainproduction
-Some profit generating combination of the above

Let’s end with the start of a well-packed pile…


