
Life on Earth National 5 Course Notes
1
Calderglen High School
National 5 Biology
Life on Earth Unit

Life on Earth National 5 Course Notes
2
Life on Earth
Subtopic 1: Ecosystems
A species are a group of organisms that can interbreed and produce fertile
offspring.
Biodiversity is a term used to describe the different species of organisms in an
ecosystem. It also includes variation between the same species e.g. rabbits
with black coats and rabbits with grey coats.
Ecosystems with high biodiversity (a lot of different species) are healthier than
ecosystems with low biodiversity (few different species) and therefore more
likely to survive.
Producer: - a green plant that makes its own energy by photosynthesis using energy from the sun.
Consumer: - an animal that eats the plants or other animals.
We can form a food chain which shows these relationships.
e.g. grass rabbit fox . (producer) (primary consumer) (secondary consumer)
The arrows in the food chain show the direction of energy flow.
Further definitions
Herbivore: - animal that eats green plants e.g. the rabbit in the above food chain
Carnivore: - animal that eats other animals e.g. the fox in the above food chain.
Omnivore: - animal that eats green plants and other animals e.g. bear.
Food chains rarely exist in isolation e.g. in the above food chain the grass may also be eaten by deer and rabbits may also be eaten by hawks. A series of interconnecting food chains make up a food web.

Life on Earth National 5 Course Notes
3
An ecosystem consists of all the organisms (the community) living in a
particular habitat and the non-living components with which the organisms
interact. e.g. a wood or a pond.
A habitat is the place an organism lives and the community is made up of all
the organisms in the ecosystem.
A niche is the role an organism plays within an ecosystem. This relates to the
resources it requires in its ecosystem, such as light and nutrient availability and
its interactions with other organisms in the community. It involves competition
and predation and conditions it can tolerate e.g. temperature. For example a
rabbit would have predators like foxes, hawks and weasels and would feed on
grass and small plants. The rabbit would also be host to many diseases and
carcasses could provide food for flies and crows.
Predation
A predator kills and eats its prey.
In cases of extreme predation the prey can be wiped out but more often
a decrease in prey is followed by a decrease in predators. The prey will
then increase again followed by the predators etc.
A food web

Life on Earth National 5 Course Notes
4
The predators are actually beneficial to the prey because without them they
would exhaust the food supply.
Competition
Competition in an ecosystem occurs when resources are in short supply.
Examples of resources include water, light and nutrient availability.
Competition can be divided into interspecific (different species) and
intraspecific (same species).
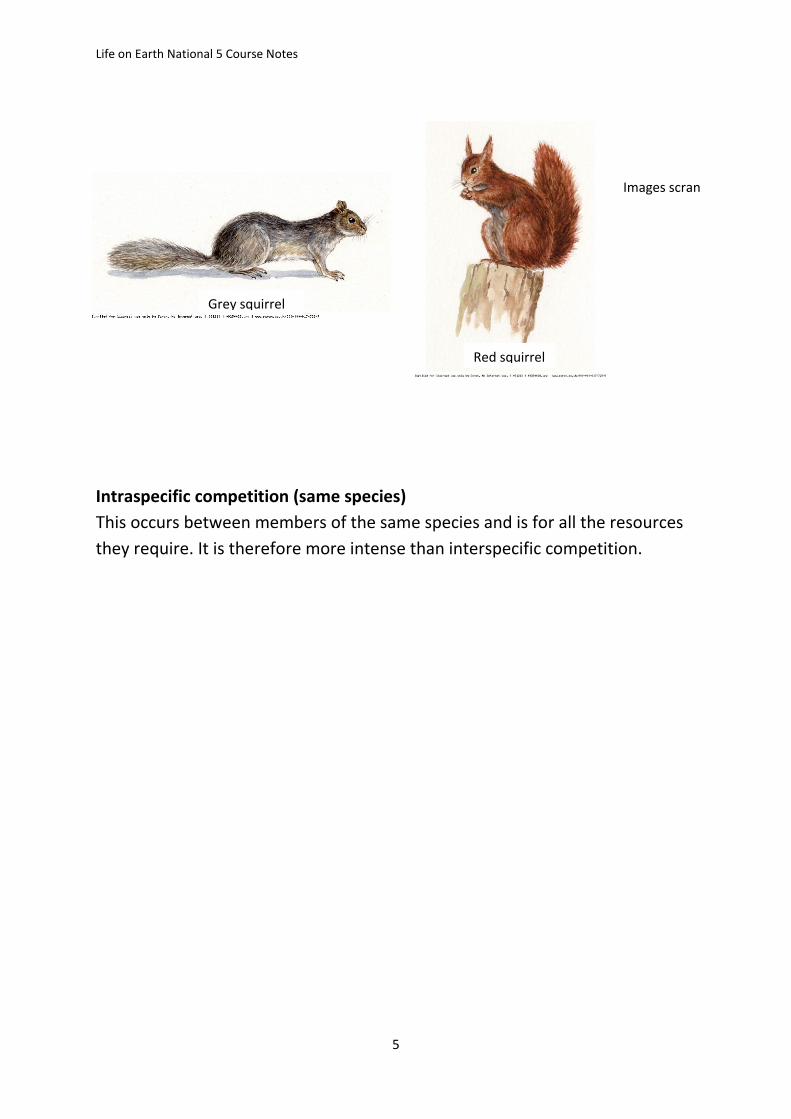
Interspecific (different species)
Occurs amongst individuals of different species for one or a few of the
resources they require.
Red squirrel and grey squirrel.
Grey squirrels are stronger and more aggressive in pursuit of food so in areas
where both types are present the red squirrels have been eliminated.
Red squirrels still survive in coniferous woodland because they can survive on a
diet of pine seeds alone whereas grey squirrels cannot.
Image BBC Bitesize
Life on Earth National 5 Course Notes
5
Intraspecific competition (same species)
This occurs between members of the same species and is for all the resources
they require. It is therefore more intense than interspecific competition.
Images scran
Grey squirrel
Red squirrel

Life on Earth National 5 Course Notes
6
Subtopic 2: Distribution of Organisms
Biotic :- living factors e.g. disease, predation, food availability, grazing and
competition.
Abiotic :- non-living factors e.g. light intensity, temperature, mositure, pH.
Both the above effect the biodiversity and distribution of organisms.
Measurement of Biotic Factors
Sampling techniques are designed to quantify the numbers of an organism in a
habitat without having to count every individual. It is important enough
samples are taken to make the results more reliable and that they are taken in
a random manor i.e. if quantifying the daises on a lawn it would not be
appropriate to sample only the areas where daisies were clumped.
Quadrats
This device can be used to estimate numbers of plants or very slow moving
animals. The quadrat could be used to estimate the daisies in a field. The
quadrat is divided into squares. it is placed in several random locations and
each square containing daisies counted. An average is taken and used to
estimate the total number of daisies in the field. N.B. quadrats must be placed
randomly.
Transect lines
This involves placing quadrats at equal distances along a line e.g. to see the
effect of increasing light intensity as the line emerges from woodland.
Pitfall Traps
These are used to estimate numbers of small invertebrates in a habitat such as
leaf litter in woodland.

Life on Earth National 5 Course Notes
7
The trap must be covered to prevent predators such as birds eating the
contents and to prevent excess rainwater.
The trap must be level with the ground to allow animals to fall in.
The trap must be checked regularly to prevent carnivorous trapped
animals eating other animals.
The trap should have pinholes in the base to allow water to escape.
Sufficient traps should be set to give a more reliable result.
Measuring Abiotic factors
Temperature
This is measured in degrees Celsius (oC ) using a thermometer. There are
several types including soil thermometers that have a probe to stick into the
soil.
Which ever type you are using you must ensure
you do not hold the detecting part
allow the instrument to stabilise before taking a reading.
Take enough readings of the area to obtain a more reliable result.
Light
Measured in lux using a light meter.
The detector should face the light source
Avoid shading the detector

Life on Earth National 5 Course Notes
8
Take enough samples to give a more reliable result
This is a measure of acidity or alkalinity. The range is 0-14 with pH 7 being
neutral. Acids become stronger as they move away from 7 towards 0 and
alkalis become stronger as they move away from 7 towards 14.
Soil Moisture
This has a probe to measure moisture levels in the soil.
With this meter and the pH meter it is important to
clean the probe between each use to remove any
moisture from the previous reading.
Paired-statement keys
These can be used to identify organisms.
Statement
1. Does the animal have four legs Yes – go to statement 2
No – go to statement 4
2. Does the animal have a curly tail? Yes – pig
No – go to statement 3
3. Does the animal have a hoof divided into two parts? Yes – cow
No - horse
4. Does the animal have webbed feet? Yes – duck
No - human
BBC Bitesize

Life on Earth National 5 Course Notes
9
.The effect of abiotic factors on biodiversity
pH
Most aquatic environments have a pH range between 6-8. Acidification due to
pollution e.g. pollution from factories causing acid rain.
Temperature
The north sea temperature is rising due to climate change forcing cold water
species such as sardines and anchovies to move further north. At the same
time warm water species like red mullet are beginning to inhabit the north sea.
Indicator Species
An Indicator species is a species that can show the
levels of pollution of an environment by being
absent or in some cases present.
For example, the Stonefly nymph shown in the diagram is only found in water which does not have any sewage pollution.
Lichens are found on the bark of trees and indicate the levels of air pollution (particularly sulphur dioxide). Crusty lichen is found at all levels of pollution, whereas lung Lichen is only found in unpolluted air.
Stonefly Nymph
imageBBC Bitesize

Life on Earth National 5 Course Notes
10
Subtopic 3: Photosynthesis
Photosynthesis
Photosynthesis is the process in green plants involving the manufacture of glucose
sugar from Carbon dioxide gas and water, producing Oxygen gas as a by-product.
Leaves contain a special pigment known as CHLOROPHYLL that allows plants to capture
the energy of light to drive the process.
The sugar can be used by the plant cells themselves during respiration, stored in the
leaves as starch or built up into cellulose, a chemical that makes up cell walls.
Summary:
Carbon dioxide + Water Glucose + Oxygen
The process of photosynthesis takes place in the chloroplast and occurs in two stages:
the light reaction and the carbon fixation stage.
Stage 1 – The light reactions
The light energy from the sun is trapped by chlorophyll in the chloroplasts and is
converted into chemical energy in the form of ATP. Water is split to produce hydrogen
and oxygen. The oxygen diffuses from the cell.
Light energy
Chlorophyll
Sunlight energy is absorbed by the
chlorophyll inside the chloroplast.
Light energy is used
to split water (H2O)
Oxygen
diffuses out of
the leaf
Energy is used to join
ADP + Pi
This forms
ATP
Hydrogen
is formed

Life on Earth National 5 Course Notes
11
Stage 2 – Carbon Fixation
Hydrogen and ATP produced by the light reaction is used with carbon dioxide to
produce glucose in an enzyme controlled process.
Factors affecting Photosynthesis
We might expect an increase in the following to have an increase in the rate of
photosynthesis:
Concentration (availability) of Carbon dioxide
Light intensity
Temperature
Aquatic plants such as elodea can be used to investigate these hypotheses either by
observing the rate of production of oxygen bubbles or by using colour changes in
bicarbonate indicator solution as measures of the rate of photosynthesis:
hydrogen
Carbon dioxide
ATP
Glucose
The glucose can be used for
respiration or converted into starch
or cellulose.
Carbon
fixation
stage

Life on Earth National 5 Course Notes
12
Limiting Factors Graph
The graph below shows the effect of increasing carbon dioxide concentration on the
rate of photosynthesis at different light intensities and temperatures.
The limiting factor at A, B and C on the graph above
Area of graph
being limited
Limiting factor Explanation
A Carbon dioxide
concentration.
As the concentration of carbon dioxide
increases to 1% the rate of photosynthesis
increases.
B Light intensity By comparing points B and C on the graph-
the only difference between these to
points is light intensity. Point B has a lower
light intensity therefore the rate of
photosynthesis is lower.
C temperature By comparing points C and D on the graph-
the only difference between these to
points is temperature. Point C has a lower
temperature therefore the rate of
photosynthesis is lower.
Apparatus to investigate the rate of Photosynthesis by production of Oxygen:
0.5
0.4
0.3
0.2
0.1
Rat
e of
phot
osyn
thes
is
(cm
3 C
O2 u
sed p
er m
inut
e)
0.5 1.0 1.5 2.0 2.5
Carbon dioxide concentration (%)
B
A
Light intensity 20 kilolux
Temperature 16oC
Light intensity 20 kilolux
Temperature 10oC
Light intensity 10 kilolux
Temperature 10oC
C
D

Life on Earth National 5 Course Notes
13
Action Adjusted variable
Move the lamp closer to the plant The light intensity increases
Substitute warmer water Temperature increases
Add Sodium bicarbonate Increases the concentration of dissolved
Carbon dioxide
The rich biodiversity of the rain forests is depleted by this human activity and when deforestation occurs on hillsides this can cause landslip which causes the loss of vegetation and increases the chance of flooding.
Aquatic plant
Oxygen

Life on Earth National 5 Course Notes
14
Subtopic 4: Energy in Ecosystems
In transfer of energy from 1 level of a food chain to the next. The majority of the energy is lost as heat, movement or undigested material. Only a very small quantity is used for growth and can then be passed on to the next level of the food chain.
Pyramids
A pyramid of numbers is used to represent the numbers of different organisms in a food chain. The wider the bar the greater the number of organisms.
Pyramid of numbers
Normally the bars get smaller going up the pyramid (remember energy is lost at each stage). However this is not always the case. For example suppose there is one big producer. Or small secondary consumers (e.g. oak tree, midge)
Image
BBC
BiteSize
Grass
rabbits
fox
Life on Earth National 5 Course Notes
15
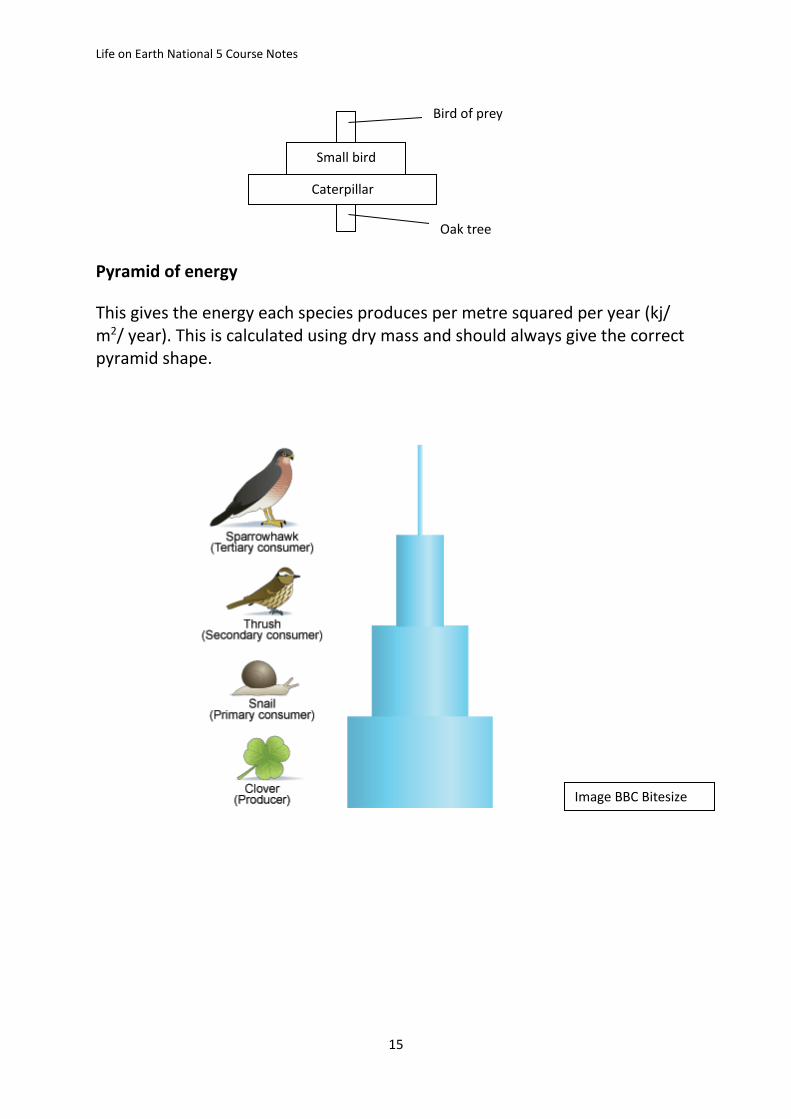
Pyramid of energy
This gives the energy each species produces per metre squared per year (kj/ m2/ year). This is calculated using dry mass and should always give the correct pyramid shape.
Small bird
Caterpillar
Oak tree
Bird of prey
Image BBC Bitesize

Life on Earth National 5 Course Notes
16
Subtopic5: Food Production
Human Population growth curve
An increasing population requires an increased food yield. This can involve the
use of fertiliser and pesticides. Fertilisers provide chemicals such as nitrates
which increase crop yield. Plants and animals which reduce crop yields can be
reduced by pesticides.
Fertilisers
Nitrates occur naturally in the soil but are removed by growing plants.
Fertilisers can be added to the soil to increase the nitrate content.
The nitrates in the fertiliser dissolves in water ad is absorbed into the plant.
These nitrates are used by the plant to produce amino acids which can be
synthesised into plant proteins. Animals can then consume these plants or
other animals to obtain amino acids for protein production.
Image BBC Bitesize

Life on Earth National 5 Course Notes
17
Problems with fertilisers
Leaching (washing out) of fertiliser into rivers and lochs adds extra unwanted
nitrates to the water. This a source of food for algae which rapidly increase in
population causing an algal bloom. Algal blooms reduce light levels, killing
aquatic plants. Both the dead plants and dead algae are a food source for
bacteria which rapidly increase in number. These bacteria use up oxygen
reducing its availability to other organisms e.g. fish, which will therefore
decrease in numbers.
Pesticides and Bioaccumulation
As pesticides are toxic and a predator will usually eat many pests the quantity
of pesticide in organisms tends to increase as they are passed along the food
Diagram BBC
Bitesize

Life on Earth National 5 Course Notes
18
chain. This has led to problems with animals at the top of a food chain e.g.
birds of prey have been found to produce soft shelled eggs. DDT was a
chemical used to spray crops in the 1970’s. It was found to have such harmful
effects that it is now banned in many countries although not all.
Alternatives to pesticides and fertilisers
Biological Control
Biological control is the use of one species to control numbers of another.
Myxomatosis
Used in 1950’s to control rabbit population (95% of Britain’s rabbits killed in
1955) this virus is still present in rabbit populations today.
Ladybirds
These can be bread in large numbers to feed on aphids which are a plant pest.
Genetically Modified (GM) crops
E.g. a gene that enables plants to be unaffected by a higher pesticide levels
could be inserted to the plant by genetic engineering. The plant could then be
sprayed with higher levels of pesticide eliminating the pests while growing
normally itself.
Image BBC bitesize
Combined pH,
moisture meter

Life on Earth National 5 Course Notes
19
Subtopic 6: Evolution of the Species
A mutation is a random change to genetic material.
Mutations may be disadvantageous, neutral or advantageous to
survival.
Mutations are spontaneous and are the only source of new alleles.
However, certain environmental factors increase the rate of mutations.
These include radiation and some chemicals e.g. mustard gas.
Disadvantageous
These mutations give rise to proteins that may not function normally.
e.g. haemophilia is a blood clotting disorder 33% of cases are caused by
spontaneous mutation other cases are inherited.
Neutral
These have neither an advantage or disadvantage to survival e.g. some
different DNA sequences code for the same amino acid if one is altered
other sequences can code for the same amino acid.
Advantageous
These mutations are rare but individuals who inherit them are more
likely to increase in numbers because they have an advantage over other
individuals to survival. E.g. a mutation to a protein that helps remove
cholesterol from arteries making it more effective.
New alleles (forms of a gene) produced by a mutation can result in
plants and animals becoming better adapted to their environment.
Variation within a population makes it possible for a population to
evolve over time in response to changing environmental conditions.
Some members of a species will be more suited to survive and
reproduce in the present environment or in a changed environment than
other members of its species.
Examples of adaptations
Kangaroo rat : - this desert mammal has several adaptations making it
suited to a very hot environment.
It produces large volumes of a hormone (ADH) causing
reabsorption of water from the kidneys.
Feeds at night staying in cool burrows during daytime.
Produces very dry faeces.
Has no sweat glands. Reduce water loss

Life on Earth National 5 Course Notes
20
Bee Orchid: - this plant has adapted to look like a female bee. This
attracts male bees for pollination.
Natural Selection and Speciation
Natural selection is often referred to as survival of the fittest.
In normal conditions a species will produce more offspring than the
environment can support. Variation will be present among the species and
some will be better suited to the environment than others. The best adapted
individuals in a population survive and pass on their favourable genes to their
offspring. E.g. If a rabbit has a gene (that has arisen through mutation) giving it
stronger leg muscles it is more likely to escape predators because it can run
faster than rabbits without the gene.
Speciation occurs after part of a population becomes isolated by an isolation
barrier which can be geographical, ecological or behavioural. E.g. a
geographical barrier could occur to a river changing course and isolating some
of the population.
Mutations occur within each sub-population and natural selection will select
different mutations in each sub-population due to the different selection
pressures that suit their environment. The sub-populations evolve into
genetically different species.
Galapagos Finches
Image BBC Bitesize
Charles Darwin’s drawings
of the different beaks
shapes found on finches in
the Galapagos islands
Beak for seed and nut
eating
Beak for insect
eating

Life on Earth National 5 Course Notes
21
Finches from the South American mainland colonised these islands. Natural
selection enabled finches with different variations to occupy separate
ecological niches. Beak shape is related to diet. This had not been possible on
the mainland as other species already occupied these niches.
Arctic Char
These are related to salmon and would have naturally migrated out to sea as
young fish. During the ice age populations of these fish were trapped in some
of Scotland’s freshwater lochs where they have evolved into a true freshwater
species.


