Project Number: JYP-0804
CAPE TOWN WATER AND SANITATION DESIGN
A Major Qualifying Project Proposal
submitted to the Faculty
of
WORCESTER POLYTECHNIC INSTITUTE
in partial fulfillment of the requirements for the
Degree of Bachelor of Science
By
_________________________
Michelle Carbonneau
_________________________
Margaret Elbag
_________________________
Joseph Krasinskas
Date: April 23, 2009
Approved:
______________________________________
Professor Jeanine Plummer, Major Advisor
______________________________________
Professor Scott Jiusto, Co-Advisor
1. Water
2. Sanitation
3. Monwabisi Park

ii
Abstract
Monwabisi Park is an informal settlement in Cape Town, South Africa. Poor water and
sanitation services in the area cause diarrheal diseases and negatively impact the quality of life.
A facility was designed to expand access to clean water and toilet services in Monwabisi Park
and also provide community interaction through public washing stations and gardening. The
facility conserves water through waterless toilets, rainwater collection and recycling. The design
is easily modified and can be replicated across Monwabisi Park.
iii
Acknowledgements
We would like to thank our advisors, Jeanine Plummer and Scott Jiusto for their continued
guidance and support throughout our project. We would also like to acknowledge Marcella
Granfone, Christopher Lizewski, and Dan Olecki for their hard work collecting the preliminary
water and sanitation data while in Monwabisi Park, Cape Town, South Africa. Special thanks is
also given to Dianne Womersley with the Shaster Foundation for her enthusiasm and help with
the design of our water and sanitation facility.
iv
Capstone Design Statement
The purpose of this Major Qualifying Project was to design a Water and Sanitation Facility to be
installed in Monwabisi Park, Cape Town, South Africa. Located on the urban fringe, Monwabisi
Park is an informal squatter camp with limited water and sanitation services. A preliminary
study conducted in the fall of 2008 recommended correcting the shortfall in water and sanitation
services through community facilities. This project designed such a facility.
An analysis of possible facility components, including types of toilets, water taps, and laundry
stations was completed. Each component was evaluated to ensure it improved current water and
sanitation services in Monwabisi Park, added to the likelihood of community acceptance of the
facility, and promoted social interaction within the community. In particular, each component
was assessed on water conservation, removal of standing water in the area, improvements to
public hygiene, and reduction of vandalism, theft, and facility misuse. Design of each
component also focused on sustainability, either through the production of useful byproducts like
compost or through minimizing water and energy consumption and maintenance costs. After
evaluation, components were selected for inclusion in the facility.
A 10 meter x 12 meter site was identified to house the water and sanitation facility. Facility
components were arranged to fit in the small space, while preserving a community-building
atmosphere. Water and wastewater loads were estimated through discussion with the local
community. A garden leaching field was designed to treat effluent and limit standing surface
water. The design is also easily replicable, for installation across the community. Possible
variations of the design were made to assist with implementation at other sites.
This project addressed the following ABET design considerations:
Economic
o Cost analyses provided for various toilet options and for entire facility
design.
Environmental
o Design minimizes unsafe discharge to the surrounding environment.
Ethical
o Design balances cost efficiency against individual user services.
Health and Safety
o Facility design strives to reduce disease transmission and provide a save
atmosphere for users.
Political
o Design satisfies basic service requirements as established in South African
national law.
Social
o Design responds to various social challenges, including crime, vandalism
and poverty.
Sustainability
o Design maximizes water and energy conservation and also includes
composting producing toilets.

v
Table of Contents
Abstract ........................................................................................................................................... ii
Acknowledgements ........................................................................................................................ iii
Capstone Design Statement ........................................................................................................... iv
Table of Contents ............................................................................................................................ v
List of Figures ............................................................................................................................... vii
List of Tables ............................................................................................................................... viii
1 Introduction ......................................................................................................................... 1
2 Background ......................................................................................................................... 3 2.1 South Africa ................................................................................................................... 3 2.2 Water and Sanitation Services ........................................................................................ 4
2.2.1 Basic Water and Sanitation Services ........................................................................ 5
2.3 Cape Town, South Africa ............................................................................................... 6 2.3.1 Growth ...................................................................................................................... 6
2.3.2 Weather .................................................................................................................... 7 2.3.3 Water Resources ....................................................................................................... 7 2.3.4 Water and Sanitation Services .................................................................................. 8
2.4 Informal Settlements .................................................................................................... 11 2.5 Khayelitsha ................................................................................................................... 12
2.5.1 Cultural Expectations ............................................................................................. 14 2.6 Monwabisi Park ............................................................................................................ 15
3 Current Conditions in Monwabisi Park ............................................................................ 18 3.1 Current Water Conditions ............................................................................................ 18
3.1.1 Water Use ............................................................................................................... 19
3.1.2 Conditions of Water Taps ....................................................................................... 20 3.2 Current Sanitation Conditions ...................................................................................... 22
3.2.1 Available Toilets .................................................................................................... 22 3.2.2 Pit Latrines and Black Buckets .............................................................................. 24
3.3 Standing Water ............................................................................................................. 25
3.3.1 Health Concerns ..................................................................................................... 25
3.4 Other Safety Concerns.................................................................................................. 26 3.5 Recommendations for Water and Sanitation Facility................................................... 27
3.5.1 Water Taps ............................................................................................................. 27
3.5.2 Public Sinks ............................................................................................................ 28 3.5.3 Public Laundry Station ........................................................................................... 29 3.5.4 Fire Hydrants .......................................................................................................... 30 3.5.5 Waterless Toilets .................................................................................................... 30 3.5.6 Site Layout ............................................................................................................. 30
3.5.7 Water Services Specialist ....................................................................................... 31 3.6 Summary of Current Conditions .................................................................................. 31
4 Water and Sanitation Facility: Evaluation of Components............................................... 33
4.1 Toilet Options ............................................................................................................... 33
vi
4.1.1 Enviro-Loo ............................................................................................................. 34 4.1.2 Hybrid Toilet .......................................................................................................... 36 4.1.3 Biolytix ................................................................................................................... 38
4.2 Evaluation ..................................................................................................................... 40
4.2.1 Operation and Maintenance .................................................................................... 41 4.2.2 Byproducts .............................................................................................................. 42 4.2.3 Energy Required ..................................................................................................... 42 4.2.4 Facility Size ............................................................................................................ 42 4.2.5 Facility Cost ........................................................................................................... 43
4.2.6 Case Studies ........................................................................................................... 43 4.3 Evaluation of Remaining Components......................................................................... 43
4.4 Water Usage ................................................................................................................. 49
5 Final Design ...................................................................................................................... 52 5.1 Indlovu Seed Build ....................................................................................................... 52
5.1.1 Design Constraints and Limitations ....................................................................... 53
5.1.2 Indlovu Center Facility Design .............................................................................. 53 5.1.3 Possible Variations to the Design ........................................................................... 56
5.2 Future Construction ...................................................................................................... 57
6 Recommendations ............................................................................................................. 59
Appendix A: Leaching Field Percolation Calculations ................................................................ 64
Appendix B: Facility Cost Analysis ............................................................................................. 65
vii
List of Figures
Figure 1: Map of South Africa (South African Map, 2008) ........................................................... 7 Figure 2: Cape Town Water Distribution as of 2001 (City of Cape Town, 2001) ......................... 9 Figure 3: Cape Town Sanitation Services Distribution as of 2001 (City of Cape Town, 2001) .. 10 Figure 4: Map of Cape Town and Khayelitsha (Berner et al., 2004) ........................................... 13 Figure 5: Percentage of Khayelitsha Residents with Water Piped to their Dwelling ................... 14
Figure 6: Percentage of People with Basic On-site Sanitation Services ....................................... 14 Figure 7: Division of Monwabisi Park Sections (Envisioning Endlovini, 2008) ......................... 16 Figure 8: Location and Condition of Water Taps in C Section (Granfone et al., 2008) .............. 19 Figure 9: Water Bucket Being Filled in C Section (Granfone et al., 2008) ................................. 20 Figure 10: Standing Water at a Water Tap in C Section (Granfone et al., 2008) ......................... 21
Figure 11: Conditions of Sanitation Systems (Granfone et al., 2008) ......................................... 23 Figure 12: Sanitation Services in C Section (Granfone et al., 2008) ............................................ 24
Figure 13: Proposed Water and Sanitation Facility (Granfone et al., 2008) ................................ 28 Figure 14: Proposed Water Tap Station (Granfone et al., 2008) .................................................. 29 Figure 15: Proposed Hand Washing Station (Granfone et al., 2008) ........................................... 29 Figure 16: Proposed Laundry Facility (Granfone et al., 2008)..................................................... 30
Figure 17: Proposed Site Layout (Granfone et al., 2008) ............................................................. 31 Figure 18: Water Flow through the Community........................................................................... 32
Figure 19: Temperature-Time Chart for Safe Water Pasteurization (Feachem et al., 1983) ........ 35 Figure 20: The Filter Process of the Biolytix System (Biolytix, 2009) ........................................ 39 Figure 21: The Biolytix Design (Biolytix, 2009).......................................................................... 40
Figure 22: Enviro Loo Toilets at an Informal Settlement (Clean up America, 2009) .................. 43 Figure 23: Water Flow under Maximum Capacity Conditions .................................................... 51
Figure 24: Water Flow under Projected Use Conditions .............................................................. 51 Figure 25: Indlovu Center Design................................................................................................. 54
Figure 26: Facility Variation ......................................................................................................... 56 Figure 27: Alternative Layout for Water and Sanitation Facility ................................................. 57
viii
List of Tables
Table 1: Apartheid and the People of South Africa circa 1978 (Stanford, 2008) ........................... 4 Table 2: Water Services Ladder (City of Cape Town, 2001) ......................................................... 5 Table 3: Sanitation Services Ladder (City of Cape Town, 2001) ................................................... 6 Table 4: Cape Town Dept. of Water and Sanitation Budget vs. Cost Requirements ................... 11 Table 5: Households in Informal Settlements in Cape Town without Water and Sanitation
Service (City of Cape Town, 2001) .............................................................................. 12 Table 6: Water Services in C Section (Granfone et al., 2008) ..................................................... 19 Table 7: Comparison of Basic and Current Services .................................................................... 31 Table 8: Comparison of Waste Water Treatment Systems (Perks, 2009) .................................... 37 Table 9: Toilet Evaluation Criteria ............................................................................................... 41
Table 10: List of Evaluation Considerations ................................................................................ 44 Table 11: Cost Analysis for Water and Sanitation Specialist ....................................................... 48
Table 12: Maximum Capacity Water Flow Rates ......................................................................... 49 Table 13: Projected Water Flow Rates ......................................................................................... 50 Table 14: Services Provided by Water and Sanitation Facility .................................................... 52
1
1 Introduction
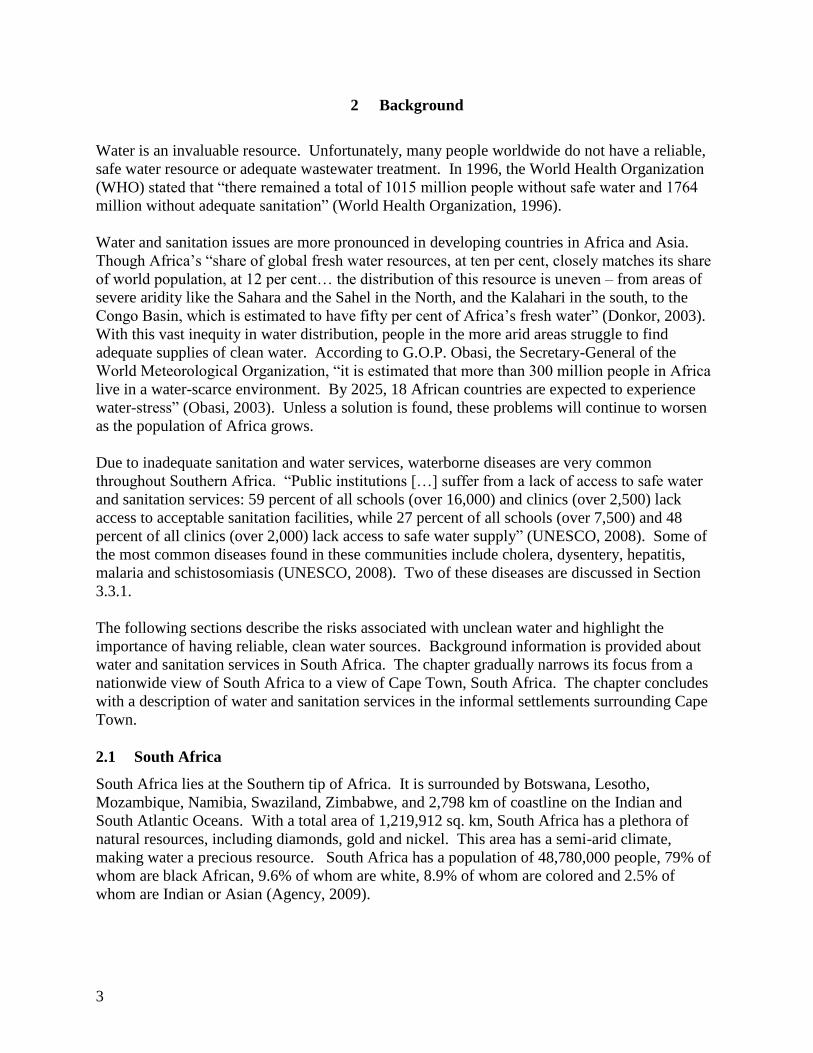
There are over one billion people worldwide without a safe water source. More people are
without adequate access to toilet facilities. A lack of adequate water and sanitation services is
particularly apparent in developing countries in Africa. Even near modern cities, like Cape
Town, South Africa, water provisions and sanitation services are in great demand. Though
progress has been made to remedy these problems, they still exist.
The goal of this Major Qualifying Project (MQP) was to design a water and sanitation facility to
expand access to clean water and sanitation services in Monwabisi Park, Cape Town, South
Africa. This MQP followed the work of an Interactive Qualify Project (IQP) team, which
conducted an in-depth investigation of water and sanitation services currently available in the
informal settlement. The IQP team found that there is an insufficient number of water taps and
toilets in this impoverished area, many of which are unusable due to vandalism and misuse.
Though the City of Cape Town is required by national law to provide one water tap for every
125 people, the actual ratio of working taps to people is 1:442. Similarly, the legal ratio of
toilets to families is 1:5, yet in Monwabisi Park it is 1:69 (Granfone et al., 2008).
Beyond quantifying the water and sanitation services in Monwabisi Park, the IQP team surveyed
community members to identify their current preferences and practices regarding water and
sanitation. The team also interviewed officials from the Cape Town Water and Sanitation
Department (CTWSD) and the Shaster Foundation, a non-profit organization formed to better the
community of Monwabisi Park, to gather their ideas to improve water and sanitation.
After considering the shortfalls in water and sanitation provisions in Monwabisi Park along with
the recommendations from the community and public officials, the IQP team proposed a
comprehensive plan to improve the water and sanitation services in order to promote a healthy
environment while embodying sustainability. The plan included a communal water and
sanitation facility, which would be replicable to other locations within the community.
Eventually, with enough of these communal water and sanitation facilities installed across
Monwabisi Park, the backlog in providing water and sanitation services will disappear.
The focus of this MQP was to formalize the design of the proposed water and sanitation facility.
Recommendations for success listed in the IQP report were strongly considered to ensure the
success of the facility. The design is intended for a site near the Indlovu Community Center in
Monwabisi Park. It includes water taps, toilets, and public laundry stations. Because of the
scarcity of water and the difficulty of removing wastewater, the site operates waterless toilets.
Other services requiring water drain to a community garden. The design is easily modified,
maintaining the intent to replicate this facility across Monwabisi Park. The facility will help the
community achieve basic levels of water and sanitation services. Implementation of this facility,
which will be supervised by another MQP team, is slated to begin in October 2009.
The following report details the process that led to the development of the design for the facility.
Chapter 2 provides background information about South Africa with a focus on the city of Cape
Town. This background section continues with Chapter 3, which focuses specifically on the
community of Monwabisi Park and the availability of water and sanitation services there.

2
Chapter 4 includes a review of the methods and evaluation techniques used to design the water
and sanitation facility, and Chapter 5 details that design. The report concludes with a list of
recommendations for the future. These recommendations are discussed in Chapter 6.
3
2 Background
Water is an invaluable resource. Unfortunately, many people worldwide do not have a reliable,
safe water resource or adequate wastewater treatment. In 1996, the World Health Organization
(WHO) stated that “there remained a total of 1015 million people without safe water and 1764
million without adequate sanitation” (World Health Organization, 1996).
Water and sanitation issues are more pronounced in developing countries in Africa and Asia.
Though Africa’s “share of global fresh water resources, at ten per cent, closely matches its share
of world population, at 12 per cent… the distribution of this resource is uneven – from areas of
severe aridity like the Sahara and the Sahel in the North, and the Kalahari in the south, to the
Congo Basin, which is estimated to have fifty per cent of Africa’s fresh water” (Donkor, 2003).
With this vast inequity in water distribution, people in the more arid areas struggle to find
adequate supplies of clean water. According to G.O.P. Obasi, the Secretary-General of the
World Meteorological Organization, “it is estimated that more than 300 million people in Africa
live in a water-scarce environment. By 2025, 18 African countries are expected to experience
water-stress” (Obasi, 2003). Unless a solution is found, these problems will continue to worsen
as the population of Africa grows.
Due to inadequate sanitation and water services, waterborne diseases are very common
throughout Southern Africa. “Public institutions […] suffer from a lack of access to safe water
and sanitation services: 59 percent of all schools (over 16,000) and clinics (over 2,500) lack
access to acceptable sanitation facilities, while 27 percent of all schools (over 7,500) and 48
percent of all clinics (over 2,000) lack access to safe water supply” (UNESCO, 2008). Some of
the most common diseases found in these communities include cholera, dysentery, hepatitis,
malaria and schistosomiasis (UNESCO, 2008). Two of these diseases are discussed in Section
3.3.1.
The following sections describe the risks associated with unclean water and highlight the
importance of having reliable, clean water sources. Background information is provided about
water and sanitation services in South Africa. The chapter gradually narrows its focus from a
nationwide view of South Africa to a view of Cape Town, South Africa. The chapter concludes
with a description of water and sanitation services in the informal settlements surrounding Cape
Town.
2.1 South Africa
South Africa lies at the Southern tip of Africa. It is surrounded by Botswana, Lesotho,
Mozambique, Namibia, Swaziland, Zimbabwe, and 2,798 km of coastline on the Indian and
South Atlantic Oceans. With a total area of 1,219,912 sq. km, South Africa has a plethora of
natural resources, including diamonds, gold and nickel. This area has a semi-arid climate,
making water a precious resource. South Africa has a population of 48,780,000 people, 79% of
whom are black African, 9.6% of whom are white, 8.9% of whom are colored and 2.5% of
whom are Indian or Asian (Agency, 2009).
4
Though once colonized by the British and the Dutch, South Africa gained independence in 1934
(About.com, 2008). Following independence, the National Party of South Africa passed several
laws with the intent of solidifying white supremacy and further segregating different races.
These laws included the classification of each person into three categories: white, black (African)
and coloured (mix of different races). “White-only” jobs were created. This time of segregation
is known as the Apartheid. Table 1 shows the unequal distribution of wealth, land, and other
services between races during the Apartheid around 1978 (Stanford, 2008).
Table 1: Apartheid and the People of South Africa circa 1978 (Stanford, 2008)
Statistic Blacks Whites
Population 19 Million 4.5 Million
Land Allocation 13% 87%
Share of National Income < 20 percent 75 percent
Ratio of Average Earnings 1 14
Minimum Taxable Income 360 rands 750 rands
Doctors/Population 1/44,000 1/400
Infant Mortality Rate 20% (urban)
40% (rural)
2.7%
Annual Expenditure on Education per Pupil $45 $696
Teacher: Pupil Ratio 1:60 1:22
During the Apartheid, blacks were also prohibited from living in cities across South Africa.
From 1960 to 1983, “the Apartheid government forcibly moved 3.5 million black South Africans
in one of the largest mass removals of people in modern history” (Wiley & Kornbluh, 2006).
The Apartheid continued until 1993, when it was abolished after many negotiations.
Subsequently, in 1994, the first multi-racial elections in South Africa took place, putting the
African National Congress in power for the first time since the beginning of the Apartheid.
Shortly after, the Reconstruction and Development Programme was implemented, which laid the
groundwork for improving living standards in South Africa. This was the newly-elected national
government’s first attempt at improving quality of life in South Africa, including water and
sanitation services.
2.2 Water and Sanitation Services
In 2001, the national government adopted a policy under the Reconstruction and Development
Programme in which basic water and sanitation services would be provided to all residents of
South Africa free of charge. Funding to provide these services is made possible through national
grants and revenue from local governments. One such grant the national government provides is
the Municipal Infrastructure Grant (MIG). The purpose of this grant is to improve the
infrastructure for poor households and ultimately reduce and eliminate the backlog of sanitation
improvements (City of Cape Town, 2008). Between the financial years of 2003/04 and 2008/09,
MIGs made up 60 percent of the total funds transferred directly from the national government to
local municipalities (Josie, 2008).
Another subsidy known as the Equitable Share transfers funds from the national government to
local governments to alleviate the costs of services to the poor (City of Cape Town, 2008). The
5
Equitable Share allocates funds according to the percentage of the population that cannot pay for
basic services. However, the Equitable Share is not sufficient to provide basic services for
everyone, and therefore municipalities must turn to cross-subsidization for further funding. In
some cases, this can leave the cities with an enormous deficit (Loots, 2004).
2.2.1 Basic Water and Sanitation Services
In 2003, the Department of Water Affairs and Forestry (DWAF) released the Strategic
Framework for Water Services, which implemented the concept of the water ladder. The first
step of the water ladder is to provide basic water services to everyone living in South Africa.
The next goal is to assist communities to an intermediate level of service, which would include a
tap in their yard. Ideally, communities would reach the highest level of service with indoor
plumbing and flushing toilets (City of Cape Town, 2008). The basic level of water service is
defined as at least 25 liters per person per day of potable water delivered to a tap or standpipe.
These need to be located within 200 meters of a household, with no more than 25 households
serviced by each tap. The water ladder is summarized in Table 2.
Table 2: Water Services Ladder (City of Cape Town, 2001)
Category Water Services Definition
Inadequate No access to basic water supply as defined below.
Basic a) the provision of appropriate education in respect of effective water use; and
b) a minimum quantity of potable water of 25 liters per person per day:
at a minimum flow rate of not less than 10 liters per minute
within 200 m of a household; and
with an effectiveness of not more than 7 days interruption of supply to
any consumer per year.
Intermediate Yard tap, Yard Tank
Full House Connection
Through the Water Service Act, the DWAF also guaranteed basic sanitation services. The
DWAF has delegated the task of providing these services to local municipalities. Therefore,
each city is responsible for providing free basic water and sanitation services to all of its citizens
through its water and sanitation department, including those living in informal settlements (City
of Cape Town, 2008). However, any services beyond the definition of basic services are still paid
for by the resident directly. Table 3 shows the DWAF interpretation of basic, intermediate and
full sanitation services. A basic level of sanitation is to provide one toilet for every five families
(City of Cape Town, 2008).
6
Table 3: Sanitation Services Ladder (City of Cape Town, 2001)
Category Sanitation Services Definition
Inadequate No access to basic sanitation as defined below.
Basic a) the provision of appropriate health and hygiene education; and
b) a toilet which is safe, reliable, environmentally sound, easy to keep clean,
provides privacy and protection against the weather, well ventilated, keeps
smells to a minimum and prevents the entry and exit of flies and other disease-
carrying pests. This service includes VIPs, Formal black bucket, Container
and Chemical Toilet usually provided as a communal service.
Intermediate Communal Toilet (Ablution Facilities)
Full On-site Waterborne, Septic Tank, or French Drain
The DWAF has delegated the task of providing these services to local municipalities. Therefore,
each city is responsible for providing free basic water and sanitation services to all of its citizens
through its water and sanitation department, including those living in informal settlements (City
of Cape Town, 2008). However, any services beyond the definition of basic services are still paid
for by the resident directly.
2.3 Cape Town, South Africa
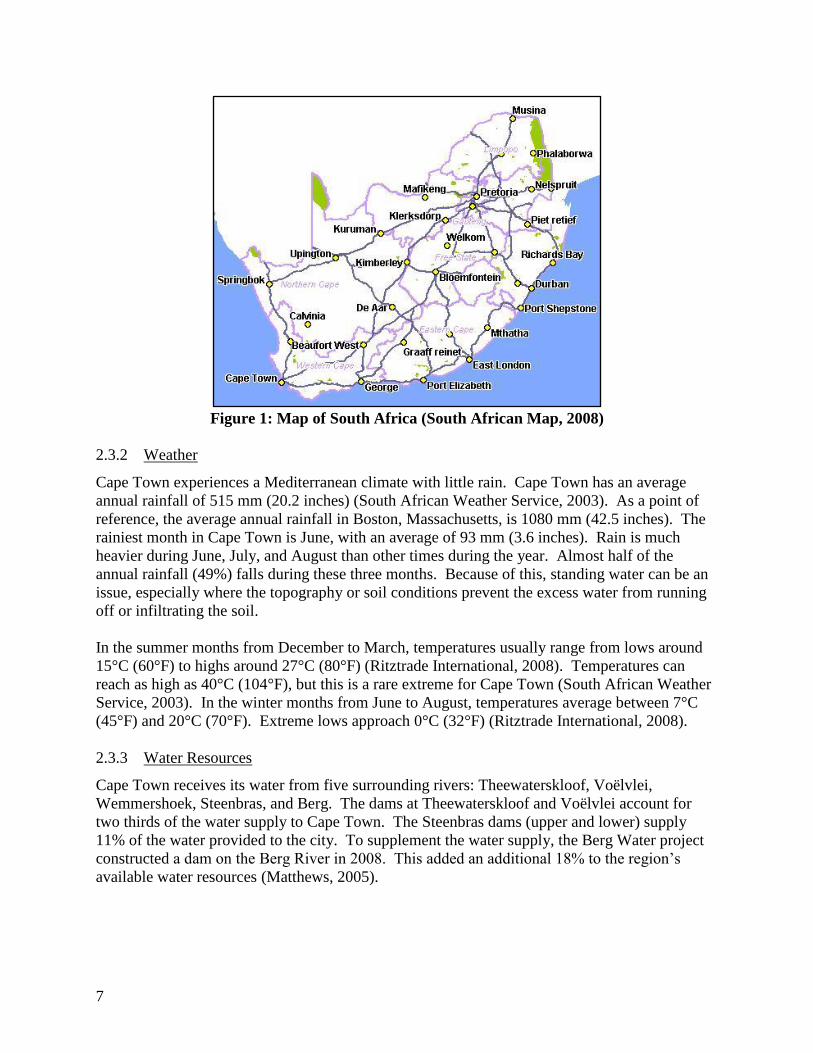
Cape Town lies on the southwestern most point of the African continent and is the capital of
South Africa’s Western Province. Figure 1 shows Cape Town’s location in South Africa. It is
the second largest city in South Africa with about 3.4 million people (City of Cape Town, 2008).
Cape Town has yet to completely overcome the effects of the Apartheid and struggles with high
poverty. In 2005, 38.8% of households were living below the poverty line (households earning
less than R1600 or $163 per month). The lack of financial resources currently available and
social challenges have prevented the city from overcoming significant issues with providing
basic water provisions and sanitation services.
2.3.1 Growth
Cape Town continues to grow, both economically and with regards to population. According to
the City of Cape Town (2001), “the economic growth rate [in Cape Town] was 2.6% during
1991-2000 compared to the national economic growth rate of 1.8% for the same period. Also, the
City of Cape Town contributed 11% to South Africa’s gross domestic product, which included
86 billion South African Rand (R86 billion or $8.7 billion) in goods and services produced in
2000” (City of Cape Town, 2001). Cape Town’s current growth rate is expected to decline from
1.6% to 0.6% by 2021. This decrease in growth is attributed to high death rates due to
HIV/AIDS. Cape Town’s population is expected to grow only by 300,000 people, or 0.09%, by
2021 (Morris, 2006).
7
Figure 1: Map of South Africa (South African Map, 2008)
2.3.2 Weather
Cape Town experiences a Mediterranean climate with little rain. Cape Town has an average
annual rainfall of 515 mm (20.2 inches) (South African Weather Service, 2003). As a point of
reference, the average annual rainfall in Boston, Massachusetts, is 1080 mm (42.5 inches). The
rainiest month in Cape Town is June, with an average of 93 mm (3.6 inches). Rain is much
heavier during June, July, and August than other times during the year. Almost half of the
annual rainfall (49%) falls during these three months. Because of this, standing water can be an
issue, especially where the topography or soil conditions prevent the excess water from running
off or infiltrating the soil.
In the summer months from December to March, temperatures usually range from lows around
15°C (60°F) to highs around 27°C (80°F) (Ritztrade International, 2008). Temperatures can
reach as high as 40°C (104°F), but this is a rare extreme for Cape Town (South African Weather
Service, 2003). In the winter months from June to August, temperatures average between 7°C
(45°F) and 20°C (70°F). Extreme lows approach 0°C (32°F) (Ritztrade International, 2008).
2.3.3 Water Resources
Cape Town receives its water from five surrounding rivers: Theewaterskloof, Voëlvlei,
Wemmershoek, Steenbras, and Berg. The dams at Theewaterskloof and Voëlvlei account for
two thirds of the water supply to Cape Town. The Steenbras dams (upper and lower) supply
11% of the water provided to the city. To supplement the water supply, the Berg Water project
constructed a dam on the Berg River in 2008. This added an additional 18% to the region’s
available water resources (Matthews, 2005).
8
2.3.4 Water and Sanitation Services
As adopted into the Constitution of Cape Town, South Africa in 1996, socio-economic rights that
were once denied were now guaranteed. These rights include access to clean water and basic
sanitation services. In Cape Town, while larger amounts of water are used for gardens (35%),
bathing (20%), flushing (29%), and dishwashing and laundry services (13%), only a small
percentage (3%) of water is used for drinking or cooling (Smith, 2008).
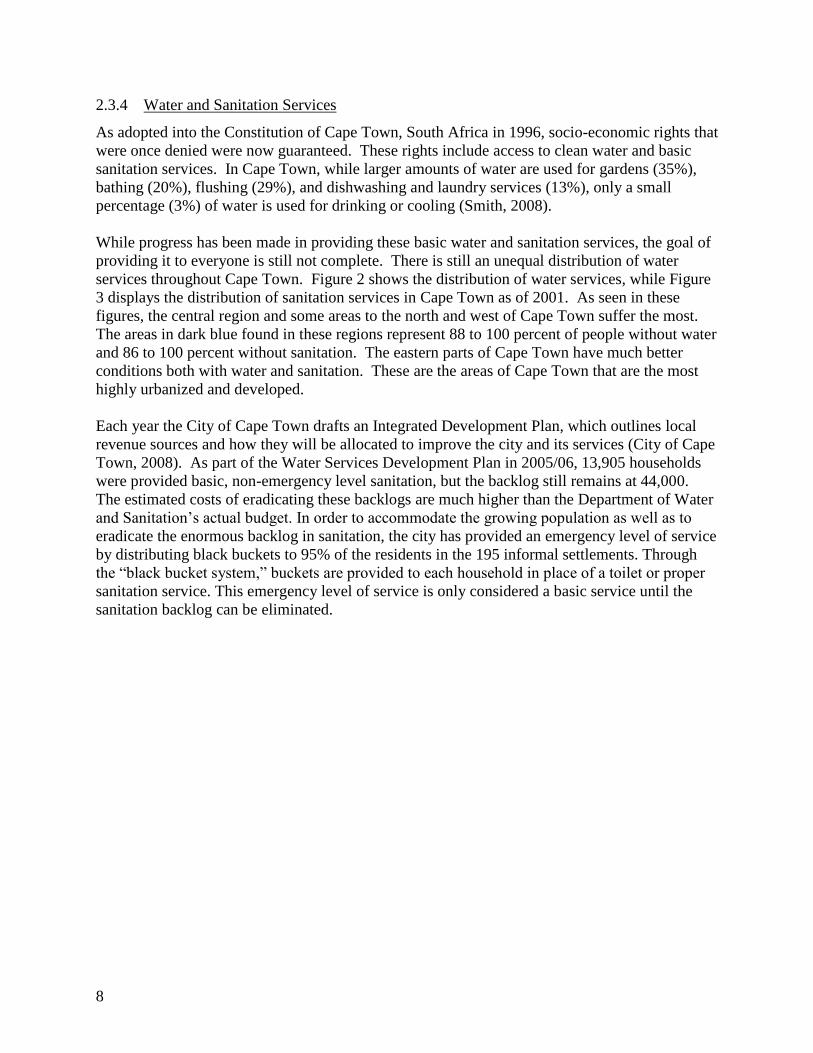
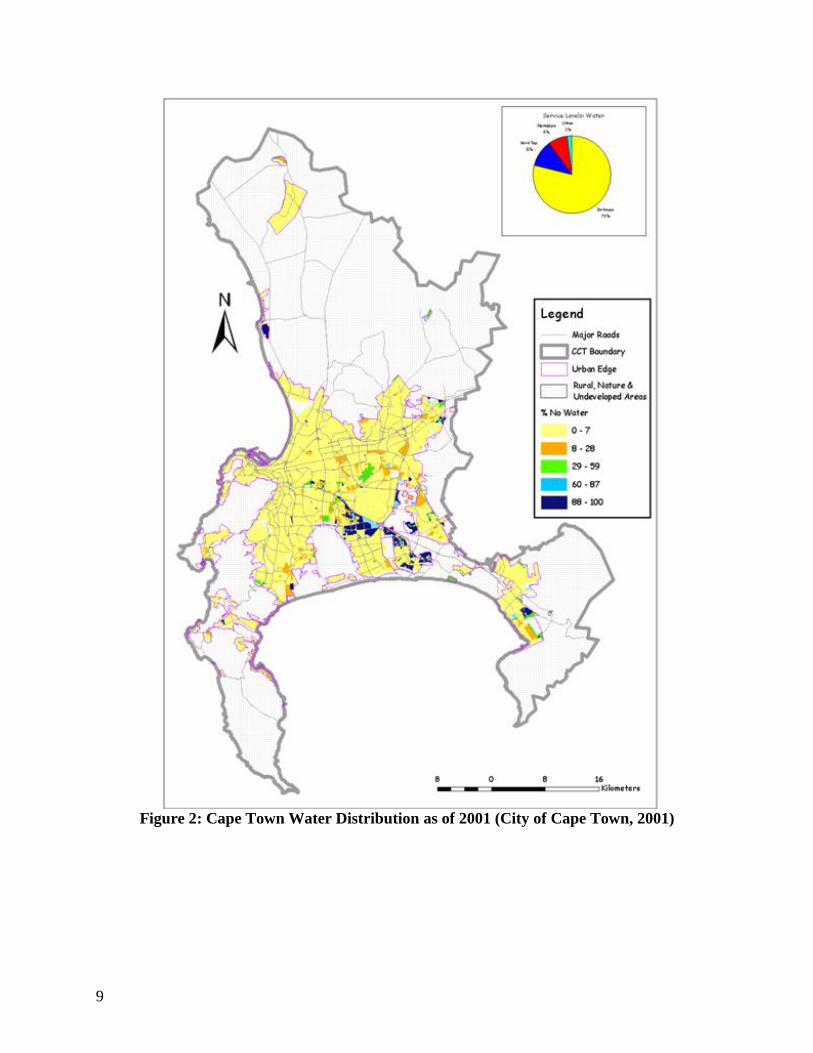
While progress has been made in providing these basic water and sanitation services, the goal of
providing it to everyone is still not complete. There is still an unequal distribution of water
services throughout Cape Town. Figure 2 shows the distribution of water services, while Figure
3 displays the distribution of sanitation services in Cape Town as of 2001. As seen in these
figures, the central region and some areas to the north and west of Cape Town suffer the most.
The areas in dark blue found in these regions represent 88 to 100 percent of people without water
and 86 to 100 percent without sanitation. The eastern parts of Cape Town have much better
conditions both with water and sanitation. These are the areas of Cape Town that are the most
highly urbanized and developed.
Each year the City of Cape Town drafts an Integrated Development Plan, which outlines local
revenue sources and how they will be allocated to improve the city and its services (City of Cape
Town, 2008). As part of the Water Services Development Plan in 2005/06, 13,905 households
were provided basic, non-emergency level sanitation, but the backlog still remains at 44,000.
The estimated costs of eradicating these backlogs are much higher than the Department of Water
and Sanitation’s actual budget. In order to accommodate the growing population as well as to
eradicate the enormous backlog in sanitation, the city has provided an emergency level of service
by distributing black buckets to 95% of the residents in the 195 informal settlements. Through
the “black bucket system,” buckets are provided to each household in place of a toilet or proper
sanitation service. This emergency level of service is only considered a basic service until the
sanitation backlog can be eliminated.
9
Figure 2: Cape Town Water Distribution as of 2001 (City of Cape Town, 2001)
10
Figure 3: Cape Town Sanitation Services Distribution as of 2001 (City of Cape Town, 2001)
In the 2006/07 financial year, R8 million was spent on installing toilets; however, as of 2008,
2,880 black buckets still needed to be replaced. The Water Services Development Plan indicates
that in the 2008/2009 financial year, R34.5 million will be needed to address the backlog in
sanitation, yet the budget for the Department of Water and Sanitation is only R18.1 million. It is
projected that in 2009/2010, the department’s budget will increase to R40.5 million and only

11
R38.9 million will be required for backlog. However, in the year 2010/2011 the budget will be
back down to R17.0 million and R45.7 million will be required for the sanitation backlog
(Amanzi Obom Consulting cc, 2008). These data are summarized in Table 4. The city projects
that it will eliminate all sanitation backlogs by the year 2012 (Amanzi Obom Consulting cc,
2008).
Table 4: Cape Town Dept. of Water and Sanitation Budget vs. Cost Requirements
(Amanzi Obom Consulting cc, 2008)
2008/09 2009/10 2010/11 2011/12
Actual Budget R18.1 mil R40.5 mil R17.0 mil
Requirements R34.5 mil R38.9 mil R45.7 mil R36.4 mil
2.4 Informal Settlements
During the Apartheid, segregation laws forced blacks and coloured persons from cities across
South Africa. Having no place to go, the displaced persons settled in the open spaces outside of
the cities. The scattered shacks in the rural areas outside of the cities developed into informal
townships.
These unplanned, informal settlements grew quickly without governmental support. After the
Apartheid ended there was still a lack of jobs, money, and opportunities available to the blacks
and coloured persons of Cape Town. As a result, the residents could not afford to move out and
populations of informal settlements continued to grow rapidly.
Due to the unplanned establishment of informal settlements, the areas were developed without
adequate infrastructure, including water and sanitation services. As mentioned above, the City of
Cape Town has tried to provide these services, but has come across many obstacles. For
instance, the lack of roads within the settlement prohibits the city from installing toilets in
densely populated areas. Additionally, the services that have been installed cannot be adequately
overseen, which allows for vandalism, theft, and misuse. Furthermore, the city does not possess
adequate funds to accommodate the growing population.
The Cape Metropolitan Area (CMA) is an organization consisting of seven areas in Southern
Africa, including Cape Town, with the goal of providing clean water to its consumers. It
specifically focuses on supplying water to those in the informal settlements. The CMA pumps
water into the cities from the five nearby rivers listed in Section 2.3.3. The water is then stored
and pumped through the city distribution system to the user. Of all water pumped to the cities,
only 30% is used. The remaining 70% of the water exits as runoff due to inadequate storage
(Smith, 2008).
Table 5 displays the percentages of those living in the informal settlements in Cape Town
without basic water and sanitation systems. In this table, households characterized under
“Council” ownership denotes those maintained by the Cape Metropolitan Council, a program
sponsored by local governments to resolve housing issues and build infrastructure (Cape
Metropolitan Council, 2001).

12
The Cape Metropolitan Area (CMA) is an organization consisting of seven areas in Southern
Africa, including Cape Town, with the goal of providing clean water to its consumers. It
specifically focuses on supplying water to those in the informal settlements. The CMA pumps
water into the cities from the five nearby rivers listed in Section 2.3.3. The water is then stored
and pumped through the city distribution system to the user. Of all water pumped to the cities,
only 30% is used. The remaining 70% of the water exits as runoff due to inadequate storage
(Smith, 2008).
Table 5: Households in Informal Settlements in Cape Town without Water and Sanitation
Service (City of Cape Town, 2001)
“Ownership” Households Without Water Without Sanitation
Private No. of households 10 500 1 600
% of informal households 11.4% 17%
% of total no. of households 1.7% 2.5%
“Council” No. of households 7 600 37 100
% of informal households 8.4% 41%
% of total no. of households 1.2% 6%
Total No. of households 18 100 53 100
% of informal households 20% 57.7%
% of total no. of households 2.9% 8.5%
There is a similar need for improved sanitation services in the informal settlements. An
employee of the South African Municipal Workers' Union, Anna Weekes, voiced her concern
about the inadequate level of sanitation: "We are still using the bucket system of toilets, which is
disgusting. Our children are always sick as a result” (Weekes, 2002). Many residents have
nowhere to properly dispose of the contents of their bucket and therefore empty them in the
streets where children play.
The City of Cape Town has made some progress in providing these basic sanitation and water
services to the people living in informal settlements, but the goal of providing it to everyone has
not been achieved to date. One such informal settlement in dire need of basic water and
sanitation services is Khayelitsha, which is discussed in the next section.
2.5 Khayelitsha
Khayelitsha is the third largest township in South Africa and the largest near Cape Town, with a
population between 500,000 and 1,000,000 residents. Many of the residents are illegally living
there, and thus the City of Cape Town has great difficulty assessing the exact population. As
shown in Figure 4, Khayelitsha (highlighted in orange) is located about 40 km southeast of
central Cape Town on the False Bay Coast.

13
Figure 4: Map of Cape Town and Khayelitsha (Berner et al., 2004)
The population of Khayelitsha is about 90% Black African and 10% Coloured (those with sub-
Saharan ancestry). The principal language used in the township is Xhosa. Khayelitsha, which
means “Our new home” in Xhosa, is a “formerly disadvantaged area that still struggles with
enormous social and economic problems” (Berner et al., 2004). In recent years, progress has
been made in providing services in Khayelitsha. The city of Cape Town provides water taps and
electricity to a portion of the community. However, poverty, unemployment, and gang activity
are widespread in Khayelitsha. The township accounts for “more than 50% of [Cape Town’s]
unemployment population” (BuaNews, 2004) even though only one-third of Cape Town’s
population resides there. Khayelitsha is “one of the most dangerous places in the country, with
the highest murder rate” in South Africa (BuaNews, 2004).
Most residents of Khayelitsha “live in corrugated iron shacks and […] are often unable to
acquire basic needs such as food and clothing. This condition is further exacerbated by
environmental factors such as the lack of proper toilet facilities” (Ndingaye, 2005). As the
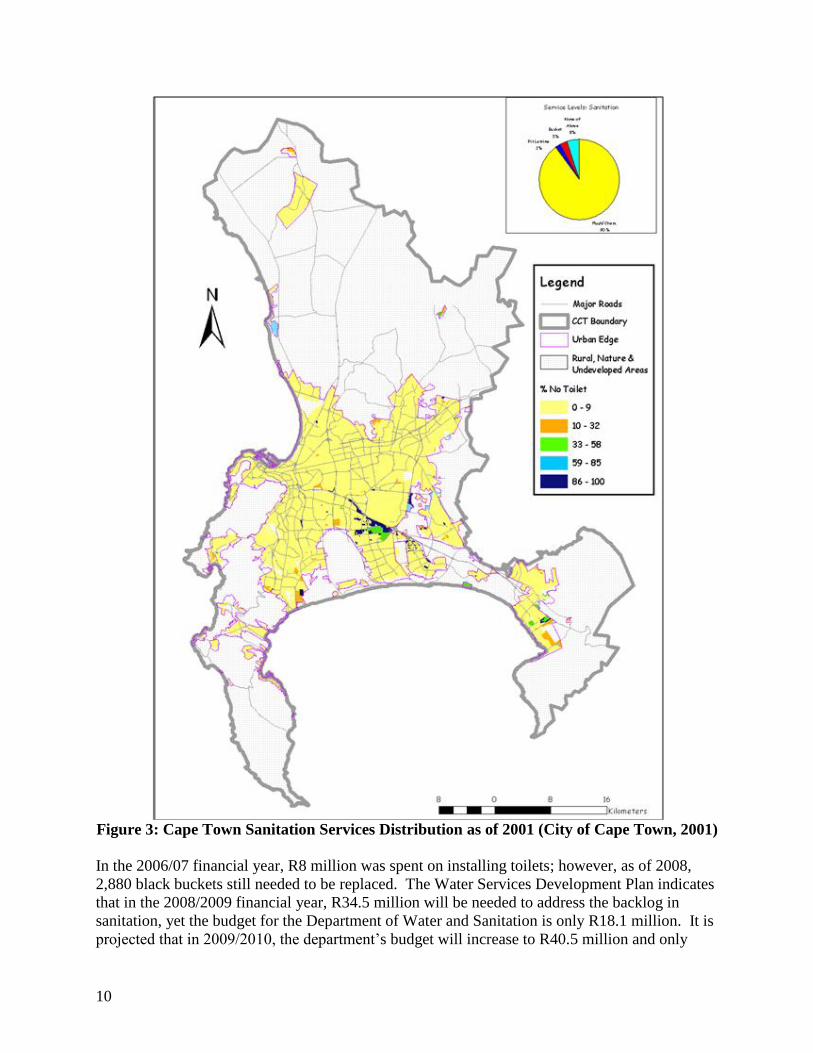
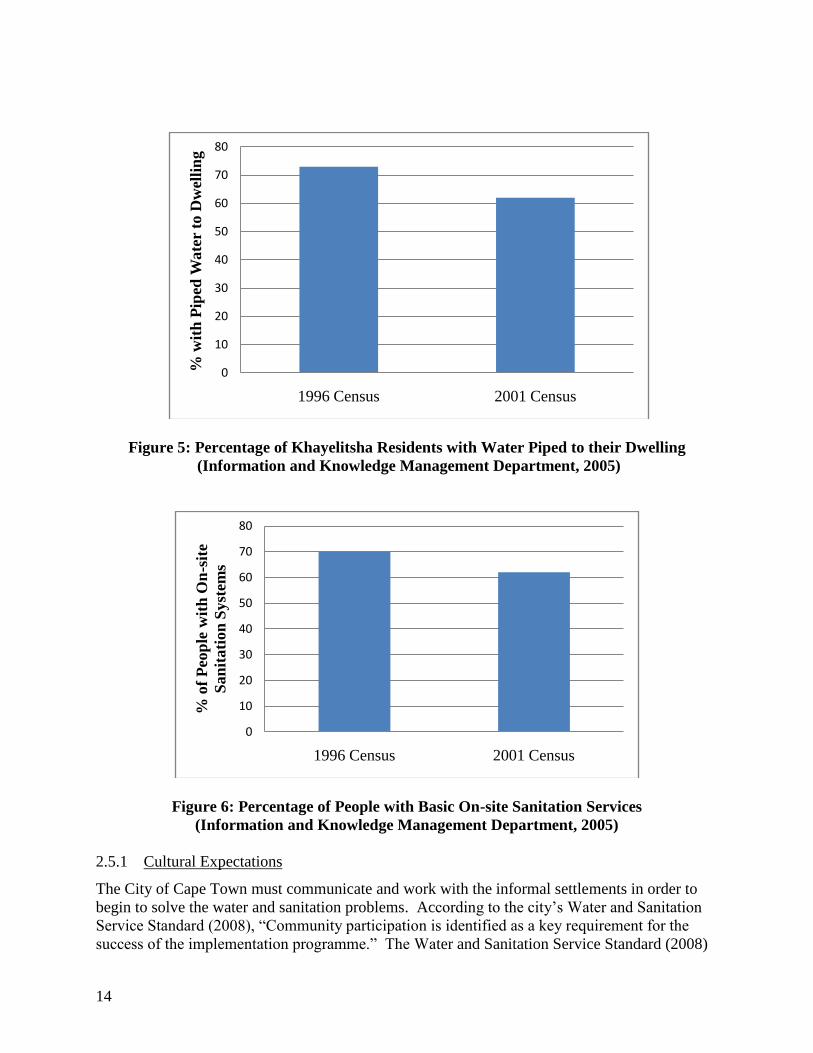
population of Khayelitsha has grown, the water and sanitation services provided to the
settlements have not increased. The percentage of Khayelitsha residents with water piped to
their dwelling or yard decreased from 73% in 1996 to 62% in 2001. Figure 5 shows the
percentage decrease in people who have water piped to their homes. Figure 6 shows the
percentage decrease in people who have basic on-site sanitation services (Information and
Knowledge Management Department, 2005).
14
Figure 5: Percentage of Khayelitsha Residents with Water Piped to their Dwelling
(Information and Knowledge Management Department, 2005)
Figure 6: Percentage of People with Basic On-site Sanitation Services
(Information and Knowledge Management Department, 2005)
2.5.1 Cultural Expectations
The City of Cape Town must communicate and work with the informal settlements in order to
begin to solve the water and sanitation problems. According to the city’s Water and Sanitation
Service Standard (2008), “Community participation is identified as a key requirement for the
success of the implementation programme.” The Water and Sanitation Service Standard (2008)
0
10
20
30
40
50
60
70
80
1996 Census 2001 Census
% w
ith
Pip
ed W
ate
r to
Dw
elli
ng
0
10
20
30
40
50
60
70
80
1996 Census 2001 Census
% o
f P
eop
le w
ith
On
-sit
e
San
itati
on
Syst
ems

15
further explains that projects in informal settlements will be more successful if they are installed
according to demand and then carried out by the community members themselves. Allowing the
community to build their own sanitation facilities not only provides jobs, but also a sense of
ownership. This sense of ownership and the ability to maintain the facility themselves will
result in a more successful solution because community members will be unable to rely on
outside contractors for maintenance due to the high costs (City of Cape Town, 2008).
According to an article written by an anonymous Khayelitsha resident, one major step forward
for informal settlements could be the transfer of ownership of the land to the community
members themselves (City Visiting Informal Settlements at Khayelitsha, 2008). As of 2008,
anyone living in an informal settlement is a squatter and is living there illegally. Transfer of
ownership would make them permanent residents, and they would no longer be prone to
relocation. Mzonke Poni (2008), another resident of Khayelitsha, explains that many of these
families have been here for decades and relocation upsets their livelihoods and creates even more
poverty. With ownership of the land, community members could have a reason to invest in their
own homes, thus improving their standard of living. Residents could make their own personal
property development choices rather than being subject to decisions made by city officials. The
community could also build their own houses providing even more jobs (Poni, 2008).
As stated above, the city recognizes that community participation is important, yet this has not
always been put into practice. Residents of informal settlements are now demanding to be heard.
On October 21, 2008, 300 residents from 10 informal settlements of Khayelitsha marched to
local municipality offices to deliver a memorandum to the City of Cape Town (Nkuna, 2008).
The first major point of the memorandum was that the city make decisions according to the
community’s needs. The second demand was recognition of people living in informal
settlements as legal residents. Thirdly, the residents demanded water, sanitation, and electrical
services. This march and memorandum was organized by Abahlali baseMjondolo of the Western
Cape, also known as the South African shackdwellers’ movement (Abahlali baseMjondolo of the
Western Cape, 2008).
2.6 Monwabisi Park
Within Khayelitsha, there are several informal villages “earmarked for development, like
Monwabisi Park” (Berner et al., 2004). Monwabisi is a two-kilometer long area of Khayelitsha
on the False Bay coast. The Monwabisi area “consists of the southern coastline with calcrete
cliffs and sandy areas of primary dunes […], a big part of it covered by low-bush vegetation”
(Berner et al., 2004). The low-bush vegetation is primarily Dune Fynbos, a tough, woody, bush
native to the Cape Town area.
Founded in 1997 on the Wolfgat Nature Reserve, this informal settlement is now the home for an
estimated 20,000 people, most of whom speak the language Xhosa. Of the 5,785 shacks in
Monwabisi Park, 73% of the shacks have heat, yet only 33% of the houses are accessible by
emergency vehicles. There was one community center for the entire area, the Indlovu Center,
which was constructed in 2007. The Indlovu Center provided the community with a daycare,
youth center, health clinic, soup kitchen, community hall and a school (Envisioning Endlovini,
2008). However, on November 30, 2008, a fire swept through Monwabisi Park, destroying the
community center, clinic, soup kitchen, laundry facility, travelers lodge and the crèche. Twenty-

16
five houses were also destroyed in the devastating fire. Although the fire caused significant
damage, the community has been working together to rebuild what was lost.
With an employment rate between 55% and 77%, Monwabisi Park is a particularly impoverished
area within Khayelitsha. There are four political sections in Monwabisi Park: A, B, C and M.
These sections are further divided into subsections. Figure 7 shows the different sections of
Monwabisi Park. There are 5785 shacks in Monwabisi Park, 510 of which are in C Section.
“Subsections A1, B1, C1 and M1 have direct access to electricity but have no toilet facilities.
Subsections M2, C2, B2, and A2 have no direct access to electricity, but are provided with toilet
facilities by the city” (Envisioning Endlovini, 2008).
Figure 7: Division of Monwabisi Park Sections (Envisioning Endlovini, 2008)
Since Monwabisi Park was established in 1997, the population has grown quickly. During a
period of growth from 1997 to 2003, people started to build further away from the main roads
and formed pathways to access their homes. The population has remained stable since 2003.
2.6.1.1 The Shaster Foundation
One group working for betterment of the Monwabisi Community is the Shaster Foundation. The
Shaster Foundation was established in 1993 by Dianne (Di) Womersley with a mission “To
create a holistic way for communities to work together for a better life and enable them to
support the most vulnerable members of society – orphans, […] revive a sense of pride in
traditional and indigenous culture amongst the precious youth of Africa, [… and] link this
cultural revival to economic development and much needed job creation” (Shaster Foundation,
2008). In their efforts, the Shaster Foundation strongly advocates for sustainability, through the
idea of permaculture. Permaculture, an idea unique to communities that rely on alternative
farming, can be defined as “a set of ethics that suggest [people] think and act responsibly in
relation to each other and the earth” (Green Building, 2007).
One of the Shaster Foundation’s projects was to develop plans for an “Eco-Cottage” to replace
the shacks that dominate Khayelitsha, especially in Monwabisi Park. Using sandbags and eco-

17
beams to form the walls, which are then covered in plaster, the eco-cottages “use no water except
for in the plasterwork; they are fireproof, bullet proof and very well insulated” (Shaster
Foundation, 2008). Other Shaster Foundation projects include water conservation efforts and
sustainable, alternative energy initiatives.
As detailed in this chapter, water and sanitation services are currently at an inadequate level in
Cape Town, South Africa. This problem is particularly pronounced in informal settlements
surrounding the city. Seeing an opportunity for improvement, a group of students traveled to
Monwabisi Park in October to December 2008 to quantify the problem. Their research is
described in Chapter 3.

18
3 Current Conditions in Monwabisi Park
A team of students and faculty members (Marcella Granfone, Christopher Lizewski, Dan Olecki,
Advisor Scott Jiusto, PhD, and Advisor Robert Hersh) from Worcester Polytechnic Institute
(WPI) traveled to Cape Town, South Africa from October to December 2008 and completed a
study of current water and sanitation services in the C Section of Monwabisi Park. The study
was part of an Interactive Qualifying Project (IQP), and was sponsored by the Shaster
Foundation and the City of Cape Town Water and Sanitation Department. Granfone et al.
(2008) used interviews and field observations to ascertain the severity of the water and sanitation
problems in Monwabisi Park. They took an inventory of the conditions of all water taps and
toilets in C Section and mapped their locations. The team also assessed the costs, benefits, and
problems associated with these services based on social, health, and cultural perspectives. They
then used various analytical methods to deduce the shortfall in services.
Once the level of water and sanitation services was determined, Granfone et al. (2008) worked to
develop a concept for a “replicable public water and sanitation system that upholds the principles
of permaculture and sustainability.” The team worked with City of Cape Town Water and
Sanitation Department (CTWSD) officials and the Shaster Foundation to gather information
regarding the community dynamic and previous efforts to alleviate the water and sanitation
problems in the city. They also interviewed representatives from the Sustainability Institute and
companies that manufacture toilet options that may be appropriate for Monwabisi Park.
Upon completion of the study, Granfone et al. (2008) published a report detailing their findings.
The report included recommendations for the development of a communal water and sanitation
facility for installation in Monwabisi Park. The following sections summarize the contents of the
report.
3.1 Current Water Conditions
Granfone et al. (2008) concluded that the people of Monwabisi Park suffer from poor water
service conditions. Not only are there an insufficient number of taps, but many of the taps are
not fully functional. The following section summarizes the current water conditions and how
these conditions are affecting the public health of the community.
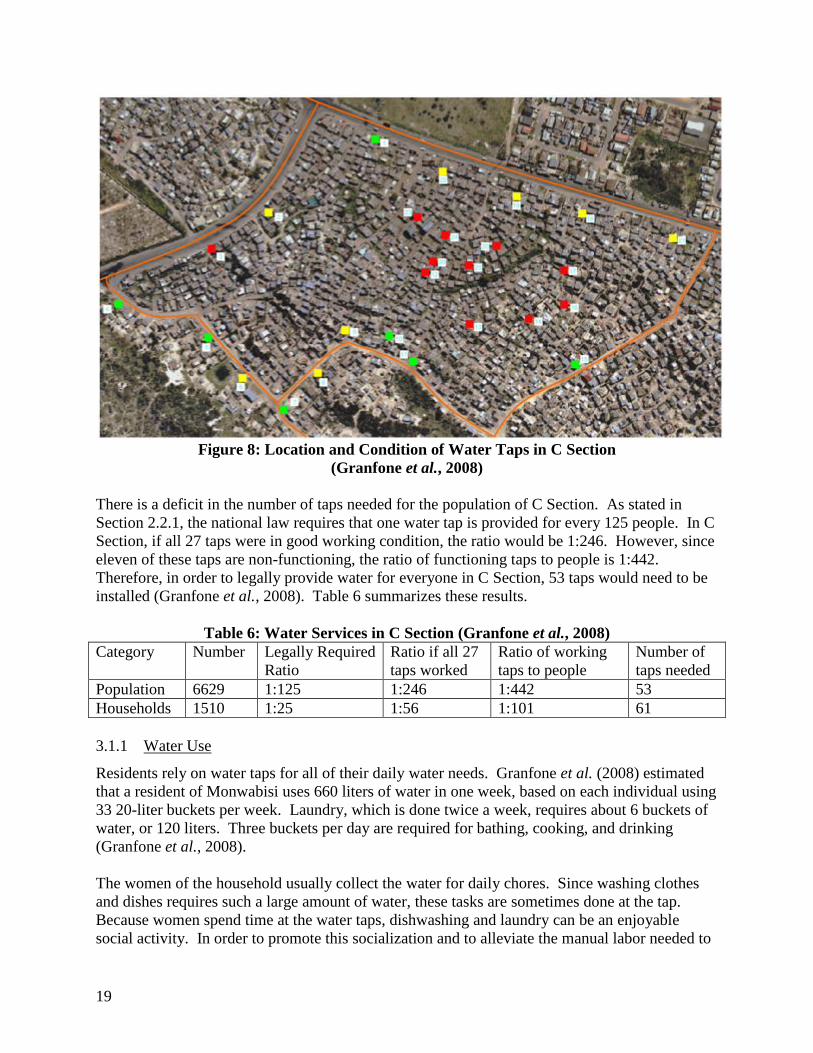
Currently in C Section there are 27 water taps, seven of which are fully functional and eleven
that are not functioning. The remaining nine taps possess problems such as missing handles and
nozzles, broken piping, and leaks. As shown in Figure 8, the taps in better condition (shown in
green) are located along the main roads surrounding C Section, whereas the taps in the center of
the settlement are in poor condition (shown in red). The taps along the road are in better
physical condition because of their close proximity to pour-flush toilets, which are more
frequently maintained by the city. The residents also assist in the maintenance of the taps
because without water their toilets do not function (Granfone et al., 2008).
19
Figure 8: Location and Condition of Water Taps in C Section
(Granfone et al., 2008)
There is a deficit in the number of taps needed for the population of C Section. As stated in
Section 2.2.1, the national law requires that one water tap is provided for every 125 people. In C
Section, if all 27 taps were in good working condition, the ratio would be 1:246. However, since
eleven of these taps are non-functioning, the ratio of functioning taps to people is 1:442.
Therefore, in order to legally provide water for everyone in C Section, 53 taps would need to be
installed (Granfone et al., 2008). Table 6 summarizes these results.
Table 6: Water Services in C Section (Granfone et al., 2008)
Category Number Legally Required
Ratio
Ratio if all 27
taps worked
Ratio of working
taps to people
Number of
taps needed
Population 6629 1:125 1:246 1:442 53
Households 1510 1:25 1:56 1:101 61
3.1.1 Water Use
Residents rely on water taps for all of their daily water needs. Granfone et al. (2008) estimated
that a resident of Monwabisi uses 660 liters of water in one week, based on each individual using
33 20-liter buckets per week. Laundry, which is done twice a week, requires about 6 buckets of
water, or 120 liters. Three buckets per day are required for bathing, cooking, and drinking
(Granfone et al., 2008).
The women of the household usually collect the water for daily chores. Since washing clothes
and dishes requires such a large amount of water, these tasks are sometimes done at the tap.
Because women spend time at the water taps, dishwashing and laundry can be an enjoyable
social activity. In order to promote this socialization and to alleviate the manual labor needed to
20
wash clothes, a laundry station was constructed by Alex et al. (2007) in 2007. The station
proved to be a safe gathering place for women of the community. The station was designed with
rainwater collection tanks and a drip irrigation system that watered the community garden. The
laundry station was a success, but unfortunately it was destroyed in a fire one year later.
3.1.2 Conditions of Water Taps
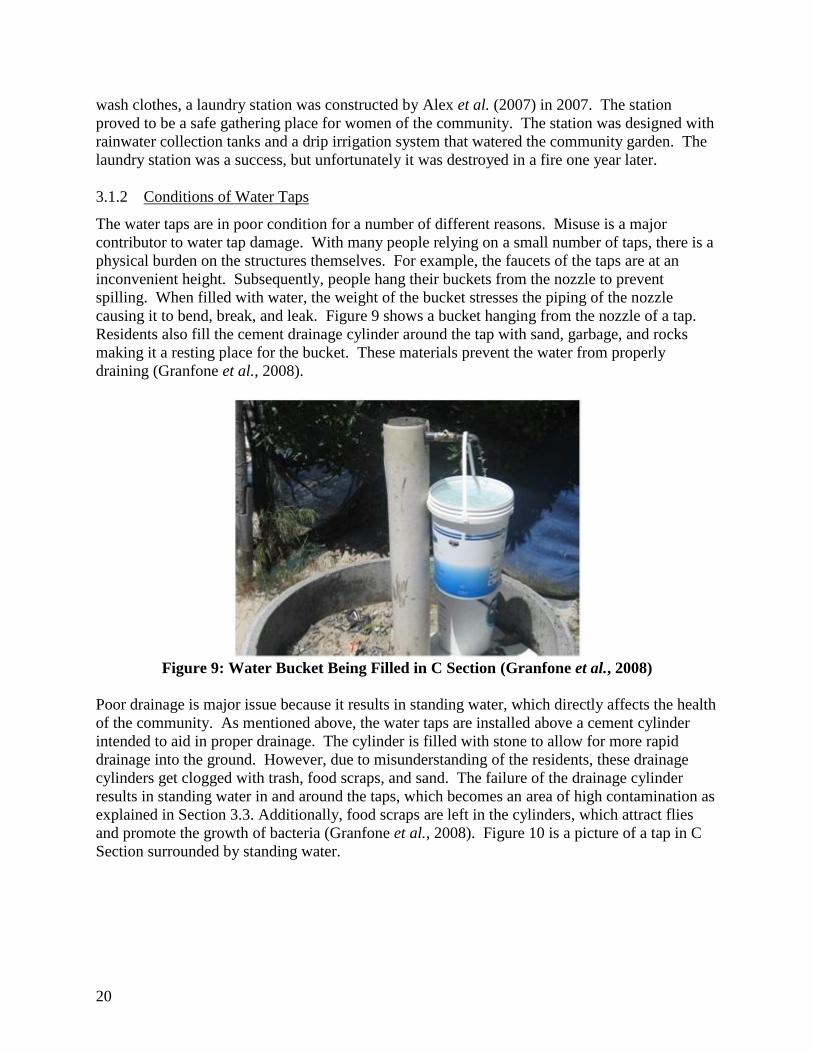
The water taps are in poor condition for a number of different reasons. Misuse is a major
contributor to water tap damage. With many people relying on a small number of taps, there is a
physical burden on the structures themselves. For example, the faucets of the taps are at an
inconvenient height. Subsequently, people hang their buckets from the nozzle to prevent
spilling. When filled with water, the weight of the bucket stresses the piping of the nozzle
causing it to bend, break, and leak. Figure 9 shows a bucket hanging from the nozzle of a tap.
Residents also fill the cement drainage cylinder around the tap with sand, garbage, and rocks
making it a resting place for the bucket. These materials prevent the water from properly
draining (Granfone et al., 2008).
Figure 9: Water Bucket Being Filled in C Section (Granfone et al., 2008)
Poor drainage is major issue because it results in standing water, which directly affects the health
of the community. As mentioned above, the water taps are installed above a cement cylinder
intended to aid in proper drainage. The cylinder is filled with stone to allow for more rapid
drainage into the ground. However, due to misunderstanding of the residents, these drainage
cylinders get clogged with trash, food scraps, and sand. The failure of the drainage cylinder
results in standing water in and around the taps, which becomes an area of high contamination as
explained in Section 3.3. Additionally, food scraps are left in the cylinders, which attract flies
and promote the growth of bacteria (Granfone et al., 2008). Figure 10 is a picture of a tap in C
Section surrounded by standing water.

21
Figure 10: Standing Water at a Water Tap in C Section (Granfone et al., 2008)
The City of Cape Town attempted to facilitate drainage by installing irrigation systems next to
the taps. However, these irrigation systems failed because fats and oils from dishwashing
clogged the irrigation pipes.
Residents have also made failed attempts to eliminate standing water in the drainage cylinders.
For example, residents have punctured holes in the drainage cylinders allowing water to drain
out of the bottom preventing it from pooling at the top. However, this caused the water to flow
into one area next to the cylinder, which also had poor drainage and caused erosion.
Additionally, the constant overflow wears away the surrounding landscape causing damage to
roads (Granfone et al., 2008).
Leaks also contribute to the standing water issue. Misuse, theft, and vandalism all result in
leaking water taps. These problems are easily noticed and corrected. However, leaks in the
pipes underground often go undetected and therefore do not get fixed. Finding and fixing
underground leaks is expensive and must be done by city workers or private contractors. These
underground leaks can decrease the pressure of the water pipes, and thus decrease the
effectiveness of the taps. Undetected underground leaks results in large amount of wasted water
(Granfone et al., 2008).
Another reason for poor tap conditions is theft and vandalism. It is easy for theft and vandalism
to occur because the taps are infrequently maintained or supervised. Residents turn to stealing
because of the harsh financial situation in Monwabisi Park. Components of the faucets or the
piping are broken off and stolen so that the metal can be resold. When this occurs, the taps no
longer function correctly resulting in leaks. Handles to turn the taps on and off are the most

22
commonly stolen component and residents must find other ways to open the nozzle, such as
pliers or homemade handles. When pipes are stolen the only way to prevent water from being
wasted is to shut the tap off completely. However, these situations are rarely reported to the city
officials and therefore the broken tap continues to waste water, which contributes to standing
water pools (Granfone et al., 2008).
Water use is not monitored in informal settlements and residents are not charged for their water
usage. Therefore, people are often careless and do not conserve water. There is no incentive for
people to reuse water or to use it in moderation. Often taps are left running constantly due to
damages or user carelessness (Granfone et al., 2008).
There are flow meters located near all of the taps in Monwabisi Park. However, these gauges are
rarely checked and the City of Cape Town is unaware of the amount of water used in the
informal settlements. The city has tried to reduce wasted water by installing pressure release
valves. When water demand is lower, less water is pumped through the distribution system.
This significantly decreases the water wasted due to underground leaks in the pipes (Granfone et
al., 2008).
3.2 Current Sanitation Conditions
The sanitation facilities in Monwabisi Park are inadequate for a safe and healthy community.
During the investigation of the IQP team, findings indicated that there were not enough toilets to
supply the community with what they need and desire. The problems are more pronounced in
Monwabisi Park than other areas in Cape Town. While 65.1% of households in Khayelitsha
have a flush or chemical toilet, more than 80% of households in Monwabisi Park do not have
access to toilets (Knowledge Management Department, 2005). The following sections
summarize the current sanitation conditions in Monwabisi Park as well as the problems
associated with them and how they are affecting public health.
3.2.1 Available Toilets
In C Section of Monwabisi Park, 92 pour-flush toilets were installed by the City of Cape Town
to help the community achieve a basic level of sanitation. There are ten clusters of toilets around
the perimeter of C Section. Each group of toilets is 400 meters apart and contains approximately
ten toilet stalls. Every cluster of ten toilets shares a communal septic tank, which needs to be
serviced every two months by the Cape Town Water and Sanitation Department (CTWSD).
Since the CTWSD trucks need to gain access to the toilets to remove the waste, the facilities are
located along community roads on the border of each Monwabisi section. At each site, water
taps are needed to flush the waste out of the toilets. The city installed one water tap at each
cluster of toilets. Of the ten taps, eight remain in working condition. Because pour-flush toilets
need water to flush, if the water taps are broken, the toilets become non-functional (Granfone et
al., 2008).
South African national law states that basic services require one toilet for every five families. To
ensure the 1:5 ratio (City of Cape Town, 2008), every toilet is secured with a locking door and
the city gives the keys to one toilet to five families. Ideally, these toilets result in healthier
sanitation practices. However, the City of Cape Town and the community do not have the
23
resources to properly maintain the facilities, resulting in the toilets falling into disrepair. Since
these toilets are located in public areas and not everyone was issued a private toilet, people may
break the locks to gain access to the facilities. When this occurs, the toilet effectively becomes a
public restroom. This usually results in the toilets being destroyed, either by vandalism, overuse
or misuse (Granfone et al., 2008).
Poor toilet conditions often stem from misuse. Most people in the community are unaware of the
proper practices for using the toilets. Since toilet paper is not readily available and expensive for
the community members, magazines or other paper products are used as a substitute for toilet
paper. This practice damages the system drains. Vandalism also contributes to the destruction
of the toilets in Monwabisi Park. Because parts from the toilets can have monetary value, they
may be stolen from the facilities and resold (Granfone et al., 2008).
Once there is a problem with a sanitation system, it could take weeks for a representative from
the city to fix the problem. While the community waits for the toilets to be maintained, citizens
must continue using the toilets. Using the broken toilets damages them further, possibly to an
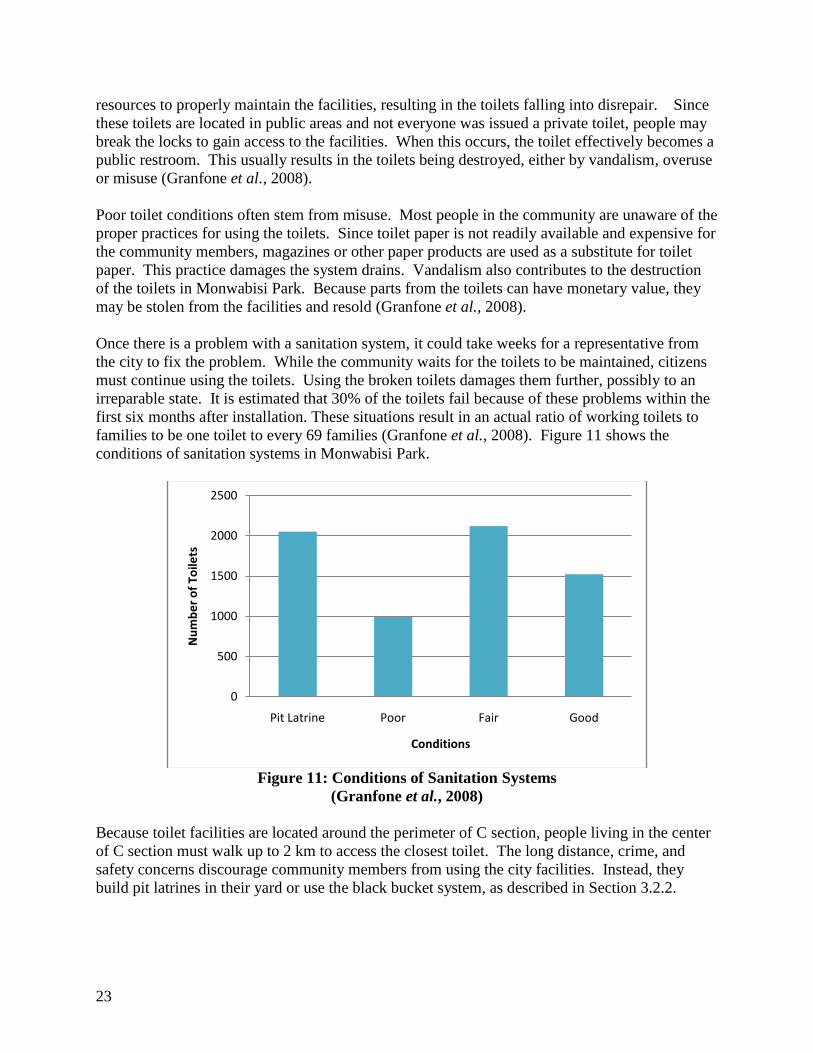
irreparable state. It is estimated that 30% of the toilets fail because of these problems within the
first six months after installation. These situations result in an actual ratio of working toilets to
families to be one toilet to every 69 families (Granfone et al., 2008). Figure 11 shows the
conditions of sanitation systems in Monwabisi Park.
Figure 11: Conditions of Sanitation Systems
(Granfone et al., 2008)
Because toilet facilities are located around the perimeter of C section, people living in the center
of C section must walk up to 2 km to access the closest toilet. The long distance, crime, and
safety concerns discourage community members from using the city facilities. Instead, they
build pit latrines in their yard or use the black bucket system, as described in Section 3.2.2.
0
500
1000
1500
2000
2500
Pit Latrine Poor Fair Good
Nu
mb
er
of
Toile
ts
Conditions
24
3.2.2 Pit Latrines and Black Buckets
Pit latrines are private, homemade sanitation systems. Families dig a two to three meter hole in
the ground and enclose the pit with a privacy structure. The families use this pit as a toilet
facility. Once the pit is filled to capacity, it is sealed with sand and then a new latrine is
constructed in a different area.
Safety concerns cause this type of sanitation system to be preferred by families living in the
center of Monwabisi Park away from roads with no close access to toilets. Those with latrines
take pride in their ownership of a private toilet. Families regularly maintain their latrines
indicating the desire in the community to have a private sanitation system for every family.
Although this is a preferred system for many people, these facilities cause many problems for the
community. These latrines can harbor disease. Because the pits are not lined, waste seeps into
the ground and can contaminate the ground water, especially when the water table is high.
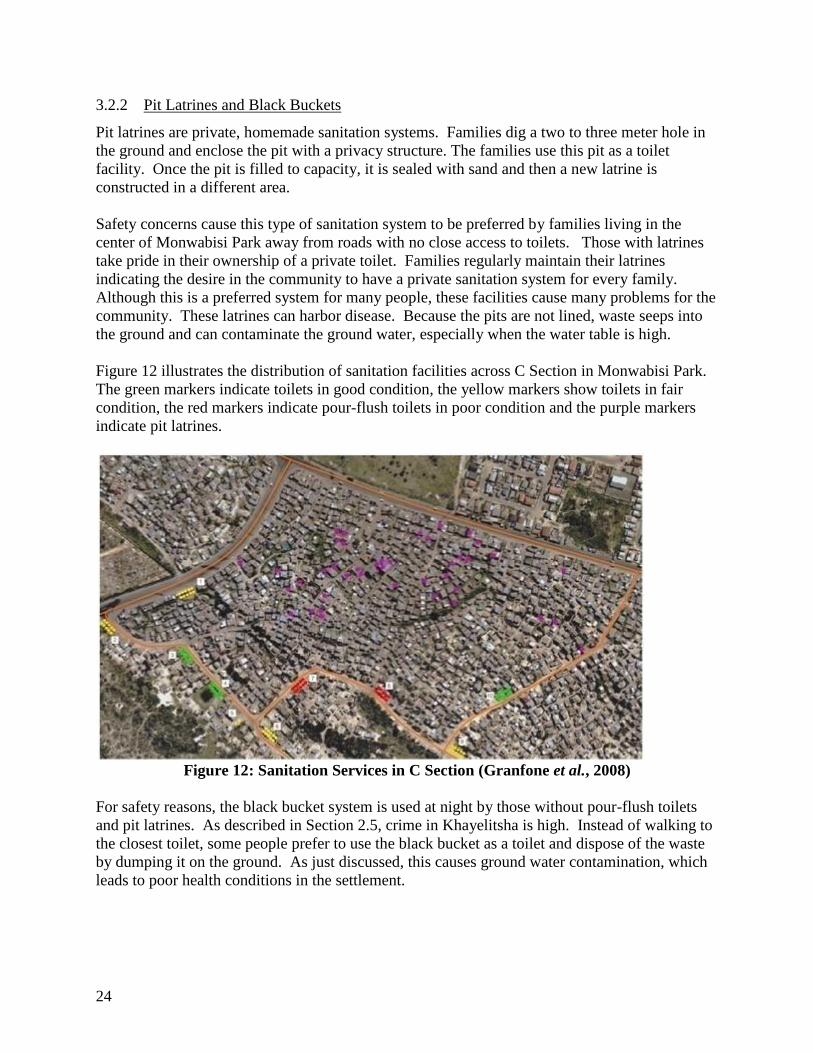
Figure 12 illustrates the distribution of sanitation facilities across C Section in Monwabisi Park.
The green markers indicate toilets in good condition, the yellow markers show toilets in fair
condition, the red markers indicate pour-flush toilets in poor condition and the purple markers
indicate pit latrines.
Figure 12: Sanitation Services in C Section (Granfone et al., 2008)
For safety reasons, the black bucket system is used at night by those without pour-flush toilets
and pit latrines. As described in Section 2.5, crime in Khayelitsha is high. Instead of walking to
the closest toilet, some people prefer to use the black bucket as a toilet and dispose of the waste
by dumping it on the ground. As just discussed, this causes ground water contamination, which
leads to poor health conditions in the settlement.
25
3.3 Standing Water
The Monwabisi Park Community needs a basic level of water and sanitation services to ensure a
healthy and safe lifestyle. Due to the lack of clean water and sanitation facilities within
Monwabisi Park, disease from standing water is widespread. The people deposit their waste or
excess water in the streets or neighboring yards, which causes pools of standing water to form.
These sources of wastewater can pollute the soil, groundwater, or surface water into which they
run (Granfone et al., 2008). The lack of properly working drains in the area also results in
wastewater collecting in the streets and standing for long periods of time. Untreated standing
water harbors the growth of microorganisms (Disaster Mitigation for Sustainable Livelihoods
Programme, 2006).
Young children are at risk for environmental health effects because they play in the water.
During the winter, the amount of standing water increases with the amount of rainfall. Also,
mosquitoes, which can carry malaria, use standing water to complete their life cycle. During
summer months the stagnant water heats up, attracting flies. Residents suffer from diarrhea,
cholera, and skin rashes as a result of the standing water in summer time. Informal settlements
are also extremely prone to flooding due to the landscape and lack of drains. Floods not only
add to the standing water, but also destroy homes (Disaster Mitigation for Sustainable
Livelihoods Programme, 2006).
3.3.1 Health Concerns
Many of the diseases that affect people in Monwabisi Park are waterborne and are due to poor
hygiene practices. Waterborne diseases are most common in areas which lack adequate water
and sanitation services. The Indlovu Center clinic in Monwabisi Park is a facility to help treat
diseases the community faces. Some of the more common diseases seen in this facility include
cholera, malaria, and other diarrhea-causing ailments. The next sections discuss the severity of
these diseases and how they affect the community of Monwabisi Park.
3.3.1.1 Hygiene
Educating the community about proper sanitation practices including hand washing and good
personal hygiene is important for a healthy environment in Monwabisi Park. Some people find
washing hands to be unnecessary, while others cannot afford soap due to their financial situation.
Health education for the community has been ineffective due to lack of resources. Proper
hygiene unawareness causes fecal-oral transmission of diseases to be very common in
Monwabisi Park. People in the community use unwashed buckets to gather water from the
standing pipes for daily household chores. In addition to using unsanitary buckets, the pipes are
surrounded by standing water, which is contaminated with fecal matter. The water from the
buckets is then carried home, the water is used and the diseases from fecal matter are ingested.
Due to this lack of hygiene, diarrhea is a common symptom that affects the community. Each
year in Khayelitsha, at least 80 children die from gastrointestinal diseases that cause diarrhea
(Granfone et al., 2008).
26
3.3.1.2 Waterborne Diseases
Cholera is a waterborne illness caused from the bacterium Vibrio cholera (WebMD, 2008). This
infectious disease is transmitted from the ingestion of unhygienic water, usually water containing
the feces of a person infected with the disease. Symptoms of cholera include diarrhea, leg
cramps, dehydration and vomiting. Due to the intensity of the symptoms, this illness can be
fatal if left untreated (Centers for Disease Control and Prevention, 2008).
Malaria is a mosquito-borne disease that is caused by the malaria parasite. Mosquitoes lay their
eggs in standing water, which serve as breeding sites. The eggs develop into larvae, pupae and
then grow into adulthood, a process which can take 9 – 12 days (Centers for Disease Control and
Prevention, 2008). Those mosquitoes infected with the parasite transmit the disease when they
bite their host. Because mosquitoes require stagnant water to complete their life cycle, the
presence of such water increases mosquito populations and consequently increases the risk of
malaria transmission. Symptoms of malaria include fever, sweats, and vomiting, and in severe
cases can lead to death (Centers for Disease Control and Prevention, 2008). In South Africa,
there were 77,854 malaria infections from 2000 to 2004, 875 of which were fatal (UNESCO,
2008).
3.4 Other Safety Concerns
As mentioned earlier, the laundry facility constructed by a team of WPI students was destroyed
in a fire. The station was located next to the Indlovu Center, which used to house a community
soup kitchen, pre-school, youth center, guest house, health clinic, and gardens. The fire, which
took place in November 2008, destroyed the entire Indlovu Center and 25 surrounding shacks.
Fires are not uncommon in Monwabisi Park. Many are started accidentally by paraffin stoves or
candles, but some are the result of political unrest.
The destruction of the Indlovu Center and surrounding homes could have been lessened if the
fire hydrants in Monwabisi Park were in better condition. Not only are there an insufficient
number of hydrants, but when fires do occur, firefighters have difficulty finding them. Similar to
the water taps, the markers used to locate hydrants are sometimes stolen and resold by
Monwabisi Park residents to support their financial situation. Additionally, the hydrants are
supplied water through plastic tubing. Because water taps are lacking, residents cut the plastic
tubing and divert it to their homes to aid their water needs. This decreases the available pressure
for fighting fires. When fires do occur, the low pressure water from the taps is not sufficient to
properly extinguish the fire. Also, as mentioned above, less water is pumped to the informal
settlements during the nighttime to reduce wasted water, lowering the water pressure in the
system. Since most fires are caused by heating and lighting sources used primarily at night, the
lower water pressure at these times is inadequate. In order to properly prevent fires in
Monwabisi Park, the community needs more hydrants with proper pressure and markings to
locate them.
In the areas surrounding the toilets and water taps, crime is not uncommon, especially where new
toilet or tap facilities have been implemented. The structures used for building the toilets can
have monetary value, which cause people to steal these materials and resell them. Also in these
areas, rape is common, especially at night. People who walk long distances from their dwelling

27
to the closet facility are targets for predators in these unlit and public toilet areas. Since the
facilities are not monitored, people are discouraged from using the facilities due to these reasons
and resort to the black bucket system or pit latrines.
3.5 Recommendations for Water and Sanitation Facility
To begin working toward a long-term water and sanitation solution, Granfone et al. (2008)
recommended the construction of a “centralized water and sanitation facility.” The facility
would redevelop the current water services and hygiene practices for residents near the Indlovu
Community Centre in Monwabisi Park. If successful, similar facilities would be installed across
the informal settlement with the goal of eventually providing basic (or better) water and
sanitation services to all residents of Monwabisi Park.
The report published by Granfone et al. (2008) listed key principles for ensuring the success of
such a facility: water conservation, public health benefits, positive byproducts, an ability to be
easily replicated, and awareness of safety, security, and accessibility concerns. The design they
proposed focuses around these five principles.
The facility would give the community access to basic water and sanitation features including
water taps, a laundry station, and toilets. It would also incorporate a hand washing station, a fire
hydrant, and a set of shower stations. The water and sanitation facility would have a residence
where a water and sanitation services specialist could live on-site. A plan view of the facility as
recommended by Granfone et al. (2008) can be seen in Figure 13. The following sections
describe the features of the facility in more depth.
3.5.1 Water Taps
Granfone et al. (2008) suggested the facility contain one water tap station with three individual
water taps. The water taps would be operated by foot pedals. Currently, taps are often left
running because people do not turn them off completely. A foot pedal would require a user to
apply pressure to activate the tap, preventing waste of water. If no users were present, the tap
would not run. The foot pedals would also reduce the transmission of disease because people
would no longer need to touch the taps with their hands. The water tap stations would also have
hooks or shelves so people could leave their buckets under the tap without having to hang them
on the taps themselves. This should increase tap life. A sample image of the water tap station is
shown in Figure 14.

28
Figure 13: Proposed Water and Sanitation Facility (Granfone et al., 2008)
3.5.2 Public Sinks
Public sinks would be part of the facility as well. Granfone et al. (2008) recommended the sinks
use water primarily from rainwater collection tanks. Although the rainwater collection tanks are
unlikely to supply sufficient water for full-time use, the strategy conserves water and reduces the
demand on the municipal water system. Public sinks should encourage hand washing, especially
if soap is provided. This would hopefully decrease the transmission of disease around the
facility. Walking paths would lead people past the sinks as they exit the facility to further
encourage hand washing. A sample hand washing station is shown in Figure 15.

29
Figure 14: Proposed Water Tap Station (Granfone et al., 2008)
Figure 15: Proposed Hand Washing Station (Granfone et al., 2008)
3.5.3 Public Laundry Station
Another feature of the proposed facility is a laundry station. The community previously had a
similar laundry facility, which was lost in a devastating fire. The laundry facility would include
six individual laundry stations and primarily use water from rainwater collection tanks. As with
the sinks, rainwater collection alone is insufficient to provide enough water for laundry year-
round, but the option would conserve water and lessen the amount that needs to be pumped into
the facility. Wastewater from the laundry station would be leached into a garden on the interior
of the facility. Figure 16 shows a sample laundry station within the proposed facility.

30
Figure 16: Proposed Laundry Facility (Granfone et al., 2008)
3.5.4 Fire Hydrants
Since fire is a common problem in Monwabisi Park, Granfone et al. (2008) also recommended a
fire hydrant be installed at the facility. The fire hydrant would be clearly marked or easily
visible so the fire brigade could find it without delay in the case of emergency. The fire hydrant
would be located in a public place as well to help deter vandalism.
3.5.5 Waterless Toilets
Perhaps the most important aspect of the water and sanitation facility would be the toilets. The
report recommended two options for toilets. The Hybrid Vault Toilet System was
recommended, but the Enviro Loo toilet system was listed as a viable alternative. These two
particular toilets are described in greater detail in Section 4.1. Both systems require no water for
flushing, making either a particularly good option where water is scarce. One option drains
wastewater to a leaching field while the other dehydrates waste, producing compost. The toilets
would be privately enclosed and locked. Each toilet would be shared by a few families. Each
family would have a key to unlock the door to their toilet. One or two public toilets would also
be on-site so passersby are less likely to break the locks off the private toilets. Furthermore, if
friends with toilets in different locations choose to wash clothes together, a public toilet would
allow the visitor to feel comfortable in the facility.
3.5.6 Site Layout
The proposed site layout by Granfone et al. (2008) is an L-shape as shown in Figure 17. The
layout accomplishes many goals. Firstly, the L-shape provides for an open, community
atmosphere that fosters community acceptance for good hygiene and sanitation. Inside the L-
shape, a garden for growing crops has been proposed. Benches would be available in the garden
area for people to rest while they wait to use the laundry station, water taps, or toilets. The L-
shape would face the community center, and be partially fenced in to encourage pedestrian flow

31
through one main entrance. Since all people must enter and exit the facility through one main
access point, it would be easier to identify everyone entering the facility, hopefully decreasing
vandalism. The site layout does not take space constraints for a particular site into account.
Figure 17: Proposed Site Layout (Granfone et al., 2008)
3.5.7 Water Services Specialist
The design proposed by Granfone et al. (2008) also includes a residence for a Water Services
Specialist to live on-site. This position would be filled by a trusted member of the community.
The Water Services Specialist would be responsible for maintaining the Water and Sanitation
Facility. He or she would clean the facility regularly, make any minor repairs, and educate
people on how to use the facility and the importance of proper hygiene. Also, since the Water
Services Specialist would almost always be on-site, he or she would serve as a crime deterrent
and help ensure the safety of the facility.
3.6 Summary of Current Conditions
It is clear from the study by Granfone et al. (2008) that water and sanitation services in C Section
of Monwabisi Park are far below the basic level prescribed by South African national law. Table
7 summarizes the current water and sanitation services in comparison to the definition of basic
services. Some people must walk more than 10 times the legally prescribed distance to reach a
water tap. Also, 69 families must share one toilet. This is far more than the legally required 5
family maximum.
Table 7: Comparison of Basic and Current Services
Services Basic Services Current Services
Water
1 tap / 125 people 1 tap / 442 people
25 liters / day 120 liters / day
Within 200 meters Within 2000 meters
Sanitation 1 toilet / 5 families 1 toilet / 69 families
To correct the water services shortfall across C Section, a minimum of 53 water taps is required.
There are currently only 27 taps installed, 15 of which are functional. Thus, 38 more functional
taps are needed to provide basic services. Similarly, there is a large shortage of toilets. A

32
minimum of 266 toilets is required to provide basic services, but there are only 92 toilets
installed. Therefore, about 175 more toilets are required to reach basic services.
Figure 18 displays the flow of water from the city distribution system to the home of a
Monwabisi Park resident. In this figure, the black boxes represent water that has been used and
contaminated. As shown by Figure 18, almost all of the water used by Monwabisi Park residents
is wasted after it is used. This dirty water is disposed of in the streets and yards of residents,
contributing to the high amounts of standing water that pose potential health risks. Current water
use practices provide no means for used water to either be treated or reused.
Figure 18: Water Flow through the Community
In conclusion, to improve current conditions in Monwabisi Park, not only must services be
increased, but water treatment and reuse must also be implemented. Over time, these improved
practices will conserve water and reduce standing water in the community.
Water collected from 5 Rivers at Dams/Reservoirs enters the Cape Town Water Distribution System
Pumped to 27 Taps (15 functional)
taps:person =1:245 (1:442)
20-L Buckets to be carried back to residences
Cooking and Dishwashing
Water wasted
Bathing
Water wasted
Laundry
Water wasted
Drinking
Water wasted
Water wasted
Waste pumped into a truck and transported elsewhere every two months.
Dishwashing and Laundry done at tap
Water wasted
Leaking Taps
Water wasted
33
4 Water and Sanitation Facility: Evaluation of Components
The focus of this Major Qualifying Project was to design an easily replicable water and
sanitation facility for the C Section of Monwabisi Park. Targeting the problem of water and
sanitation services at the local level, the facility should promote a healthy community and
environment, embody the ideas of sustainability, and, most importantly, help satisfy the needs of
the residents in that part of the community. The facility will not only include toilets and water
taps, but showers, laundry and hand washing stations to further promote hygiene. If multiple
facilities are installed across C Section, these local solutions should advance the level of water
and sanitation services community-wide.
This chapter describes the methods used to analyze each component of the facility. Though each
component was evaluated based on similar criteria and with similar goals, the toilet evaluation
was done separately, through a direct comparison of the options available. Section 4.1 provides
an in depth description of how each toilet treats the waste. The evaluation in which the final
toilet option was chosen is explained in Section 4.2. Section 4.3 contains the evaluations for
each of the other components found in the facility. These components were evaluated based on
their benefits to the community, public health, and water conservation.
4.1 Toilet Options
One of the most important characteristics for the design of the water and sanitation facility was
the type of treatment process employed to manage human waste. For that reason, many different
types of toilets were considered. They include bio-digesting toilets, composting toilets, full flush
toilets, the Afrisan Toilet system, the Biolytix Toilet system, the Hybrid Vault Toilet system, and
the Enviro Loo toilet system. After initial consideration, several of these toilet options were
ruled out because they were unsuitable to meet the needs of the community.
Bio-digesting toilets are designed to maximize methane capture from decomposing waste. Once
the methane is captured, it can be burned as an energy source for cooking or heating water.
Unfortunately, without the addition of animal wastes in addition to the human wastes in the bio-
digester, insufficient methane is produced to make the bio-digesting toilet an economically
feasible option. In addition, the concentrated methane would be an additional fire hazard in a
community that has struggled with fire damage in the recent past. The insufficient methane
production and possible safety hazards precluded the use of bio-digesting toilets in the water and
sanitation facility.
Composting toilets treat waste through bacterial digestion. After digestion is complete, a
nutrient-rich compost remains, which can be added to gardens to nourish crops. Composting
toilets, however, require significant regular maintenance. After several uses, the vault below the
toilet fills with compost and undigested human waste. This compost must be frequently
removed, or the vault will overflow. Other nutrient-rich additives, such as food scraps, must be
added on a daily basis to ensure proper composting. Because of the high level of required
maintenance, the composting toilet was deemed an unsuitable option.
Afrisan toilets are waterless, dry composting toilets. Urine is diverted into a vault separate from
solid waste. The urine is evaporated while the solid wastes are composted. The compost can be
34
added to gardens to nourish crops. Like traditional composting toilets, Afrisan toilets require
significant regular maintenance and additives such as peat moss to ensure proper composting.
The Afrisan also has a low user capacity (one family per toilet). The considerable regular
maintenance and minimal capacity make the Afrisan toilet an undesirable option for a
community water and sanitation facility.
Full flush toilets use water to flush human waste away from the toilet to a community wastewater
treatment plant. Flush toilets require significant water resources to operate. In addition, the
wastewater must flow by gravity or be pumped to a municipal treatment plant. As mentioned
above, water resources are limited in Monwabisi Park. Monwabisi Park is also in a low-lying
area, so gravity flow to a treatment plant is not feasible. The wastewater would need to be
pumped, requiring a significant and reliable source of electricity to operate the pumps.
Furthermore, flush toilets require a sewer network to divert wastewater to a treatment plant. No
such infrastructure currently exists in Monwabisi Park, and installation of a sewer network would
be prohibitively expensive. Because of this, full flush toilets were not considered for the design
of the water and sanitation facility.
After eliminating these toilet options, three choices remained to investigate further: the Enviro
Loo toilet system, the Hybrid Toilet System, and the Biolytix toilet system. These three options
mirrored the recommendations of Granfone et al. (2008). They recommended the Hybrid Toilet
system and the Enviro Loo toilet system. Granfone et al. (2008) also suggested the Biolytix
toilet system could be a cost-effective option in the future, but did not include the system in their
final recommendations. These three toilet systems are discussed and compared in the following
sections.
4.1.1 Enviro-Loo
The Enviro-Loo is a dry human sanitation system designed to treat waste in areas where water is
scarce. Developed by Dr. Brian E. La Trobe in South Africa in the early 1990s, the Enviro-Loo
has won several awards for its innovation and environmental awareness. Since 1993, 25,000
Enviro-Loos have been installed worldwide (Clean Up America, 2009). Unlike “conventional”
water-based sanitation systems, the Enviro-Loo requires no water, making it a practical option
for remote areas not connected to a municipal water source or lowland areas where pumping
wastewater away is expensive.
The Enviro-Loo treats waste primarily through dehydration and low-temperature pasteurization.
When urine and feces enter the toilet, they are separated by gravity. Solids fall onto a flapper,
which casts solid wastes onto a drying plate. The liquid runs off the tray to the bottom of a 250-
gallon vault. An external, wind-powered fan draws air through the vault, accelerating the drying
of the solids and the evaporation of the liquid in the bottom of the vault. The vault is typically
installed on the sunny side of the structure. The vault is painted black and faces the sun to
maximize the capture of solar energy and increase the temperature in the vault. If the
temperature in the vault is greater, the evaporation process is accelerated. Over time, the liquid
portion evaporates, and the solid portion dries until it is less than 10% of its original volume.
The increased temperature in the vault from solar energy also serves to pasteurize bacteria and
other organisms present in human waste. Pasteurization is the process of sterilizing a liquid by

35
raising its temperature for a length of time. If temperatures are higher, the necessary time for
sterilization is shorter. If the temperature is lower, the pasteurization process can still occur;
however, a longer time is necessary. Figure 19 shows pasteurization effectiveness as a function
of temperature and time. At temperatures over 65° Celsius, pasteurization can be achieved in
less than one hour. Pasteurization is still effective at temperatures around 45° Celsius provided a
one week sterilization time is provided.
Figure 19: Temperature-Time Chart for Safe Water Pasteurization (Feachem et al., 1983)
There are many benefits of using the Enviro-Loo system. Because the system is waterless, it can
be installed virtually anywhere and is independent of municipal water sources and wastewater
treatment. The system significantly reduces the volume of waste, and thus the vault only needs
to be emptied once every six months to three years, assuming twenty users per day. This

36
minimizes the cost associated with managing the solids. Following evaporation, these solids can
be added to a compost pile for three weeks to further digest. After digestion, these solids can be
bagged and sold as compost. Routine maintenance only involves raking or scraping the drying
plate, so minimal technical skill is required for regular operation. No maintenance trucks or
other heavy equipment are required for scheduled maintenance.
There are few moving parts to this system, so it is unlikely to need repair. If installed outside,
the system operates without electricity because the fan, which draws air through the vault, is
completely wind-powered. The vault is made from polyethylene, a relatively inexpensive yet
durable material. Because of the durability of the materials used, a lifetime of greater than 20
years can be expected. Additionally, odors are minimal due to one-directional air flow through
the system and evaporation. The Enviro Loo is a low-cost sanitation alternative, with a cost of
R5300 ($550).
Some drawbacks to the Enviro-Loo system may preclude its use in certain situations. For
example, maintenance is required for proper operation. Every six months to three years, the
remains on the drying plate need to be scraped or raked into a storage bag. This bag must then
be removed every two or three years. The Enviro-Loo requires sunlight and wind to dehydrate
waste most effectively, so it should be installed in a north-facing area with the vent chimney
facing the prevailing wind. The facility should face north to maximize sun exposure in the
Southern Hemisphere. The Enviro-Loo is also limited in its capacity. One Enviro-Loo toilet has
a capacity of 60 uses (20 users) per day. However, multiple Enviro-Loo toilets can be placed
side-by-side, allowing for a facility to service more people daily.
4.1.2 Hybrid Toilet
The Hybrid Toilet system was developed in Australia in the 1990’s by Paul Turner and Mark
Langford. The toilet was initially developed for Aboriginal communities that did not have
access to a sufficient water supply. Because this lack of water made it impractical to use flush
toilets in their community, there was a strong need for a non-flushing toilet. After researching
different systems, the inventors designed the Hybrid Toilet, which is a design which combines
aspects of a composting toilet and a septic system (Aussie Things, 2005). The Hybrid Toilet is
similar to a composting toilet because it breaks down waste, inactivating pathogens, and then the
waste percolates into the gravel bed, like a septic system (Gough Plastics, 2007).
The treatment process takes place in two different tanks before it is discharged into the ground.
The primary tank is placed directly below the toilet so waste enters it immediately. Upon
installation, the primary tank is filled with water. When waste enters, anaerobic bacteria break it
down forming a sludge, which settles at the bottom of the tank. Anaerobic activity digests the
solid waste to five percent of its original mass (SA Biotech, 2008). Optimum conditions for
anaerobic activity are a pH of 6-8 and a temperature of 30-37° Celsius. There is no mixing
within the tank; therefore, a steady gradient of decreasing oxygen levels exists with the highest
concentration of oxygen at the top. As new waste enters, displacement forces water out of the
primary tank into the separation chamber. Since gas is formed during the anaerobic activity,
solids can sometimes be carried to the top of the primary tank. However, the separation chamber
is specially designed with thin slots so that larger solids cannot pass through.
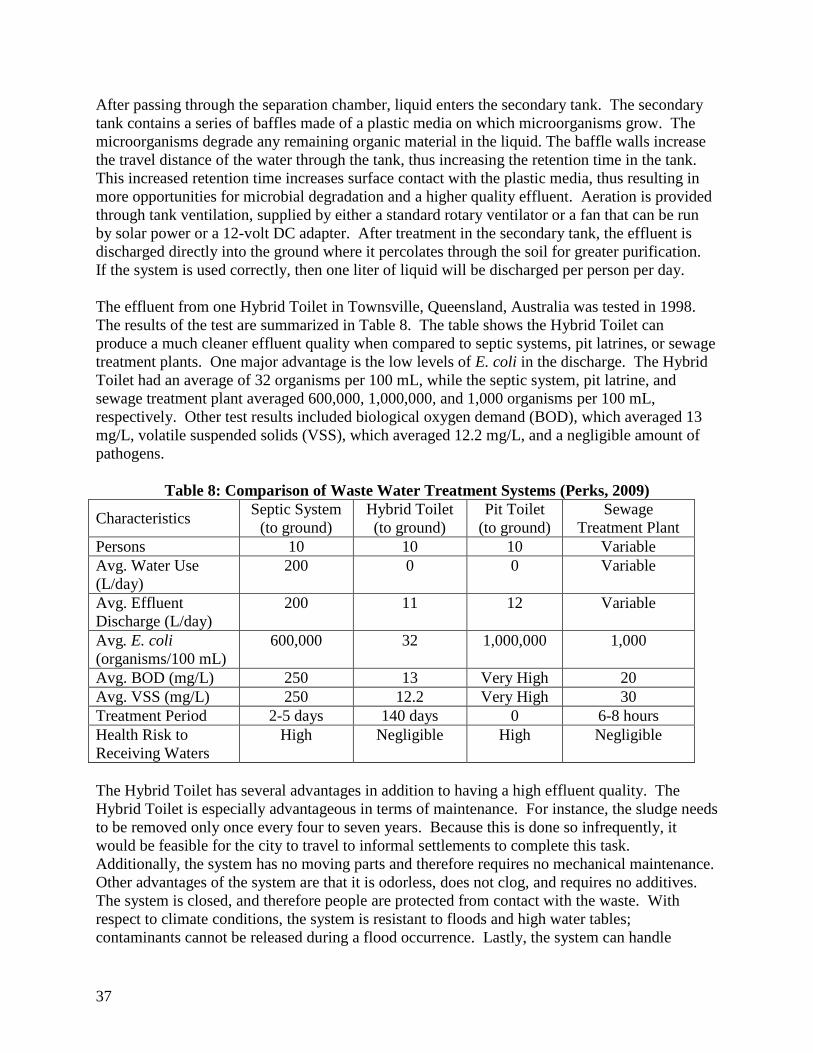
37
After passing through the separation chamber, liquid enters the secondary tank. The secondary
tank contains a series of baffles made of a plastic media on which microorganisms grow. The
microorganisms degrade any remaining organic material in the liquid. The baffle walls increase
the travel distance of the water through the tank, thus increasing the retention time in the tank.
This increased retention time increases surface contact with the plastic media, thus resulting in
more opportunities for microbial degradation and a higher quality effluent. Aeration is provided
through tank ventilation, supplied by either a standard rotary ventilator or a fan that can be run
by solar power or a 12-volt DC adapter. After treatment in the secondary tank, the effluent is
discharged directly into the ground where it percolates through the soil for greater purification.
If the system is used correctly, then one liter of liquid will be discharged per person per day.
The effluent from one Hybrid Toilet in Townsville, Queensland, Australia was tested in 1998.
The results of the test are summarized in Table 8. The table shows the Hybrid Toilet can
produce a much cleaner effluent quality when compared to septic systems, pit latrines, or sewage
treatment plants. One major advantage is the low levels of E. coli in the discharge. The Hybrid
Toilet had an average of 32 organisms per 100 mL, while the septic system, pit latrine, and
sewage treatment plant averaged 600,000, 1,000,000, and 1,000 organisms per 100 mL,
respectively. Other test results included biological oxygen demand (BOD), which averaged 13
mg/L, volatile suspended solids (VSS), which averaged 12.2 mg/L, and a negligible amount of
pathogens.
Table 8: Comparison of Waste Water Treatment Systems (Perks, 2009)
Characteristics Septic System
(to ground)
Hybrid Toilet
(to ground)
Pit Toilet
(to ground)
Sewage
Treatment Plant
Persons 10 10 10 Variable
Avg. Water Use
(L/day)
200 0 0 Variable
Avg. Effluent
Discharge (L/day)
200 11 12 Variable
Avg. E. coli
(organisms/100 mL)
600,000 32 1,000,000 1,000
Avg. BOD (mg/L) 250 13 Very High 20
Avg. VSS (mg/L) 250 12.2 Very High 30
Treatment Period 2-5 days 140 days 0 6-8 hours
Health Risk to
Receiving Waters
High Negligible High Negligible
The Hybrid Toilet has several advantages in addition to having a high effluent quality. The
Hybrid Toilet is especially advantageous in terms of maintenance. For instance, the sludge needs
to be removed only once every four to seven years. Because this is done so infrequently, it
would be feasible for the city to travel to informal settlements to complete this task.
Additionally, the system has no moving parts and therefore requires no mechanical maintenance.
Other advantages of the system are that it is odorless, does not clog, and requires no additives.
The system is closed, and therefore people are protected from contact with the waste. With
respect to climate conditions, the system is resistant to floods and high water tables;
contaminants cannot be released during a flood occurrence. Lastly, the system can handle
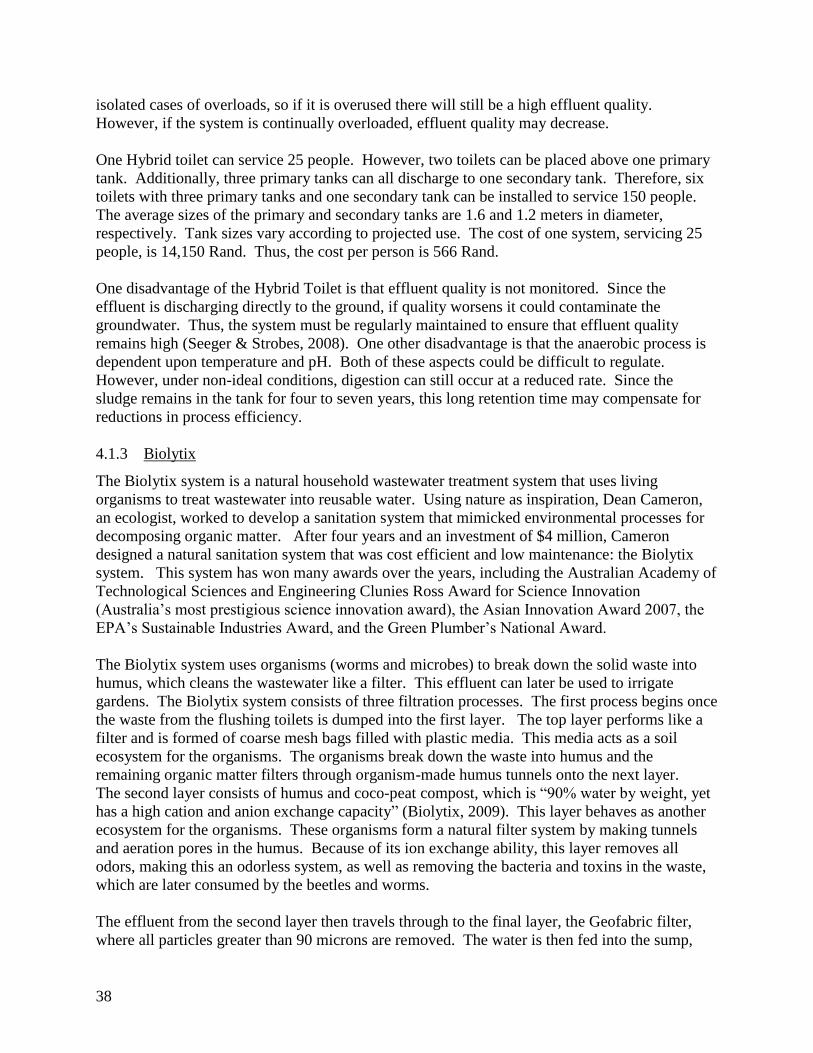
38
isolated cases of overloads, so if it is overused there will still be a high effluent quality.
However, if the system is continually overloaded, effluent quality may decrease.
One Hybrid toilet can service 25 people. However, two toilets can be placed above one primary
tank. Additionally, three primary tanks can all discharge to one secondary tank. Therefore, six
toilets with three primary tanks and one secondary tank can be installed to service 150 people.
The average sizes of the primary and secondary tanks are 1.6 and 1.2 meters in diameter,
respectively. Tank sizes vary according to projected use. The cost of one system, servicing 25
people, is 14,150 Rand. Thus, the cost per person is 566 Rand.
One disadvantage of the Hybrid Toilet is that effluent quality is not monitored. Since the
effluent is discharging directly to the ground, if quality worsens it could contaminate the
groundwater. Thus, the system must be regularly maintained to ensure that effluent quality
remains high (Seeger & Strobes, 2008). One other disadvantage is that the anaerobic process is
dependent upon temperature and pH. Both of these aspects could be difficult to regulate.
However, under non-ideal conditions, digestion can still occur at a reduced rate. Since the
sludge remains in the tank for four to seven years, this long retention time may compensate for
reductions in process efficiency.
4.1.3 Biolytix
The Biolytix system is a natural household wastewater treatment system that uses living
organisms to treat wastewater into reusable water. Using nature as inspiration, Dean Cameron,
an ecologist, worked to develop a sanitation system that mimicked environmental processes for
decomposing organic matter. After four years and an investment of $4 million, Cameron
designed a natural sanitation system that was cost efficient and low maintenance: the Biolytix
system. This system has won many awards over the years, including the Australian Academy of
Technological Sciences and Engineering Clunies Ross Award for Science Innovation
(Australia’s most prestigious science innovation award), the Asian Innovation Award 2007, the
EPA’s Sustainable Industries Award, and the Green Plumber’s National Award.
The Biolytix system uses organisms (worms and microbes) to break down the solid waste into
humus, which cleans the wastewater like a filter. This effluent can later be used to irrigate
gardens. The Biolytix system consists of three filtration processes. The first process begins once
the waste from the flushing toilets is dumped into the first layer. The top layer performs like a
filter and is formed of coarse mesh bags filled with plastic media. This media acts as a soil
ecosystem for the organisms. The organisms break down the waste into humus and the
remaining organic matter filters through organism-made humus tunnels onto the next layer.
The second layer consists of humus and coco-peat compost, which is “90% water by weight, yet
has a high cation and anion exchange capacity” (Biolytix, 2009). This layer behaves as another
ecosystem for the organisms. These organisms form a natural filter system by making tunnels
and aeration pores in the humus. Because of its ion exchange ability, this layer removes all
odors, making this an odorless system, as well as removing the bacteria and toxins in the waste,
which are later consumed by the beetles and worms.
The effluent from the second layer then travels through to the final layer, the Geofabric filter,
where all particles greater than 90 microns are removed. The water is then fed into the sump,
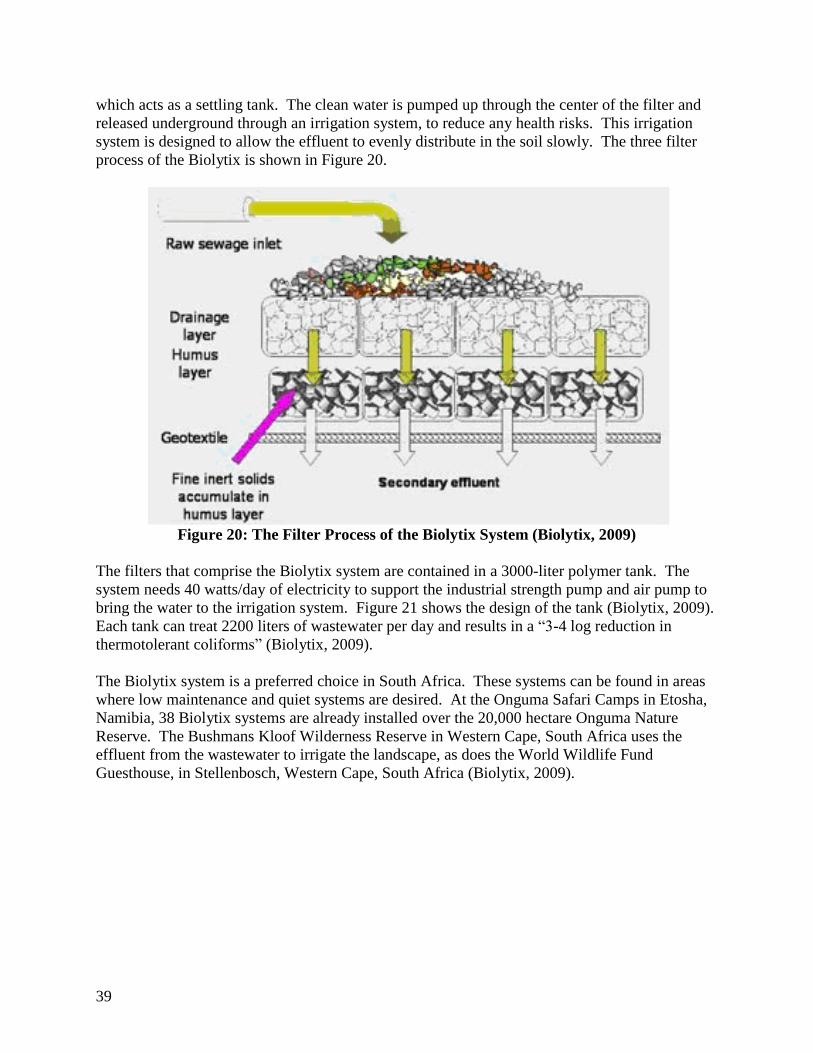
39
which acts as a settling tank. The clean water is pumped up through the center of the filter and
released underground through an irrigation system, to reduce any health risks. This irrigation
system is designed to allow the effluent to evenly distribute in the soil slowly. The three filter
process of the Biolytix is shown in Figure 20.
Figure 20: The Filter Process of the Biolytix System (Biolytix, 2009)
The filters that comprise the Biolytix system are contained in a 3000-liter polymer tank. The
system needs 40 watts/day of electricity to support the industrial strength pump and air pump to
bring the water to the irrigation system. Figure 21 shows the design of the tank (Biolytix, 2009).
Each tank can treat 2200 liters of wastewater per day and results in a “3-4 log reduction in
thermotolerant coliforms” (Biolytix, 2009).
The Biolytix system is a preferred choice in South Africa. These systems can be found in areas
where low maintenance and quiet systems are desired. At the Onguma Safari Camps in Etosha,
Namibia, 38 Biolytix systems are already installed over the 20,000 hectare Onguma Nature
Reserve. The Bushmans Kloof Wilderness Reserve in Western Cape, South Africa uses the
effluent from the wastewater to irrigate the landscape, as does the World Wildlife Fund
Guesthouse, in Stellenbosch, Western Cape, South Africa (Biolytix, 2009).
40
Figure 21: The Biolytix Design (Biolytix, 2009)
Not only does the Biolytix system offer an odorless and low maintenance sanitation system, the
Biolytix uses natural resources to treat wastewater. Because it recirculates water, it is a
sustainable alternative to other sanitation systems. However, the pump uses electricity and may
require maintenance if broken.
4.2 Evaluation
Both the Enviro Loo and the Hybrid Toilet were analyzed against the list of criteria in Table 9 to
identify the type of toilet most suitable for the water and sanitation facility in Monwabisi Park.
The Biolytix system was not included in this ranking. The Biolytix Company stated that the
company will not install their product in informal settlements at this time, which made the
Biolytix system no longer a viable option for the water and sanitation facility (Hawke, 2009).
Both the Enviro Loo and Hybrid toilet achieved satisfactory removal of pathogens, thus meeting
public health concerns. These systems also accommodate the maximum users per day to meet
government-defined basic sanitation services levels (5 families per toilet). Both options do not
produce any energy and have a high estimated lifetime. Because both systems meet the
necessary conditions for these standards, these criteria do not affect toilet selection. The
following sections discuss criteria in which the two systems differ.

41
Table 9: Toilet Evaluation Criteria
Category Criteria Enviro Loo Hybrid
Efficiency Pathogen inactivation High High
Operation &
Maintenance
Frequency of maintenance Medium
(6 months - 3 years)
Low
(5-7 years)
Technical skill required for
maintenance
Low Low
Operation Requirements Medium Low
Water requirements None Low
(Installation)
Road Access required No Yes
Byproducts Energy production No No
Compost production Yes No
Sludge production None Low
Effluent None Low
Energy Demand External Energy Requirements Yes
(sunlight/wind)
None
Design Parameters Number of Users per Day (people) High (20) High (25)
Estimated Lifetime High High
Size of Unit (meters) Low
(0.93 x 2.36)
Medium
(1.6 x 2.8)
Space Demand (meters) Medium (1.37 x
3.63)
Medium
(1.6 x 4.07)
Cost Product Cost (Rand) 5,3001
14,1502
Community Community involvement Medium Low
Case Studies Study Feedback High Medium 1Excludes: toilet cubicle, VAT, transportation, installation, drying bag (optional) (R135.00)
Includes: anchor device and overflow connector 2 Excludes toilet cubicle, VAT, transportation, installation
4.2.1 Operation and Maintenance
The Hybrid toilet requires little maintenance involving the use of City of Cape Town trucks to
remove the waste every five to seven years. The sludge from the Hybrid toilets needs to be
pumped out at the expense of the city since the community does not have the means to do this
task themselves. In addition to maintenance needed from the City, the effluent from Hybrid
toilet also needs to be closely monitored to ensure clean effluent is being released into the
ground. The other toilet option, the Enviro Loo, requires on-site maintenance from the
community only once every six months. The toilet uses a dehydration process to dry out the
waste into useable compost. This waste needs to be raked every so often to expedite the
dehydration process. Both toilet options can handle the occasional foreign object in the system.
It is very easy for the object to be identified and removed from the facility when the system is
maintained.

42
The toilet would preferably be maintained on-site, without the use of city trucks and workers. It
takes city employees longer than community members to address problems with sanitation
facilities. Trucks cannot access a facility that is not located along a main road. Therefore, the
Hybrid system, which requires trucks to pump out waste, is not a viable option for facilities
without road access. The facility must either be built along a main road, or it must use a
technology that does not require trucks or other heavy equipment to maintain. The Enviro Loo
does not require the use of road access, since it can be easily maintained on-site.
Maintenance is not necessarily a drawback to a technology. A system that requires some
maintenance encourages community involvement. Therefore, the families would take ownership
of their facility and would be more likely to take proper care of it.
It is also necessary that the toilets can be easily installed in the facility. Both systems require
ground excavation. The Enviro Loo toilet comes with a pre-fabricated tank, making it easily
implementable. The Enviro Loo Company also trains the users how to install the toilet and
shows them how to properly use the toilet. The Hybrid toilet requires water upon installation.
Due to the scarcity of water, waterless toilets are a practical option. Not including Hybrid
installation, both systems are waterless. The high water table prevents large amounts of water
from easily infiltrating into the ground, so systems that require less water disposal are favorable.
4.2.2 Byproducts
The Enviro Loo is a waterless system that produces compost. After being dehydrated within the
system, the waste is removed to complete the composting process. It can then can be sold for
profit or be used on a garden. The Hybrid system does not produce compost, but does discharge
effluent into the ground. Because of past case studies, as mentioned in Section 4.1.2, this
effluent needs to be closely monitored to ensure groundwater contamination is not occurring. In
addition to effluent discharge, the Hybrid system produces sludge. Although sludge can provide
nutrients and can act as a fertilizer, this sludge requires the use of City Trucks to pump out the
waste, and therefore the facilities must be located along main roads.
4.2.3 Energy Required
Both the Enviro Loo and the Hybrid toilets do not require the use of electricity to run the
systems. The Enviro Loo is the only toilet that requires energy to function. Sunlight is
necessary for the Enviro Loo to complete the dehydration process for the compost. Wind energy
is also needed to power the fan, which also aids in the dehydration process by drawing air
through the vault.
4.2.4 Facility Size
Constraints such as space demand and estimated lifetime were analyzed when identifying the
more suitable toilet for the community. If the toilet required little space, more toilet facilities
could be implemented in the limited area for the facility. The Enviro Loo toilet required less
space than the Hybrid Toilet. The Enviro Loo unit required an area of 0.93 by 2.36 meters, while
the Hybrid Toilet needed 1.6 x 2 meters. When including the structure around the toilet, the area
required for each facility increased. The total space demand for the Enviro Loo is 1.37 x 3.63
meters, while the Hybrid needed an area of 1.6 x 4.07 meters.

43
4.2.5 Facility Cost
Cost was also taken into consideration, but to a lesser degree. It was deemed more important to
have a facility that would be certain to work for several years (or decades), even if the cost were
slightly higher. The cost of the Enviro Loo is R5300. This includes an anchor device and an
overflow connector. The cost for a Hybrid is almost triple that of an Enviro Loo. The price of a
Hybrid is R14150. Both these prices do not include toilet cubicle, VAT, transportation or
installation.
4.2.6 Case Studies
A study was done in 2008 in Tasmania’s Narawntapu National Parks, which monitored the
effluent quality of three different Hybrid Toilet systems. The report concluded that two out of
the three systems effectively treated the waste. However, the third system was discharging a low
quality effluent. The effluent contained low levels of fecal coliforms, but high levels of total
suspended solids and BOD. The problem occurred due to improper installation. The results of
this report reiterate that the system must be regularly maintained and monitored to ensure that the
effluent is not contaminating the groundwater (Seeger & Strobes, 2008).
The Enviro Loo has already been implemented successfully in many areas across South Africa
and around the world. Enviro Loos have been installed at schools, conference centers, national
parks, and informal settlements in South Africa. Figure 22 shows multiple Enviro Loos
installed in close proximity in another informal settlement in South Africa. They have been
installed in the United States at Boy Scout Camps and Golf Courses. Enviro Loo toilets can also
be found in France, Australia, Dubai, and Namibia. Each of these case studies reported positive
feedback; the Enviro Loo effectively treated the waste (Belzak, 2009).
Figure 22: Enviro Loo Toilets at an Informal Settlement (Clean up America, 2009)
4.3 Evaluation of Remaining Components
The primary goals in designing a water and sanitation facility are to provide a sustainable
solution that improves public health and to satisfy the needs of the community. To ensure that
these goals are met, additional amenities were considered for inclusion in the facility. These
amenities include rainwater collection tanks, a dishwashing station, water taps, a laundry station,

44
hand washing sinks, showers, a garden, the Water and Sanitation Specialist, and other various
safety features.
These components of the water and sanitation facility were evaluated to determine whether or
not they are suitable and necessary for Monwabisi Park. Each component was evaluated based
on its contribution to improving current practices and its impact on the community. These two
considerations are expanded in Table 10. Current practices in Monwabisi Park that must be
improved are water usage (decreasing the amount wasted), decreasing standing water, improving
public hygiene, and reducing the vandalism, theft, and misuse of public property. However, the
foremost priority is to provide safer, healthier, and more convenient access to water. A
component can be considered as having a positive impact on the community if it will be accepted
by the public and if it promotes positive interaction between residents.
Table 10: List of Evaluation Considerations
Current Practices Reduces Water Usage
Removes Standing Water
Improves Public Hygiene
Reduces Vandalism/Theft/Misuse
Community Public Acceptance
Promotes Interaction
Potential components were also evaluated based on water use. The volume of water being used
under current practices was compared to estimated consumption rates if the different components
of the facility are utilized. All water consumption rates were estimated with the help of Dianne
Womersley, founder of the Shaster Foundation, and interviews with residents conducted by
Granfone et al. in 2008.
4.3.1.1 Taps
Water taps at the water and sanitation facility can reduce standing water, improve public
hygiene, and reduce theft, vandalism, and misuse. Currently, water taps are being damaged
through misuse or vandalism. To prevent this from occurring at the water and sanitation facility,
steps are needed to make taps easier to use and better supervised. The two most common ways
taps are misused are hanging buckets off the taps and leaving water running. To remedy the first
issue, shelves are recommended below the taps, so that buckets can rest on the shelf while being
filled. Also, operation of the taps using foot pedals can prevent the water from being left
running, which in turn prevents pools of standing water from forming around the tap. In
addition, the foot pedal can reduce the transmission of disease at the water tap, since no one
would need to touch the taps with their hands. The taps would also be supervised by a water and
sanitation specialist, which can discourage vandalism. Two water taps are recommended for the
facility to ensure basic service requirements are met. With two taps, 250 people could be
serviced by the facility. If fewer than 125 people are serviced by the facility, the second tap
would offer some redundancy in case one tap is broken.
45
4.3.1.2 Rainwater Collection Tanks
Rainwater collection tanks can reduce the amount of water needed from the city distribution
system. Water for the dishwashing station, laundry station, and showers can be supplemented by
a rainwater collection tank. Gutters on all of the toilet enclosures and the on-site residence can
collect runoff from the roofs and redirect it to the tanks. If there is not enough rain water, water
can be pumped through a hose from the tap nearby to refill the tank. Based on these
considerations, rainwater collection tanks are recommended for the facility.
4.3.1.3 Dishwashing station
Providing sinks at the water and sanitation facility that can be used for washing dishes can
improve current water use practices, reduce standing water, and promote community interaction.
Currently in Monwabisi Park, dishes are either washed in the home or at the water taps. In either
case, food scraps are washed away with the water used. These scraps can become breeding
grounds for insects and disease if the water is dumped outside in the streets. If dishes are washed
at nearby water taps, the scraps can eventually clog up the drainage area beneath them.
As a solution to these problems, dishwashing stations are recommended for the new water and
sanitation facility. Upon arrival at the facility, food scraps can be scraped into a composting box
and then brought to the sinks to be washed. Each sink would have a screen on the drain to ensure
smaller chunks of food do not get into the drainage system. The sinks would include stoppers to
allow filling of the sinks to conserve water. Water for the dishwashing station can be
supplemented by the rainwater collection tanks. Waste water from the dishwashing sinks would
infiltrate to the garden instead of contributing to standing water in the streets. In order for water
from the dishwashing station to be used for irrigation, biodegradable soap must be used. Like
the laundry station that once serviced the Indlovu Center, the dishwashing sinks would promote
community interaction.
Currently, residents require about one bucket, or 20 liters, of water a day to wash dishes.
However, if dishes are washed at the tap, the water will most likely be left running and therefore
be wasted. However, the sink stoppers would ensure water is not left running, and thus be
conserved. It is estimated that 19 liters of water would be used to wash dishes at the facility.
Additionally, all of this water will be appropriately discharged instead of being left in the streets.
The dishwashing station can also be used to wash water collection buckets. Currently, residents
transport their water from the tap back to their home using buckets. These buckets are often
dirty and contaminate the water. Providing a quick and easy means to clean water buckets could
improve drinking water quality and thus, public health.
4.3.1.4 Laundry
Having a laundry station at the facility can improve current water practices, reduce standing
water, and promote community integration. A laundry facility previously built near the Indlovu
Center was successful (Alex et al., 2007). It became a community gathering place and helped
the residents of the area to do their laundry in an efficient manner. The water and sanitation
facility similarly focuses on creating a community atmosphere, particularly through a communal
laundry facility. Six laundry sinks are included the design. The previous laundry station, which
46
has since been destroyed by fire, contained four sinks. The six sink design can further encourage
use of the laundry stations and community development. The sinks would include stoppers to
allow filling of the sinks to conserve water. The laundry sinks would drain to an on-site leaching
field described in Section 4.3.1.7, which requires the detergent to be biodegradable. The
previous facility used a detergent known as Triple Orange (Alex et al., 2007). Sinks would also
have screens over the drains to prevent the leaching field pipes from clogging.
Current laundry practices require about 6 buckets of water per family, or 120 liters, two days a
week for a total of 240 liters per week. Assuming that residents would still be doing laundry
twice a week, it is estimated that this amount of water would decrease to 100 liters per day, or
200 liters per week, to reflect the amount of water that would not be wasted if residents use the
laundry station at the facility. All of the water used would be discharged appropriately.
4.3.1.5 Sinks
Hand washing sinks are recommended for the facility to encourage cleanliness and increased
hygiene in the community. Hand washing sinks placed by the exit of the facility force people to
pass them as they move to their next activity. The location should serve to promote hand
washing not only by convenience, but it should also remind people who have not made hand
washing a habit. Soap for the sinks would be provided through the Shaster Foundation. The
soap used is biodegradable and should not interrupt plant growth. To prevent the likelihood of
theft, the soap would be in liquid form, dispensed from a fixture on the wall. Water from the
sinks would drain to an on-site leaching field described in Section 4.3.1.7. The sinks would have
drain covers to prevent large items from flowing into and clogging the pipes in the leaching field.
Since hand washing is not part of the current daily practices of many Monwabisi Park residents,
adding this feature to the facility would require additional water. It is estimated that hand
washing would require about 8 liters of water per day per person. This water increase would be
largely outweighed by the public benefit it will provide. Hand washing sinks have the potential
to greatly reduce the fecal-oral transmission that many residents are frequently exposed to.
4.3.1.6 Shower facility
Current washing practices in Monwabisi Park are usually limited to a sponge bath several times a
week. To avoid making frequent trips back and forth to the water taps, water is shared by
members of the household. Once everyone has used the water for bathing, it is disposed of in the
streets. To encourage progress toward more complete hygiene practices including regular
showering, two shower stalls are recommended in the water and sanitation facility design. The
showers could be used by anyone who normally visited the facility. The showers would be
supplied water by rainwater collection tanks. Water would drain into a garden leaching field as
described in Section 4.3.1.7.
Currently, one household uses about 20 liters of water per day for sponge bathing. At the
facility, it is estimated that a five minute shower would use about 40 liters of water per person.
Therefore, having showers in the facility would increase the consumption of water. However,
controlling the discharge would greatly reduce the amount of standing water. Additionally,
47
changing practices from sponge bathing to shower would improve public health, hygiene, and
standard of living in the community.
4.3.1.7 Garden Leaching Field
After water drains from the laundry, dishwashing, and hand washing sinks and from the showers,
it would flow into a series of buried pipes which would drain into a leaching field. The pipes
would have holes which allow water to infiltrate the soil. Above the pipes, a garden would be
planted with a two-fold purpose. The garden would allow the community an area to grow crops.
The plants absorb some of the wastewater from the facility, limiting the amount of land needed
to leach the water away. The garden would be cared for by a specialist described in Section
4.3.1.8. The pipes would be installed underground in side-by-side 0.75 meter wide trenches 0.75
meters below the garden area. The bed of the trench would be layered with gravel to help
accelerate infiltration. If the garden area is not sufficiently large to leach all of the wastewater
from the facility, additional trenches would be constructed under the public paths near the water
and sanitation facility to expand the size of the leaching field.
To find the necessary size of the leaching field, the following procedure was used. First, the
amount of wastewater discharged by the facility was estimated using the summation of the water
consumption rates of each component. These rates are summarized later in Table 12. The
estimated total wastewater flow for an average day was 5,830 gallons (22,000 liters) per week.
Estimated future peak flows totaled 12,400 gallons (46,900 liters) per week. With these water
loads, the leaching field required a trench measuring 120 feet (36 m) in length. Calculations can
be found in Appendix A.
4.3.1.8 Water and Sanitation Specialist
The position of water and sanitation specialist (WSS) would be filled by a respected member of
the community. He or she must go through an interview process conducted by the Shaster
Foundation before being hired. After obtaining the position, the specialist must be trained on
proper hygiene by the City of Cape Town and the Shaster Foundation. The specialist would also
be trained by Enviro Loo representatives on maintenance and use of the Enviro Loo toilet when
they are installed.
The specialist would live in a house on-site and act as a liaison between the community members
and the City of Cape Town. Any water or sanitation issue would be addressed to the specialist.
Living on-site would increase the security and safety of the facility. The person in this position
would have the authority to remove any unwanted visitors who may be vandalizing or misusing
the facility. Additional duties of the specialist would include: monitoring and raking of the
waste in the Enviro Loo toilets, managing the community garden, keeping all areas of the facility
tidy and properly working, and distributing water buckets. This specialist would have a supply
of toilet paper, hand washing soap, and laundry detergent readily available for the community
members. He or she could also provide medicine to treat diarrhea. Responsibilities of the WSS
also include refilling the water tanks for the showers, sinks, and laundry facility. The specialist
would be in charge of instructing residents the proper use of each service. He or she should also
promote the use of the hand washing sinks to improve hygiene.
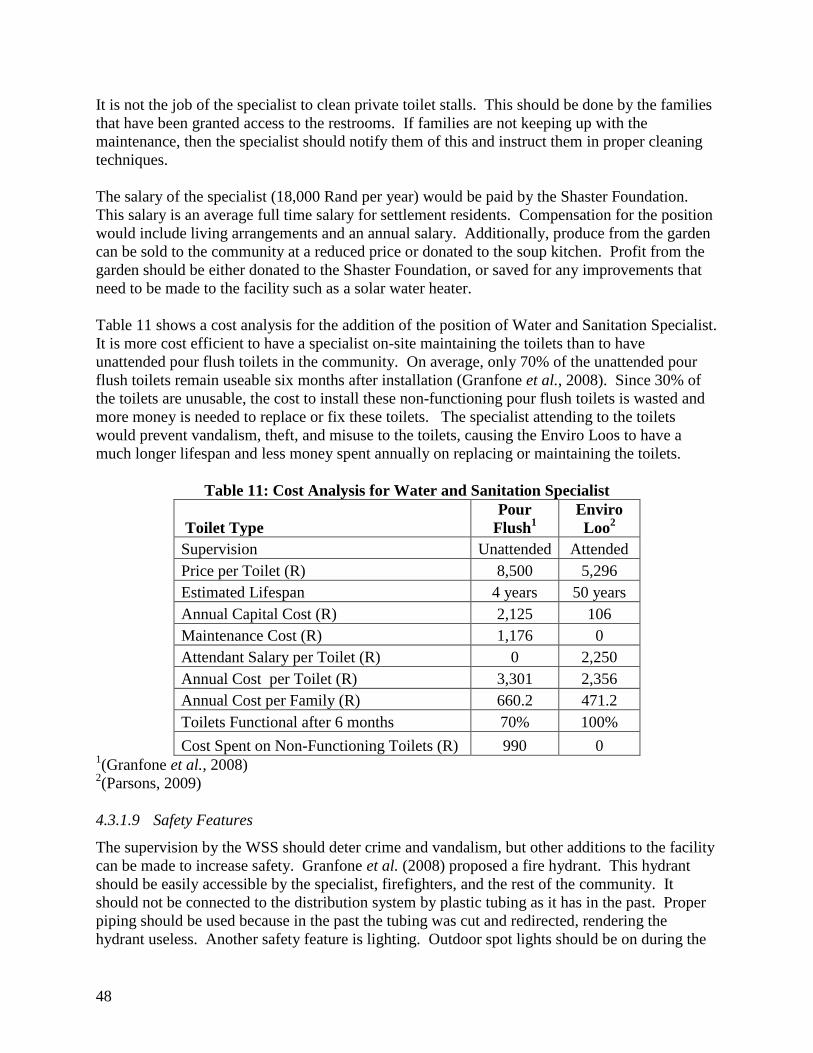
48
It is not the job of the specialist to clean private toilet stalls. This should be done by the families
that have been granted access to the restrooms. If families are not keeping up with the
maintenance, then the specialist should notify them of this and instruct them in proper cleaning
techniques.
The salary of the specialist (18,000 Rand per year) would be paid by the Shaster Foundation.
This salary is an average full time salary for settlement residents. Compensation for the position
would include living arrangements and an annual salary. Additionally, produce from the garden
can be sold to the community at a reduced price or donated to the soup kitchen. Profit from the
garden should be either donated to the Shaster Foundation, or saved for any improvements that
need to be made to the facility such as a solar water heater.
Table 11 shows a cost analysis for the addition of the position of Water and Sanitation Specialist.
It is more cost efficient to have a specialist on-site maintaining the toilets than to have
unattended pour flush toilets in the community. On average, only 70% of the unattended pour
flush toilets remain useable six months after installation (Granfone et al., 2008). Since 30% of
the toilets are unusable, the cost to install these non-functioning pour flush toilets is wasted and
more money is needed to replace or fix these toilets. The specialist attending to the toilets
would prevent vandalism, theft, and misuse to the toilets, causing the Enviro Loos to have a
much longer lifespan and less money spent annually on replacing or maintaining the toilets.
Table 11: Cost Analysis for Water and Sanitation Specialist
Toilet Type
Pour
Flush1
Enviro
Loo2
Supervision Unattended Attended
Price per Toilet (R) 8,500
5,296
Estimated Lifespan 4 years 50 years
Annual Capital Cost (R) 2,125 106
Maintenance Cost (R) 1,176 0
Attendant Salary per Toilet (R) 0 2,250
Annual Cost per Toilet (R) 3,301 2,356
Annual Cost per Family (R) 660.2 471.2
Toilets Functional after 6 months 70% 100%
Cost Spent on Non-Functioning Toilets (R) 990 0 1(Granfone et al., 2008)
2(Parsons, 2009)
4.3.1.9 Safety Features
The supervision by the WSS should deter crime and vandalism, but other additions to the facility
can be made to increase safety. Granfone et al. (2008) proposed a fire hydrant. This hydrant
should be easily accessible by the specialist, firefighters, and the rest of the community. It
should not be connected to the distribution system by plastic tubing as it has in the past. Proper
piping should be used because in the past the tubing was cut and redirected, rendering the
hydrant useless. Another safety feature is lighting. Outdoor spot lights should be on during the

49
night to prevent vandalism and crime. Fences should also enclose the entire facility so that
residents can only enter and exit through the specified area. This would allow the specialist to
monitor everyone that enters the facility. Providing other services, including laundry stations
and gardening, also socializes the facility and reduces problems.
4.4 Water Usage
The facility has been designed to accommodate 200 people, or about 40 families. This number
of families would serve as its maximum capacity. Using the estimated water flow rates stated
above for each component, the water flow through the facility was calculated for maximum and
projected use. These results are shown in Table 12. According to Table 12, when the facility is
being used to its maximum capacity, 58,000 liters are being used per week. Additionally, 47,000
liters are being discharged to the garden each week. The remainder of the water that is used is
consumed through cooking or drinking. If the amount of water discharged exceeds the capacity
of the garden, more piping can be placed in nearby pathways. When the facility is being used to
maximum capacity, it is assumed that no laundry or dishwashing is done at the home, and
therefore there is no water being discharged elsewhere in the community.
Table 12: Maximum Capacity Water Flow Rates
Service Rate Days/week Total Water
(L/wk)
Laundry 100 L/day 2 8,000
Shower 37.85 L/ 5 min 3 22,710
Dish-washing 18.92 L/load 7 5,298
Hand washing 7.75 L/day 7 10,850
Cooking/Drinking 40 L/day 7 11,200
Total Water Used: 58,058
Total Water Discharged to Garden: 46,858
Total Water Discharged Elsewhere1: 0
1Does not include leftover water from cooking
However, it is assumed that when the facility first opens, it will not be utilized to its full
capacity. Therefore, estimates have been made to determine the water flow rates for when
components of the facility are not being fully utilized. It was estimated that only a small portion
of the community members would use the shower facilities and dishwashing stations. These
results are shown in Table 13. As shown, the total water used at the facility is 41,000 liters per
week. This total includes the water that is taken from the taps in the facility and transported back
to the home for various tasks. The total water discharged to the garden is 22,000 liters per week.
The total water discharged elsewhere is 7,800 liters per week. This water may contribute to
standing water. However, this is a dramatic decrease when compared to current practices, in
which almost all of the water used is discharged to the streets.
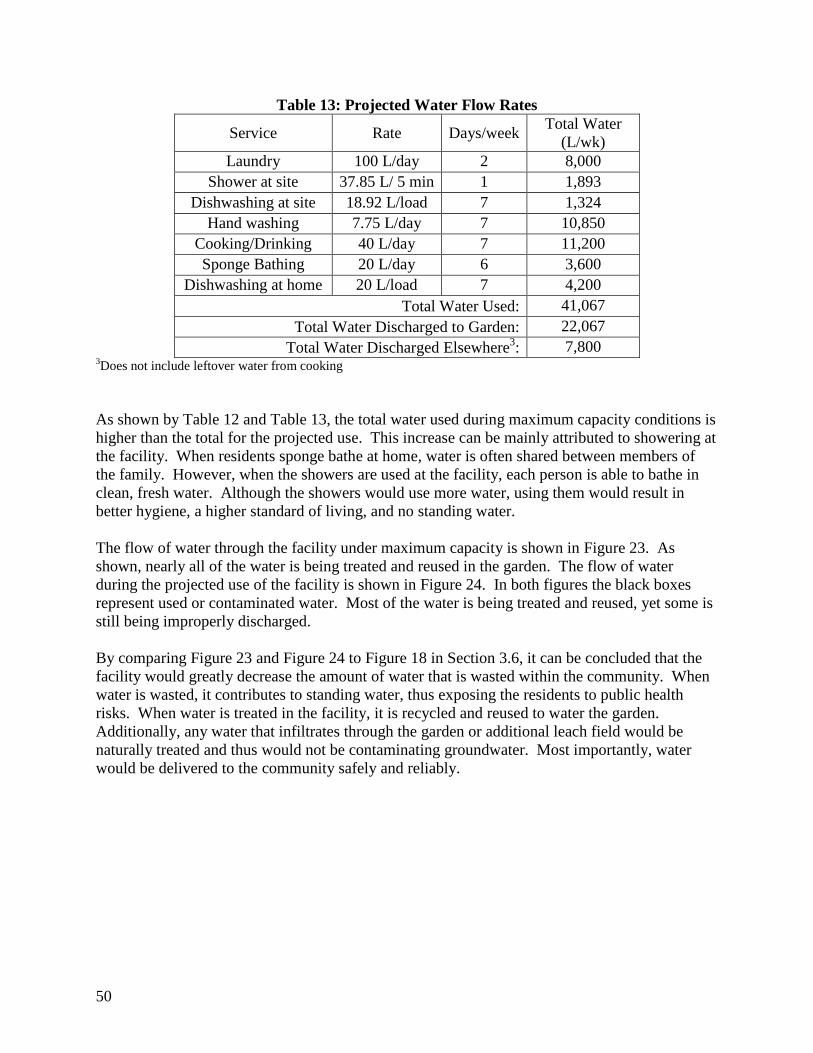
50
Table 13: Projected Water Flow Rates
Service Rate Days/week Total Water
(L/wk)
Laundry 100 L/day 2 8,000
Shower at site 37.85 L/ 5 min 1 1,893
Dishwashing at site 18.92 L/load 7 1,324
Hand washing 7.75 L/day 7 10,850
Cooking/Drinking 40 L/day 7 11,200
Sponge Bathing 20 L/day 6 3,600
Dishwashing at home 20 L/load 7 4,200
Total Water Used: 41,067
Total Water Discharged to Garden: 22,067
Total Water Discharged Elsewhere3: 7,800
3Does not include leftover water from cooking
As shown by Table 12 and Table 13, the total water used during maximum capacity conditions is
higher than the total for the projected use. This increase can be mainly attributed to showering at
the facility. When residents sponge bathe at home, water is often shared between members of
the family. However, when the showers are used at the facility, each person is able to bathe in
clean, fresh water. Although the showers would use more water, using them would result in
better hygiene, a higher standard of living, and no standing water.
The flow of water through the facility under maximum capacity is shown in Figure 23. As
shown, nearly all of the water is being treated and reused in the garden. The flow of water
during the projected use of the facility is shown in Figure 24. In both figures the black boxes
represent used or contaminated water. Most of the water is being treated and reused, yet some is
still being improperly discharged.
By comparing Figure 23 and Figure 24 to Figure 18 in Section 3.6, it can be concluded that the
facility would greatly decrease the amount of water that is wasted within the community. When
water is wasted, it contributes to standing water, thus exposing the residents to public health
risks. When water is treated in the facility, it is recycled and reused to water the garden.
Additionally, any water that infiltrates through the garden or additional leach field would be
naturally treated and thus would not be contaminating groundwater. Most importantly, water
would be delivered to the community safely and reliably.

51
Figure 23: Water Flow under Maximum Capacity Conditions
Figure 24: Water Flow under Projected Use Conditions
Water collected from 5 Rivers at Dams/Reservoirs enters the Cape Town
Water Distribution System
Pumped to Indlovu Center Water and
Sanitation Facility (WSF)
20-L Buckets to be carried back to residences
Cooking
Water wasted
Drinking
Water excreted to 8 toilets at WSF
Waste treated via
Enviro-Loo
Showering at WSF
Water treated
Water discharged to garden
Handwashing at WSF
Water treated
Water discharged to garden
Dishwashing and Laundry at WSF
Water treated
Water discharged to garden
Water collected from 5 Rivers at Dams/Reservoirs enters the Cape Town Water Distribution System
20-L Buckets to be carried back to residences
Sponge Bathing
Water wasted
Dishwashing
Water wasted
Cooking
Water wasted
Drinking
Water excreted to 8 toilets at
WSF
Waste treated via Enviro-Loo
Showering at WSF
Water treated
Water discharged to garden
Hand washing at WSF
Water treated
Water discharged to garden
Dishwashing and Laundry at WSF
Water treated
Water discharged to garden
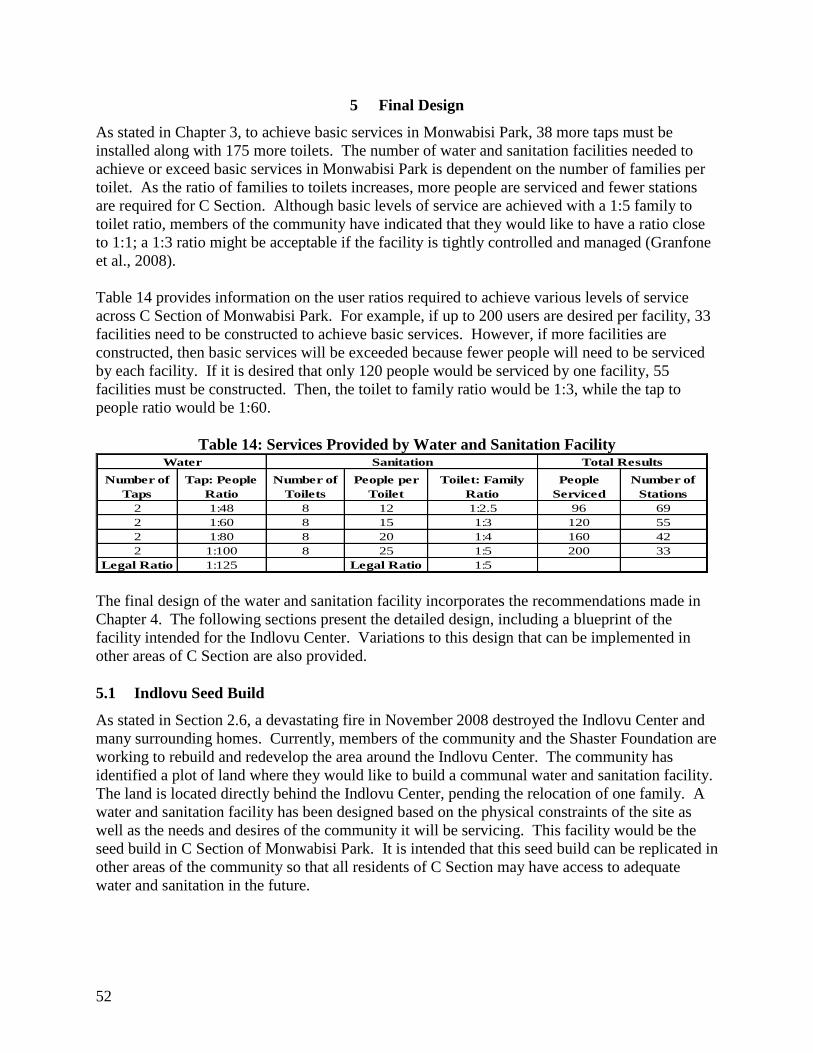
52
5 Final Design
As stated in Chapter 3, to achieve basic services in Monwabisi Park, 38 more taps must be
installed along with 175 more toilets. The number of water and sanitation facilities needed to
achieve or exceed basic services in Monwabisi Park is dependent on the number of families per
toilet. As the ratio of families to toilets increases, more people are serviced and fewer stations
are required for C Section. Although basic levels of service are achieved with a 1:5 family to
toilet ratio, members of the community have indicated that they would like to have a ratio close
to 1:1; a 1:3 ratio might be acceptable if the facility is tightly controlled and managed (Granfone
et al., 2008).
Table 14 provides information on the user ratios required to achieve various levels of service
across C Section of Monwabisi Park. For example, if up to 200 users are desired per facility, 33
facilities need to be constructed to achieve basic services. However, if more facilities are
constructed, then basic services will be exceeded because fewer people will need to be serviced
by each facility. If it is desired that only 120 people would be serviced by one facility, 55
facilities must be constructed. Then, the toilet to family ratio would be 1:3, while the tap to
people ratio would be 1:60.
Table 14: Services Provided by Water and Sanitation Facility
Number of
Taps
Tap: People
Ratio
Number of
Toilets
People per
Toilet
Toilet: Family
Ratio
People
Serviced
Number of
Stations
2 1:48 8 12 1:2.5 96 69
2 1:60 8 15 1:3 120 55
2 1:80 8 20 1:4 160 42
2 1:100 8 25 1:5 200 33
Legal Ratio 1:125 Legal Ratio 1:5
Water Sanitation Total Results
The final design of the water and sanitation facility incorporates the recommendations made in
Chapter 4. The following sections present the detailed design, including a blueprint of the
facility intended for the Indlovu Center. Variations to this design that can be implemented in
other areas of C Section are also provided.
5.1 Indlovu Seed Build
As stated in Section 2.6, a devastating fire in November 2008 destroyed the Indlovu Center and
many surrounding homes. Currently, members of the community and the Shaster Foundation are
working to rebuild and redevelop the area around the Indlovu Center. The community has
identified a plot of land where they would like to build a communal water and sanitation facility.
The land is located directly behind the Indlovu Center, pending the relocation of one family. A
water and sanitation facility has been designed based on the physical constraints of the site as
well as the needs and desires of the community it will be servicing. This facility would be the
seed build in C Section of Monwabisi Park. It is intended that this seed build can be replicated in
other areas of the community so that all residents of C Section may have access to adequate
water and sanitation in the future.
53
5.1.1 Design Constraints and Limitations
There are building and design constraints that apply to most plots of land in C Section. These
constraints must be taken into consideration before building a water and sanitation facility. The
constraints common to each site are described in this subsection.
The first major constraint is space. When planning for redevelopment, it is desirable to relocate
as few families as possible. Across Monwabisi Park, most single-family house lots are
approximately ten meters wide by twelve meters long. Therefore, any water and sanitation
facility must be confined by these parameters to ensure that only one family would be relocated
for each new facility.
Possible building locations are also constricted by the amount of sunlight they receive because
the Enviro Loo toilets rely on heat from the sun to function. Therefore, it is necessary that the
site not be shaded by surrounding buildings or trees. Additionally, the toilets should be placed in
the area of the site that faces north to maximize sun exposure in the Southern Hemisphere.
Another major constraint for most building lots in C Section is the high water table. Some areas
of Monwabisi Park are prone to flooding during the winter months. Gray water from the laundry
and dishwashing station, the hand washing sinks, and the showers needs to be discharged.
Because of the high water table, the amount of water that can be discharged without saturating
the soil is limited.
5.1.2 Indlovu Center Facility Design
The Indlovu Center water and sanitation facility has been designed to fit in the 10 meter wide by
12 meter long plot of land behind the community center.
The design includes the following:
8 SC240 Enviro Loo toilets and individual restroom stalls
2 water taps
2 hand washing sinks
6 laundry basins
4 dishwashing sinks
2 showers
2-1,000 liter rainwater collection tanks
A 23 square meter community garden
Storage and living space for the WSS
An AutoCAD drawing of the facility is shown in Figure 25. The footprints of the bathroom
stalls are outlined in blue. The Enviro Loo units are located directly below and behind the stalls;
they are drawn in light blue and labeled. In order to install the Enviro Loo units, 34 cubic meters
of excavation will be required. This space is outlined in red and labeled.
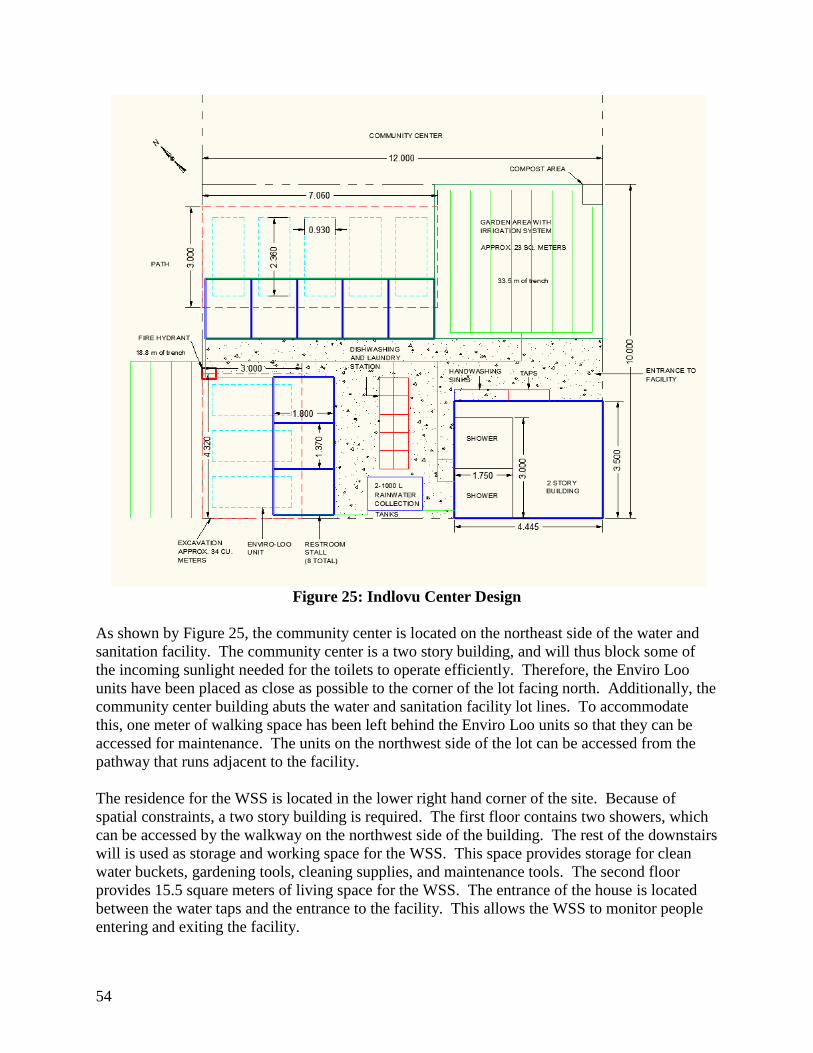
54
Figure 25: Indlovu Center Design
As shown by Figure 25, the community center is located on the northeast side of the water and
sanitation facility. The community center is a two story building, and will thus block some of
the incoming sunlight needed for the toilets to operate efficiently. Therefore, the Enviro Loo
units have been placed as close as possible to the corner of the lot facing north. Additionally, the
community center building abuts the water and sanitation facility lot lines. To accommodate
this, one meter of walking space has been left behind the Enviro Loo units so that they can be
accessed for maintenance. The units on the northwest side of the lot can be accessed from the
pathway that runs adjacent to the facility.
The residence for the WSS is located in the lower right hand corner of the site. Because of
spatial constraints, a two story building is required. The first floor contains two showers, which
can be accessed by the walkway on the northwest side of the building. The rest of the downstairs
will is used as storage and working space for the WSS. This space provides storage for clean
water buckets, gardening tools, cleaning supplies, and maintenance tools. The second floor
provides 15.5 square meters of living space for the WSS. The entrance of the house is located
between the water taps and the entrance to the facility. This allows the WSS to monitor people
entering and exiting the facility.
55
The community garden is located in the east corner of the site. An area in the corner of the
garden has been reserved for a small structure where waste from the Enviro-Loo can be held for
further composting. The garden would be irrigated from the gray water discharged by the
laundry and dishwashing station, the hand washing sinks, and the two showers. Drip irrigation
would be provided from burial grade PVC piping buried 0.75 meters deep. In order to prevent
clogging of the irrigation system and accelerate infiltration, the trenches should be lined with
gravel before the pipes are laid. The garden area alone provides enough space for 33.5 meters of
irrigation pipes. It was projected that 36 meters of trenches would be needed to allow all water
to seep into the ground. These calculations are shown in Appendix A. The garden has almost
enough space to accommodate for the projected amount of discharge. To provide excess space
for leaching, additional piping can be laid out in the pathway adjacent to the facility.
Figure 25 also shows laundry and dishwashing stations located between the bathroom stalls and
the WSS residence. The hand washing sinks and taps are placed alongside the WSS house, close
to the entrance of the facility. Placing the hand washing sinks in this area reminds bathroom
users to wash their hands when leaving the facility, promoting good hygiene. Having the water
taps close to the entrance also provides convenience for users only entering the facility for water.
The laundry, dishwashing, and hand washing sinks can all be purchased from JoJo tanks or an
equivalent dealer.
The rainwater collection tanks can be purchased from JoJo tanks or an equivalent dealer.
Rainwater is collected and transported from the roofs of the buildings using a gutter system.
Approximately 36 meters of gutter are required.
A fire hydrant has been placed on the northwest side of the lot. Because it is placed along the
pathway, it can not only service the facility, but the surrounding community as well. This
location can be easily identified by firefighters.
In addition to the fire hydrant, other safety features have been proposed as well. One of these is
lighting. The facility would be constantly lit with outdoor spot lights to discourage crime at
night. Additionally, the facility would be enclosed with a fence. The fence ensures that users
only use the intended entrance and exit, making it easier for the WSS to monitor activity. The
fence can be bought from the Eco-beam distributor; it is also made of recycled material. It is
called Eco-fence.
5.1.2.1 Implementation
With the exception of the Enviro Loo units, the facility is designed to be built by the community.
All building structures can be built using Eco-beams and sandbags. The filling and sewing of
sandbags can provide jobs for local residents. All other materials that are purchased, such as the
sinks, tanks, and fence, can still be installed by community members with training and support
from the Shaster Foundation and the Worcester Polytechnic Institute students and faculty. The
walkways and irrigation systems can also be constructed by community members. The only
construction services required by the City of Cape Town would be the water piping connection
to the distribution pipes.

56
When the Enviro Loo units are installed, the manufacturer would provide training for the WSS
and community members. Two to three months later, further training would be provided on how
to correctly maintain the toilets(Parsons, 2009). All other necessary training for the WSS will be
provided by the Shaster Foundation and the City of Cape Town.
5.1.2.2 Indlovu Center Cost Estimation
Funding for this project will be sought through cooperation with the Shaster Foundation,
Worcester Polytechnic Institute, and other partners. The facility design is intended to be low
cost. It is expected that each water and sanitation facility would cost approximately 180,000
Rand (US $19,000) for materials and construction. A detailed cost analysis can be found in
Appendix B.
5.1.3 Possible Variations to the Design
It is understood that not all areas in C Section would have the same design needs as the Indlovu
Center site. One constraint driving the design of any facility is sun exposure. The Enviro Loo
toilets should always be placed in the area of the lot that is facing north. Another constraint for
the facility is space. Figure 26 shows a 3-dimentional rendering of the facility. Because excess
space is unavailable, the facility is compact and thus changes to the design are limited.
Figure 26: Facility Variation
A sample variation of the design is provided in Figure 27. As shown, the top of the drawing is
facing north and therefore the toilets have been placed on that side of the facility. This design

57
provides the same number of toilets, laundry and dishwashing sinks, hand washing sinks, and
taps, and the WSS residence is the same size. The garden has one square foot less of area. The
rainwater collection tanks have been increased to 2,250 liters each. There could also be a roof
covering the laundry and dishwashing station for protection from rain and sun.
Figure 27: Alternative Layout for Water and Sanitation Facility
Other variations can be made to the facility design. For instance, if a community decides that
they dislike the showers, they can be either removed or replaced by a sponge bathing area.
Conversely, if the community plans on using the showers more frequently, more drainage area
may be needed to accommodate the increase in the water discharge. This can be done by placing
additional piping under the walkways. If additional drainage area is needed, space may need to
be acquired from abutting lots or public paths.
5.2 Future Construction
The water and sanitation facility should help to alleviate the water and sanitation deficiencies in
Monwabisi Park, Cape Town, South Africa. If multiple facilities are installed across the
informal settlement, the goal of providing basic water and sanitation services is attainable. If 40
families are serviced by each water and sanitation facility, C Section in Monwabisi Park can be

58
fully serviced by 33 facilities. Before this can happen however, the seed facility near the Indlovu
Center still needs to be constructed and re-evaluated. Modifications can be made to increase the
success of future facilities before they are installed. Chapter 6 provides recommendations for
continuing the work to implement the Indlovu Center Facility and other future facilities in
Monwabisi Park.
59
6 Recommendations
This chapter contains recommendations for work to continue this project. There is much more to
accomplish to remedy the shortfall of water and sanitation services in Monwabisi Park beyond
the scope of this single facility and the small portion of the community it will service. The
recommendations are intended to ensure the success of the facility installed near the Indlovu
Center, and also to eventually provide complete water and sanitation services across Monwabisi
Park.
No soil percolation tests were completed during the design process because of resource
constraints. The only information available during the design process was an observation that
the soil was “sandy.” Because of this, conservative values for infiltration rates for an average
“sandy” soil were used. However, soils are highly variable and thus it is critical that soil
percolation tests are done to confirm the minimum area required for the leaching field size,
especially under winter saturation conditions.
In the past, no public toilets have been available for use by passersby or other visitors to the
facility. If people without key access needed to use a toilet facility, they were unable to. Some
would break the locks off existing toilets to gain access. If a toilet were available, it is less likely
that a passerby would break the locks off the toilet stalls. Furthermore, if a friend from another
part of the township accompanied someone who had toilet access to do laundry, they would both
be able to use toilets. A public toilet should therefore be available at every facility.
Currently, there is no method of heating hot water for use in the facility, especially for
showering. One option for this is to run an electricity services line to the facility to run an
electric heater. A second option is to add a propane or liquefied natural gas burner to heat the
water. A third option is to install solar panels on the roof of the building to capture energy,
which could be used to heat the water. Of these options, solar heating may be the best solution
in the long-term, but solar panels can have a high upfront cost. Additionally, solar panels will
not work as well in cloudy weather and may need to be supplemented by gas heating. An
evaluation of these three methods (and perhaps other methods) should be completed to choose
the best solution for heating the water.
Lighting for the facility could ensure greater safety for residents who use the facility at night. At
the very least, people are likely to feel safer if they can see the environment around them as they
walk to, around, and from the facility. The water and sanitation facility would not be as effective
in improving public health if people are uncomfortable or unwilling to frequent it after dark. If
lighting were installed, people may consider using the facility at night that otherwise would not
have used it. This, of course, would require a source of electricity, which is available at the
Indlovu Center. If the water heating source could be combined with the source of electricity
used to provide light, it may prove cost efficient to light the facility.
These water and sanitation facilities include new technologies and promote new hygiene
practices. Understanding how to use and maintain the new or unfamiliar features like the
showers in the facility can promote their use. Knowledge of each feature can also prevent

60
misuse, which could damage the apparatus. Because of this, an education program should be
available for community members to learn about their new water and sanitation facility.
Lastly, and perhaps most importantly, this facility was designed to be replicable and installed
multiple times across Monwabisi Park. After the seed facility is built, it will be important to
study what has worked well and what aspects of the facility need improvements to meet
community needs. Modifying the facility design based on feedback from Monwabisi Park
residence before another facility is installed will ensure community-wide success for the water
and sanitation development plan.

61
Bibliography
Abahlali baseMjondolo of the Western Cape. (2008). RE: MEMORANDUM TO THE MAYOR
OF CITY OF CAPE TOWN. Retrieved November 19, 2008, from Khayelitsha Struggles:
http://www.khayelitshastruggles.com/search/label/Memorandum%20to%20City%20of%
20Cape%20Town
About.com. (n.d.). Southern African Independence . Retrieved January 20, 2009, from
http://africanhistory.about.com/library/bl/bl-Independence-SA2.htm
Agency, C. I. (2009, January 22). The World Factbook. Retrieved January 20, 2009, from
https://www.cia.gov/library/publications/the-world-factbook/geos/sf.html
Alex, L., Cusack, J., Mills, A., & Sosa, A. (2007). Design and Construction of a Communal
Laundry Station in Monwabisi Park, Cape Town.
Amanzi Obom Consulting cc. (2008). Water Services Development Plan of 2008/09 to 2012/13.
City of Cape Town.
American Shower & Bath® Corner Entry Shower Kit (401060. (n.d.). Retrieved April 21, 2009,
from ACE: http://www.acehardware.com/product/index.jsp?productId=3077134
Aussie Things. (2005). Hybrid Toilet System. Retrieved February 1, 2009, from Austrailian
Inventions and Products: http://www.aussiethings.biz/hybrid_toilet_system.html
Belzak, B. (2006, December). The Amazing ELOO Toilet. Retrieved February 4, 2009, from
Rapid River Magazine: http://www.thegreenerhome.com/index.php/105
Berner, I., Hoffman, B., & Spangenberg, K. (2004). The Development of Monwabisi. Retrieved
November 23, 2008, from Agenda 21 Partnership Cape Town: http://www.aachen-
kapstadt.de/projekte/asa_project_study_monwabisi.pdf
Biolytix. (n.d.). Retrieved Februrary 1, 2009, from Biolytix Water Naturally:
http://www.biolytix.com/detail.php?ID=69
Biolytix. (n.d.). Retrieved February 1, 2009, from Biolytix Southern Africa:
http://www.biolytix.co.za/index.php/how-biolytix-works/
BuaNews. (2004). Khayelitsha receives R60m for renewal. Retrieved December 3, 2008, from
Polity.org.za: http://www.polity.org.za/article.php?a_id=54338
Cape Metropolitan Council. (2001). Housing Program in the Cape Metropolitan Area. Retrieved
December 22, 2008, from The Cities Alliance:
http://www.citiesalliance.org/caupgrading.nsf/344596527cc8a1e78525682500717a62/53
33b35ea0f6ae87862569fc007b2a56!OpenDocument
Centers for Disease Control and Prevention. (2008). Retrieved December 3, 2008, from Malaria:
http://www.cdc.gov/malaria/
Centers for Disease Control and Prevention. (2008). Retrieved December 3, 2008, from Cholera:
http://www.cdc.gov/nczved/dfbmd/disease_listing/cholera_gi.html
Central Vacuum PVC Pipe. (n.d.). Retrieved April 21, 2009, from Smarter:
http://www.smarter.com/vacuum-cleaner-accessories/central-vacuum-pvc-pipe/pd--ch-
32--pi-14103763.html
City of Cape Town. (2001). Retrieved December 3, 2008, from
http://www.capetown.gov.za/en/Water/WaterservicesDevPlan/Documents/chapter3_Cust
om_Profile.pdf
City of Cape Town. (2007). Retrieved December 16, 2008, from Annual Report:
http://www.capetown.gov.za/en/Reports/Documents/Executive%20Summary%20Annual
%20Report%200607.pdf

62
City of Cape Town. (2008). City of Cape Town Statistics. Retrieved November 23, 2008, from
Strategic Development Information and GIS:
http://www.capetown.gov.za/en/stats/Documents/City%20stats%20summary%20page.ht
m
City of Cape Town. (2008). Water and Sanitation Service Standard. Cape Town, South Africa.
City Visiting Informal Settlements at Khayelitsha. (2008). Retrieved November 19, 2008, from
Khaylitsha Struggles: http://www.khayelitshastruggles.com/2008/10/city-visiting-
informal-settlements-at.html
Clean Up America. (n.d.). Eloo Frequently Asked Questions. Retrieved February 4, 2009, from
http://www.eloo.us/faq.htm
Disaster Mitigation for Sustainable Livelihoods Programme. (2006). Report of the Community
Risk Assessment Workshop for TR-Section in Site B-Khayelitsha. University of Cape
Town.
Donkor, S. M. (2003). Development Challenges of Water Resource Management in Africa.
African Water Journal , 1-18.
Feachem, R. E., Bradley, D. J., Garelick, H., & Mara, D. D. (1983). Sanitation and Disease:
Health and Aspects of Excreta and Wastewater Management. New York: John Wiley and
Sons.
FitzPatrick, T. (2004, December 4). VOANews.com. Retrieved April 20, 2009, from South Africa
Experiments With Houses Made of Sand :
http://www.voanews.com/english/archive/2008-12/2008-12-04-voa11.cfm
Gough Plastics. (2007). Overview. Retrieved February 1, 2009, from Hybrid Toilet System:
http://www.gough.com.au/hts/commercial/overview.asp#top
Granfone, M., Lizewski, C., & Olecki, D. (2008). Water and Sanitation. WPI.
Green Building. (2007). "New Eco-Cottages to Replace Shacks". Retrieved December 4, 2008,
from http://www.greenbuilding.co.za/index.php/Vol1-Issue2/The-Shaster-Foundation-
New-Eco-Cottages-to-Replace-Shacks.html.
Hawke, D. (2009, February). Biolytix Personal Communication.
Information and Knowledge Management Department. (2005). A Population Profile of
Khayelitsha. Cape Town: 2001 Census.
Josie, J. (2008). The Intergovernmental Context of Municipal Infrastructure Grants in South
Africa. University of Western Cape: School of Government.
LennTech Water Treatment. (2008). Water Borne Diseases. Retrieved November 24, 2008, from
LennTech: http://www.lenntech.com/Waterborne-diseases/waterborne-diseases.htm
Loots, L. J. (2004). Equity and the Local Government Equitable Share in South Africa. South
Africa.
Matthews, S. (2005, July/August). What next for Western Cape Water? The Water Wheel , pp.
20-21.
Morris, M. (2006). Cape Town Population Growth Set to Fall. Retrieved December 22, 2008,
from International Online:
http://www.iol.co.za/index.php?set_id=1&click_id=13&art_id=vn20060608104309581C
142828
Muanda, C., & Lagardien, A. (2008). Investigating Greywater Disposal Options in an Informal
Settlement. Bellville: Water Institute of SA.
Muller, J. (2009, March). Personal Communication.

63
Ndingaye, X. Z. (2005). An Evaluation of the Effects of Poverty in Khayelitsha: A Case Study of
Site C. Bellville, South Africa: University of Western Cape.
Nkuna, B. (2008). AbM: Shack dwellers march on Khayelitsha local gvt offices. Retrieved
November 19, 2008, from Western Cape Anti-Eviction Campaign:
http://antieviction.org.za/2008/11/04/abm-shack-dwellers-march-on-khayelitsha-local-
gvt-offices/#more-1242
Obasi, G. (2003). Foreword. African Water Journal , v-vi.
Parsons, L. (2009, March). Enviro Loo Personal Communications.
Perks, S. (2009, February 9). Personal Communication (Electronic).
Phaliso, S., & Naidoo, Y. (2008). Police, residents clash over illegal electricity connections. City
Press .
Poni, M. (2008). Upgrading of Informal Settlements. Retrieved from Khayelitsha Struggles:
http://www.khayelitshastruggles.com/2008/10/upgrading-of-informal-settlements.html
Ritztrade International. (2008). Cape Town Weather and Climate. Retrieved November 23, 2008,
from The Internet Guide to Cape Town: http://www.cape-town.info/south-africa-weather-
climate/
SA Biotech. (2008). Hybrid Toilet System. Retrieved February 1, 2009, from SA Biotech
Watersmart Sanitation Solutions:
http://www.sabiotech.co.za/Solutions/hybridtoiletsys.htm
Seeger, E., & Strobes, J. (2008). Hybrid Toilet System Test Report. Groenkloof, Pretoria, South
Africa: SABS Commercial (Pty) Ltd.
Shaster Foundation. (2008). "The Shaster Foundation". Retrieved December 4, 2008, from
http://www.shaster.org.za/old/index.htm
Shell Global. (n.d.). Case study: Improving paraffin safety in South Africa. Retrieved December
2, 2008, from Responsible Energy:
http://www.shell.com/home/content/responsible_energy/environment/responsible_produc
ts/case_study_south_africa/case_study_sa_000407.html
Smith, L. (n.d.). Retrieved December 3, 2008, from
http://www.queensu.ca/msp/pages/Project_Publications/Papers/Water.pdf
South African Weather Service. (2003). Climate Data for Cape Town. Retrieved November 23,
2008, from http://www.weathersa.co.za/Climat/Climstats/CapeTownStats.jsp
Stanford. (n.d.). The History of Apartheid in South Africa. Retrieved from http://www-cs-
students.stanford.edu/~cale/cs201/apartheid.hist.html
UNESCO. (n.d.). Case Studies: An Overview. Retrieved November 24, 2008, from
http://www.unesco.org/water/wwap/wwdr/wwdr2/pdf/wwdr2_ch_14.pdf
WebMD. (2008). Retrieved December 3, 2008, from Cholera: http://www.webmd.com/a-to-z-
guides/cholera-11156
Weekes, A. (2002). Retrieved December 3, 2008, from
http://www.queensu.ca/msp/pages/Project_Publications/News/flush.htm
Wiley, D., & Kornbluh, M. L. (2006). Forced Removals. Retrieved December 21, 2008, from
South Africa: Overcoming Apartheid, Building Democracy:
http://overcomingapartheid.msu.edu/multimedia.php?id=5
Womersley, D. (2008-2009, October - April). Personal Communication.
World Health Organization. (1996). Fact Sheet No. 112: Water and Sanitation. Geneva: WHO.
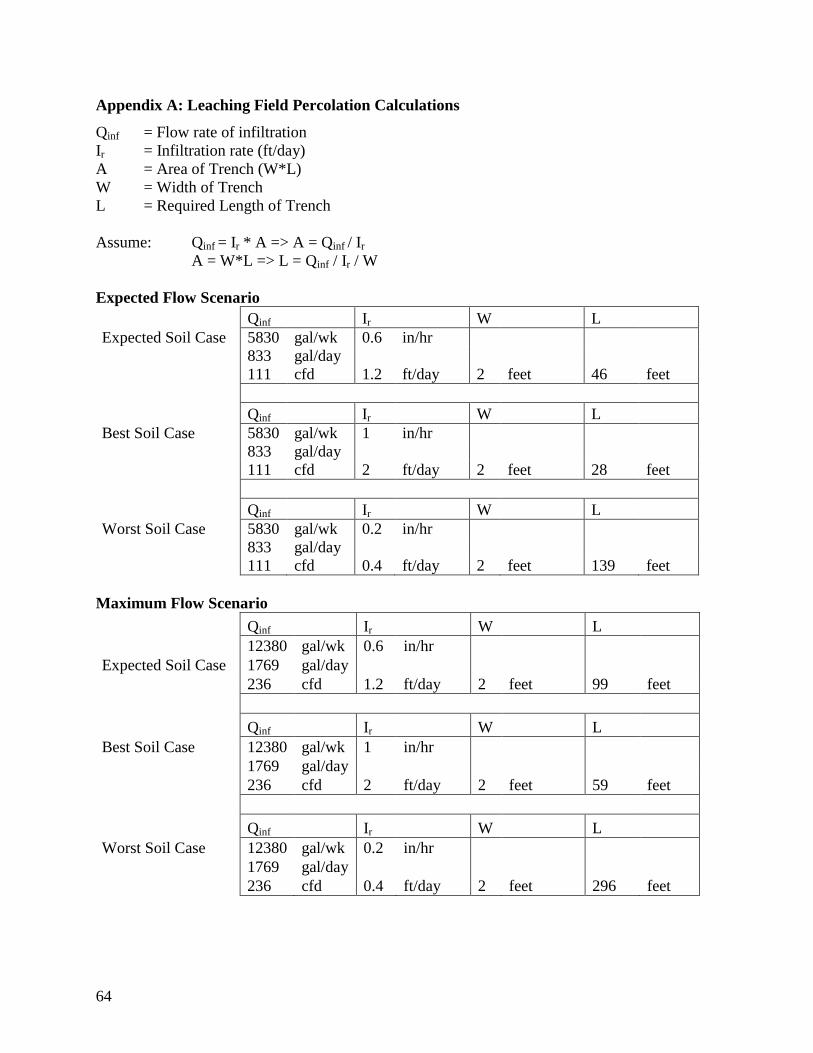
64
Appendix A: Leaching Field Percolation Calculations
Qinf = Flow rate of infiltration
Ir = Infiltration rate (ft/day)
A = Area of Trench (W*L)
W = Width of Trench
L = Required Length of Trench
Assume: Qinf = Ir * A => A = Qinf / Ir
A = W*L => L = Qinf / Ir / W
Expected Flow Scenario
Qinf Ir W L
Expected Soil Case 5830 gal/wk 0.6 in/hr
833 gal/day
111 cfd 1.2 ft/day 2 feet 46 feet
Qinf Ir W L
Best Soil Case 5830 gal/wk 1 in/hr
833 gal/day
111 cfd 2 ft/day 2 feet 28 feet
Qinf Ir W L
Worst Soil Case 5830 gal/wk 0.2 in/hr
833 gal/day
111 cfd 0.4 ft/day 2 feet 139 feet
Maximum Flow Scenario
Qinf Ir W L
12380 gal/wk 0.6 in/hr
Expected Soil Case 1769 gal/day
236 cfd 1.2 ft/day 2 feet 99 feet
Qinf Ir W L
Best Soil Case 12380 gal/wk 1 in/hr
1769 gal/day
236 cfd 2 ft/day 2 feet 59 feet
Qinf Ir W L
Worst Soil Case 12380 gal/wk 0.2 in/hr
1769 gal/day
236 cfd 0.4 ft/day 2 feet 296 feet

65
Appendix B: Facility Cost Analysis
The following table shows a preliminary cost analysis for the water and sanitation facility. There
are no operation and maintenance fees.
Item
Number
of Items Price/Item(Rand) Total (Rand) Total (US)
Enviro Loo Toilet1 8 5,170 41,360 4,362
Enviro Loo Accessories2 8 125 1,000 105
Tanks3 2 3,000 6,000 633
Shower4 2 3,414 6,827 720
Double Basin Sinks5 12 1,000 12,000 1,266
Taps6 2 900 1,800 190
Pipes7 6 332 1,992 210
Water and Sanitation House8 1 90,860 90,860 9,582
Capital Cost: 161,839 17,068
Attendant Yearly Salary9 1 18,000 18,000 1,898
Annual Facility Price
10 26,092 2,752
Annual Price per Family
11 652 69
1 (Parsons, 2009)
2 Includes Anchoring Device and Overflow Connector
3 Price Estimated from 2500 L Horizontal Tank (R4712) from Jojo Tanks
4 Price Estimated from American Shower and Bath ® Entry Shower Kit (American Shower &
Bath® Corner Entry Shower Kit (401060) 5 For Hand washing, Laundry and Dishwashing Station (Alex et al., 2007)
6 (Muller, 2009)
7 Price Estimated from 64’ American PVC Piping (Central Vacuum PVC Pipe)
8 Price for 2 Floor Eco Beam House (54 m
2); Includes Living Room, Kitchen, Bath, 2 Bedrooms,
Balcony (FitzPatrick, 2004) 9 (Granfone, Lizewski, & Olecki, 2008)
10 Assume a 20-year facility lifespan
11 Assume 40 families use facilities


