Chapter 14Annexes

96 14. Annex 1
A. Classification of EEE under the ten categories (EU-10) set out in Annex I to the WEEE Directive 2012/19/EU15
EU-10 Full name
1 Large household appliances
2 Small household appliances
3 IT and telecommunications equipment
4 Consumer equipment and photovoltaic panels
5 Lighting equipment
6 Electrical and electronic tools
7 Toys, leisure, and sports equipment
8 Medical devices
9 Monitoring and control instruments
10 Automatic dispensers
B. Classification of EEE under the six categories (EU-6) set out in Annex III to the WEEE Directive 2012/19/EU
EU-10 Full name
1 Temperature exchange equipment
2 Screens, monitors, and equipment containing screens (..)
3 Lamps
4 Large equipment
5 Small equipment
6 Small IT and telecommunication equipment
Annex 1
9714. Annex 1
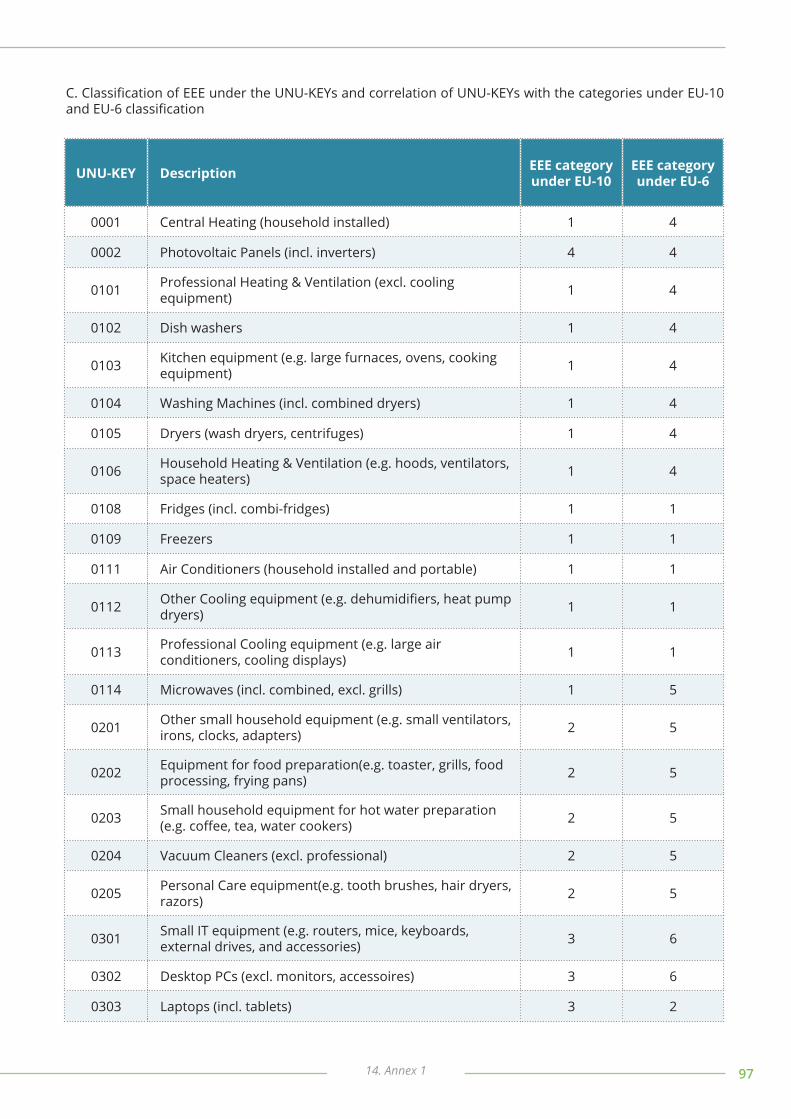
C. Classification of EEE under the UNU-KEYs and correlation of UNU-KEYs with the categories under EU-10 and EU-6 classification
UNU-KEY Description EEE category under EU-10
EEE category under EU-6
0001 Central Heating (household installed) 1 4
0002 Photovoltaic Panels (incl. inverters) 4 4
0101 Professional Heating & Ventilation (excl. cooling equipment) 1 4
0102 Dish washers 1 4
0103 Kitchen equipment (e.g. large furnaces, ovens, cooking equipment) 1 4
0104 Washing Machines (incl. combined dryers) 1 4
0105 Dryers (wash dryers, centrifuges) 1 4
0106 Household Heating & Ventilation (e.g. hoods, ventilators, space heaters) 1 4
0108 Fridges (incl. combi-fridges) 1 1
0109 Freezers 1 1
0111 Air Conditioners (household installed and portable) 1 1
0112 Other Cooling equipment (e.g. dehumidifiers, heat pump dryers) 1 1
0113 Professional Cooling equipment (e.g. large air conditioners, cooling displays) 1 1
0114 Microwaves (incl. combined, excl. grills) 1 5
0201 Other small household equipment (e.g. small ventilators, irons, clocks, adapters) 2 5
0202 Equipment for food preparation(e.g. toaster, grills, food processing, frying pans) 2 5
0203 Small household equipment for hot water preparation (e.g. coffee, tea, water cookers) 2 5
0204 Vacuum Cleaners (excl. professional) 2 5
0205 Personal Care equipment(e.g. tooth brushes, hair dryers, razors) 2 5
0301 Small IT equipment (e.g. routers, mice, keyboards, external drives, and accessories) 3 6
0302 Desktop PCs (excl. monitors, accessoires) 3 6
0303 Laptops (incl. tablets) 3 2
98 14. Annex 1
UNU-KEY Description EEE category under EU-10
EEE category under EU-6
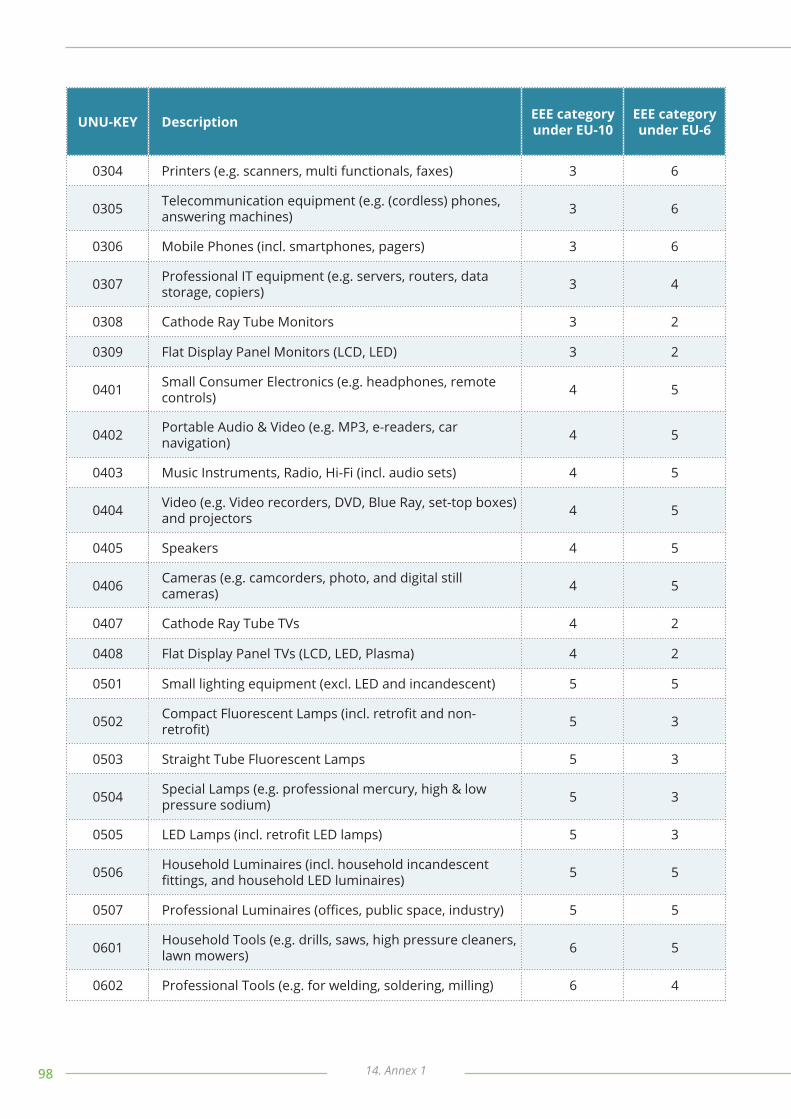
0304 Printers (e.g. scanners, multi functionals, faxes) 3 6
0305 Telecommunication equipment (e.g. (cordless) phones, answering machines) 3 6
0306 Mobile Phones (incl. smartphones, pagers) 3 6
0307 Professional IT equipment (e.g. servers, routers, data storage, copiers) 3 4
0308 Cathode Ray Tube Monitors 3 2
0309 Flat Display Panel Monitors (LCD, LED) 3 2
0401 Small Consumer Electronics (e.g. headphones, remote controls) 4 5
0402 Portable Audio & Video (e.g. MP3, e-readers, car navigation) 4 5
0403 Music Instruments, Radio, Hi-Fi (incl. audio sets) 4 5
0404 Video (e.g. Video recorders, DVD, Blue Ray, set-top boxes) and projectors 4 5
0405 Speakers 4 5
0406 Cameras (e.g. camcorders, photo, and digital still cameras) 4 5
0407 Cathode Ray Tube TVs 4 2
0408 Flat Display Panel TVs (LCD, LED, Plasma) 4 2
0501 Small lighting equipment (excl. LED and incandescent) 5 5
0502 Compact Fluorescent Lamps (incl. retrofit and non-retrofit) 5 3
0503 Straight Tube Fluorescent Lamps 5 3
0504 Special Lamps (e.g. professional mercury, high & low pressure sodium) 5 3
0505 LED Lamps (incl. retrofit LED lamps) 5 3
0506 Household Luminaires (incl. household incandescent fittings, and household LED luminaires) 5 5
0507 Professional Luminaires (offices, public space, industry) 5 5
0601 Household Tools (e.g. drills, saws, high pressure cleaners, lawn mowers) 6 5
0602 Professional Tools (e.g. for welding, soldering, milling) 6 4

9914. Annex 1
UNU-KEY Description EEE category under EU-10
EEE category under EU-6
0701 Toys (e.g. car racing sets, electric trains, music toys, biking computers, drones) 7 5
0702 Game Consoles 7 6
0703 Leisure equipment (e.g. sports equipment, electric bikes, juke boxes) 7 4
0801 Household Medical equipment(e.g. thermometers, blood pressure meters) 8 5
0802 Professional Medical equipment (e.g. hospital, dentist, diagnostics) 8 4
0901 Household Monitoring & Control equipment (alarm, heat, smoke, excl. screens) 9 5
0902 Professional Monitoring & Control equipment (e.g. laboratory, control panels) 9 4
1001 Non- cooled Dispensers (e.g. for vending, hot drinks, tickets, money) 10 4
1002 Cooled Dispensers (e.g. for vending, cold drinks) 10 1
100 14. Annex 2
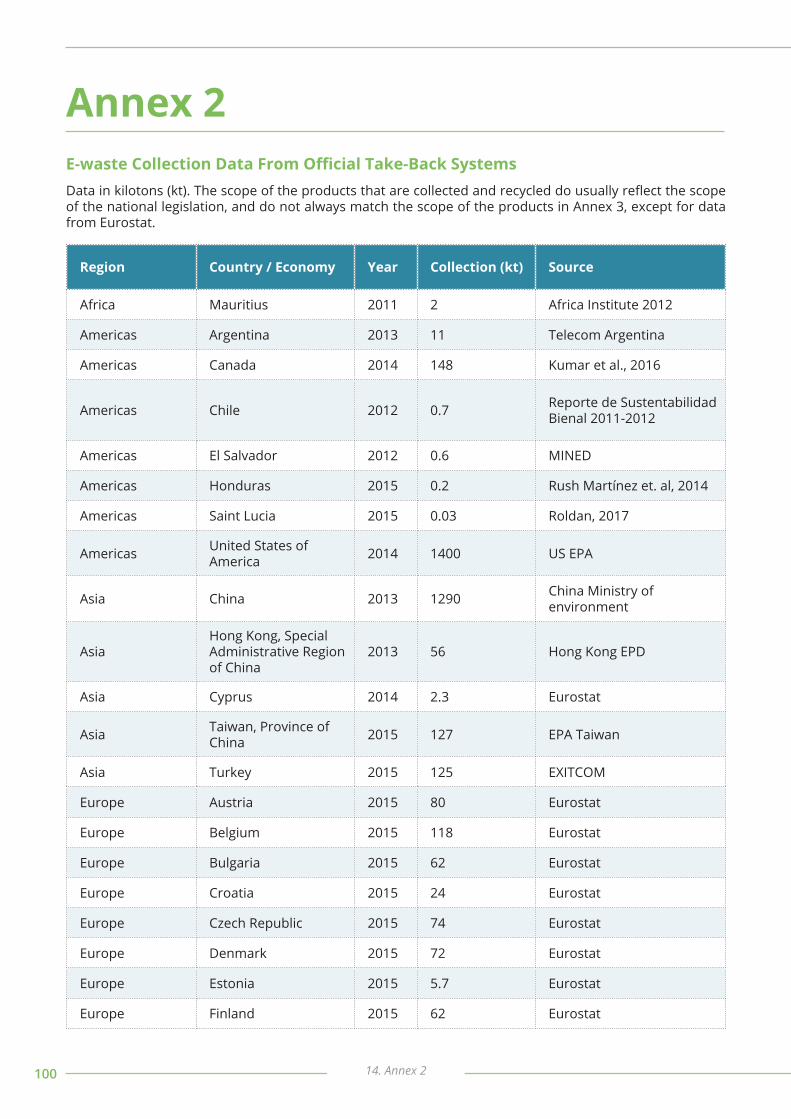
E-waste Collection Data From Official Take-Back Systems
Annex 2
Data in kilotons (kt). The scope of the products that are collected and recycled do usually reflect the scope of the national legislation, and do not always match the scope of the products in Annex 3, except for data from Eurostat.
Region Country / Economy Year Collection (kt) Source
Africa Mauritius 2011 2 Africa Institute 2012
Americas Argentina 2013 11 Telecom Argentina
Americas Canada 2014 148 Kumar et al., 2016
Americas Chile 2012 0.7 Reporte de Sustentabilidad Bienal 2011-2012
Americas El Salvador 2012 0.6 MINED
Americas Honduras 2015 0.2 Rush Martínez et. al, 2014
Americas Saint Lucia 2015 0.03 Roldan, 2017
Americas United States of America 2014 1400 US EPA
Asia China 2013 1290 China Ministry of environment
AsiaHong Kong, Special Administrative Region of China
2013 56 Hong Kong EPD
Asia Cyprus 2014 2.3 Eurostat
Asia Taiwan, Province of China 2015 127 EPA Taiwan
Asia Turkey 2015 125 EXITCOM
Europe Austria 2015 80 Eurostat
Europe Belgium 2015 118 Eurostat
Europe Bulgaria 2015 62 Eurostat
Europe Croatia 2015 24 Eurostat
Europe Czech Republic 2015 74 Eurostat
Europe Denmark 2015 72 Eurostat
Europe Estonia 2015 5.7 Eurostat
Europe Finland 2015 62 Eurostat
10114. Annex 2
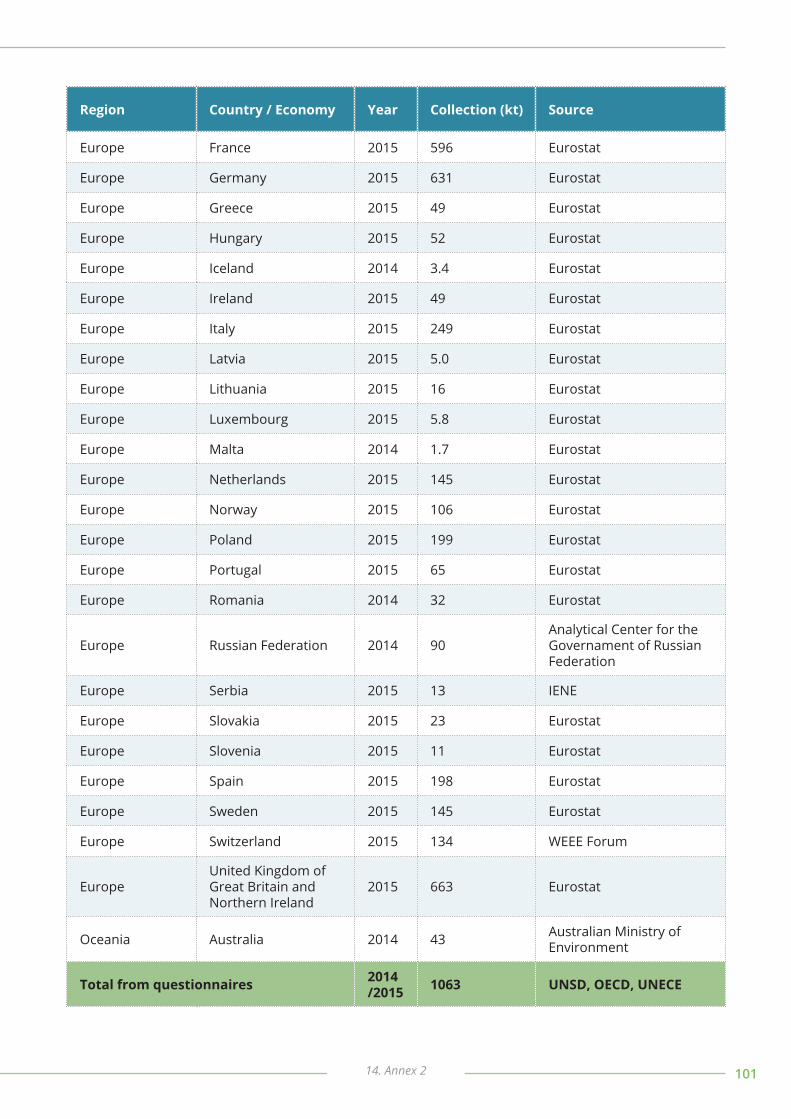
Region Country / Economy Year Collection (kt) Source
Europe France 2015 596 Eurostat
Europe Germany 2015 631 Eurostat
Europe Greece 2015 49 Eurostat
Europe Hungary 2015 52 Eurostat
Europe Iceland 2014 3.4 Eurostat
Europe Ireland 2015 49 Eurostat
Europe Italy 2015 249 Eurostat
Europe Latvia 2015 5.0 Eurostat
Europe Lithuania 2015 16 Eurostat
Europe Luxembourg 2015 5.8 Eurostat
Europe Malta 2014 1.7 Eurostat
Europe Netherlands 2015 145 Eurostat
Europe Norway 2015 106 Eurostat
Europe Poland 2015 199 Eurostat
Europe Portugal 2015 65 Eurostat
Europe Romania 2014 32 Eurostat
Europe Russian Federation 2014 90Analytical Center for the Governament of Russian Federation
Europe Serbia 2015 13 IENE
Europe Slovakia 2015 23 Eurostat
Europe Slovenia 2015 11 Eurostat
Europe Spain 2015 198 Eurostat
Europe Sweden 2015 145 Eurostat
Europe Switzerland 2015 134 WEEE Forum
EuropeUnited Kingdom of Great Britain and Northern Ireland
2015 663 Eurostat
Oceania Australia 2014 43 Australian Ministry of Environment
Total from questionnaires 2014 /2015 1063 UNSD, OECD, UNECE
102 14. Annex 3
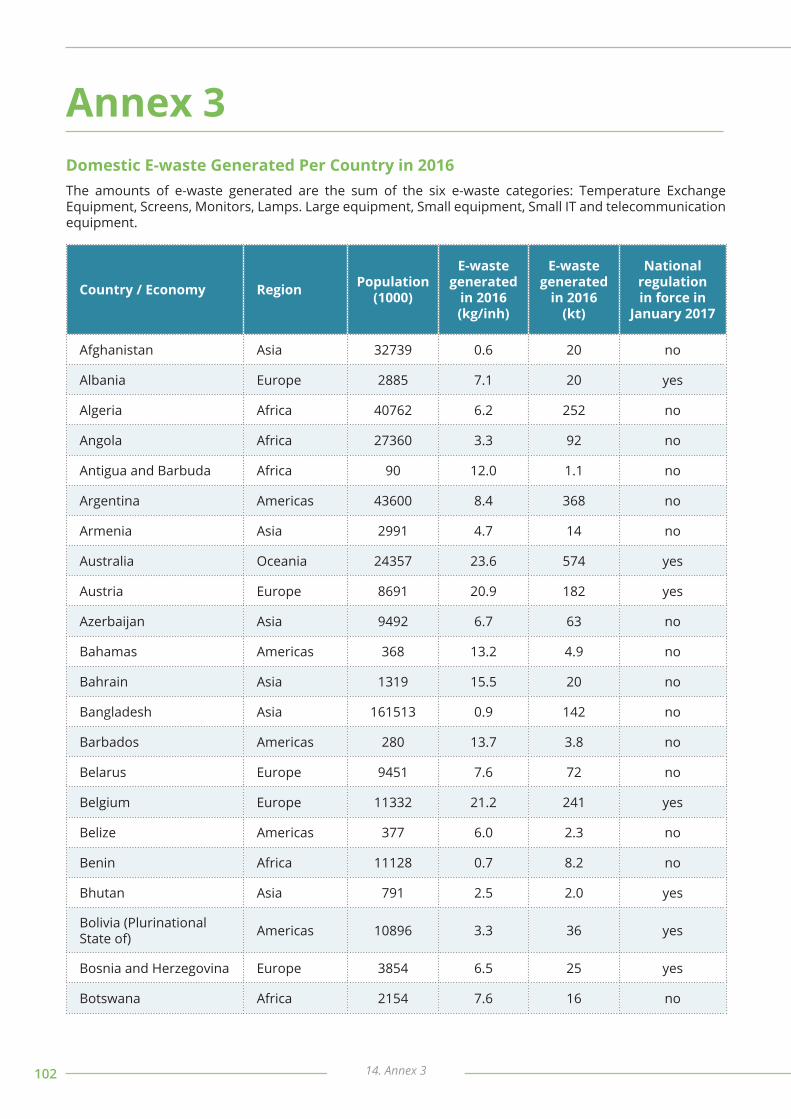
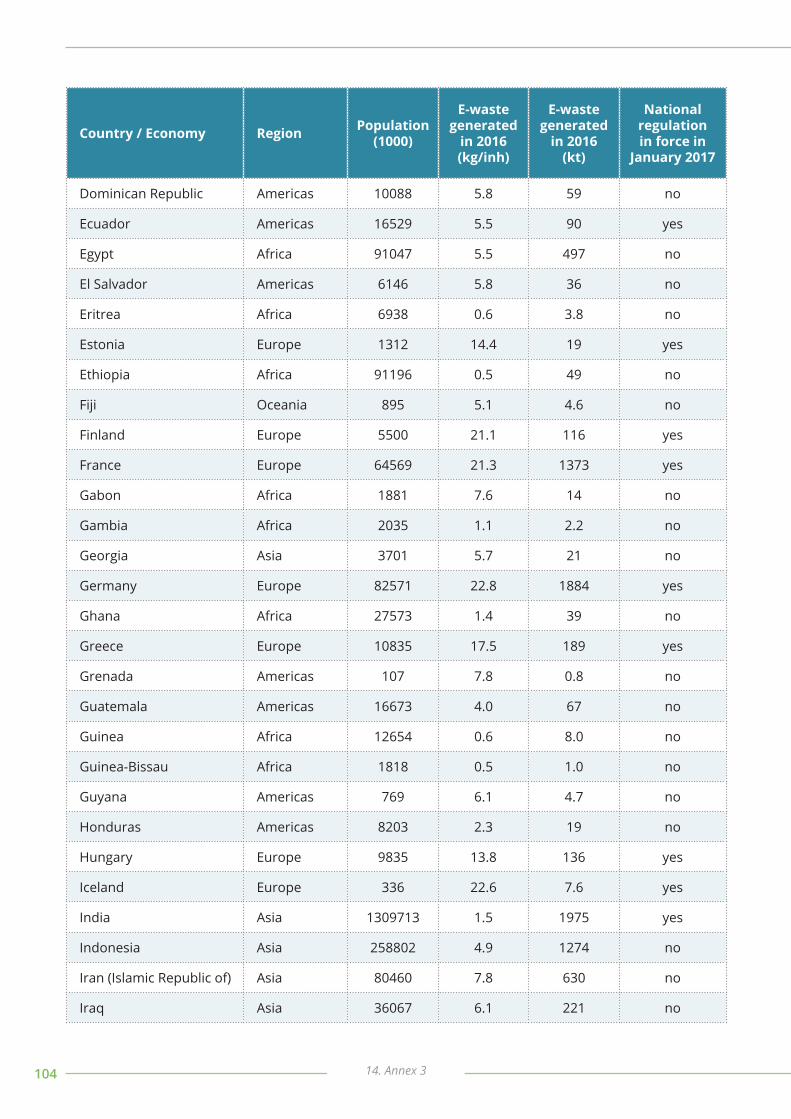
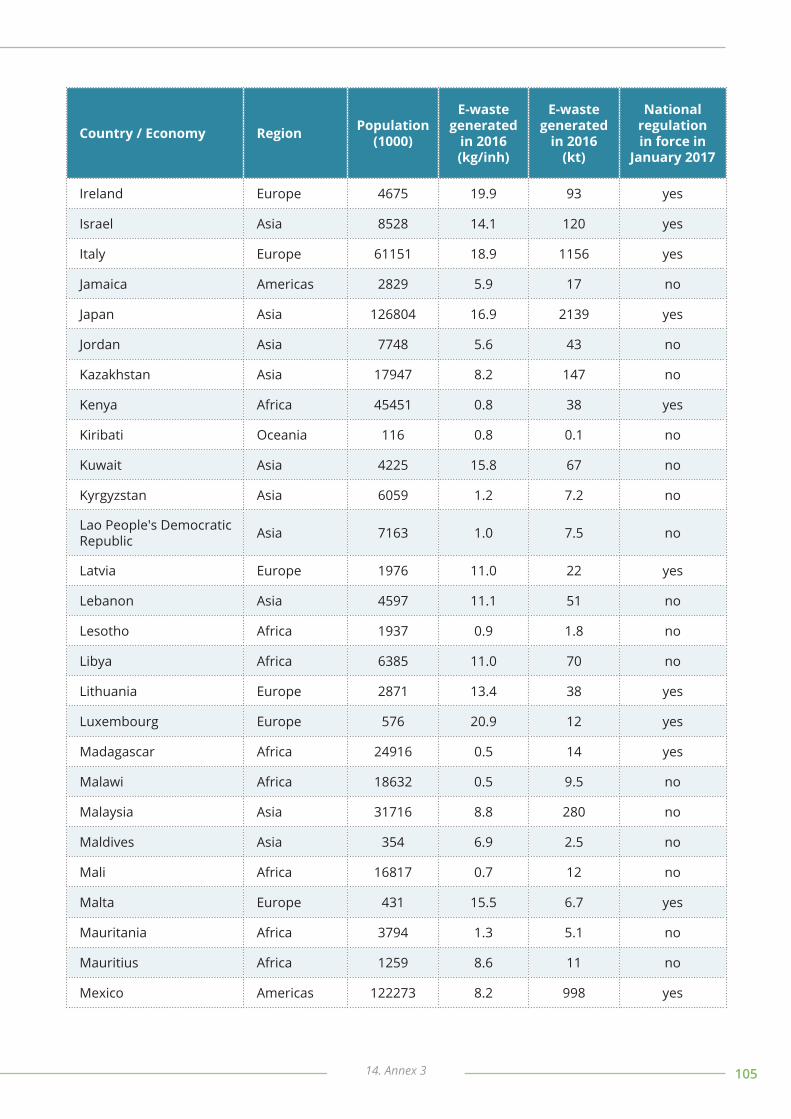
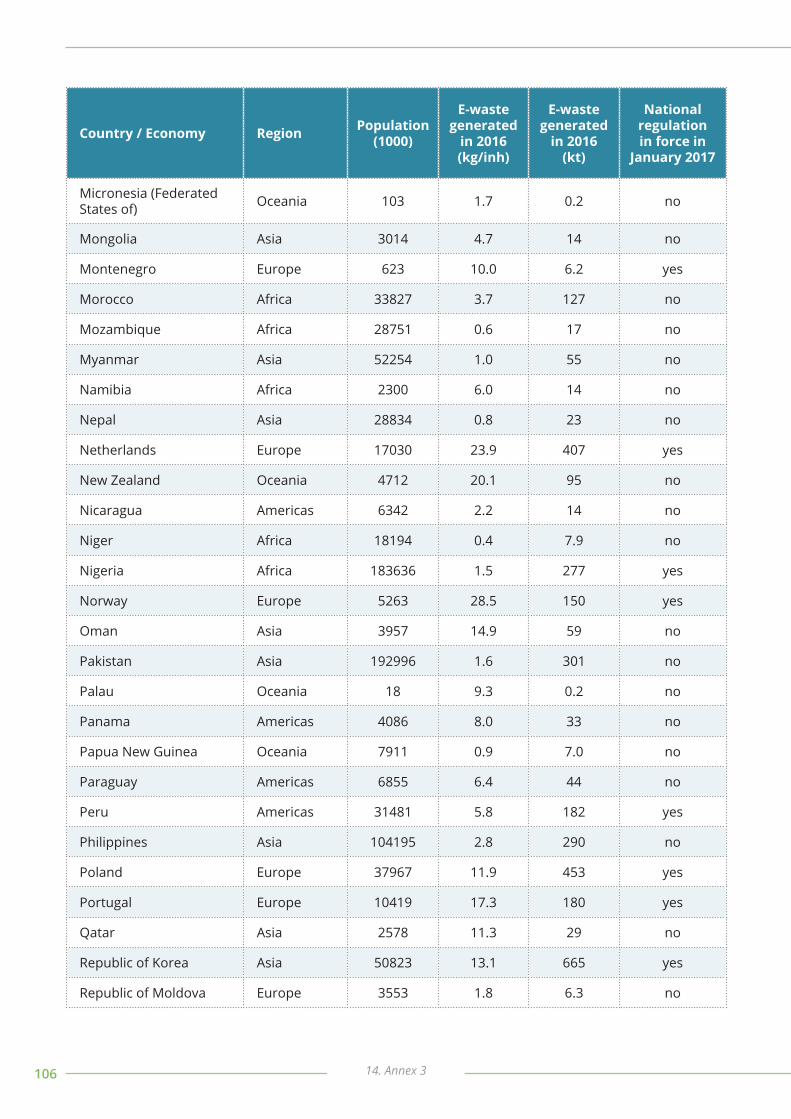
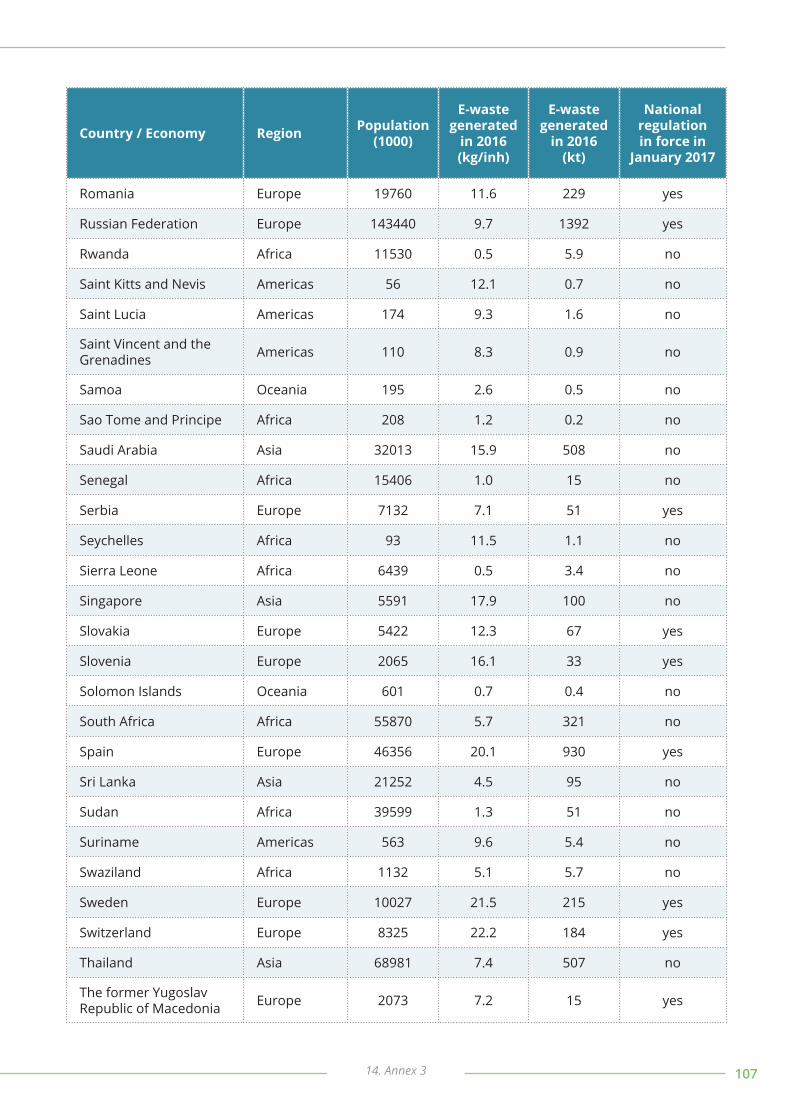
Domestic E-waste Generated Per Country in 2016
Country / Economy Region Population (1000)
E-waste generated
in 2016(kg/inh)
E-waste generated
in 2016(kt)
National regulation in force in
January 2017
Afghanistan Asia 32739 0.6 20 no
Albania Europe 2885 7.1 20 yes
Algeria Africa 40762 6.2 252 no
Angola Africa 27360 3.3 92 no
Antigua and Barbuda Africa 90 12.0 1.1 no
Argentina Americas 43600 8.4 368 no
Armenia Asia 2991 4.7 14 no
Australia Oceania 24357 23.6 574 yes
Austria Europe 8691 20.9 182 yes
Azerbaijan Asia 9492 6.7 63 no
Bahamas Americas 368 13.2 4.9 no
Bahrain Asia 1319 15.5 20 no
Bangladesh Asia 161513 0.9 142 no
Barbados Americas 280 13.7 3.8 no
Belarus Europe 9451 7.6 72 no
Belgium Europe 11332 21.2 241 yes
Belize Americas 377 6.0 2.3 no
Benin Africa 11128 0.7 8.2 no
Bhutan Asia 791 2.5 2.0 yes
Bolivia (Plurinational State of) Americas 10896 3.3 36 yes
Bosnia and Herzegovina Europe 3854 6.5 25 yes
Botswana Africa 2154 7.6 16 no
Annex 3
The amounts of e-waste generated are the sum of the six e-waste categories: Temperature Exchange Equipment, Screens, Monitors, Lamps. Large equipment, Small equipment, Small IT and telecommunication equipment.
10314. Annex 3
Country / Economy Region Population (1000)
E-waste generated
in 2016(kg/inh)
E-waste generated
in 2016(kt)
National regulation in force in
January 2017
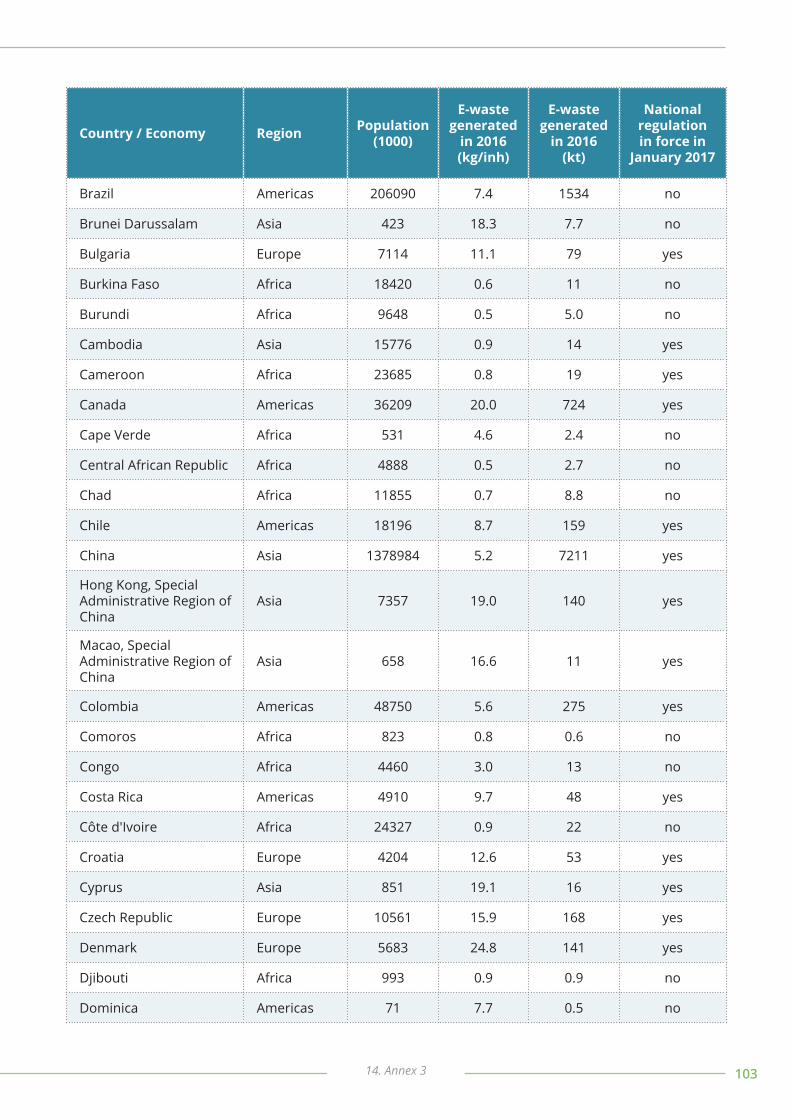
Brazil Americas 206090 7.4 1534 no
Brunei Darussalam Asia 423 18.3 7.7 no
Bulgaria Europe 7114 11.1 79 yes
Burkina Faso Africa 18420 0.6 11 no
Burundi Africa 9648 0.5 5.0 no
Cambodia Asia 15776 0.9 14 yes
Cameroon Africa 23685 0.8 19 yes
Canada Americas 36209 20.0 724 yes
Cape Verde Africa 531 4.6 2.4 no
Central African Republic Africa 4888 0.5 2.7 no
Chad Africa 11855 0.7 8.8 no
Chile Americas 18196 8.7 159 yes
China Asia 1378984 5.2 7211 yes
Hong Kong, Special Administrative Region of China
Asia 7357 19.0 140 yes
Macao, Special Administrative Region of China
Asia 658 16.6 11 yes
Colombia Americas 48750 5.6 275 yes
Comoros Africa 823 0.8 0.6 no
Congo Africa 4460 3.0 13 no
Costa Rica Americas 4910 9.7 48 yes
Côte d'Ivoire Africa 24327 0.9 22 no
Croatia Europe 4204 12.6 53 yes
Cyprus Asia 851 19.1 16 yes
Czech Republic Europe 10561 15.9 168 yes
Denmark Europe 5683 24.8 141 yes
Djibouti Africa 993 0.9 0.9 no
Dominica Americas 71 7.7 0.5 no
104 14. Annex 3
Country / Economy Region Population (1000)
E-waste generated
in 2016(kg/inh)
E-waste generated
in 2016(kt)
National regulation in force in
January 2017
Dominican Republic Americas 10088 5.8 59 no
Ecuador Americas 16529 5.5 90 yes
Egypt Africa 91047 5.5 497 no
El Salvador Americas 6146 5.8 36 no
Eritrea Africa 6938 0.6 3.8 no
Estonia Europe 1312 14.4 19 yes
Ethiopia Africa 91196 0.5 49 no
Fiji Oceania 895 5.1 4.6 no
Finland Europe 5500 21.1 116 yes
France Europe 64569 21.3 1373 yes
Gabon Africa 1881 7.6 14 no
Gambia Africa 2035 1.1 2.2 no
Georgia Asia 3701 5.7 21 no
Germany Europe 82571 22.8 1884 yes
Ghana Africa 27573 1.4 39 no
Greece Europe 10835 17.5 189 yes
Grenada Americas 107 7.8 0.8 no
Guatemala Americas 16673 4.0 67 no
Guinea Africa 12654 0.6 8.0 no
Guinea-Bissau Africa 1818 0.5 1.0 no
Guyana Americas 769 6.1 4.7 no
Honduras Americas 8203 2.3 19 no
Hungary Europe 9835 13.8 136 yes
Iceland Europe 336 22.6 7.6 yes
India Asia 1309713 1.5 1975 yes
Indonesia Asia 258802 4.9 1274 no
Iran (Islamic Republic of) Asia 80460 7.8 630 no
Iraq Asia 36067 6.1 221 no
10514. Annex 3
Country / Economy Region Population (1000)
E-waste generated
in 2016(kg/inh)
E-waste generated
in 2016(kt)
National regulation in force in
January 2017
Ireland Europe 4675 19.9 93 yes
Israel Asia 8528 14.1 120 yes
Italy Europe 61151 18.9 1156 yes
Jamaica Americas 2829 5.9 17 no
Japan Asia 126804 16.9 2139 yes
Jordan Asia 7748 5.6 43 no
Kazakhstan Asia 17947 8.2 147 no
Kenya Africa 45451 0.8 38 yes
Kiribati Oceania 116 0.8 0.1 no
Kuwait Asia 4225 15.8 67 no
Kyrgyzstan Asia 6059 1.2 7.2 no
Lao People's Democratic Republic Asia 7163 1.0 7.5 no
Latvia Europe 1976 11.0 22 yes
Lebanon Asia 4597 11.1 51 no
Lesotho Africa 1937 0.9 1.8 no
Libya Africa 6385 11.0 70 no
Lithuania Europe 2871 13.4 38 yes
Luxembourg Europe 576 20.9 12 yes
Madagascar Africa 24916 0.5 14 yes
Malawi Africa 18632 0.5 9.5 no
Malaysia Asia 31716 8.8 280 no
Maldives Asia 354 6.9 2.5 no
Mali Africa 16817 0.7 12 no
Malta Europe 431 15.5 6.7 yes
Mauritania Africa 3794 1.3 5.1 no
Mauritius Africa 1259 8.6 11 no
Mexico Americas 122273 8.2 998 yes
106 14. Annex 3
Country / Economy Region Population (1000)
E-waste generated
in 2016(kg/inh)
E-waste generated
in 2016(kt)
National regulation in force in
January 2017
Micronesia (Federated States of) Oceania 103 1.7 0.2 no
Mongolia Asia 3014 4.7 14 no
Montenegro Europe 623 10.0 6.2 yes
Morocco Africa 33827 3.7 127 no
Mozambique Africa 28751 0.6 17 no
Myanmar Asia 52254 1.0 55 no
Namibia Africa 2300 6.0 14 no
Nepal Asia 28834 0.8 23 no
Netherlands Europe 17030 23.9 407 yes
New Zealand Oceania 4712 20.1 95 no
Nicaragua Americas 6342 2.2 14 no
Niger Africa 18194 0.4 7.9 no
Nigeria Africa 183636 1.5 277 yes
Norway Europe 5263 28.5 150 yes
Oman Asia 3957 14.9 59 no
Pakistan Asia 192996 1.6 301 no
Palau Oceania 18 9.3 0.2 no
Panama Americas 4086 8.0 33 no
Papua New Guinea Oceania 7911 0.9 7.0 no
Paraguay Americas 6855 6.4 44 no
Peru Americas 31481 5.8 182 yes
Philippines Asia 104195 2.8 290 no
Poland Europe 37967 11.9 453 yes
Portugal Europe 10419 17.3 180 yes
Qatar Asia 2578 11.3 29 no
Republic of Korea Asia 50823 13.1 665 yes
Republic of Moldova Europe 3553 1.8 6.3 no
10714. Annex 3
Country / Economy Region Population (1000)
E-waste generated
in 2016(kg/inh)
E-waste generated
in 2016(kt)
National regulation in force in
January 2017
Romania Europe 19760 11.6 229 yes
Russian Federation Europe 143440 9.7 1392 yes
Rwanda Africa 11530 0.5 5.9 no
Saint Kitts and Nevis Americas 56 12.1 0.7 no
Saint Lucia Americas 174 9.3 1.6 no
Saint Vincent and the Grenadines Americas 110 8.3 0.9 no
Samoa Oceania 195 2.6 0.5 no
Sao Tome and Principe Africa 208 1.2 0.2 no
Saudi Arabia Asia 32013 15.9 508 no
Senegal Africa 15406 1.0 15 no
Serbia Europe 7132 7.1 51 yes
Seychelles Africa 93 11.5 1.1 no
Sierra Leone Africa 6439 0.5 3.4 no
Singapore Asia 5591 17.9 100 no
Slovakia Europe 5422 12.3 67 yes
Slovenia Europe 2065 16.1 33 yes
Solomon Islands Oceania 601 0.7 0.4 no
South Africa Africa 55870 5.7 321 no
Spain Europe 46356 20.1 930 yes
Sri Lanka Asia 21252 4.5 95 no
Sudan Africa 39599 1.3 51 no
Suriname Americas 563 9.6 5.4 no
Swaziland Africa 1132 5.1 5.7 no
Sweden Europe 10027 21.5 215 yes
Switzerland Europe 8325 22.2 184 yes
Thailand Asia 68981 7.4 507 no
The former Yugoslav Republic of Macedonia Europe 2073 7.2 15 yes

108 14. Annex 3
Country / Economy Region Population (1000)
E-waste generated
in 2016(kg/inh)
E-waste generated
in 2016(kt)
National regulation in force in
January 2017
Timor-Leste Asia 1188 3.0 3.6 no
Togo Africa 7509 0.9 6.4 no
Tonga Oceania 105 2.4 0.3 no
Trinidad and Tobago Americas 1364 15.8 22 no
Tunisia Africa 11224 5.6 63 no
Turkey Asia 78967 7.9 623 yes
Tuvalu Oceania 11 1.2 0.01 no
Uganda Africa 41087 0.6 25 yes
Ukraine Europe 42501 6.5 277 yes
United Arab Emirates Asia 9856 13.6 134 no
United Kingdom of Great Britain and Northern Ireland
Europe 65572 24.9 1632 yes
United Republic of Tanzania Africa 48633 0.8 38 no
United States of America Americas 323978 19.4 6295 yes
Uruguay Americas 3427 10.8 37 no
Vanuatu Oceania 275 1.0 0.3 no
Venezuela (Bolivarian Republic of) Americas 31029 8.2 254 no
Viet Nam Asia 92637 1.5 141 yes
Yemen Asia 29132 1.5 42 no
Zambia Africa 16717 0.9 15 no
Zimbabwe Africa 14501 0.9 13 no

10914. Annex 3


