
CHARACTERISTICSOFPRIVATESECTOREMPLOYMENT
U.S. EQUAL EMPLOYMENT OPPORTUNITY COMMISSION
2003
USING EEO-1 DATA TO EXAMINECHARACTERISTICS OF PRIVATE SECTOR EMPLOYMENT
FOREWORD
As never before, America’s economic prosperity is dependent on our ability tocompete in the global marketplace. Maintaining a competitive edge depends on thefull use of our nation’s talented workers, regardless of their race, ethnicity, color,religion, sex, age or disability. In the global economy, our nation enjoys anenormous labor market advantage when discriminatory employment practices areavoided. A useful step in fully utilizing our labor resources is to understand that thelabor market is changing and that some industries have been successful inexpanding their labor markets to take advantage of an increasingly diverse pool oftalented workers.
As part of its mandate under Title VII of the Civil Rights Act of 1964, as amended,the Equal Employment Opportunity Commission requires periodic reports frompublic and private employers, and unions and labor organizations which indicate thecomposition of their work forces by sex and by race/ethnic category. Key amongthese reports is the EEO-1 which is collected annually from private employers with100 or more employees or federal contractors with 50 more employees. Individualemployers file separate reports for each of their facilities with 50 or more employees. Our EEO-1 reports provide a very rich data base for various uses. The Commissioninvests heavily in proactive prevention programs that are designed to anticipate andremove, from the workplace, potentially discriminatory practices. Consistent with thatgoal, this report seeks to assist employers make full use of America’s labor marketsby understanding more about the characteristics of those markets. A generaloverview of what the EEO-1 reports suggests about private sector employment isprovided for that purpose. I hope that this publication will be informative and assistyou in your efforts to develop and maintain inclusive and productive workplaces.
Cari M. Dominguez, Chair U.S. Equal Employment Opportunity Commission
2003
U.S. Equal Employment Opportunity CommissionCHARACTERISTICS OF PRIVATE SECTOR EMPLOYMENT
EXECUTIVE SUMMARY
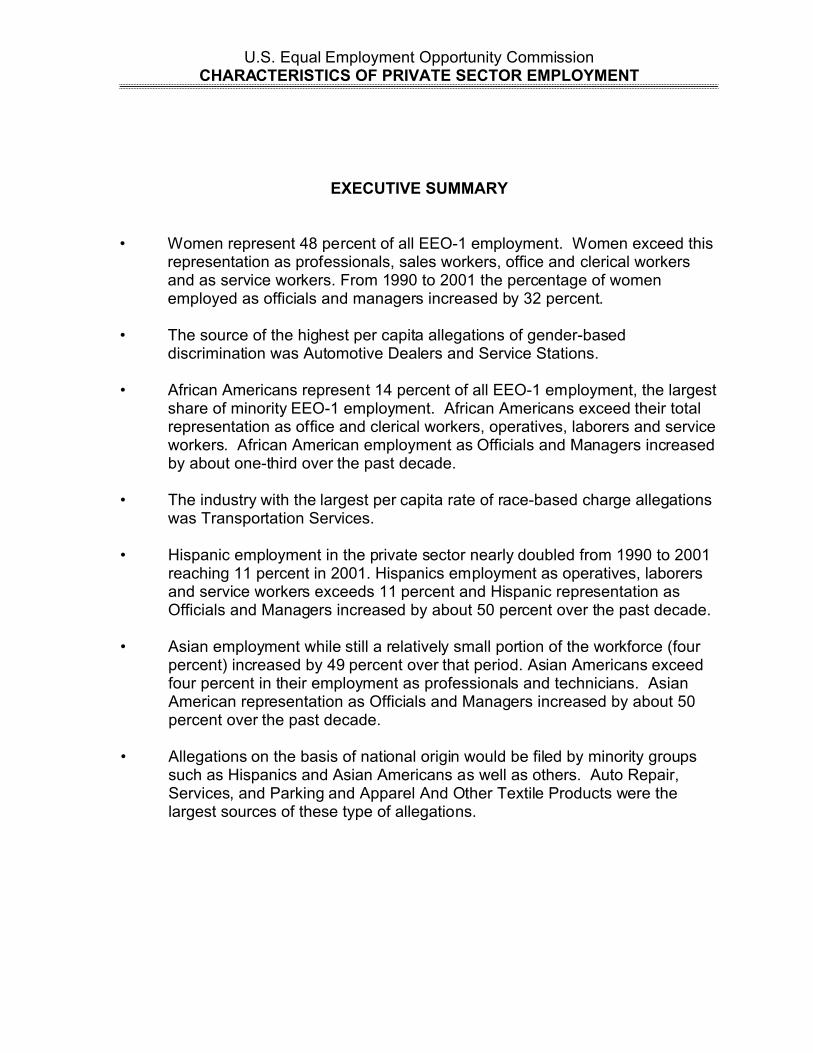
• Women represent 48 percent of all EEO-1 employment. Women exceed thisrepresentation as professionals, sales workers, office and clerical workersand as service workers. From 1990 to 2001 the percentage of womenemployed as officials and managers increased by 32 percent.
• The source of the highest per capita allegations of gender-baseddiscrimination was Automotive Dealers and Service Stations.
• African Americans represent 14 percent of all EEO-1 employment, the largest
share of minority EEO-1 employment. African Americans exceed their totalrepresentation as office and clerical workers, operatives, laborers and serviceworkers. African American employment as Officials and Managers increasedby about one-third over the past decade.
• The industry with the largest per capita rate of race-based charge allegationswas Transportation Services.
• Hispanic employment in the private sector nearly doubled from 1990 to 2001reaching 11 percent in 2001. Hispanics employment as operatives, laborersand service workers exceeds 11 percent and Hispanic representation asOfficials and Managers increased by about 50 percent over the past decade.
• Asian employment while still a relatively small portion of the workforce (four
percent) increased by 49 percent over that period. Asian Americans exceedfour percent in their employment as professionals and technicians. AsianAmerican representation as Officials and Managers increased by about 50percent over the past decade.
• Allegations on the basis of national origin would be filed by minority groupssuch as Hispanics and Asian Americans as well as others. Auto Repair,Services, and Parking and Apparel And Other Textile Products were thelargest sources of these type of allegations.

U.S. Equal Employment Opportunity CommissionCHARACTERISTICS OF PRIVATE SECTOR EMPLOYMENT
TABLE OF CONTENTS
INTRODUCTION . . . . . . . . . . . . . . . . . . . . . . . . . . . . . . . . . . . . . . . . . . . . . . . . . . 1
TOTAL EMPLOYMENT . . . . . . . . . . . . . . . . . . . . . . . . . . . . . . . . . . . . . . . . . . . . . 2
GROWTH AND DECLINE . . . . . . . . . . . . . . . . . . . . . . . . . . . . . . . . . . . . . . . . . . . 8
DISTRIBUTION BY JOB GROUP . . . . . . . . . . . . . . . . . . . . . . . . . . . . . . . . . . . . 14
EMPLOYMENT AS OFFICIALS AND MANAGERS . . . . . . . . . . . . . . . . . . . . . . . 17
MOVEMENT OF WOMEN FROM WHITE COLLAR TOMANAGEMENT POSITIONS . . . . . . . . . . . . . . . . . . . . . . . . . . . . . . . . . . . 24
PER CAPITA CHARGE ALLEGATIONS . . . . . . . . . . . . . . . . . . . . . . . . . . . . . . . 27
ADDITIONAL INFORMATION . . . . . . . . . . . . . . . . . . . . . . . . . . . . . . . . . . . . . . . 31

U.S. Equal Employment Opportunity CommissionCHARACTERISTICS OF PRIVATE SECTOR EMPLOYMENT
1 See “Section 5, Description of Job Categories” in the EEO-1 instruction booklet at,
http://www.eeoc.gov/stats/jobpat/e1instruct.htm l
April 2003 Page 1
INTRODUCTION
Relying primarily on the Equal Employment Opportunity Commission’s (EEOC’s)EEO-1 report, characteristics of employment are examined from six differentperspectives: total employment, the growth and decline of employment by industry,employment by job group, employment of officials and managers, the movement ofwomen from white collar to management positions and the bases of chargeallegations by industry. The report seeks to capture these measures using the mostrecent data from 2001 and by examining recent trends from 1990.
The annual EEO-1 report indicates the composition of an employer’s workforces bysex and by race/ethnic category. The EEO-1 collects data on nine major jobcategories: (1) officials and managers, (2) professionals, (3) technicians, (4) salesworkers, (5) office and clerical workers, (6) craft workers, (7) operatives, (8) laborersand (9) service workers.1 Race/ethnic designations used are White (not of Hispanicorigin), Black (not of Hispanic origin), Hispanic, Asian or Pacific Islander, AmericanIndian or Alaskan Native. In addition to the workforce data provided by theemployer, information about each establishment is added to the database. Thisincludes the establishment’s North American Industrial Classification System codeand in early years, added the Standard Industrial Classification code.

U.S. Equal Employment Opportunity CommissionCHARACTERISTICS OF PRIVATE SECTOR EMPLOYMENT
April 2003 Page 2
TOTAL EMPLOYMENT
In examining the total employment of women over the past decade (1990 to 2001),the percentage of women has remained relatively constant. However theemployment of different race/ethnic groups has changed.
Total Employment by Gender Race/Ethnic GroupEEO-1 Data 1990 to 2001
• African Americans represent the largest share of minority EEO-1employment.
• Hispanic employment in the private sector nearly doubled over the timeperiod.
• The gap between African American and Hispanic employment droppedfrom nearly six percent in 1990 to just three percent in 2001.
• Asian employment while still a relatively small portion of the workforceincreased by 49 percent over the period.

U.S. Equal Employment Opportunity CommissionCHARACTERISTICS OF PRIVATE SECTOR EMPLOYMENT
April 2003 Page 3
Women and minority groups are not, of course, employed evenly among allindustries. The following tables rank industries (as defined by the North AmericanIndustrial Classification System, industry subsectors) based on the percentage ofwomen, African Americans, Hispanics, Asians and Native Americans/AlaskanNatives. Table 1 lists the ten industries where women have the highest percentageof employment. The highest percentage of women are employed in the Nursing &Residential Care Facilities industry.
Table 1Ranking of Top Ten Industries
Based on the Employment of WomenSource: EEO-1 Reports for 2001
INDUSTRY
EMPLOYMENT
REPORTSFILED
WOMENEMPLOYED
WOMENPERCENT TOTAL
Nursing & ResidentialCare Facilities
978,609 82.52 1,185,908 7,747
Hospitals 3,129,271 79.37 3,942,645 4,284
Ambulatory Health CareServices
702,175 77.19 909,656 4,507
Apparel Manufacturing 126,918 67.89 186,951 796
Insurance Carriers &Related Activities
857,069 67.53 1,269,101 4,693
Social Assistance 187,115 66.38 281,903 1,839
General MerchandiseStores
1,740,601 66.18 2,630,079 13,109
Credit Intermediation &Related Activities
886,423 66.06 1,341,891 6,094
Clothing & ClothingAccessories Stores
151,646 65.80 230,481 1,989
Religious/Grantmaking/Prof/Like Organizations
165,567 65.77 251,737 1,462

U.S. Equal Employment Opportunity CommissionCHARACTERISTICS OF PRIVATE SECTOR EMPLOYMENT
April 2003 Page 4
Table 2 provides the same type of listing for African Americans. While AfricanAmerican are also highly represented in the Nursing & Residential Care Facilitiesindustry, the industry with the largest proportion of African American employees isTransit and Ground Passenger Transportation.
Table 2Top Ten Industries
Based on the Employment of African AmericansSource: EEO-1 Reports for 2001
INDUSTRY
EMPLOYMENT
REPORTSFILED
AFRICANAMERICANS
AFRICANAMERICANS
PERCENT TOTAL
Transit & GroundPassengerTransportation
44,480 29.03 153,211 861
Nursing & ResidentialCare Facilities
334,930 28.24 1,185,908 7,747
Textile Mills 62,634 27.35 229,003 902
Social Assistance 75,340 26.73 281,903 1,839
Monetary Authorities- Central Bank
5,919 23.64 25,041 70
Couriers &Messengers
112,285 23.09 486,354 1,066
Administrative &Support Services
452,068 21.31 2,121,242 9,363
Warehousing &Storage
31,590 20.39 154,912 872
Religious/Grantmaking/Prof/LikeOrganizations
50,026 19.87 251,737 1,462
Rental & LeasingServices
30,321 19.85 152,752 979

U.S. Equal Employment Opportunity CommissionCHARACTERISTICS OF PRIVATE SECTOR EMPLOYMENT
April 2003 Page 5
Table 3 provides similar data for Hispanics. Hispanics tend to be employed moreheavily in agricultural industries. The three industries with the highest percentage ofHispanic workers are all in the agricultural industry.
Table 3Top Ten Industries
Based on the Employment of HispanicsSource: EEO-1 Reports for 2001
INDUSTRY
EMPLOYMENT
REPORTSFILEDHISPANICS
HISPANICPERCENT TOTAL
Crop Production 39,209 61.80 63,440 248
Agriculture &Forestry SupportActivities
10,366 40.57 25,552 86
Animal Production 17,332 33.34 51,979 229
Food Mfg 308,508 27.74 1,112,240 3,673
Accommodation 218,582 24.12 906,306 3,341
Personal & LaundryServices
36,237 22.68 159,773 1,175
Food Services &Drinking Places
305,130 20.04 1,522,230 16,299
Special TradeContractors
74,662 18.24 409,402 2,274
Waste Management &Remediation Services
19,863 18.19 109,182 859
Heavy Construction 48,780 17.12 284,889 1,328

U.S. Equal Employment Opportunity CommissionCHARACTERISTICS OF PRIVATE SECTOR EMPLOYMENT
April 2003 Page 6
Industries were also ranked on the basis of their employment of Asian workers. Table 4 provides those results. Asian Americans tend to have larger portions ofemployment in more technical industries. For example, the industry with the largestportion of Asians is the Computer and Electronic Product Manufacturing with 13.5percent.
Table 4Top Ten Industries
Based on the Employment of Asians Source: EEO-1 Reports for 2001
INDUSTRY
EMPLOYMENT
REPORTSFILEDASIANS
ASIANPERCENT TOTAL
Computer & ElectronicProduct Mfg
196,094 13.54 1,448,636 4,331
Professional, Scientific &Technical Services
180,652 8.15 2,217,351 10,487
Security, CommodityContracts & Like Activity
34,134 7.89 432,483 1,573
Accommodation 69,060 7.62 906,306 3,341
Miscellaneous Mfg 36,031 7.45 483,589 1,917
Lessors of OtherNonfinancial IntangibleAsset
151 7.23 2,089 8
Monetary Authorities -Central Bank
1,802 7.20 25,041 70
Health & Personal CareStores
9,019 6.91 130,564 1,387
Electronics & ApplianceStores
10,830 6.82 158,856 1,386
Clothing & ClothingAccessories Stores
15,654 6.79 230,481 1,989

U.S. Equal Employment Opportunity CommissionCHARACTERISTICS OF PRIVATE SECTOR EMPLOYMENT
April 2003 Page 7
Finally, the employment of Native Americans/Alaskan Natives was examined byindustry. Results are shown in Table 5. While this group represents just a smallpercentage of employment. The distribution of these workers is not uniform. NativeAmericans/Alaskan Natives are heavily represented in extraction industries.
Table 5Top Ten Industries
Based on the Employment of Native Americans/Alaskan NativesSource: EEO-1 Reports for 2001
INDUSTRY
EMPLOYMENT
REPORTSFILED
NATIVEAMERICANS
NATIVEAMERICANPERCENT TOTAL
Mining SupportActivities
2,533 1.92 131,785 530
Mining (except Oil& Gas)
1,904 1.88 101,232 522
PipelineTransportation
379 1.63 23,307 110
Forestry andLogging
78 1.48 5,273 41
Animal Production 727 1.40 51,979 229
HeavyConstruction
3,767 1.32 284,889 1,328
Gasoline Stations 802 1.19 67,454 498
RailTransportation
2,231 1.16 191,602 418
Oil & GasExtraction
675 1.07 63,099 243
Wood Product Mfg 2,324 0.94 246,770 1,258

U.S. Equal Employment Opportunity CommissionCHARACTERISTICS OF PRIVATE SECTOR EMPLOYMENT
2 For analyses regarding growth and decline, the older Standard Industrial Classification
coding is used in order to conduct longitudinal analyses. The year 1992 was selected to enhance the
reliability of this industrial coding.
April 2003 Page 8
GROWTH AND DECLINE
The EEO-1 data reflects changes in the total employment in various industries. While some industries increased their total employment in the years from 1990 to2001, others saw a decline in employment.2 Table 6 lists those industries showingthe largest decline in employment based on the rate of change.
Table 6EEO-1 Data for Ten Years 1992 to 2001
Change in Total EmploymentTen Industries with Largest Declines in Employment
INDUSTRY
RATE OFCHANGE
(PERCENT)
TOTALEMPLOYMENT
1992
TOTALEMPLOYMENT
2001
Apparel And Other TextileProducts
-157.908 461,292 178,859
Leather And LeatherProducts
-100.594 84,707 42,228
Metal Mining -95.932 51,724 26,399
Coal Mining -66.359 78,889 47,421
Textile Mill Products -48.550 521,938 351,354
Petroleum And CoalProducts
-39.317 139,282 99,975
Tobacco Products -27.260 45,171 35,495
Nonmetallic Minerals,Except Fuels
-26.428 41,347 32,704
Electric, Gas, And SanitaryServices
-18.592 732,790 617,907
Personal Services -17.733 166,342 141,287

U.S. Equal Employment Opportunity CommissionCHARACTERISTICS OF PRIVATE SECTOR EMPLOYMENT
April 2003 Page 9
Apparel and other textile products saw a large decline as measured by both totalemployment and rates of change. Table 7 lists those industries where a largeincrease in employment was observed. While the Motion Picture industry showedthe highest rate of change, it still employs fewer total employees than some of theother high growth industries such as Building Materials and Garden Supplies andSecurity and Commodity Brokers.
Table 7EEO-1 Data for Ten Years 1992 to 2001
Change in Total EmploymentTen Industries with Largest Increases in Employment
INDUSTRY
RATE OFCHANGE
(PERCENT)
TOTALEMPLOYMENT
1992
TOTALEMPLOYMENT
2001
Motion Pictures 62.9274 37,757 101,846
Building Materials & GardenSupplies
59.4433 167,039 411,865
Furniture AndHomefurnishings Stores
57.8750 88,227 209,441
Amusement & RecreationServices
53.5246 219,241 471,736
Security And CommodityBrokers
50.3941 205,863 414,997
Insurance Agents, Brokers,& Service
50.2229 108,848 218,671
Museums, Botanical,Zoological Gardens
48.7395 20,395 39,787
Special Trade Contractors 46.6292 218,895 410,140
Engineering & ManagementServices
46.5423 713,455 1,334,615
Holding And OtherInvestment Offices
46.5283 76,149 142,410
The distribution of women and minority groups among the ten industries with thelargest rates of change in employment (growth industries) and among the tenindustries with the smallest rates of change in employment (declining industries) wasexamined. Women were fairly evenly distributed among these industries. In 1992,they made up 38 percent of total employment in growth industries and 43 percent in

U.S. Equal Employment Opportunity CommissionCHARACTERISTICS OF PRIVATE SECTOR EMPLOYMENT
April 2003 Page 10
Figure 2
declining industries. In 2001, they made up 36 percent of employment in growthindustries and 39 percent in declining industries. African Americans appear to bemore likely to be employed in growth industries. See Figure 2.
Distribution of African American EmployeesComparing Growth and Declining Industries
• African Americans are more likely to be employed in growth thandeclining industries.
• These different employment rates have become closer over the pastten years.
U.S. Equal Employment Opportunity CommissionCHARACTERISTICS OF PRIVATE SECTOR EMPLOYMENT
April 2003 Page 11
Figure 3
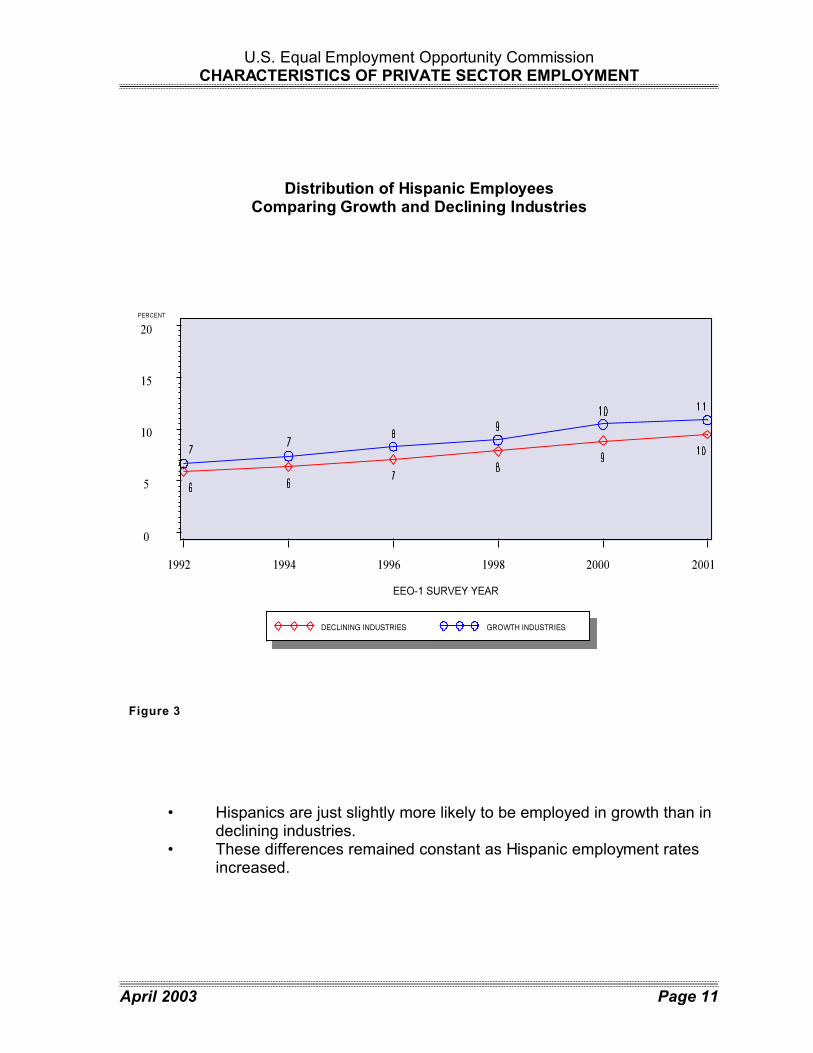
Distribution of Hispanic EmployeesComparing Growth and Declining Industries
• Hispanics are just slightly more likely to be employed in growth than indeclining industries.
• These differences remained constant as Hispanic employment ratesincreased.

U.S. Equal Employment Opportunity CommissionCHARACTERISTICS OF PRIVATE SECTOR EMPLOYMENT
April 2003 Page 12
Figure 4
Distribution of Asian EmployeesComparing Growth and Declining Industries
• Asian Americans are more likely to be employed in declining than ingrowth industries.
• These different employment rates have remained relatively constantover the last ten years.

U.S. Equal Employment Opportunity CommissionCHARACTERISTICS OF PRIVATE SECTOR EMPLOYMENT
April 2003 Page 13
Figure 5
Distribution of Native American/Alaskan Native EmployeesComparing Growth and Declining Industries
• Native American/Alaskan Natives are slightly more likely to beemployed in growth than in declining industries.
• Native American/Alaskan Native employment rates are small and haveremained relatively constant in the last decade.

U.S. Equal Employment Opportunity CommissionCHARACTERISTICS OF PRIVATE SECTOR EMPLOYMENT
April 2003 Page 14
Figure 6
DISTRIBUTION BY JOB GROUP
One method for examining the employment status of women and minority groups isto examine their distribution across the EEO-1 job groups.
Distribution of Womenby Job Group
• Women represent 48 percent of all EEO-1 employment.• Women exceed their total representation as professionals, sales
workers, office and clerical workers and as service workers.• Women fall below their representation as officials and managers, craft
workers, operatives and laborers.

U.S. Equal Employment Opportunity CommissionCHARACTERISTICS OF PRIVATE SECTOR EMPLOYMENT
April 2003 Page 15
Figure 7
Figure 8
Distribution of African Americans by Job Group
• African Americans represent 14 percent of all EEO-1 employment.African Americans exceed their total representation as office andclerical workers, operatives, laborers and service workers.
• African Americans fall below their total representation as officials andmanagers, professionals, technicians, sales workers and craft workers.
Distribution of Hispanics by Job Group
• Hispanics represent 11 percent of all EEO-1 employment.• Hispanics exceed their total representation as operatives, laborers and
service workers.• Hispanics all below their total representation as officials and managers,
professionals, technicians, sales workers and office and clericalworkers.

U.S. Equal Employment Opportunity CommissionCHARACTERISTICS OF PRIVATE SECTOR EMPLOYMENT
April 2003 Page 16
Figure 9
Figure 10
Distribution of Asian Americansby Job Group
• Asian Americans represent four percent of all EEO-1 employmentAsian Americans exceed their total representation as professionalsand technicians.
• Asian Americans fall below their total representation in all other jobgroups including officials and managers.
Distribution of Native Americans/Alaskan Nativesby Job Group
• Native Americans represent less than one percent of all EEO-1employment.
• Native Americans exceed their total representation in sales workers,blue collar and service worker jobs.
• Native Americans fall below their total representation as officials andmanagers and as professionals.

U.S. Equal Employment Opportunity CommissionCHARACTERISTICS OF PRIVATE SECTOR EMPLOYMENT
April 2003 Page 17
Figure 11
EMPLOYMENT AS OFFICIALS AND MANAGERS
Another method for examining the employment status of women and minority groupsis to examine their employment in higher paying job categories such as officials andmanagers.
The Employmentof Women as Officials and Managers
1990-2001
• The percentage of women employed as officials and managersincreased more than six percentage points during the last decade.
• The rate of change for this increase was 32 percent.

U.S. Equal Employment Opportunity CommissionCHARACTERISTICS OF PRIVATE SECTOR EMPLOYMENT
April 2003 Page 18
Figure 12
The Employmentof Minorities as Officials and Managers
1990-2001
• Minority group representation as Officials and Managers increasedsubstantially over the past decade.
• Hispanics and Asian Americans increased by about 50 percent.• Blacks and Native Americans increased by about one-third, 36.6
percent and 31 percent, respectively.

U.S. Equal Employment Opportunity CommissionCHARACTERISTICS OF PRIVATE SECTOR EMPLOYMENT
April 2003 Page 19
Just as the total employment of women and minority groups fluctuates by industry,they are not employed evenly across all industries as officials and managers. Table8 lists the ten industries where women have the highest percentage of officials andmanagers. These industries are very similar to those based on the total employmentof women.
Table 8Top Ten Industries
Based on the Employment of WomenAs Officials and Managers
INDUSTRY
MANAGERS
REPORTSFILEDWOMEN
PERCENTWOMEN TOTAL
Nursing & ResidentialCare Facilities
56,772 73.67 77,067 7,747
Hospitals 161,395 66.94 241,093 4,284
Ambulatory Health CareServices
44,369 62.81 70,636 4,507
Social Assistance 15,868 61.02 26,003 1,839
Clothing & ClothingAccessories Stores
19,831 59.33 33,425 1,989
Religious/Grantmaking/Prof/Like Organizations
15,828 52.01 30,434 1,462
Museums, Historical Sites& Like Institutions
2,339 51.61 4,532 110
Educational Services 4,787 50.23 9,530 515
General MerchandiseStores
91,819 49.47 185,620 13,109
Credit Intermediation &Related Activities
130,827 49.05 266,743 6,094

U.S. Equal Employment Opportunity CommissionCHARACTERISTICS OF PRIVATE SECTOR EMPLOYMENT
April 2003 Page 20
Table 9 lists the ten industries where African Americans have the highestpercentage of officials and managers. While the top ten industries for total AfricanAmerican employment and African American employment as officials and managersare very similar the order varies.
Table 9Top Ten Industries Based on the
Employment of African Americans As Officials and Managers
INDUSTRY
MANAGERS
REPORTSFILED
AFRICANAMERICANS
PERCENTAFRICAN
AMERICAN TOTAL
Couriers &Messengers
9,557 16.32 58,554 1,066
Social Assistance 4,217 16.22 26,003 1,839
Transit & GroundPassengerTransportation
911 15.01 6,069 861
Religious/Grantmaking/Prof/LikeOrganizations
3,798 12.48 30,434 1,462
Monetary Authorities- Central Bank
537 11.67 4,601 70
Nursing &Residential CareFacilities
8,840 11.47 77,067 7,747
Broadcasting &Telecommunications
23,250 10.96 212,109 6,585
Food Services &Drinking Places
11,488 10.28 111,792 16,299
Accommodation 9,175 9.88 92,875 3,341
Warehousing &Storage
1,316 9.28 14,174 872

U.S. Equal Employment Opportunity CommissionCHARACTERISTICS OF PRIVATE SECTOR EMPLOYMENT
3 Supervisors in the Agricultural industries are classified as laborers not asmanagers.
April 2003 Page 21
When examining total Hispanic employment, the importance of agriculture industrieswas striking. Other industries are higher ranked when examining the employment ofHispanics as officials and managers.3 Service industries seem quite important forHispanic officials and managers.
Table 10Top Ten Industries Based on the
Employment of Hispanics As Officials and Managers
INDUSTRY
MANAGERS
REPORTSFILEDHISPANIC
PERCENTHISPANIC TOTAL
Crop Production 1,210 23.79 5,087 248
Accommodation 8,954 9.64 92,875 3,341
Food Services &Drinking Places
10,713 9.58 111,792 16,299
Animal Production 473 8.73 5,419 229
WaterTransportation
513 8.42 6,095 107
Couriers &Messengers
4,665 7.97 58,554 1,066
Personal & LaundryServices
1,253 7.88 15,901 1,175
Administrative &Support Services
13,549 7.23 187,444 9,363
Motion Picture &Sound RecordingIndustries
1,161 7.19 16,144 769
Agriculture &Forestry SupportActivities
192 7.13 2,692 86

U.S. Equal Employment Opportunity CommissionCHARACTERISTICS OF PRIVATE SECTOR EMPLOYMENT
April 2003 Page 22
There are some interesting differences between rankings based on totalemployment of Asian Americans and the employment of Asian Americans asofficials and managers. See Table 11. The Motion Picture & Sound RecordingIndustry is ranked third for employing Asian Americans officials and managers, yetthe industry does not appear on the top ten industries of Asian American totalemployment. The same is true for Chemical Manufacturing, Wholesale Trade andDurable Goods and Publishing Industries.
Table 11Top Ten Industries Based on the Employment of Asian Americans
As Officials and Managers
INDUSTRY
MANAGERS
REPORTSFILED ASIANS
PERCENTASIAN TOTAL
Computer &Electronic ProductMfg
17,418 8.22 211,962 4,331
Professional,Scientific & TechnicalServices
20,528 5.91 347,054 10,487
Motion Picture &Sound RecordingIndustries
925 5.73 16,144 769
Security, CommodityContracts & LikeActivity
4,129 5.41 76,356 1,573
Accommodation 4,702 5.06 92,875 3,341
Chemical Mfg 7,633 4.88 156,344 2,893
Health & PersonalCare Stores
688 4.57 15,043 1,387
Wholesale Trade,Durable Goods
5,271 4.54 116,069 4,800
Publishing Industries 4,832 4.53 106,567 2,295
Electronics &Appliance Stores
745 4.38 17,010 1,386

U.S. Equal Employment Opportunity CommissionCHARACTERISTICS OF PRIVATE SECTOR EMPLOYMENT
April 2003 Page 23
While the order varies, the top ten industries for Native American/Alaskan Nativetotal employment and employment as officials and managers is quite consistent.
Table 12Top Ten Industries Based on the
Employment of Native American/Alaskan NativeAs Officials and Managers
INDUSTRY
MANAGERS
REPORTSFILED
NATIVEAMERICANS
PERCENT NATIVE
AMERICAN TOTAL
Mining (except Oil &Gas)
127 1.02 12,502 522
Animal Production 52 0.96 5,419 229
Mining SupportActivities
136 0.96 14,188 530
Oil & Gas Extraction 85 0.84 10,161 243
PipelineTransportation
31 0.78 3,951 110
Gasoline Stations 62 0.72 8,616 498
Heavy Construction 181 0.69 26,164 1,328
Couriers &Messengers
383 0.65 58,554 1,066
Wood Product Mfg 117 0.65 18,125 1,258
Air Transportation 215 0.64 33,697 733
U.S. Equal Employment Opportunity CommissionCHARACTERISTICS OF PRIVATE SECTOR EMPLOYMENT
4 Industries with less than 15 companies were not included as well as those with more
officials and managers than white collar workers. Finally those industries where regress ion results
showed no re lationship between white collar and officials and m anagers were rem oved.
Approximately 600 firms were removed due to these screens. Excluded industries include Oilseed
and Grain Farming and Personal Care Services.
5W eights are generated by us ing a canonical correlation of total off icials and managers with
total professional, total technical and total sales workers. The weights used are the standardized
regress ion coefficients. If the regress ion coefficient is less than zero or is not statistica lly significant a
weight of zero is assigned. Thus, the job group is not included in the calculation.
April 2003 Page 24
MOVEMENT OF WOMEN FROM WHITE COLLAR TO MANAGEMENT POSITIONS
Associated with the issue of glass ceilings, is the exclusion of women frommanagement positions. When women experience relatively high employmentstatus, it might be expected that they can move as easily into management positionsas their male counterparts. This can be examined to some extent using EEO-1 data. For this analysis, the employment of men and women was divided betweenmanagers and white collar employees. White collar employees were defined asthose in the EEO-1 job groups of professionals, technicians and sales workers. These white collar employees were treated as if they represented the pool ofworkers from which officials and managers were selected.
Steps were taken to eliminate those industries where this assumption was unlikely tobe accurate.4 Further, it is not expected that job groups within the pool of whitecollar workers contributed evenly to management positions or that theserelationships would be the same in all industries. Therefore, the job groups need toweighted based on their contribution.5 An odds ratio was computed for each firmwithin an industry. The odds for men would be the number of men reported asofficials and managers divided by the sum of men reported as professionals,technicians and sales workers using weighted values. The same calculation wouldbe made for women, and the odds ratio would be the division of these two odds. Once an odds ratio was computed for individual firms, a median was thenconstructed for relevant industries. To improve the accuracy of these calculations,the more detailed North American Industrial Classification System codes for industrygroups (four digit codes) were utilized. The distribution of the median odds ratioswere examined.
U.S. Equal Employment Opportunity CommissionCHARACTERISTICS OF PRIVATE SECTOR EMPLOYMENT
April 2003 Page 25
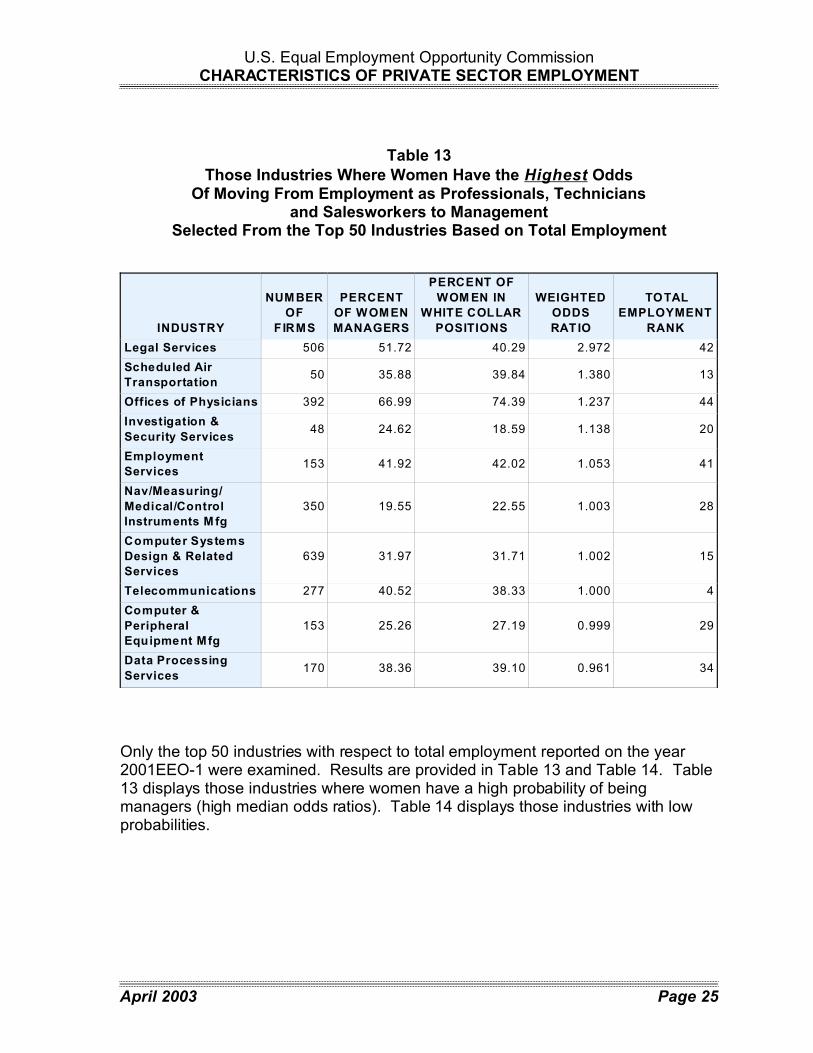
Table 13Those Industries Where Women Have the Highest Odds
Of Moving From Employment as Professionals, Technicians and Salesworkers to Management
Selected From the Top 50 Industries Based on Total Employment
INDUSTRY
NUMBER
OF
FIRMS
PERCENT
OF WOMEN
MANAGERS
PERCENT OF
WOM EN IN
WHITE COLLAR
POSITIONS
WEIGHTED
ODDS
RATIO
TOTAL
EMPLOYMENT
RANK
Legal Services 506 51.72 40.29 2.972 42
Scheduled Air
Transportation50 35.88 39.84 1.380 13
Offices of Physicians 392 66.99 74.39 1.237 44
Investigation &
Security Services48 24.62 18.59 1.138 20
Employment
Services153 41.92 42.02 1.053 41
Nav/Measuring/
Medical/Control
Instruments M fg
350 19.55 22.55 1.003 28
Computer Systems
Design & Related
Services
639 31.97 31.71 1.002 15
Telecommunications 277 40.52 38.33 1.000 4
Computer &
Peripheral
Equipment Mfg
153 25.26 27.19 0.999 29
Data Processing
Services170 38.36 39.10 0.961 34
Only the top 50 industries with respect to total employment reported on the year2001EEO-1 were examined. Results are provided in Table 13 and Table 14. Table13 displays those industries where women have a high probability of beingmanagers (high median odds ratios). Table 14 displays those industries with lowprobabilities.

U.S. Equal Employment Opportunity CommissionCHARACTERISTICS OF PRIVATE SECTOR EMPLOYMENT
April 2003 Page 26
Table 14Those Industries Where Women Have the Lowest Odds
Of Moving From Employment as Professionals, Technicians and Salesworkers to Management
Selected From the Top 50 Industries Based on Total Employment
INDUSTRY
NUMBER
OF
FIRMS
PERCENT OF
WOMEN
MANAGERS
PERCENT OF
WOM EN IN
WHITE
COLLAR
POSITIONS
WEIGHTED
ODDS
RATIO
TOTAL
EMPLOYMENT
RANK
Grocery Stores 293 36.18 56.00 0.459 2
Animal Slaughtering
& Processing56 14.71 27.93 0.479 23
General Freight
Trucking61 22.84 57.23 0.488 32
General Medical &
Surgical Hospitals1652 66.98 81.26 0.495 1
Community Care
Facilities for the
Elderly
449 66.71 87.71 0.508 45
Full-Service
Restaurants47 38.27 59.78 0.510 6
Nursing Care
Facilities1021 73.30 89.15 0.512 10
Pulp, Paper &
Paperboard Mills65 17.39 34.97 0.519 49
Printing & Related
Support Activities304 26.03 41.16 0.524 35
Building M aterial &
Supplies Dealers139 20.21 37.76 0.561 19
U.S. Equal Employment Opportunity CommissionCHARACTERISTICS OF PRIVATE SECTOR EMPLOYMENT
6 It should be noted that this information is often lacking in the EEOC chargetracking system so the strength of these finding is limited.
April 2003 Page 27
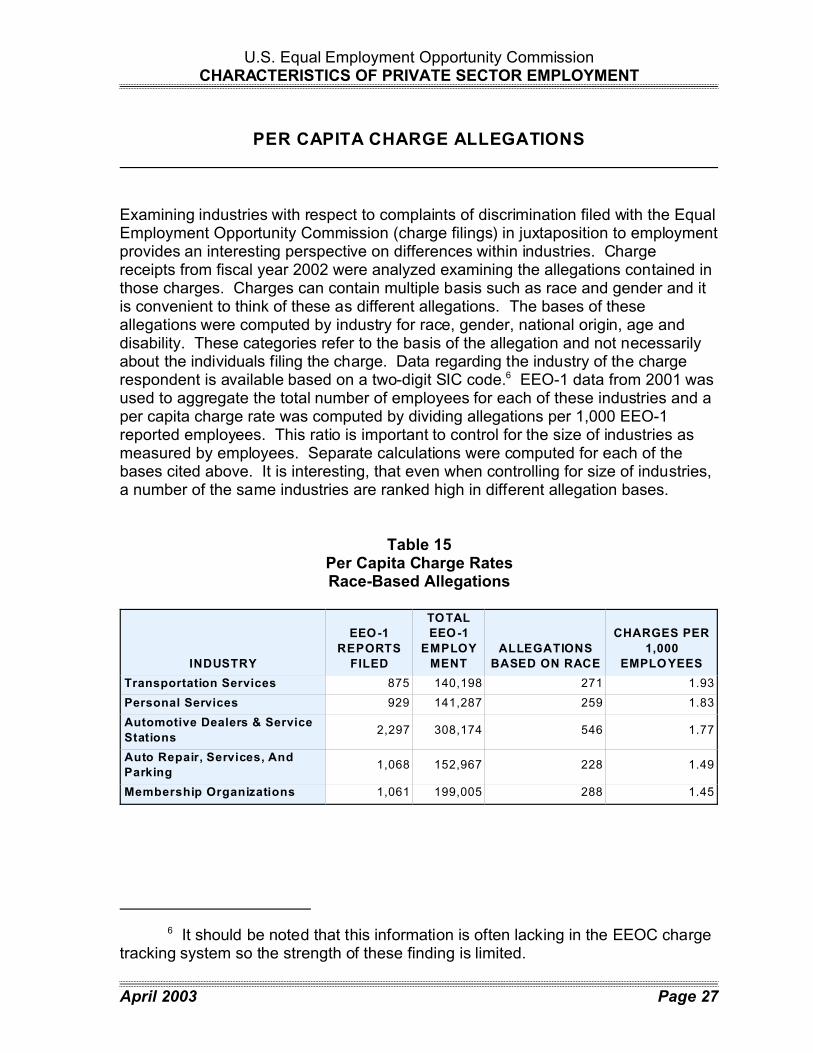
PER CAPITA CHARGE ALLEGATIONS
Examining industries with respect to complaints of discrimination filed with the EqualEmployment Opportunity Commission (charge filings) in juxtaposition to employmentprovides an interesting perspective on differences within industries. Charge receipts from fiscal year 2002 were analyzed examining the allegations contained inthose charges. Charges can contain multiple basis such as race and gender and itis convenient to think of these as different allegations. The bases of theseallegations were computed by industry for race, gender, national origin, age anddisability. These categories refer to the basis of the allegation and not necessarilyabout the individuals filing the charge. Data regarding the industry of the chargerespondent is available based on a two-digit SIC code.6 EEO-1 data from 2001 wasused to aggregate the total number of employees for each of these industries and aper capita charge rate was computed by dividing allegations per 1,000 EEO-1reported employees. This ratio is important to control for the size of industries asmeasured by employees. Separate calculations were computed for each of thebases cited above. It is interesting, that even when controlling for size of industries,a number of the same industries are ranked high in different allegation bases.
Table 15Per Capita Charge RatesRace-Based Allegations
INDUSTRY
EEO-1
REPORTS
FILED
TOTAL
EEO-1
EMPLOY
MENT
ALLEGATIONS
BASED ON RACE
CHARGES PER
1,000
EMPLOYEES
Transportation Services 875 140,198 271 1.93
Personal Services 929 141,287 259 1.83
Automotive Dealers & Service
Stations2,297 308,174 546 1.77
Auto Repair, Services, And
Parking1,068 152,967 228 1.49
Membership Organizations 1,061 199,005 288 1.45

U.S. Equal Employment Opportunity CommissionCHARACTERISTICS OF PRIVATE SECTOR EMPLOYMENT
7 Standard Industrial Classification Manual, 1987, Executive Office of thePresident, Office of Management and Budget, p. 280.
April 2003 Page 28
Table 15 displays results of ranking per capita allegations of race discrimination. The industry with the largest per capita rate of race-based charge allegations wasTransportation Services. This includes “establishments furnishing servicesincidental to transportation, such as forwarding and packing services, and thearrangement of passenger and freight transportation”7
While a number of the same industries are highly ranked on the number of both raceand gender-based allegations, the source of the highest per capita allegations ofgender-based discrimination was Automotive Dealers and Service Stations. SeeTable 16.
Table 16Per Capita Charge Rates
Gender-Based Allegations
INDUSTRY
EEO-1 REPORTS
FILED
TOTAL EEO-1
EMPLOYMENT
ALLEGATIONS
BASED ON
SEX
CHARGES PER
1,000
EMPLOYEES
Automotive Dealers &
Service Stations2,297 308,174 562 1.82
Personal Services 929 141,287 241 1.71
Transportation Services 875 140,198 167 1.19
General Building
Contractors1,024 211,688 227 1.07
Agricultural Production--
Crops237 61,408 63 1.03
Allegations on the basis of national origin would be filed by large minority groupssuch as Hispanics and Asian Americans as well as others. The top two industrieshere, “Auto Repair, Services, and Parking” and “Apparel And Other Textile Products”were not in the top five industries ranked on race- or gender-based allegations. SeeTable 17.

U.S. Equal Employment Opportunity CommissionCHARACTERISTICS OF PRIVATE SECTOR EMPLOYMENT
April 2003 Page 29
Table 17Per Capita Charge Rates
National Origin-Based Allegations
INDUSTRY
EEO-1
REPORTS
FILED
TOTAL EEO-1
EMPLOYMENT
ALLEGATIONS
BASED ON
NATIONAL
ORIGIN
CHARGES PER
1,000
EMPLOYEES
Auto Repair, Services,
And Parking1,068 152,967 92 0.60
Apparel And Other
Textile Products853 178,859 92 0.51
Personal Services 929 141,287 66 0.47
Transportation
Services875 140,198 62 0.44
General Building
Contractors1,024 211,688 89 0.42
The set of industries ranked high on age-based allegations are substantially differentthan those identified above. The statistics for the highest ranking industry, motionpictures, might be somewhat mis-leading due to an organized effort to file multiplecharges against employers in this industry. Table 18 shows the data for the top fiveindustries.
Table 18Per Capita Charge RatesAge-Based Allegations
INDUSTRY
EEO-1
REPORTS
FILED
TOTAL EEO-1
EMPLOYMENT
ALLEGATIONS
BASED ON AGE
CHARGES PER
1,000 EMPLOYEES
Motion Pictures 739 101,846 1,295 12.7
Communication 6,586 1,370,000 2,034 1.49
Personal Services 929 141,287 134 0.95
Miscellaneous
Manufacturing
Industries
1,131 237,013 214 0.90
Automotive Dealers &
Service Stations2,297 308,174 241 0.78

U.S. Equal Employment Opportunity CommissionCHARACTERISTICS OF PRIVATE SECTOR EMPLOYMENT
8 Standard Industrial Classification Manual, 1987, Executive Office of thePresident, Office of Management and Budget, p. 356.
April 2003 Page 30
The final category of charges examined were those based on disability. While“Miscellaneous Manufacturing Industries” was highly ranked on age-based charges,
Table 19Per Capita Charge Rates
Disability-Based Allegations
INDUSTRY
EEO-1
REPORTS
FILED
TOTAL EEO-1
EMPLOYMENT
ALLEGATIONS
BASED ON
DISABILITY
CHARGES PER
1,000
EMPLOYEES
Miscellaneous
Manufacturing
Industries
1,131 237,013 231 0.97
Transportation
Services875 140,198 134 0.96
Personal Services 929 141,287 111 0.79
Automotive Dealers
& Service Stations2,297 308,174 223 0.72
Local And
Interurban
Passenger Transit
912 162,844 109 0.67
it is the top source of disability-based allegations using a per capita measure. Thisindustry includes, firms manufacturing a variety of smaller consumer goods such asjewelry, musical instruments, toys and athletic goods.
It is interesting to note those industries ranked in the top five in more than one of thebases groups. Four industries are noteworthy. Personal Services appears in thetop five in all five lists. Personal Services is defined as “establishments primarilyengaged in providing services generally to individuals, such as laundries, drycleaning plants, portrait photographic studios, and beauty and barber shops.”8 Twoindustries appear in four of the five set of rankings. These are TransportationServices and Automotive Dealers and Service Stations. Auto Repair, Services andParking appears in three of the five rankings.

U.S. Equal Employment Opportunity CommissionCHARACTERISTICS OF PRIVATE SECTOR EMPLOYMENT
April 2003 Page 31
Prepared By:
Office of Research, Information and Planning
U.S. Equal Employment Opportunity Commission
W ashington, D.C.
ADDITIONAL INFORMATION
For additional information visit our web site at http://www.eeoc.gov. In particularclick on STATISTICS and JOB PATTERNS FOR MINORITIES AND WOMEN,http://www.eeoc.gov/stats/jobpat/jobpat.html for sample copies of the EEO-1 form,an instruction booklet and aggregate statistics. See EEOC ENFORCEMENTSTATISTICS AND LITIGATION, http://www.eeoc.gov/stats/enforcement.html fordata regarding charges.


