Download - Comparative Study of QRS Complex.pdf
8/10/2019 Comparative Study of QRS Complex.pdf
http://slidepdf.com/reader/full/comparative-study-of-qrs-complexpdf 1/5
FULL PAPER
International Journal of Recent Trends in Engineering, Vol 2, No. 5, November 2009
273
Comparative Study of QRS Complex
Detection in ECG
Based on Discrete Wavelet TransformS.Sumathi
1, Dr.M.Y. Sanavullah
2
1 V.M.K.V. Engineering College, Salem, India 636 308Email: [email protected]
2 K.S.Rangasamy College of Technology, Tiruchengode, India 637 215
Abstract — A new robust algorithm for the QRS detection
using the properties of the wavelet transform is proposed in
this paper. Wavelet transform provide simultaneous time
and frequency information. The algorithm has explained the
effect of wavelet with different properties such as linearityand time frequency localization on the accuracy of QRS
detection. The wavelet transform decomposes the
ElectroCardioGram (ECG) signal into a set of frequency
band. The proposed method identifies and detects the
components of ECG signal such as QRS complex. The
method also show the sharp results for ECG detection
parameters. For the standard 24 hour Massachusetts
Institute of Technology/Beth Isrel Hospital (MIT-BIH)
arrhythmia database, this algorithm correctly reduces the
error in detection of the QRS complexes.
Index Terms- ECG, QRS complex detection, Discrete
wavelet transform, Multi resolution, Massachusetts Institute
of Technology/Beth Isrel Hospital (MIT-BIH) ECGarrhythmia database.
I. I NTRODUCTION
The ElectroCardioGraph (ECG) is the graphicalrepresentation of the electrical voltages generated during
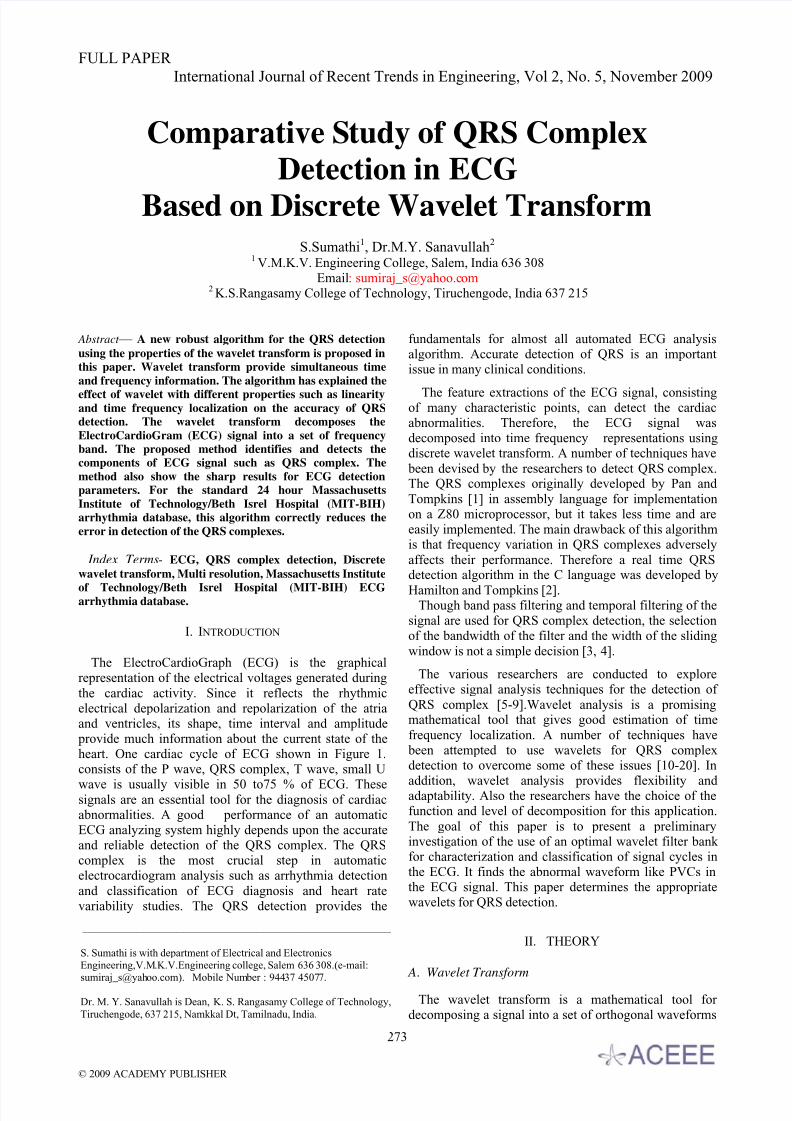
the cardiac activity. Since it reflects the rhythmicelectrical depolarization and repolarization of the atriaand ventricles, its shape, time interval and amplitude provide much information about the current state of theheart. One cardiac cycle of ECG shown in Figure 1.consists of the P wave, QRS complex, T wave, small U
wave is usually visible in 50 to75 % of ECG. Thesesignals are an essential tool for the diagnosis of cardiacabnormalities. A good performance of an automaticECG analyzing system highly depends upon the accurateand reliable detection of the QRS complex. The QRScomplex is the most crucial step in automaticelectrocardiogram analysis such as arrhythmia detection
and classification of ECG diagnosis and heart ratevariability studies. The QRS detection provides the
fundamentals for almost all automated ECG analysisalgorithm. Accurate detection of QRS is an importantissue in many clinical conditions.
The feature extractions of the ECG signal, consistingof many characteristic points, can detect the cardiacabnormalities. Therefore, the ECG signal wasdecomposed into time frequency representations usingdiscrete wavelet transform. A number of techniques have
been devised by the researchers to detect QRS complex.The QRS complexes originally developed by Pan and
Tompkins [1] in assembly language for implementationon a Z80 microprocessor, but it takes less time and areeasily implemented. The main drawback of this algorithmis that frequency variation in QRS complexes adversely
affects their performance. Therefore a real time QRSdetection algorithm in the C language was developed by
Hamilton and Tompkins [2].Though band pass filtering and temporal filtering of the
signal are used for QRS complex detection, the selectionof the bandwidth of the filter and the width of the sliding
window is not a simple decision [3, 4].
The various researchers are conducted to exploreeffective signal analysis techniques for the detection of
QRS complex [5-9].Wavelet analysis is a promisingmathematical tool that gives good estimation of time
frequency localization. A number of techniques have been attempted to use wavelets for QRS complexdetection to overcome some of these issues [10-20]. In
addition, wavelet analysis provides flexibility andadaptability. Also the researchers have the choice of thefunction and level of decomposition for this application.
The goal of this paper is to present a preliminaryinvestigation of the use of an optimal wavelet filter bankfor characterization and classification of signal cycles inthe ECG. It finds the abnormal waveform like PVCs inthe ECG signal. This paper determines the appropriatewavelets for QRS detection.
II. THEORY
A. Wavelet Transform
The wavelet transform is a mathematical tool fordecomposing a signal into a set of orthogonal waveforms
______________________________________________ S. Sumathi is with department of Electrical and Electronics
Engineering,V.M.K.V.Engineering college, Salem 636 308.(e-mail:
[email protected]). Mobile Number : 94437 45077.
Dr. M. Y. Sanavullah is Dean, K. S. Rangasamy College of Technology,
Tiruchengode, 637 215, Namkkal Dt, Tamilnadu, India.
© 2009 ACADEMY PUBLISHER
8/10/2019 Comparative Study of QRS Complex.pdf
http://slidepdf.com/reader/full/comparative-study-of-qrs-complexpdf 2/5
FULL PAPER
International Journal of Recent Trends in Engineering, Vol 2, No. 5, November 2009
274
localized both in time and frequency domains. Thedecomposition produces coefficients, which are functionsof the scale (of the wavelet function) and position (shiftacross the signal). We manipulate wavelet in two ways
viz., translation and scaling. In the translation the wavelet
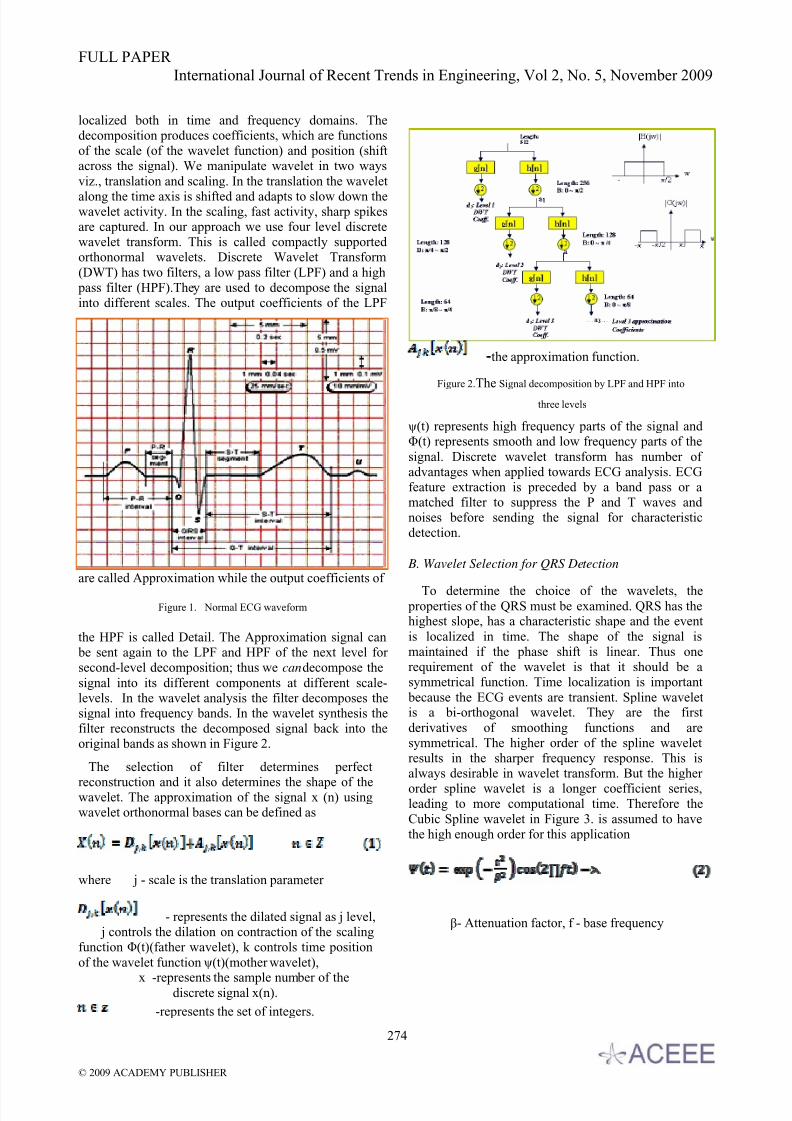
along the time axis is shifted and adapts to slow down thewavelet activity. In the scaling, fast activity, sharp spikesare captured. In our approach we use four level discretewavelet transform. This is called compactly supportedorthonormal wavelets. Discrete Wavelet Transform
(DWT) has two filters, a low pass filter (LPF) and a high pass filter (HPF).They are used to decompose the signalinto different scales. The output coefficients of the LPF
are called Approximation while the output coefficients of
Figure 1. Normal ECG waveform
the HPF is called Detail. The Approximation signal can be sent again to the LPF and HPF of the next level forsecond-level decomposition; thus we can decompose the
signal into its different components at different scale-levels. In the wavelet analysis the filter decomposes thesignal into frequency bands. In the wavelet synthesis thefilter reconstructs the decomposed signal back into theoriginal bands as shown in Figure 2.
The selection of filter determines perfect
reconstruction and it also determines the shape of thewavelet. The approximation of the signal x (n) usingwavelet orthonormal bases can be defined as
where j - scale is the translation parameter
- represents the dilated signal as j level, j controls the dilation on contraction of the scaling
function Φ(t)(father wavelet), k controls time position
of the wavelet function ψ(t)(mother wavelet),
x -represents the sample number of thediscrete signal x(n).
-represents the set of integers.
the approximation function.
Figure 2. The Signal decomposition by LPF and HPF into
three levels
ψ(t) represents high frequency parts of the signal andΦ(t) represents smooth and low frequency parts of the
signal. Discrete wavelet transform has number ofadvantages when applied towards ECG analysis. ECGfeature extraction is preceded by a band pass or amatched filter to suppress the P and T waves andnoises before sending the signal for characteristicdetection.
B. Wavelet Selection for QRS Detection
To determine the choice of the wavelets, the properties of the QRS must be examined. QRS has thehighest slope, has a characteristic shape and the event
is localized in time. The shape of the signal ismaintained if the phase shift is linear. Thus onerequirement of the wavelet is that it should be asymmetrical function. Time localization is important
because the ECG events are transient. Spline waveletis a bi-orthogonal wavelet. They are the first
derivatives of smoothing functions and aresymmetrical. The higher order of the spline waveletresults in the sharper frequency response. This isalways desirable in wavelet transform. But the higher
order spline wavelet is a longer coefficient series,leading to more computational time. Therefore the
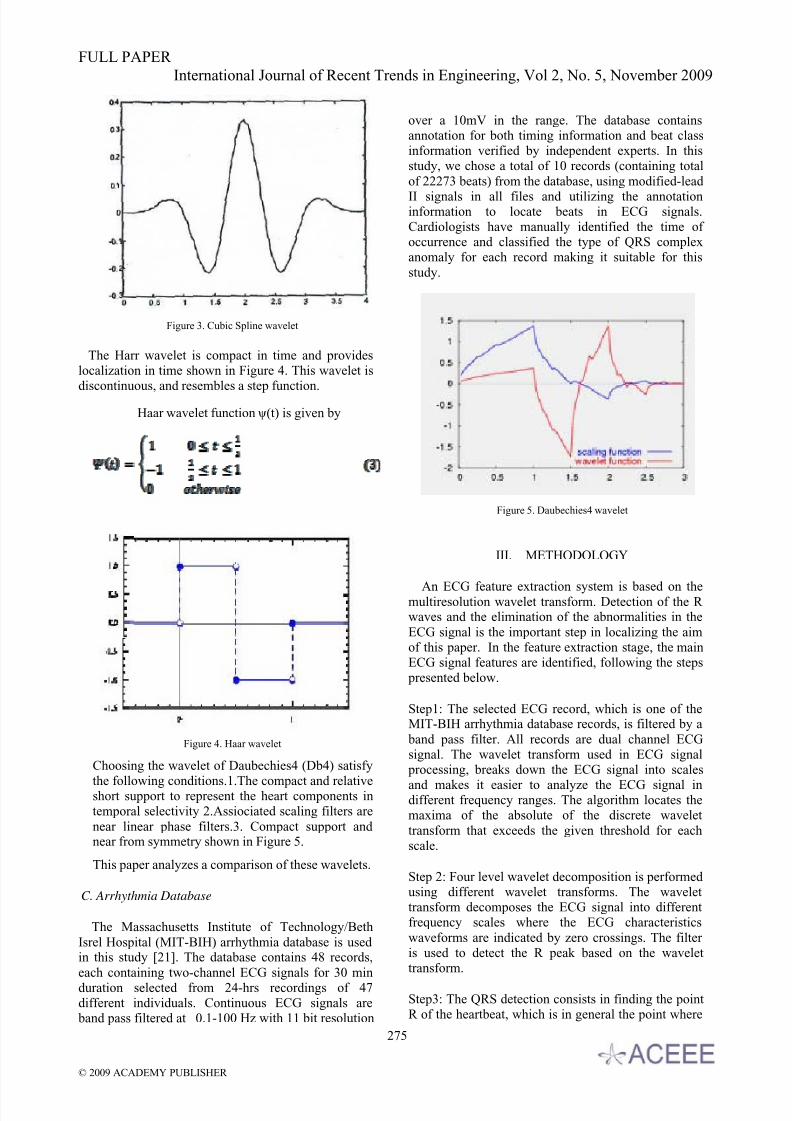
Cubic Spline wavelet in Figure 3. is assumed to havethe high enough order for this application
β- Attenuation factor, f - base frequency
© 2009 ACADEMY PUBLISHER
8/10/2019 Comparative Study of QRS Complex.pdf
http://slidepdf.com/reader/full/comparative-study-of-qrs-complexpdf 3/5
FULL PAPER
International Journal of Recent Trends in Engineering, Vol 2, No. 5, November 2009
275
Figure 3. Cubic Spline wavelet
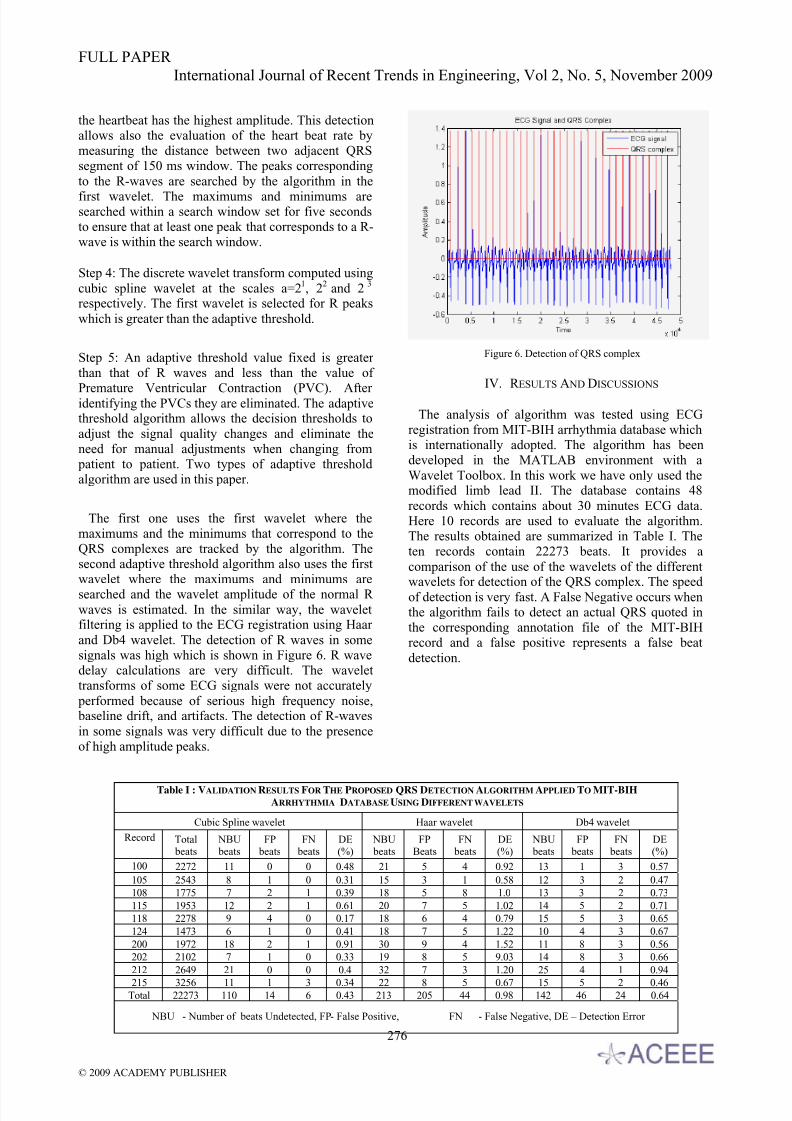
The Harr wavelet is compact in time and provideslocalization in time shown in Figure 4. This wavelet isdiscontinuous, and resembles a step function.
Haar wavelet function ψ(t) is given by
Figure 4. Haar wavelet
Choosing the wavelet of Daubechies4 (Db4) satisfy
the following conditions.1.The compact and relativeshort support to represent the heart components intemporal selectivity 2.Assiociated scaling filters are
near linear phase filters.3. Compact support andnear from symmetry shown in Figure 5.
This paper analyzes a comparison of these wavelets.
C. Arrhythmia Database
The Massachusetts Institute of Technology/Beth
Isrel Hospital (MIT-BIH) arrhythmia database is usedin this study [21]. The database contains 48 records,
each containing two-channel ECG signals for 30 minduration selected from 24-hrs recordings of 47different individuals. Continuous ECG signals are band pass filtered at 0.1-100 Hz with 11 bit resolution
over a 10mV in the range. The database containsannotation for both timing information and beat classinformation verified by independent experts. In thisstudy, we chose a total of 10 records (containing total
of 22273 beats) from the database, using modified-lead
II signals in all files and utilizing the annotationinformation to locate beats in ECG signals.Cardiologists have manually identified the time ofoccurrence and classified the type of QRS complexanomaly for each record making it suitable for this
study.
Figure 5. Daubechies4 wavelet
III. METHODOLOGY
An ECG feature extraction system is based on themultiresolution wavelet transform. Detection of the Rwaves and the elimination of the abnormalities in the
ECG signal is the important step in localizing the aimof this paper. In the feature extraction stage, the mainECG signal features are identified, following the steps presented below.
Step1: The selected ECG record, which is one of theMIT-BIH arrhythmia database records, is filtered by a
band pass filter. All records are dual channel ECGsignal. The wavelet transform used in ECG signal processing, breaks down the ECG signal into scales
and makes it easier to analyze the ECG signal indifferent frequency ranges. The algorithm locates themaxima of the absolute of the discrete wavelet
transform that exceeds the given threshold for eachscale.
Step 2: Four level wavelet decomposition is performedusing different wavelet transforms. The wavelettransform decomposes the ECG signal into differentfrequency scales where the ECG characteristics
waveforms are indicated by zero crossings. The filteris used to detect the R peak based on the wavelettransform.
Step3: The QRS detection consists in finding the pointR of the heartbeat, which is in general the point where
© 2009 ACADEMY PUBLISHER
8/10/2019 Comparative Study of QRS Complex.pdf
http://slidepdf.com/reader/full/comparative-study-of-qrs-complexpdf 4/5
FULL PAPER
International Journal of Recent Trends in Engineering, Vol 2, No. 5, November 2009
276
the heartbeat has the highest amplitude. This detectionallows also the evaluation of the heart beat rate bymeasuring the distance between two adjacent QRSsegment of 150 ms window. The peaks corresponding
to the R-waves are searched by the algorithm in the
first wavelet. The maximums and minimums aresearched within a search window set for five secondsto ensure that at least one peak that corresponds to a R-wave is within the search window.
Step 4: The discrete wavelet transform computed using
cubic spline wavelet at the scales a=21, 2
2 and 2
3
respectively. The first wavelet is selected for R peaks
which is greater than the adaptive threshold.
Step 5: An adaptive threshold value fixed is greaterthan that of R waves and less than the value of
Premature Ventricular Contraction (PVC). Afteridentifying the PVCs they are eliminated. The adaptivethreshold algorithm allows the decision thresholds to
adjust the signal quality changes and eliminate theneed for manual adjustments when changing from patient to patient. Two types of adaptive thresholdalgorithm are used in this paper.
The first one uses the first wavelet where themaximums and the minimums that correspond to theQRS complexes are tracked by the algorithm. Thesecond adaptive threshold algorithm also uses the firstwavelet where the maximums and minimums are
searched and the wavelet amplitude of the normal Rwaves is estimated. In the similar way, the waveletfiltering is applied to the ECG registration using Haar
and Db4 wavelet. The detection of R waves in somesignals was high which is shown in Figure 6. R wavedelay calculations are very difficult. The wavelettransforms of some ECG signals were not accurately
performed because of serious high frequency noise, baseline drift, and artifacts. The detection of R-waves
in some signals was very difficult due to the presenceof high amplitude peaks.
Figure 6. Detection of QRS complex
IV. R ESULTS A ND DISCUSSIONS
The analysis of algorithm was tested using ECGregistration from MIT-BIH arrhythmia database whichis internationally adopted. The algorithm has beendeveloped in the MATLAB environment with a
Wavelet Toolbox. In this work we have only used themodified limb lead II. The database contains 48
records which contains about 30 minutes ECG data.Here 10 records are used to evaluate the algorithm.The results obtained are summarized in Table I. Theten records contain 22273 beats. It provides a
comparison of the use of the wavelets of the differentwavelets for detection of the QRS complex. The speed
of detection is very fast. A False Negative occurs whenthe algorithm fails to detect an actual QRS quoted inthe corresponding annotation file of the MIT-BIHrecord and a false positive represents a false beat
detection.
Table I : VALIDATION RESULTS FOR THE PROPOSED QRS DETECTION ALGORITHM APPLIED TO MIT-BIH
ARRHYTHMIA DATABASE USING DIFFERENT WAVELETS
Cubic Spline wavelet Haar wavelet Db4 wavelet
Record Total beats
NBU beats
FP beats
FN beats
DE(%)
NBU beats
FPBeats
FN beats
DE(%)
NBU beats
FP beats
FN beats
DE(%)
100 2272 11 0 0 0.48 21 5 4 0.92 13 1 3 0.57
105 2543 8 1 0 0.31 15 3 1 0.58 12 3 2 0.47
108 1775 7 2 1 0.39 18 5 8 1.0 13 3 2 0.73
115 1953 12 2 1 0.61 20 7 5 1.02 14 5 2 0.71
118 2278 9 4 0 0.17 18 6 4 0.79 15 5 3 0.65
124 1473 6 1 0 0.41 18 7 5 1.22 10 4 3 0.67
200 1972 18 2 1 0.91 30 9 4 1.52 11 8 3 0.56
202 2102 7 1 0 0.33 19 8 5 9.03 14 8 3 0.66
212 2649 21 0 0 0.4 32 7 3 1.20 25 4 1 0.94
215 3256 11 1 3 0.34 22 8 5 0.67 15 5 2 0.46Total 22273 110 14 6 0.43 213 205 44 0.98 142 46 24 0.64
NBU - Number of beats Undetected, FP- False Positive, FN - False Negative, DE – Detection Error
© 2009 ACADEMY PUBLISHER
8/10/2019 Comparative Study of QRS Complex.pdf
http://slidepdf.com/reader/full/comparative-study-of-qrs-complexpdf 5/5
FULL PAPER
International Journal of Recent Trends in Engineering, Vol 2, No. 5, November 2009
277
CONCLUSIONS
A novel, effective, and noise tolerance QRSdetection algorithm based on Cubic Spline wavelet
transform is more suitable for this application becauseit reduces the probability of error in the detection ofthe QRS complex. The usefulness of the properties ofthe wavelet transform for QRS detection has beenstudied in this paper and a new QRS complex detectorhas been proposed. Through adaptive threshold allrelevant noise are removed of the signal allowing theutilization of simple detection logic for the QRSdetection. The main advantage of this kind of detectionis less time consuming for long time ECG signal.
REFERENCES
[1] J. Pan. and W.J. Tompkins, "A real-time QRS detection
algorithm", IEEE Trans. Biomed. Eng., vol. 32, 230–236, 1985.
[2] [2] P.S. Hamilton and W.J. Tompkins, "Quantitative investigationof QRS detection rules using the MIT/BIH arrhythmia
database",IEEE Trans. Biomed. Eng., vol. 33, pp. 1157–1165,
1986.[3] H.A.N.Dinh,D.K.Kumar,N.D.Pah and P.Burton,,“ Wavelets for
QRS detection “, Proceeding of the 23rd annual EMBS
international conference,Turkey,October 25-28,2001.[4] N.V.Thakor, J.G.Webster and W.J.Tompkins, “Estimation of QRS
complex power spectra for design of a QRS filter”, IEEE
Transactions on Biomedical Engineering, vol. BME-31, no. 11,pp.
702-706, 1986, pp. 702-706, Nov,1986.[5] A.Ruha, S.Sallinen and S.Nissila, “A real-time microprocessor
QRS detector system with a 1ms timing accuracy for measurementof ambulatory HRV”, IEEE Transactions on Biomedical
Engineering, vol.44, no. 3, pp. 159-167, March,1997.
[6] X.Afonso, W.J.Tompkins, T.Q.Nguyen and S.Luo, “ECG beat
detection using filter banks”, IEEE Transactions on BiomedicalEngineering, vol.46, no. 2 pp. 192-202, Feb, 1999.
[7] Ramakrishna and S.Saha, “ECG coding by wavelet based linear prediction”,IEEE Transactions on Biomedical Engineering ,
vol.44, no. 12, pp. 1253-1261, Dec, 1997.
[8] Natalia M.Arzeno,Zhi-De Deng,Chi Sang Poon, “Analysis of First
Derivative Based QRS detection algorithm”,IEEE Transactions on
Biomedical Engineering,” vol.55, no.2, pp.478-484, Feb 2008.[9] Romero Legarreta, PS Addison and N Grubb, “R-wave detection
using continuous wavelet modulus maxima”, IEEE proceedings onComputers in Cardiology, Vol. 30, pp. 565-568,Feb 2003.
[10] Romero I, Serrano L and Ayesta, “ECG frequency domain features
extraction: A new characteristic for arrhythmias classification”,Conference of the IEEE engineering in medicine and biology
society, May 2001.
[11] A. Gha ari a, H. Golbayani, “A new mathematical based QRS
detector using continuous wavelet transform”, Science DirectComputers and Electrical Engineering 34 pp. 81–91, May 2008.
[12] Rajesh Ghongade, Dr. A.A. Ghatol, “A Brief Performance
Evaluation of ECG Feature Extraction Techniques for Artificial Neural Network Base Classification”, IEEE, 2007.
[13] Sasnka Valluri Detection of the R wave in ECG signal,thesis,
J.N.T.U, India, 2002.
[14] M.l.Talbi,A.Charef,“PVC discrimination using the QRS powerspectrum and self –organizing maps ”, Science Direct, Computer
Methods and programs in medicine, May 2009.
[15] G.Selvakumar , K.Boopathy bagan, “An Efficient QRS ComplexDetection Algorithm using Optimal Wavelet”, Proc. of the 6th
WSEAS Int, MAY 2005.
[16] Wllis.j.Tompkins, Editor, “Biomedical Digital Signal Processing”
,Prentice Hall of India (2002).[17] Chia-Hung Lin, Yi Chun Du, Tainsong Chen, “Adaptive wavelet
network for multiple cardiac arrhythmias recognition”, Science
Direct, Expert Systems with Applications, pp 2601-2611,May2008.
[18] Gordan Cornelia,Reiz Romulus , “ECG signals processing
using Wavelets”, IEEE, proceedings of the fifth laserd
International conference May 2005.
[19] B.Castro ,D.Kogan and A.B.Geva, “ECG feature extractionusing optimal mother wavelet”,IEEE,2000.
[20] Maehmet Engin,Musa Fedakar,Erkan Zeki Engin,MehmetKorrek, “Feature measurements of ECG beats based onstatistical classifiers”,Science direct,pp 904-912, 2007.
[21] MIT-BIH (http://www.physionet.org).
© 2009 ACADEMY PUBLISHER


