
Copyright © sFlow.org. 2004 All Rights Reserved
sFlow & Benefits
Complete Network Visibility and ControlYou cannot control what you cannot see
Copyright © sFlow.org2004 All Rights Reserved
Today’s Hard Network Management Questions
• Who is using the network? – What are they using it for?
• Are my security policies effective?– How do I detect threats that have evaded the firewall?
• Why is my application or server slow?– Is it the network?
• How many servers do I need?– Where do I place them?
– Can a single server be used for several applications?
• What impact will new applications have on the network?– Is it possible to run VoIP?
Basic questions cannot be answered without network visibility

Copyright © sFlow.org2004 All Rights Reserved
How Do You Achieve Complete Network Visibility?
• Monitor every server and client?– Scalability
– Complexity of heterogeneous systems
• Monitor network traffic?– Effective - all network system interaction is seen on the network
– But how do you monitor thousands of ports with speeds up to 10Gig?

Copyright © sFlow.org2004 All Rights Reserved
Traditional Solution for Network Monitoring…Partial Network Visibility
• Probes, embedded counters:– Deployed at perimeter or key locations– Deployed on demand, in response to problems– Local measurements, no end-end flow data– Delayed, aggregated counts– Poor scalability to gigabit speeds– IP only– Insufficient detail of network traffic
Cost, scalability, and network impact of traditional network traffic monitoring technology
force compromises
Partial visibility =
control decisions
based on guesswork
guess
experiment

Copyright © sFlow.org2004 All Rights Reserved
sFlow: The Industry Standard for Monitoring High-speed, Multi-layer Switched Networks
Cost effective:• Embedded in every portScalable:• Monitors traffic flow for all network ports• Effective at gigabit speeds• Does not impact network performanceAlways-on:• Continuous monitoring• Robust under all network conditionsComplete visibility:• All devices = L2 – L7 flows end-end• Real-time and historical, detailed data

Copyright © sFlow.org2004 All Rights Reserved
Measurements from every portReal-time, central collection
= data driven control from your chair
sFlow Collector/Analyzer
sFlow
sFlowsFlow
sFlow
Complete Network Visibility Fundamentally Changes Network Management
Copyright © sFlow.org2004 All Rights Reserved
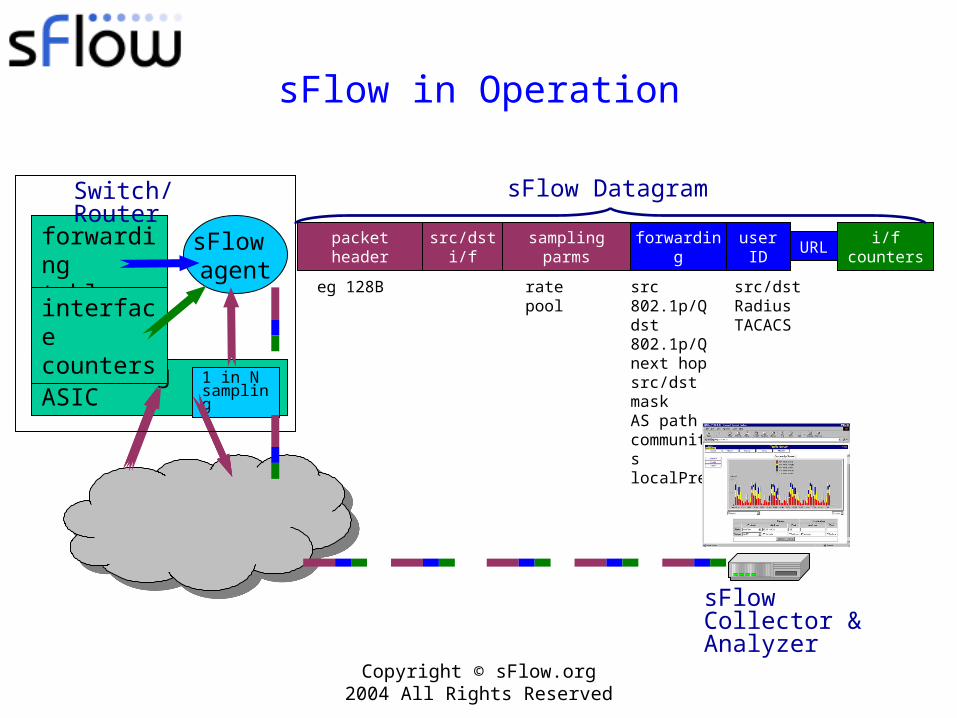
SwitchingASIC
1 in N sampling
sFlow in Operation
packet headersrc/dst
i/fsampling
parmsforwarding
user ID
URLi/f
counterssFlow agent
forwarding tables
interface counters
sFlow Datagram
eg 128B ratepool
src 802.1p/Qdst 802.1p/Qnext hopsrc/dst maskAS pathcommunitieslocalPref
src/dstRadiusTACACS
sFlow Collector & Analyzer
Switch/Router

Copyright © sFlow.org2004 All Rights Reserved
Statistical Model for Packet Sampling
Nn
cN c
Total number of frames = NTotal number of samples = nNumber of samples in class = cNumber of frames in the class estimated by:
Relative Sampling Error
0%
25%
50%
75%
100%
1 10 100 1000 10000
Number of Samples in Class
% E
rror
c%error
1196
Estimating Traffic per Protocol

Copyright © sFlow.org2004 All Rights Reserved
sFlow – Summary
sFlow agent
Switch/Router
HW Packet Sampling
ASIC
TrafficTraffic
sFlow Datagram
• Packet header (eg MAC,IPv4,IPv6,IPX,AppleTalk,TCP,UDP, ICMP)• Sample process parameters (rate, pool etc.)• Input/output ports• Priority (802.1p and TOS)• VLAN (802.1Q)• Source/destination prefix• Next hop address• Source AS, Source Peer AS• Destination AS Path• Communities, local preference• User IDs (TACACS/RADIUS) for source/destination• URL associated with source/destination• Interface statistics (RFC 1573, RFC 2233, and RFC 2358)
• Low cost• No impact to performance• Minimal network impact• Scalable• Quantitative measurements

Copyright © sFlow.org2004 All Rights Reserved
sFlow BenefitsReduce Costs
• Control network service costs– Internet access
• Ensure internet traffic remains within SLA guidelines and CIR
– Allocate costs to departments• Detailed usage information for individual users, applications, and
organizational entities• Each department can assess their usage and control costs.
– Optimize peering relationships• Identify the ISPs that carry the most transit traffic and are therefore the
optimal peers
• Plan for cost effective upgrades– Accurately forecast resource requirements by identifying the
bottlenecks
– Apply traffic shaping and rate control to maintain network performance

Copyright © sFlow.org2004 All Rights Reserved
sFlow Benefits Minimize Network Downtime
• Rapidly pin-point congestion problems– Why is the network slow?
• Troubleshoot network problems quickly– System and network problems often first manifest themselves in abnormal
traffic patterns
• You can’t fix what you can’t see– Detailed data enables rapid problem resolution, minimizing costly network
downtime

Copyright © sFlow.org2004 All Rights Reserved
sFlow BenefitsProtect your Assets with Security and Surveillance
• Design and implement targeted security policies– Determine traffic compartmentalization strategies– Define firewall configuration– Audit results
• Identify access policy violations and intrusions– Establish a baseline for normal network activity– Raise alerts to deviations from the baseline– Identify source and target of the intrusion
• Distributed Denial of Service Detection and diagnosis– Robust traffic profiling to highlight attacks (eg traffic targeted at a single host, port
scanning etc.)
• Identify worm-infected hosts and the spread of infections– Infected hosts identified by signature recognition– Identify significant changes in fan-out from every host

Copyright © sFlow.org2004 All Rights Reserved
sFlow BenefitsFund Upgrades or Increase Revenue
• Account and bill for network usage– Detailed data on network usage
• User• Groups of users• Application• Source/destination of traffic
– Different tariffs for internal vs. external traffic, etc.
• Charge for value added services – VoIP
• Develop new service revenue streams – Understand customer service usage


