
Corporate Strategy Presentation
Black Rock Mining Limited (ASX: BKT)February 2017
Delivering a compelling low capex, high margin graphite mine
1
Important InformationThe release, publication or distribution of this presentation in certain jurisdictions may be restricted by law and therefore persons in such jurisdictions into which thispresentation is released, published or distributed should inform themselves about and observe such restrictions.
DISCLAIMER
This presentation is for informational purposes only and does not constitute an offer to sell, or solicitation to purchase, any securities. Such Offer can be made onlythrough proper subscription documentation and only to investors meeting strict suitability requirements. Any failure to comply with these restrictions may constitute aviolation of applicable securities laws. In providing this presentation Black Rock Mining Limited ACN 094 551 336 (“Black Rock”) has not considered the financial positionor needs of the recipient. Persons needing advice should consult their stockbroker, bank manager, solicitor, attorney, accountant or other independent financial and legaladvisors.
FORWARD LOOKING STATEMENTS
Various statements in this presentation constitute statements relating to intentions, future acts and events. Such statements are generally classified as “forward lookingstatements” and involve known and unknown risks, uncertainties and other important factors that could cause those future acts, events and circumstances to differmaterially from what is presented or implicitly portrayed herein. Words such as “anticipates”, “expects”, “intends”, “plans”, “believes”, “seeks”, “estimates” and similarexpressions are intended to identify forward-looking statements. Black Rock caution shareholders and prospective shareholders not to place undue reliance on theseforward-looking statements, which reflect the view of Black Rock only as of the date of this presentation. The forward-looking statements made in this presentation relateonly to events as of the date on which the statements are made.
COMPETENT PERSONS
The information in this report that relates to Exploration Results and Mineral Resource Statements is based on information compiled by Steven Tambanis, who is amember of the AusIMM. He is an employee of Black Rock. Steven Tambanis has sufficient experience which is relevant to the style of mineralisation and type of depositunder consideration and to the activity which he is undertaking to qualify as a Competent Person as defined in the 2004 and 2012 Edition of the ‘Australasian Code forReporting of Exploration Results, Mineral Resources and Ore Reserves’.
The information that relates to Mineral Resources is based on and fairly represents information compiled by Mr Lauritz Barnes, (Consultant with Trepanier Pty Ltd) andMr Aidan Platel (Consultant with Platel Consulting Pty Ltd). Mr Barnes and Mr Platel are members of the Australian Institute of Mining and Metallurgy and have sufficientexperience of relevance to the styles of mineralisation and types of deposits under consideration, and to the activities undertaken to qualify as Competent Persons asdefined in the 2012 Edition of the Joint Ore Reserves Committee (JORC) Australasian Code for Reporting of Exploration Results, Mineral Resources and Ore Reserves.Mr Barnes, Mr Platel and Mr Tambanis consent to the inclusion in this report of the matters based on their information in the form and context in which they appear.
2

Table of Contents
3
1. Overview
2. Mahenge Graphite Project
3. March 2016 Scoping Study
4. Peer Comparison
5. Pre-Feasibility Study
6. Execution
7. Summary

1. Black Rock Mining Overview
• The Mahenge Graphite Project has a JORC Compliant Mineral Resource Estimate of 203m tonnes at 7.8% Total Graphitic Carbon
(“TGC”) with likely mine targets, Ulanzi and Cascades holding 164.6m tonnes at 8.2% TGC (13.5m tonnes of contained graphite).
• There is a high grade portion of 44.2m tonnes at 10.6% TGC or 22.5m tonnes at 11.7% TGC.
• Bulk sampling work completed for the Scoping Study produced 77% large flakes or above (>150μm). This delivers an industry
leading 6.3% large flakes per tonne of the likely mine target resource.
• Pre production capex at Scoping Study level for a graphite mine delivering an initial 52k tonnes per annum was a low US$57.3m
with cash costs to port of US$458 per tonne.
• Concentrate grades of over 99% have been produced via simple flotation circuit, spherical graphite has been produced and battery
cell testing is returning excellent results, providing opportunities to target the growing battery market.
4

1. Black Rock Mining Overview (cont’d)
5
The Company is expecting to release the results of a PFS in March 2017 delivering similar pre production capex and cash
costs for an initial 50k to 60k tonnes per annum operation growing over three phases to over 200k tonnes per annum.
The Company’s focus is to ensure that it has:
• Industry leading low pre production capex
• Optimum scale to drive cash costs whilst ramping up to meet expected demand growth
• Completed all relevant test works to demonstrate its high quality product to ensure ongoing discussions with potential
partners deliver results, and
• The right team to design, construct and operate a graphite mine and spheronising plant

2. Mahenge Graphite Project
6
Ulanzi
Cascades
Image showing Ulanzi and Cascades localities. Grid
spacing is 500m.Image showing project location in Tanzania
High grade resource capable of delivering a multi generational mine with significant scale
Cascades and Ulanzi JORC Mineral Resourceestimate of 164.6m tonnes at 8.2% TGC
Large, high grade Tanzanian Project with the fourthlargest JORC Resource in the world, supported byclose proximity to infrastructure.
Ulanzi has a JORC Compliant Resource of 111.8m tonnes at 8.2% TGC including a higher grade sub set of 29.3m tonnes at 9.9% TGC*
Cascade has a JORC Compliant Resource of 52.8m tonnes at 8.3% TGC including a higher grade sub set of 14m tonnes at 12.1% TGC**
Over 50% of Resource tonnes in the Measured and Indicated categories
* ASX Release of 6 October 2016
** ASX Release of 12 December 2016

3. March 2016 Scoping Study
7
Industry leading pre production capex, absolute flake size and concentrate grade
Pre production capex of US$57.3m*
Annual production of 52k tonnes of graphite concentrate for aninitial 25 year mine life
Assumed feed grade of 10.5% TGC
Strip ratio of 1.23:1
Cash costs of production of US$458 per tonne
Subsquent bulk sample optimisation delivered a 99.1% concentrate grade for over 88% of flake sizes (>75 μm) fromconventional flotation circuit processing**
Subsequent spherical graphite test works delivered batterygrade purity with excellent tap density***
Screen Size Mass Total Mine Target %
> 300 μm 17.4% 17.4% 1.4%
> 180 μm 34.8% 52.2% 4.3%
> 150 μm 10.4% 62.7% 5.2%
* ASX Release of 22 March 2016
** ASX Release of 16 August 2016
*** ASX Release of 22 September 2016

4. Peer Comparison
8
Absolute percentage of large flake
size vs concentrate grade based
on head grade for mine plan and
relevant recoveries as presented in
most recent mining study and or
market release.
LLG.V
BKT.AX
BAT.AXGPX.AXFMS.VKNL.AX
LEM.V
SYR.AXMNS.AX
EGZ.TO
TON.AXBAT.AX
VRC.AXNGC.V
LML.AX
HXG.AX EGA.VALP.V
CCB.VTON.AXZEN.V0%
1%
2%
3%
4%
5%
6%
7%
8%
9%
88% 90% 92% 94% 96% 98% 100%
Larg
e /
ju
mb
o f
lake (
>150u
m,
% a
bso
lute
)
Concentrate grade (%)

5. Pre-Feasibility Study
9
Three phase mine design with initial phase target of 50k to 60k tonnes per annum ramping to over 200k tonnes per annum*
Ramp up expected to take advantage of growing global demand for batteries whilst ensuring that pre production capexremains at industry leading low levels
Mine design to focus on high grade sub set of CascadesResource of 14m tonnes at 12.1% TGC
PFS expected to benefit from ongoing test work demonstratinggraphite suitability for the battery market and other high endapplications
Due for release in March 2017
Three phase mine design with low pre production capex and substantial long term production
* ASX Release of 22 December 2016
6. Execution – Team
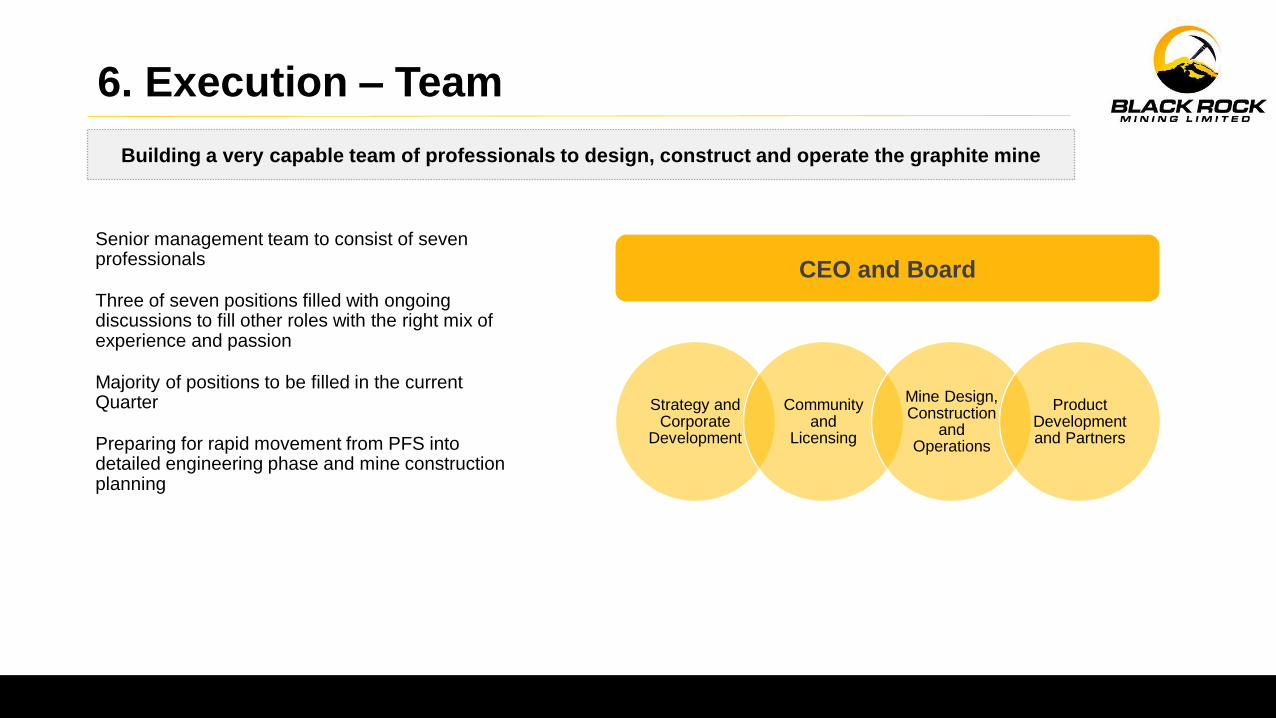
Senior management team to consist of sevenprofessionals
Three of seven positions filled with ongoingdiscussions to fill other roles with the right mix of experience and passion
Majority of positions to be filled in the currentQuarter
Preparing for rapid movement from PFS intodetailed engineering phase and mine constructionplanning
Building a very capable team of professionals to design, construct and operate the graphite mine
Strategy and Corporate
Development
Communityand
Licensing
Mine Design, Construction
and Operations
ProductDevelopmentand Partners
CEO and Board

6. Execution – Low Capex Focus
11
Low capex is king
• Disciplined focus on realistic low pre production capex to ensure financing is achievable and ramp up profile
properly matches likely increases in market demand
• Meaningful scale supported by large multi-generational Resource
• Long term product development and partner strategy supported by superior graphite product
Low Production Capex Meaningful scale
Substantial Upside Supported by
large Resource and superior
product
Annual EBITDA target of over
US$150m
Targeting high grade
resource to deliver
margins of over
US$500 per tonne
Increasing
margins due to
scale efficiencies
Downstream opportunity
for enhanced margins.
Initial target of 5ktpa
then scaling up. Scoping
study underway
Ramp up to match
likely demand growth
in battery market
Spheronising, purification and Coating Plant
Phase Three production of
100ktpa
Phase Two production of 50k to 60ktpta
Phase One production of 50k to 60ktpa

6. Execution – Product Development
Test work being conducted in Europe, USA and Asia to demonstrate thesuperior qualities of Mahenge graphite
High purity concentrates up to 99% TGC are expected to sell at a premium to lower grade competitor material
Mahenge graphite is high density due to thick flakes
Spherical test work indicates that Mahenge concentrates can deliverhigher spheronising yields due to thick flake characterisitics
Acid purification methods have delivered battery grade 99.95% purity
Thermal purification methods have achieved up to an exceptionally high99.9999% purity
Battery cell testing continues to return excellent electrochemical results
Long term battery cycling tests indicate that Mahenge graphite isextremenly stable and as a result should deliver longer lifespan batteries
Scoping Study underway for spherical graphite, purification and coating
12
Ongoing work to reinforce superior product qualities for the right partners
SEM image of Mahenge spherical graphite

7. Summary
• The Mahenge Graphite Project has a JORC Compliant Mineral Resource Estimate of 203m tonnes at 7.8% TGC (15.9m tonnes of contained graphite), with likely mine targets, Ulanzi and Cascades holding 164.6m tonnes at 8.2% TGC (13.5m tonnes of contained graphite).
• There is a higher grade portion of 44.2m tonnes at 10.6% TGC of which Cascades contains14m tonnes at 12.1% TGC.
• Pre production capex at Scoping Study level for a graphite mine delivering an initial 52k tonnes per annum was only US$57.3m with cash costs to port of US$458 per tonne.
• Concentrate grades of over 99% have been produced via simple flotation circuit, spherical graphite has been produced and battery cell testing is returning excellent results, providing opportunities to target the growing battery market.
• The Company is expecting to release the results of a PFS this Quarter delivering similar pre production capex and cash costs foran initial 50k to 60k tonnes per annum operation growing over three phases to over 200k tonnes per annum.
The Company’s focus remains ensuring it has:
• industry leading low pre production capex,
• optimum scale to drive cash costs whilst ramping up to meet expected demand growth,
• completed all relevant test work to demonstrate its high quality product to ensure ongoing discussions with potential partners deliver results, and
• the right team to design, construct and operate a graphite mine and spheronising plant
13
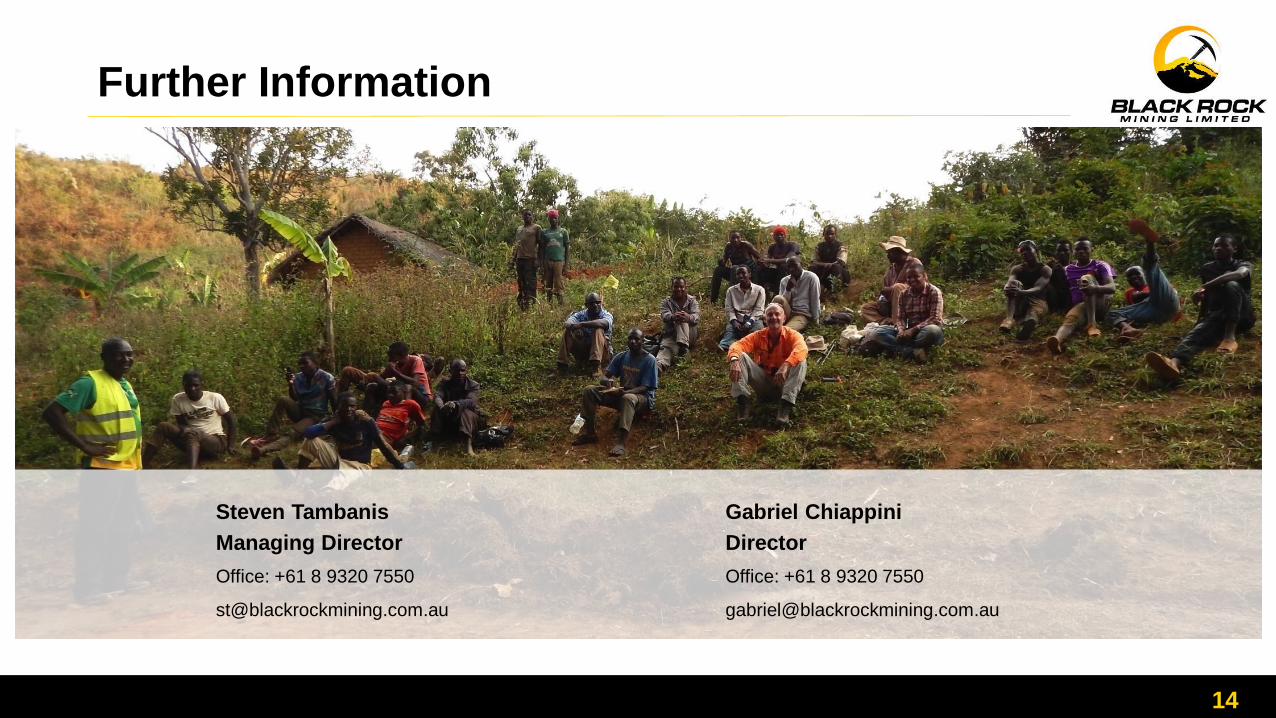
Further Information
14
Steven Tambanis
Managing Director
Office: +61 8 9320 7550
Gabriel Chiappini
Director
Office: +61 8 9320 7550
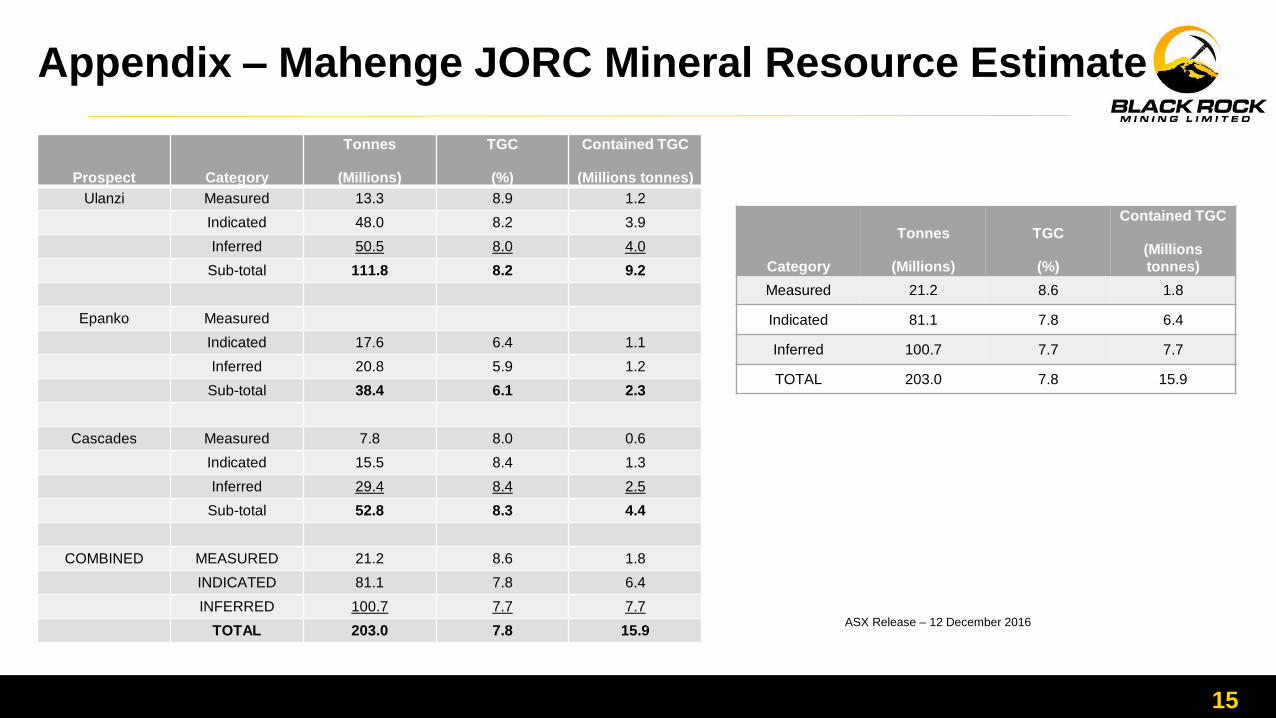
Appendix – Mahenge JORC Mineral Resource Estimate
15
ASX Release – 12 December 2016
Category
Tonnes
(Millions)
TGC
(%)
Contained TGC
(Millions
tonnes)
Measured 21.2 8.6 1.8
Indicated 81.1 7.8 6.4
Inferred 100.7 7.7 7.7
TOTAL 203.0 7.8 15.9
Prospect Category
Tonnes
(Millions)
TGC
(%)
Contained TGC
(Millions tonnes)
Ulanzi Measured 13.3 8.9 1.2
Indicated 48.0 8.2 3.9
Inferred 50.5 8.0 4.0
Sub-total 111.8 8.2 9.2
Epanko Measured
Indicated 17.6 6.4 1.1
Inferred 20.8 5.9 1.2
Sub-total 38.4 6.1 2.3
Cascades Measured 7.8 8.0 0.6
Indicated 15.5 8.4 1.3
Inferred 29.4 8.4 2.5
Sub-total 52.8 8.3 4.4
COMBINED MEASURED 21.2 8.6 1.8
INDICATED 81.1 7.8 6.4
INFERRED 100.7 7.7 7.7
TOTAL 203.0 7.8 15.9


