
RETAIL SECTOR
July 27, 2016
Sameep Kasbekar, CFA
[email protected]+91 22 66121281
Amit PurohitResearch [email protected]+91 22 66121340
Dhaval Mehta Research [email protected]+91 22 66121284
Research Analyst
Annual Report Analysis
Building blocks for growth in place
Shoppers Stop
Arvind
TitanPage Industries
Arvind
Arvind
Arvind
Arvind
Arvind
Arvind
Titan
Titan
Titan
Page Industries
Page Industries
Page Industries
Shoppers Stop
Shoppers Stop
Shoppers Stop
ShoppersStop
Titan
Titan
TitanArvind
Shoppers Stop
Shoppers Stop
Arvind
Page Industries
Page Industries
Titan
Titan
Page Industries Shoppers StopArvind
Arvind
Titan
TitanShoppers Stop
Titan
Page Industries

Retail Sector India Equity Research | Annual Report Analysis
Emkay Research | July 27, 2016 2
Contents
Growth has tapered, but levers well in place ........................................................................ 3
Industry charts .................................................................................................................... 5
Key excerpts from the Annual report .................................................................................. 6
Valuation charts .................................................................................................................. 7
Companies
Arvind — Growth brands to POWER through ........................................................................... 9
Page Industries — Category and network expansion remain key levers for growth ................ 14
Shoppers Stop — Penetration growth through store expansion and omnichannel ................. 19
Titan Company — Banking on demand revival ....................................................................... 24

Emkay Research is also available on www.emkayglobal.com, Bloomberg EMKAY<GO>, Reuters and DOWJONES. Emkay Global Financial Services Ltd.
©
Your success is our success
Emkay
India Equity Research | Retail
July 27, 2016
Annual Report Analysis
Retail Sector
Growth has tapered, but levers well in place
Arvind ACCUMULATE
CMP Target Price
305 330
Page Industries BUY
CMP Target Price
13,372 15,050
Shoppers Stop BUY
CMP Target Price
375 476
Titan Company HOLD
CMP Target Price
414 330
Sameep Kasbekar, CFA
+91 22 66121281
Amit Purohit
+91 22 66121340
Dhaval Mehta
+91 22 66121284
Key takeaways from FY16 annual reports
Indian retail remains well placed to benefit from increased discretionary spend and revival
in urban demand. Industry pegs retail sector growth at 14% and modern trade growth at
22% to grow to USD 1.2tn and USD 160bn respectively by 2020
Overall growth across our coverage has tapered in FY16 on account of weak consumer
sentiments, detrimental impact from ecommerce and company specific factors
(restructuring in Arvind’s Megamart, jewellers strike etc.)
Brick and Mortar players are increasingly moving towards an omnichannel strategy to
explore new avenues for growth and compete with ecommerce marketplaces
We believe that a strong brand portfolio, new categories and innovation, focus on improved
mix and increase in penetration are key levers for growth. We have a Buy rating on Page
Industries and Shoppers Stop, Accumulate rating on Arvind and Hold rating on Titan
Indian Retail well placed to benefit from consumption uptick
The annual reports of retail companies indicate an upbeat mood about the growth prospects
of the sector. The size of the Indian Retail sector is estimated at USD 630bn of which organised
retail stands at 9-10% at USD 60bn, accounting for c.25% of India’s GDP. Indian retail is
expected to grow by 14% CAGR to USD 1.2tn by 2020 while organised retail is expected to
outpace the sector growing at 22% to USD 160bn by 2020 driven by i) increasing shift from
unorganised to organised retail, ii) growing urbanisation, iii) rising disposable income, iv)
favourable demographics and growing middle class, v) improving infrastructure (malls,
shopping centres etc) and vi) growing penetration of ecommerce.
Overall growth has slowed down in FY16
Weak consumer sentiments, impact from ecommerce players and company specific factors
has resulted in revenue growth tapering in FY16. In FY16, i) Arvind’s Brand and Retail portfolio
reported a growth of +16.2% (versus +22.7% in FY15) impacted by restructuring in Megamart
(-11% yoy). The power brand portfolio’s growth too tapered to 20.2% (versus 25% in FY15),
ii) Page’s revenues grew at 15.4% (historic CAGR of 35%), on account of slower growth in
menswear and sportswear. Page reported a weaker volume growth at 9.6% in FY16. iii)
Sustained competition from ecommerce players coupled with a slow-down in store expansion
in the last 2 years resulted in Shoppers Stop revenue growth of 11.4% in FY16 (versus 12.2%
in FY15). However the Same-store Sales Growth (SSG) of the departmental store improved
from 5% in FY15 to 8.5% in FY16. iv) Regulatory hurdles (Pan Card rule), fluctuating gold prices,
and jewellers strike impacted Titan’s revenues which declined by 5.4% in FY16. Jewellery
segment reported decline of 8%, watches grew at a muted 2% and eyewear grew at 12%.
Omnichannel strategy – turning their weakness into strength
The Indian retail sector was adversely impacted by the disruptive nature of ecommerce players
through their deep discounting in FY15. However, more rational pricing regime and new DIPP
regulation on cash burn by ecommerce marketplaces has reduced the impact (to a certain
degree) in FY16. Additionally, brick and mortar retailers are increasingly turning towards
ecommerce as a new channel via an omnichannel strategy. During FY16, i) Arvind launched
its omnichannel portal NNNow.com to capture the growing trend in online shopping, ii) Page
continued selling its products via JockeyIndia.com and increased its tie-ups with various
ecommerce market places, iii) Shoppers Stop re-launched its website and introduced mobile
apps in both Android and iOS stores, iv) Titan acquired CaratLane to boost its online presence
and gain technical knowhow of online retailing.
We seek your feedback and support in the ongoing Asia Money survey.
Click here to make your appreciation count
Retail Sector India Equity Research | Annual Report Analysis
Emkay Research | July 27, 2016 4
Category expansion/new launches & store expansion remain key growth drivers
New brands, category expansion and increasing share of private labels and higher value added
products are essential to propel growth in brands and retail. i) Arvind has focused on speciality
retail adding Sephora and Aeropostale during FY16, ii) Page expanded its category in kidswear
as well as new launches in the innerwear segment, iii) Shoppers Stop reported a private +
exclusive label mix of 17% of revenues and intends to increase this share to 20-25% in the next
5 years, iv) Titan launched new ranges in jewellery, watches, and eyewear and plans on growing
its studded jewellery share by increasing its market share in the wedding jewellery segment.
While finding quality retail space is becoming increasing challenging for retailers, an increase in
penetration is the chief growth engine. i) Arvind plans on adding over 3mn sqft of retail space
across 300 cities over the next 4-5 years, ii) Page remains focused on increasing its EBO
network, iii) Shoppers Stop intends on adding 6 departmental stores and 3 hypermarket stores
in FY17, iv) Titan plans on adding stores across formats.
View and valuation
With a growing shift towards organised retail, we believe that companies in our coverage are
well placed to benefit from an uptick in urban demand. Additionally, their foray into
ecommerce/omnichannel will bear fruit in the medium term and level the playing field with various
online marketplaces. We expect FY17/18E revenues to grow at i) Arvind consolidated revenues
at 15%/15%, ii) Page at 22%/21%, iii) Shoppers Stop standalone at 14%/15%, and iv) Titan at
20%/15%.
We continue to maintain our positive stance on the sector led by rising urban consumption and
improved spending on the back of the 7th Pay Commission. We have a Buy rating on Page
Industries (TP Rs 15,050) and Shoppers Stop (TP Rs 476), Accumulate rating on Arvind (TP Rs
330) and Hold rating on Titan (TP Rs 330).
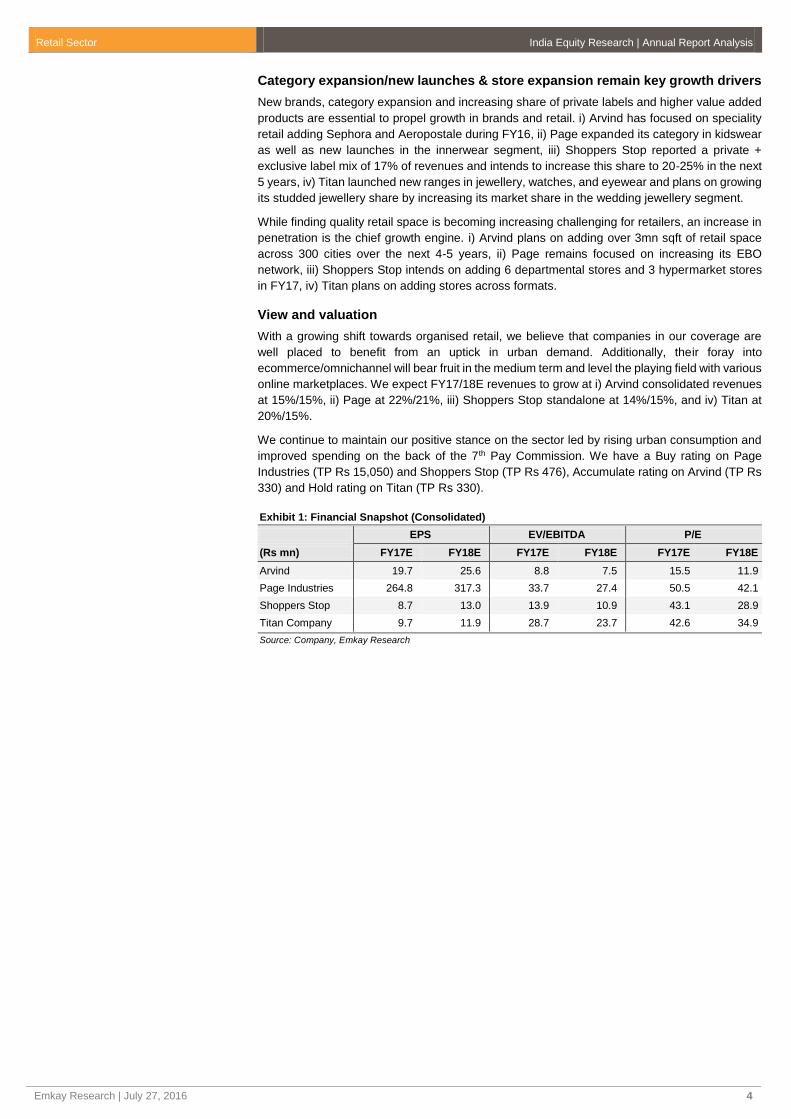
Exhibit 1: Financial Snapshot (Consolidated)
EPS EV/EBITDA P/E
(Rs mn) FY17E FY18E FY17E FY18E FY17E FY18E
Arvind 19.7 25.6 8.8 7.5 15.5 11.9
Page Industries 264.8 317.3 33.7 27.4 50.5 42.1
Shoppers Stop 8.7 13.0 13.9 10.9 43.1 28.9
Titan Company 9.7 11.9 28.7 23.7 42.6 34.9
Source: Company, Emkay Research

Retail Sector India Equity Research | Annual Report Analysis
Emkay Research | July 27, 2016 5
Industry Charts – SSG/overall revenue growth muted in FY16; increased penetration and healthy balance sheets are positives
Exhibit 2: Only SHOP sees improvement in SSG
Source: Company, Emkay Research
Exhibit 3: Revenue growth was muted in FY16
Source: Company, Emkay Research
Exhibit 4: EBITDA margins a mixed bag
Source: Company, Emkay Research
Exhibit 5: Store count addition has been aggressive
Source: Company, Emkay Research; *Standalone
Exhibit 6: Inventory days have remained fairly stable (Ex.Titan)
Source: Company, Emkay Research
Exhibit 7: Working capital days have marginally increased
Source: Company, Emkay Research
2.3%
-13.0%
8.5%
1%
-16%
-12%
-8%
-4%
0%
4%
8%
12%
Arvind Brands Megamart Shoppers Stop Hypercity
SSG
-10%
0%
10%
20%
30%
Arv
ind B
rands
Pa
ge M
ensw
ear
Pa
ge W
om
ensw
ear
Pa
ge S
port
sw
ear
Titan J
ew
elle
ry
Titan W
atc
hes
Revenue growth (%)
0%
5%
10%
15%
20%
25%
Arvind Page Shoppers Stop Titan
%
EBITDA margins
-30 bps
+35 bps
+20 bps-130 bps
0
500
1000
1500
2000
2500
3000
Arvind Page ShoppersStop*
Titan
Sto
res a
dded
FY15 FY16
+384
+675
+59 +82 +11 +6
+123 +82
0
20
40
60
80
100
120
140
160
Arvind Page Shoppers Stop Titan
Days
FY15 FY16
0
20
40
60
80
100
120
140
Arvind Page Shoppers Stop Titan
Days
FY15 FY16

Retail Sector India Equity Research | Annual Report Analysis
Emkay Research | July 27, 2016 6
Key excerpts from the Annual report
Arvind Ltd. Page Industries
Sector trends and comments
Indian textile sector is expected to grow at 8.7% CAGR over the
next 10 years driven by both domestic consumption (abundant fibre
supply, favourable demographic and work force) and exports
(better cost competitiveness).
Apparel retail sector expected to grow at CAGR of 12% driven by
i) shift from unorganised to organised retail, ii) favourable
demographics, iii) rising income level and consumption, and iv)
increasing investment in organised retail.
Annual report theme
Remains focused on enriching lifestyle using a wide array of brand
offerings and category extensions in Brand & retail portfolio. In
Textiles, company will drive growth through asset-light garmenting
business as part of vertical integration strategy to capture entire
value in textile chain.
Key comments by management ad verbatim
“Your company’s strong portfolio of foreign brands allows it to offer
consumers a whole range of products across all price segments.
“Keeping in view the changing trend in consumer buying behaviour
and to positively gain from the rapid growth of e-commerce as a
sales channel your Company has recently launched India’s first
true omnichannel experience – NNNow.com.”
Sector trends and comments
Innerwear market is Rs 199.6bn and is slated to grow at 13% to
reach Rs 682.7bn by 2024 led by rising income and urbanisation
and shift from un-branded to branded products.
Men’s innerwear is pegged at Rs 74.5bn and growing at 9% CAGR.
Women’s innerwear market at about Rs 125.1bn and growing at
15% CAGR. Higher number of working women, rising share of
western wear and brand consciousness are key growth drivers.
Kidswear market is estimated at $ 8.3bn, with boys wear
contributing to $ 4.3bn. Increased spending on children, growing
brand awareness amongst kids and focus on kids wear by
organised players are levers for growth.
T-shirts is Rs 138.3bn and expected to grow at 13% CAGR to Rs
249.4bn by 2019.
Annual report theme
Jockey highlights its Brand equity and category expansion that
makes it the leading player in the innerwear segment in India.
Further, concerted involvement with consumer via deeper
penetration, adoption of new retail formats and premium product
launches have been key drivers.
Key comments by management ad verbatim
“Your company is highly encouraged by the enduring strong brand
equity, image and leadership of the Jockey brand.”
Shoppers Stop Titan Company
Sector trends and comments
Retail in India is expected to grow at 13% to $1.2tn by 2020 driven
by i) growing urbanisation, ii) rising disposable income, iii) younger
demographics and rising middle class, iv) improving infrastructure
and rising number of malls, v) faster adoption of technology.
Modern retail is expected to grow by 22% CAGR over the next four
years to $160bn.
Annual report theme
Shoppers Stop celebrates 25 years of inception, highlighting their
journey since 1991. In their Annual report of 2016, they exhibit 25
key factors that have contributed to their success as a retailer.
They also mention their strategy moving into the new phase as a
leading omnichannel player.
Key comments by management ad verbatim
“Shoppers Stop embarked on a 3 Year omni-channel journey last
year to tap into the exponential e-commerce growth in India. The
Company has plans for focused investments in technology &
operations set-up over the next few years to provide seamless
shopping experiences online & in-store for our customers and drive
profitable revenue growth through digital.”
“ As part of the Year 1 phase we have re-launched our website and
introduced brand new mobile apps in both Android PlayStore & iOS
AppStore based on the SAP Hybris platform.”
Sector trends and comments
Migration of youngsters to cities, shift from unbranded to branded
jewellery, rising working women population and the unexploited
wedding jewellery market are key drivers for jewellery category.
Technology products like smart watches and emergence of e-
commerce led to competitive intensity and reinvented the category.
In eyewear category, advertising and entry of international players
has led to upgradation to branded lenses. Optometry continues to
remain a key focus area.
Annual report theme
While regulatory hurdles, lukewarm demand in the jewellery and
watches segment and loss of revenues in the jewellers strike has
impacted the overall growth in 2016, Titan remains focused on
introducing new products, innovation and increasing reach through
store expansion.
Key comments by management ad verbatim
“It is increasingly apparent that the watch category has significantly
transformed over the past two decades from being a must have
time keeping device to a nice to have accessory and smart wrist
device. Consequently. With greater opportunity in higher price
points and technology products, our manufacturing base that is
geared for higher volume, needs transformation and this is being
undertaken through cost compression and contract manufacturing”
Source: Company, Emkay Research

Retail Sector India Equity Research | Annual Report Analysis
Emkay Research | July 27, 2016 7
Valuation charts
Exhibit 8: Arvind PE chart – trades between 5x and 20x
Source: Emkay Research
Exhibit 9: Arvind EV/EBITDA chart – trades between 4x and 10x
Source: Emkay Research
Exhibit 10: Page PE chart – trades between 10x and 70x
Source: Emkay Research
Exhibit 11: Page EV/EBITDA chart – trades between 10x and 40x
Source: Emkay Research
Exhibit 12: Shoppers Stop PE chart – trades between 10x and 100x
Source: Emkay Research
Exhibit 13: Shoppers EV/EBITDA chart – trades between 7x and 28x
Source: Emkay Research
Exhibit 14: Titan PE chart – trades between 10x and 40x
Source: Emkay Research
Exhibit 15: Titan EV/EBITDA chart – trades between 8x and 38x
Source: Emkay Research
0
100
200
300
400
500
Ap
r-09
Nov-0
9
Jun
-10
Dec-1
0
Jul-1
1
Fe
b-1
2
Au
g-1
2
Ma
r-13
Oct-
13
Ma
y-1
4
Nov-1
4
Jun
-15
Dec-1
5
Jul-1
6
5x
10x
15x
20x
0
100
200
300
400
500
Ap
r-09
Nov-0
9
Jun
-10
Dec-1
0
Jul-1
1
Fe
b-1
2
Au
g-1
2
Ma
r-13
Oct-
13
Ma
y-1
4
Nov-1
4
Jun
-15
Dec-1
5
Jul-1
6
4x
6x
10x
8x
0
3000
6000
9000
12000
15000
18000
21000
Jul-0
7
Jan
-08
Jul-0
8
Jan
-09
Jul-0
9
Jan
-10
Jul-1
0
Jan
-11
Jul-1
1
Jan
-12
Jul-1
2
Jan
-13
Jul-1
3
Jan
-14
Jul-1
4
Jan
-15
Jul-1
5
Jan
-16
Jul-1
6
10x
30x
50x
70x
0
3000
6000
9000
12000
15000
18000
Jul-0
7
Jan
-08
Jul-0
8
Jan
-09
Jul-0
9
Jan
-10
Jul-1
0
Jan
-11
Jul-1
1
Jan
-12
Jul-1
2
Jan
-13
Jul-1
3
Jan
-14
Jul-1
4
Jan
-15
Jul-1
5
Jan
-16
Jul-1
6
40x
30x
20x
10x
0
200
400
600
800
1000
1200
Ap
r-09
Nov-0
9
Ma
y-1
0
Nov-1
0
Ma
y-1
1
Nov-1
1
Jun
-12
Dec-1
2
Jun
-13
Dec-1
3
Jun
-14
Dec-1
4
Jul-1
5
Jan
-16
Jul-1
6
10x
30x
70x
100x
0
200
400
600
800
1000
Ma
y-0
5
Dec-0
5
Jun
-06
Dec-0
6
Jun
-07
Dec-0
7
Jun
-08
Dec-0
8
Jun
-09
Dec-0
9
Jun
-10
Dec-1
0
Jun
-11
Dec-1
1
Jul-1
2
Jan
-13
Jul-1
3
Jan
-14
Jul-1
4
Jan
-15
Jul-1
5
Jan
-16
Jul-1
67x
14x
28x
21x
0
50
100
150
200
250
300
350
400
450
Ap
r-02
Jun
-03
Jul-0
4
Au
g-0
5
Se
p-0
6
Oct-
07
Nov-0
8
Dec-0
9
Jan
-11
Fe
b-1
2
Ap
r-13
Ma
y-1
4
Jun
-15
Jul-1
6
20x
10x
30x
40x
0
100
200
300
400
500
600
700
Ap
r-02
Jun
-03
Jul-0
4
Au
g-0
5
Se
p-0
6
Oct-
07
Nov-0
8
Dec-0
9
Jan
-11
Fe
b-1
2
Ap
r-13
Ma
y-1
4
Jun
-15
Jul-1
6
8x
18x
28x
38x

Retail Sector India Equity Research | Annual Report Analysis
Emkay Research | July 27, 2016 8
Companies
Arvind
Page Industries
Shoppers Stop
Titan Company

Emkay Research is also available on www.emkayglobal.com, Bloomberg EMKAY<GO>, Reuters and DOWJONES. Emkay Global Financial Services Ltd.
©
Your success is our success
Emkay
India Equity Research | Retail
July 27, 2016
Annual Report Analysis
Arvind
Growth brands to POWER through
CMP Target Price
Rs305 Rs330 ()
Rating Upside
ACCUMULATE () 8.2 %
Change in Estimates
EPS Chg FY17E/FY18E (%) NA
Target Price change (%) NA
Previous Reco ACCUMULATE
Emkay vs Consensus
EPS Estimates
FY17E FY18E
Emkay 19.7 25.6
Consensus 17.3 21.6
Mean Consensus TP Rs 358
Stock Details
Bloomberg Code ARVND IN
Face Value (Rs) 10
Shares outstanding (mn) 258
52 Week H/L 366 / 235
M Cap (Rs bn/USD bn) 79 / 1.17
Daily Avg Volume (nos.) 1,777,009
Daily Avg Turnover (US$ mn) 8.3
Shareholding Pattern Mar '16
Promoters 43.8%
FIIs 22.6%
DIIs 16.4%
Public and Others 17.2%
Price Performance
(%) 1M 3M 6M 12M
Absolute (3) 7 (4) 1
Rel. to Nifty (3) (1) (16) 1
Relative price chart
Source: Bloomberg Sameep Kasbekar, CFA
+91 22 66121281
Amit Purohit
+91 22 66121340
-10
0
10
20
30
40
200
235
270
305
340
375
Jul-15 Sep-15 Nov-15 Jan-16 Mar-16 May-16 Jul-16
%Rs
Arvind (LHS) Rel to Nifty (RHS)
Brands segment continues to outpace the textile segment; Category
expansion in brands, space addition, and vertical integration in textiles
through garmenting are key drivers.
Denims and Megamart impact growth - Arvind’s standalone revenue growth was muted
at 3%, adversely impacted by the denims, woven, and voiles businesses. However,
garmenting growth was robust at 24%. Arvind’s consolidated revenues grew by 8% led by
16% growth in the Brand and Retail segment.
Bottlenecks in production and lower realisation impacts textile growth – Constraints
on plant utilization (bottlenecks) due to change in product mix in the denim business led
to 3% decline in revenues. After the expansion in capacities, the woven business reported
a subdued 4% growth led by a 5% growth in volumes (realisations were tad lower yoy).
The voiles business continued to register a decline in revenues of 4%. With the
stabilisation of operations of the garmenting plant in Ethiopia, volumes grew by 28%
resulting in a revenue growth of 24% in garmenting. Knits reported a growth of 10%.
Brand and Retail growth impacted by Megamart – Arvind Lifestyle Brands Ltd‘s growth
trajectory tapered to 16% (versus 20%+ CAGR FY12-15) primarily impacted by
restructuring in Megamart (-11% yoy). However, both Power Brands (+20% yoy) and
Growth Brands (+39%) maintained a healthy revenue traction in FY16. The brand segment
reported LTL growth of 2.3% while Megamart posted a LTL decline of 13%.
Megamart now rebranded as Unlimited – Company has re-branded c.37 Megamart
stores as “Unlimited” with a change in strategy for the retail segment. Unlimited is a small
– medium format store that primarily offers Arvind’s private labels.
Space addition – Arvind remained aggressive with its expansion strategy in the Brands
and Speciality business opening 119 and 20 stores respectively. However, owing to
restructuring in Megamart, company closed down 48 stores in FY16. The Brand and Retail
segment currently has a distribution strength of 953 stores.
EBITDA margins – Consolidated EBITDA margins declined by 30bps to 12.6% in FY16
impacted by lower SSG in the brands portfolio and unfavourable mix (higher contribution
from low margin segments such as Garmenting, and Brands and Retail).
Balance sheet performance - The consolidated debt increased by Rs 1.4bn to Rs 35.4bn
largely to fund capital expenditure (Rs 4.1bn) and higher working capital requirement,
however the debt:equity ratio has remained flat at 1.2x. Working capital days have
marginally increased to 121 days (+3 days yoy) owing to an increase in receivable days.
Despite an increase in capex, company reported free cash flow of Rs 2.8bn led by
improving cash flow from operations. The dividend payout ratio declined from 21% in FY15
to 17% in FY16.
Financial Snapshot (Consolidated)
(Rs mn) FY14 FY15 FY16 FY17E FY18E
Net Sales 66,648 75,392 81,735 94,335 108,892
EBITDA 9,107 10,129 10,651 13,003 15,386
EBITDA Margin (%) 13.3 12.9 12.6 13.4 13.7
APAT 3,703 3,954 3,706 5,074 6,605
EPS (Rs) 14.3 15.3 14.4 19.7 25.6
EPS (% chg) 49.0 6.8 (6.3) 36.9 30.2
ROE (%) 17.3 16.6 14.5 17.7 19.6
P/E (x) 21.3 19.9 21.2 15.5 11.9
EV/EBITDA (x) 11.7 11.0 10.7 8.8 7.5
P/BV (x) 3.4 3.2 3.0 2.6 2.1
Source: Company, Emkay Research

Arvind (ARVND IN) India Equity Research | Annual Report Analysis
Emkay Research | July 27, 2016 10
Omnichannel initiative – Arvind launched their omnichannel platform NNNow.com to
capture the growing trend of online shopping. This platform intends to shift the online business
model from purely discount driven to one that focusses on quality brands and a variety of
offerings. Company expects the channel to drive volumes and lead to overall margin
expansion in the Brand and Retail business.
Suiting JV going strong - Arvind’s JV, Arvind Goodhill Suit Manufacturing (set up to
manufacture suits) has grown 3x to Rs 490mn in FY16.
Contingent liabilities – Contingent liabilities increased by Rs 600mn to Rs 6.1bn in FY16 on
account of increase in guarantees given by banks and by the company.
Threats – In the near term, the Trans-Pacific Partnership Agreement (TPPA) is an overhang
on the apparel export business of Arvind. In an attempt to buffer any potential loss of business,
the company has set up garmenting factories in Ethiopia to take advantage of lower labour
costs, lower shipment time to US markets and duty savings.
Key drivers going forward – New categories in existing brands and rapid store expansion
are key growth drivers for the Brands & Retail portfolio. In the next 4-5 years, Arvind plans to
have its presence in c.300 cities with a target of 3mn sq ft of retail space. Vertical integration
through asset light garmenting business is expected to drive textile business while capturing
the entire value chain. Company believes that factories in Ethiopia will make their products
more competitive in international markets. Expansion in knits fabrics too is underway.
Outlook and guidance – For FY17, Company expects consolidated revenues to grow by 12-
15% led by 20-22% growth in Brands & Retail business and 8-9% growth in the Textile
business. Change in mix is expected to marginally impact consolidated EBITDA margins while
Brands & Retail EBITDA margins is likely to improve by c.75bps.
Valuation and view – Uptick in urban consumption, improved traction in the Growth Brand
and Speciality Retail portfolios and store expansion are expected to drive revenue growth. We
expect Arvind’s consolidated revenues to grow by 13% CAGR FY16-18E. We have an
Accumulate rating with price target of Rs 330/share.

Arvind (ARVND IN) India Equity Research | Annual Report Analysis
Emkay Research | July 27, 2016 11
Textile volumes remain weak; Brand impacted by restructuring in Megamart; Brand EBITDA margins see uptick; Working capital steady
Exhibit 16: Textile volumes growth has been muted in FY16
Source: Company, Emkay Research
Exhibit 17: Megamart SSG impacted by restructuring
Source: Company, Emkay Research
Exhibit 18: Brand margins have witnessed an uptick
Source: Company, Emkay Research
Exhibit 19: Aggressive store addition seen in Brands division
Source: Company, Emkay Research
Exhibit 20: Return ratios – a mixed bag
Source: Company, Emkay Research
Exhibit 21: Working capital has remained steady
Source: Company, Emkay Research
-10%
0%
10%
20%
30%
40%
FY13 FY14 FY15 FY16
Volu
me g
row
th
Denim Woven Garments
-15%
-10%
-5%
0%
5%
10%
15%
FY13 FY14 FY15 FY16
Lik
e-t
o-L
ike g
row
th
Brands Megamart
0%
5%
10%
15%
20%
25%
FY13 FY14 FY15 FY16
EB
ITD
A m
arg
in
Textiles Brand & Retail
218
128 113146
-19 -31 -26-48-100
0
100
200
300
FY13 FY14 FY15 FY16
New
sto
res a
dded
Brands Megamart
10%
12%
14%
16%
FY13 FY14 FY15 FY16
ROCE ROE
-1-7 -1 -1
+9 +5
+14 +3
0
20
40
60
80
100
120
140
FY13 FY14 FY15 FY16
Inventory days Working capital days

Arvind (ARVND IN) India Equity Research | Annual Report Analysis
Emkay Research | July 27, 2016 12
Key Financials (Consolidated)
Income Statement
Y/E Mar (Rs mn) FY14 FY15 FY16 FY17E FY18E
Net Sales 66,648 75,392 81,735 94,335 108,892
Expenditure 59,514 68,386 73,853 84,101 96,690
EBITDA 9,107 10,129 10,651 13,003 15,386
Depreciation 2,252 2,124 2,559 2,784 3,008
EBIT 6,855 8,005 8,092 10,220 12,378
Other Income 694 932 964 1,014 1,148
Interest expenses 3,312 3,946 3,811 3,945 4,039
PBT 4,237 4,991 5,245 7,288 9,487
Tax 548 1,072 1,517 2,184 2,843
Extraordinary Items (164) (543) (80) 0 0
Minority Int./Income from Assoc. 0 0 0 0 0
Reported Net Income 3,539 3,411 3,627 5,074 6,605
Adjusted PAT 3,703 3,954 3,706 5,074 6,605
Balance Sheet
Y/E Mar (Rs mn) FY14 FY15 FY16 FY17E FY18E
Equity share capital 2,582 2,582 2,582 2,582 2,583
Reserves & surplus 23,248 24,656 26,535 30,927 36,782
Net worth 25,830 27,239 29,117 33,510 39,366
Minority Interest 242 348 529 559 597
Loan Funds 29,920 33,967 35,402 35,902 36,502
Net deferred tax liability 435 471 699 699 699
Total Liabilities 56,427 62,024 65,747 70,669 77,164
Net block 28,927 32,082 34,595 36,812 38,803
Investment 1,293 586 726 726 726
Current Assets 42,066 46,089 48,928 53,131 60,847
Cash & bank balance 1,663 833 651 455 510
Other Current Assets 3,403 2,699 3,307 3,459 3,992
Current liabilities & Provision 17,205 17,733 19,972 21,469 24,682
Net current assets 24,860 28,356 28,956 31,662 36,165
Misc. exp 0 0 0 0 0
Total Assets 56,427 62,024 65,747 70,669 77,164
Cash Flow
Y/E Mar (Rs mn) FY14 FY15 FY16 FY17E FY18E
PBT (Ex-Other income) (NI+Dep) 3,543 4,059 4,281 6,274 8,339
Other Non-Cash items 0 0 0 0 0
Chg in working cap (7,061) (4,290) (554) (2,902) (4,447)
Operating Cashflow 3,883 5,584 5,717 5,009 5,085
Capital expenditure (3,537) (4,990) (5,568) (5,000) (5,000)
Free Cash Flow 346 594 149 9 85
Investments (615) 708 (141) 0 0
Other Investing Cash Flow (2,276) (2,523) 0 0 0
Investing Cashflow (5,734) (5,874) (4,745) (3,986) (3,852)
Equity Capital Raised 10 5 (1,000) 0 1
Loans Taken / (Repaid) 5,312 4,047 1,435 500 600
Dividend paid (incl tax) (298) (496) (704) (784) (682)
Other Financing Cash Flow (240) (94) 2,191 2,846 2,942
Financing Cashflow 1,472 (485) (1,889) (1,383) (1,178)
Net chg in cash (380) (775) (917) (360) 56
Opening cash position 1,614 1,234 833 651 455
Closing cash position 1,663 833 186 290 510

Arvind (ARVND IN) India Equity Research | Annual Report Analysis
Emkay Research | July 27, 2016 13
Key Ratios
Profitability (%) FY14 FY15 FY16 FY17E FY18E
EBITDA Margin 13.3 12.9 12.6 13.4 13.7
EBIT Margin 10.0 10.2 9.6 10.5 11.0
Effective Tax Rate 12.9 21.5 28.9 30.0 30.0
Net Margin 5.4 5.0 4.4 5.3 5.9
ROCE 15.4 15.8 14.8 17.1 19.0
ROE 17.3 16.6 14.5 17.7 19.6
RoIC 15.4 15.1 13.8 16.3 18.0
Per Share Data (Rs) FY14 FY15 FY16 FY17E FY18E
EPS 14.3 15.3 14.4 19.7 25.6
CEPS 23.1 23.5 24.3 30.4 37.2
BVPS 89.4 95.1 102.4 119.5 142.1
DPS 1.9 2.7 2.4 2.6 2.9
Valuations (x) FY14 FY15 FY16 FY17E FY18E
PER 21.3 19.9 21.2 15.5 11.9
P/CEPS 13.2 13.0 12.6 10.0 8.2
P/BV 3.4 3.2 3.0 2.6 2.1
EV / Sales 1.6 1.5 1.4 1.2 1.1
EV / EBITDA 11.7 11.0 10.7 8.8 7.5
Dividend Yield (%) 0.6 0.9 0.8 0.9 1.0
Gearing Ratio (x) FY14 FY15 FY16 FY17E FY18E
Net Debt/ Equity 1.2 1.3 1.3 1.1 1.0
Net Debt/EBIDTA 3.1 3.3 3.3 2.7 2.3
Working Cap Cycle (days) 123.4 127.9 122.3 117.3 116.1
Growth (%) FY14 FY15 FY16 FY17E FY18E
Revenue 29.6 13.1 8.4 15.4 15.4
EBITDA 32.5 11.2 5.2 22.1 18.3
EBIT 41.9 16.8 1.1 26.3 21.1
PAT 42.5 (3.6) 6.3 39.9 30.2
Quarterly (Rs mn) Q4FY15 Q1FY16 Q2FY16 Q3FY16 Q4FY16
Revenue 20,405 18,769 20,964 21,575 23,196
EBITDA 2,550 2,280 2,622 2,815 3,010
EBITDA Margin (%) 12.5 12.1 12.5 13.0 13.0
PAT 482 580 910 1,033 1,103
EPS (Rs) 2.2 2.7 4.2 4.7 5.0
Shareholding Pattern (%) Mar-15 Jun-15 Sep-15 Dec-15 Mar-16
Promoters 43.7 43.8 43.8 43.8 43.8
FIIs 16.5 14.7 15.2 23.1 22.6
DIIs 14.6 15.8 16.1 16.6 16.4
Public and Others 25.2 25.7 24.9 16.5 17.2

Emkay Research is also available on www.emkayglobal.com, Bloomberg EMKAY<GO>, Reuters and DOWJONES. Emkay Global Financial Services Ltd.
©
Your success is our success
Emkay
India Equity Research | Retail
July 27, 2016
Annual Report Analysis
Page Industries
Category and network expansion remain key levers for growth
CMP Target Price
Rs13,372 Rs15,050 ()
Rating Upside
BUY () 12.5 %
Change in Estimates
EPS Chg FY17E/FY18E (%) NA
Target Price change (%) NA
Previous Reco BUY
Emkay vs Consensus
EPS Estimates
FY17E FY18E
Emkay 264.8 317.3
Consensus 260.3 323.6
Mean Consensus TP Rs 12,628
Stock Details
Bloomberg Code PAG IN
Face Value (Rs) 10
Shares outstanding (mn) 11
52 Week H/L 15,075 / 9,752
M Cap (Rs bn/USD bn) 149 / 2.22
Daily Avg Volume (nos.) 7,740
Daily Avg Turnover (US$ mn) 1.6
Shareholding Pattern Mar '16
Promoters 49.0%
FIIs 37.2%
DIIs 4.8%
Public and Others 9.0%
Price Performance
(%) 1M 3M 6M 12M
Absolute (2) 4 7 (9)
Rel. to Nifty (2) (3) (6) (8)
Relative price chart
Source: Bloomberg
Amit Purohit
+91 22 66121340
Sameep Kasbekar, CFA
+91 22 66121281
Dhaval Mehta
[email protected] +91 22 66121284
-20
-12
-4
4
12
20
9850
10820
11790
12760
13730
14700
Jul-15 Sep-15 Nov-15 Jan-16 Mar-16 May-16 Jul-16
%Rs
Page Industries (LHS) Rel to Nifty (RHS)
Despite tapered growth in FY16, strong drivers in place; We believe increased
penetration, category expansion into kidswear and innovation in womenswear
and sportswear to drive revenues in the medium term
Tepid demand environment impacts growth - After registering a revenue CAGR of 35%
over FY10-15, revenue growth tapered down to 15% in FY16. Increased penetration,
category expansion, innovation and aggressive branding are key for growth.
Womenswear outpaces other segments – While revenue growth in menswear was
subdued at 10% to Rs 8.5bn led by 6% volume growth, womenswear revenues grew at a
robust 27% at Rs 3.4bn driven by 17% volume growth. Sportswear reported revenue
growth of 15% at Rs 5.6bn led by 10% volume growth. Speedo reported revenues of Rs
295mn, up 26% yoy.
New product launches drives category expansion – During FY16, Jockey launched
POP colour innerwear for women which combined the super combed cotton elastane
stretch fabric with trendy neon trims and fashionable prints targeted towards young
women. Company also launched USA Originals loungewear for Men imbibing the Wild
West American heritage of Texas. Company made inroads into kidswear by launching
USA Original for boys aged 7-12 years and introduced International collection for men’s
innerwear in Tactel and Pima cotton.
Constant focus on increasing penetration – Jockey products are available in over 1,400
cities via Exclusive Brand Outlets (EBOs), Large Format Stores, Multi Brand Outlets and
Traditional hosiery stores and multipurpose stores across the country. Company opened
82 EBOs including 7 EBOs exclusively for women through the franchise route taking its
total tally to 265 stores. Speedo products are available in 1,060 stores including 9 EBOs.
The company also has 4 EBOs in UAE and 1 EBO in Sri Lanka.
Strong brand equity – The Company believes that brand equity, brand image and
leadership of Jockey brand are imperative to sustain a healthy growth rate. Jockey as a
brand enjoys an unmatched position in the innerwear category. As per Brand Equity Index
(BEI) only 23% brands have a BEI of more than 3.0 and Jockey has a BEI of 4.6 in
menswear and 2.9 in womenswear.
Expanded into online platform - Page maintains an online presence through its own
B2C ecommerce channel www.jocketindia.com and has also tied up with various online
marketplaces to increase its distribution reach.
Margins expansion despite higher employee costs – Page reported Gross margin
expansion of 40bps to 53.4% led by lower cotton prices and higher share of premium
products. While provision for bonus payment (Rs 87.4mn) resulted in an increase in
employee costs, the impact was offset by higher gross margin and lower advertising spend
resulting in EBITDA margin improving by 30bps to 19.5% in FY16.
Financial Snapshot (Standalone)
(Rs mn) FY14 FY15 FY16 FY17E FY18E
Net Sales 11,731 15,140 17,495 21,316 25,808
EBITDA 2,367 2,900 3,432 4,459 5,473
EBITDA Margin (%) 20.2 19.2 19.6 20.9 21.2
APAT 1,538 1,960 2,327 2,953 3,540
EPS (Rs) 137.9 175.7 208.6 264.8 317.3
EPS (% chg) 36.7 27.5 18.7 26.9 19.9
ROE (%) 61.2 58.0 52.2 50.8 47.2
P/E (x) 97.0 76.1 64.1 50.5 42.1
EV/EBITDA (x) 63.6 52.0 43.7 33.7 27.4
P/BV (x) 51.6 38.6 29.5 22.7 17.7
Source: Company, Emkay Research

Page Industries (PAG IN) India Equity Research | Annual Report Analysis
Emkay Research | July 27, 2016 15
Capacity expansion underway – Company started commercial production at Tiptur Unit
during FY16 and currently has installed capacities spread over 1.97mn sqft in 13 locations in
Karnataka. The company is upbeat about the market demand and has planned further
expansion in KIADB Industrial Area, Hassan.
Balance sheet improves – Page’s gross debt reduced by Rs 623mn to Rs 949mn resulting
in a debt:equity of 0.19x. Working capital days remained steady at 64 days despite an increase
in inventory days by 6 days to 113 days offset by an increase in creditor days by 5 days to 70
days. Company spent Rs 264mn on capex during FY16 (lower than 5 year average of Rs
400mn).
Further improvement in Free Cash Flow generation – Free cash flow improved by 67%
yoy to Rs 1.9bn aided by strong operating cash flows and prudent working capital
management. ROCE and ROE marginally declined to 55.4% and 51.6% respectively.
Company declared dividends of Rs 85/share maintaining a dividend payout of 48%.
Contingent liabilities – Contingent liabilities increased by Rs 93mn to Rs 264mn in FY16 on
account of Rs 118mn differential liability on bonus payment for the year FY15.
Outlook – Strong brand equity, increasing demand, expansion of capacities and network
place Jockey in a sweet spot to capture the uptick in discretionary demand.
View & Valuation – New products and innovation, expansion in categories and distribution
expansion is expected to drive revenues by 22% CAGR FY16-18E. We believe that the robust
growth trajectory would ensure premium valuations for the company. We have a BUY rating
with price target of Rs 15,050/share.

Page Industries (PAG IN) India Equity Research | Annual Report Analysis
Emkay Research | July 27, 2016 16
Volumes muted, but margins improve despite higher employee costs; Working capital steady; Free cash flow generation robust
Exhibit 22: Women’s wear steady; men’s and sports volumes decline
Source: Company, Emkay Research
Exhibit 23: Margins improve despite increase in employee costs
Source: Company, Emkay Research
Exhibit 24: Inventory days increases; Working capital steady
Source: Company, Emkay Research
Exhibit 25: Capex muted, asset turns healthy
Source: Company, Emkay Research
Exhibit 26: Robust FCF generation in FY16
Source: Company, Emkay Research
Exhibit 27: Return ratios have marginally declined in FY16
Source: Company, Emkay Research
0%
10%
20%
30%
40%
FY13 FY14 FY15 FY16
Volu
me g
row
th
Men's wear Women's wear Sports wear
18%
19%
20%
21%
50%
51%
52%
53%
54%
FY13 FY14 FY15 FY16
Gross margin (LHS) EBITDA margin (RHS)
+7
+14-6
+6
+15+7
+7 +1
0
20
40
60
80
100
120
FY13 FY14 FY15 FY16
Inventory days Working capital days
5.0
5.2
5.4
5.6
5.8
0
100
200
300
400
500
600
FY13 FY14 FY15 FY16
Asset tu
rns
Rs m
n
Capex Asset turns
0
500
1000
1500
2000
FY13 FY14 FY15 FY16
Rs m
n
FCF
45%
50%
55%
60%
65%
FY13 FY14 FY15 FY16
ROCE ROE

Page Industries (PAG IN) India Equity Research | Annual Report Analysis
Emkay Research | July 27, 2016 17
Key Financials (Standalone)
Income Statement
Y/E Mar (Rs mn) FY14 FY15 FY16 FY17E FY18E
Net Sales 11,731 15,140 17,495 21,316 25,808
Expenditure 9,364 12,240 14,063 16,857 20,335
EBITDA 2,367 2,900 3,432 4,459 5,473
Depreciation 139 176 238 310 400
EBIT 2,228 2,723 3,194 4,149 5,073
Other Income 211 377 402 445 448
Interest expenses 104 167 153 209 265
PBT 2,335 2,933 3,443 4,385 5,255
Tax 797 973 1,116 1,431 1,716
Extraordinary Items 0 0 0 0 0
Minority Int./Income from Assoc. 0 0 0 0 0
Reported Net Income 1,538 1,960 2,327 2,953 3,540
Adjusted PAT 1,538 1,960 2,327 2,953 3,540
Balance Sheet
Y/E Mar (Rs mn) FY14 FY15 FY16 FY17E FY18E
Equity share capital 112 112 112 112 112
Reserves & surplus 2,778 3,756 4,941 6,472 8,306
Net worth 2,890 3,868 5,052 6,583 8,418
Minority Interest 0 0 0 0 0
Loan Funds 1,422 1,572 949 1,299 1,650
Net deferred tax liability 95 114 110 110 110
Total Liabilities 4,407 5,554 6,112 7,993 10,178
Net block 1,728 2,173 2,132 2,778 3,573
Investment 0 27 0 0 0
Current Assets 4,932 6,034 7,311 9,135 11,336
Cash & bank balance 35 44 86 294 599
Other Current Assets 0 0 0 0 0
Current liabilities & Provision 2,289 2,680 3,335 3,924 4,734
Net current assets 2,643 3,354 3,976 5,211 6,602
Misc. exp 0 0 0 0 0
Total Assets 4,407 5,554 6,112 7,993 10,178
Cash Flow
Y/E Mar (Rs mn) FY14 FY15 FY16 FY17E FY18E
PBT (Ex-Other income) (NI+Dep) 2,124 2,556 3,041 3,940 4,807
Other Non-Cash items 0 0 0 0 0
Chg in working cap (977) (682) (584) (1,027) (1,085)
Operating Cashflow 740 1,670 2,165 2,445 3,120
Capital expenditure (481) (586) (200) (957) (1,195)
Free Cash Flow 259 1,084 1,965 1,489 1,925
Investments 10 (27) 27 0 0
Other Investing Cash Flow (181) (295) (488) (445) (448)
Investing Cashflow (441) (531) (259) (957) (1,195)
Equity Capital Raised 0 0 0 0 0
Loans Taken / (Repaid) 543 150 (624) 350 350
Dividend paid (incl tax) (783) (940) (1,109) (1,423) (1,705)
Other Financing Cash Flow 34 (173) 22 1 0
Financing Cashflow (310) (1,129) (1,864) (1,280) (1,620)
Net chg in cash (11) 9 42 209 305
Opening cash position 46 35 44 86 294
Closing cash position 35 44 86 295 599

Page Industries (PAG IN) India Equity Research | Annual Report Analysis
Emkay Research | July 27, 2016 18
Key Ratios
Profitability (%) FY14 FY15 FY16 FY17E FY18E
EBITDA Margin 20.2 19.2 19.6 20.9 21.2
EBIT Margin 19.0 18.0 18.3 19.5 19.7
Effective Tax Rate 34.1 33.2 32.4 32.6 32.6
Net Margin 13.1 12.9 13.3 13.9 13.7
ROCE 65.2 62.2 61.6 65.1 60.8
ROE 61.2 58.0 52.2 50.8 47.2
RoIC 61.4 55.5 55.5 60.5 58.7
Per Share Data (Rs) FY14 FY15 FY16 FY17E FY18E
EPS 137.9 175.7 208.6 264.8 317.3
CEPS 150.4 191.6 229.9 292.6 353.2
BVPS 259.1 346.7 453.0 590.2 754.7
DPS 60.0 72.0 85.0 109.0 130.6
Valuations (x) FY14 FY15 FY16 FY17E FY18E
PER 97.0 76.1 64.1 50.5 42.1
P/CEPS 88.9 69.8 58.2 45.7 37.9
P/BV 51.6 38.6 29.5 22.7 17.7
EV / Sales 12.8 10.0 8.6 7.0 5.8
EV / EBITDA 63.6 52.0 43.7 33.7 27.4
Dividend Yield (%) 0.4 0.5 0.6 0.8 1.0
Gearing Ratio (x) FY14 FY15 FY16 FY17E FY18E
Net Debt/ Equity 0.5 0.4 0.2 0.2 0.1
Net Debt/EBIDTA 0.6 0.5 0.3 0.2 0.2
Working Cap Cycle (days) 81.1 79.8 81.2 84.2 84.9
Growth (%) FY14 FY15 FY16 FY17E FY18E
Revenue 35.9 29.1 15.6 21.8 21.1
EBITDA 44.1 22.5 18.4 29.9 22.7
EBIT 45.7 22.2 17.3 29.9 22.3
PAT 36.7 27.5 18.7 26.9 19.9
Quarterly (Rs mn) Q4FY15 Q1FY16 Q2FY16 Q3FY16 Q4FY16
Revenue 3,720 4,383 4,537 4,331 4,244
EBITDA 690 932 937 763 803
EBITDA Margin (%) 18.5 21.3 20.6 17.6 18.9
PAT 471 632 603 519 573
EPS (Rs) 42.2 56.6 54.1 46.5 51.3
Shareholding Pattern (%) Mar-15 Jun-15 Sep-15 Dec-15 Mar-16
Promoters 51.0 51.0 51.0 51.0 49.0
FIIs 32.3 32.9 33.7 34.3 37.2
DIIs 6.5 6.3 5.2 5.4 4.8
Public and Others 10.2 9.8 10.1 9.3 9.0

Emkay Research is also available on www.emkayglobal.com, Bloomberg EMKAY<GO>, Reuters and DOWJONES. Emkay Global Financial Services Ltd.
©
Your success is our success
Emkay
India Equity Research | Retail
July 27, 2016
Annual Report Analysis
Shoppers Stop
Penetration growth through store expansion and omnichannel
CMP Target Price
Rs375 Rs476 ()
Rating Upside
BUY () 26.9 %
Change in Estimates
EPS Chg FY17E/FY18E (%) NA
Target Price change (%) NA
Previous Reco BUY
Emkay vs Consensus
EPS Estimates
FY17E FY18E
Emkay 8.7 13.0
Consensus 8.9 13.2
Mean Consensus TP Rs 443
Stock Details
Bloomberg Code SHOP IN
Face Value (Rs) 5
Shares outstanding (mn) 83
52 Week H/L 446 / 301
M Cap (Rs bn/USD bn) 31 / 0.47
Daily Avg Volume (nos.) 28,957
Daily Avg Turnover (US$ mn) 0.2
Shareholding Pattern Mar '16
Promoters 67.1%
FIIs 3.7%
DIIs 13.1%
Public and Others 16.1%
Price Performance
(%) 1M 3M 6M 12M
Absolute 4 - (1) (7)
Rel. to Nifty (1) (7) (13) (6)
Relative price chart
Source: Bloomberg
Sameep Kasbekar, CFA
+91 22 66121281
Amit Purohit
+91 22 66121340
-20
-12
-4
4
12
20
300
325
350
375
400
425
Jul-15 Sep-15 Nov-15 Jan-16 Mar-16 May-16 Jul-16
%Rs
Shoppers Stop (LHS) Rel to Nifty (RHS)
Revival in Same-store Sales Growth (SSG) and strong loyalty programme
drives sales; Key growth levers include uptick in discretionary spending,
increasing share of private labels and timely launch of omni channel platform
Revival in SSG aids growth - SHOP’s gross retail turnover, standalone sales and SSG
grew by 10.5%, 11.4% and 8.5% respectively driven by well spread out festive season,
company led initiatives such as Choose Your Own Gift and a weak base.
Loyalty programme provides foundation for growth – The First Citizens loyalty
programme has grown by c.11% yoy to 4.12mn members and contributing to over 72% of
sales. Crossword Book Rewards Programme (loyalty scheme for bookstore) currently has
over 0.7mn members contributing to 48% of sales. Hypercity’s loyalty programme,
Discovery Club has grown by 20% yoy to 1.2mn members. SHOP has one of the largest
customer loyalty programme in the country ensuring repeat customers and helping the
retailer to sustain growth.
Focus on increasing the share of private/exclusive labels – While SHOP has
positioned itself in the bridge-to-luxury segment with offerings of over 100 international
brands, the company remains focused on increasing its share of private and exclusive
labels. In FY16, the share of private brands declined 60bps yoy to 13.5% reporting a
growth of 6.3%. Exclusive brand contribution increased by 60bps yoy to 3.5% led by a
31.5% yoy growth. The company is working on initiatives to drive the share of private
brands which would consequently result in a margin expansion.
Store matrix improves – SHOP’s departmental store reported an improvement in nearly
all its performance parameters. The average sales per sq. ft. grew 9% to Rs 8974/sqft
buoyed by increasing average selling price (Rs 1136, +2% yoy), transaction size (Rs 2791,
+7% yoy) and conversion ratio (25.9%, +160bps yoy). Shrinkage too declined by 2bps to
0.36%. However, footfalls continued to decline to 44.6mn (down 2% yoy).
Hypercity on track to profitability – Hypercity reported a muted growth of 3% yoy, with
like-to-like sales growth at a mere 1.3%. In a bid to improve the profitability of the format
the company has right-sized stores to 30,000-50,000 sqft for optimum throughput.
Furthermore, Hypercity is being repositioned as a discovery and fresh store (fresh fruits
and vegetables contribute c.65% of sales). The company believes that Hypercity is on
track to report a positive company level EBITDA by Q4FY16.
Net space addition of 0.12mn sqft in FY16 – SHOP added 0.12mn sqft of retail space
(lowest addition in last 10 years) during FY16, opening 8 Shoppers Stop departmental
stores (77). Company also added one Hypercity store (17), two MAC stores and closed
one Home Stop (18).
Financial Snapshot (Standalone)
(Rs mn) FY14 FY15 FY16 FY17E FY18E
Net Sales 26,807 30,076 33,496 38,135 43,855
EBITDA 1,537 1,889 421 2,643 3,271
EBITDA Margin (%) 5.7 6.2 1.2 6.8 7.3
APAT 377 407 (1,261) 727 1,084
EPS (Rs) 4.5 4.9 (15.1) 8.7 13.0
EPS (% chg) (5.5) 8.1 (409.7) 0.0 49.1
ROE (%) 5.3 5.5 (16.3) 8.9 12.0
P/E (x) 83.0 76.8 (24.8) 43.1 28.9
EV/EBITDA (x) 22.7 19.3 88.2 13.9 10.9
P/BV (x) 4.3 4.1 4.0 3.7 3.3
Source: Company, Emkay Research

Shoppers Stop (SHOP IN) India Equity Research | Annual Report Analysis
Emkay Research | July 27, 2016 20
Tapping into India’s ecommerce, a growth opportunity – To offset loss of business due to
increasing popularity of online marketplaces, STOP has planned a two pronged strategy which
involves i) tying up leading ecommerce platforms to sell products and brands online and ii)
launching an Omni-channel platform. The company has re-launched their website and
launched mobile apps on the Android and iOS platforms. STOP plans on investing in a
Customer Relation Management (CRM) software and a Warehouse Management System
(WMS) in FY17 to build capabilities to transform into an omnichannel player by FY18.
Improvement in margin profile aided by operating leverage – Higher SSG led operating
leverage and sustained private label/exclusive label mix resulted in EBITDA margins
improving by 20bps to 6.4% in FY16.
Balance sheet healthy, working capital under control – Capex for FY16 stood at Rs 1.4bn,
while working capital cycle remained flat at 33 days. The gross debt increased by Rs 700mn
to Rs 5.9bn, with debt:equity ratio at a comfortable 0.8x. Standalone free cash flow was
marginally negative at Rs 15mn and the company lowered its dividend payout to 15% from
18% in FY15.
Threats – The challenges SHOP faces includes i) weakness in consumer demand, ii)
increasing competition from discounted online sales, iii) lack of quality retail space resulting in
increasing rental costs and iv) possible supply chain constrains with vendors reaching their
supply capacities.
Contingent Liabilities – Contingent liabilities increase by Rs 800mn to Rs 3.9bn in FY16 on
the back of corporate guarantees for loans taken by subsidiary companies.
Outlook – The Company is focused on increasing its penetration especially in tier 1/2 cities
and reinforcing their pan India presence through additional stores. SHOP also plans to capture
wallet share via various lifestyle formats such as M.A.C, Bobby Brown, Estee Lauder and
Clinique. SHOP intends on adding 6 departmental stores and 3 hypermarket stores in FY17.
Valuation and view – Speedy implementation of the omni-channel platform, increased
traction in private and exclusive labels and uptick in urban demand are key growth drivers for
SHOP. We expect revenue growth CAGR of 14.5% FY16-18E and expect Hypercity to turn
profitable in the near term with steady improvement in the margin profile. We have a BUY
rating with a price target of Rs 476/share.

Shoppers Stop (SHOP IN) India Equity Research | Annual Report Analysis
Emkay Research | July 27, 2016 21
Improving SSG and store matrix drives growth; Margins witness an uptick; Working capital under control; Capex towards store expansion & Omnichannel
Exhibit 28: Shoppers Stop SSG improved in FY16
Source: Company, Emkay Research
Exhibit 29: Conversion ratio too witnessed an uptick
Source: Company, Emkay Research
Exhibit 30: Apparel share continues to expand
Source: Company, Emkay Research
Exhibit 31: ASP and transaction size continues to grow
Source: Company, Emkay Research
Exhibit 32: Lower shrinkage and better EBITDA margins in FY16
Source: Company, Emkay Research
Exhibit 33: GM improvement in space, labour and inventory
Source: Company, Emkay Research
Exhibit 34: Working capital has remained steady
Source: Company, Emkay Research
Exhibit 35: Capex spend of Rs 1.4bn in FY16
Source: Company, Emkay Research
0%
2%
4%
6%
8%
10%
12%
FY13 FY14 FY15 FY16
Shoppers Stop SSG
18%
21%
24%
27%
FY13 FY14 FY15 FY16
Conversion ratio
40.1% 37.8% 36.0% 35.8%
59.9% 62.2% 64.0% 64.2%
0%
20%
40%
60%
80%
100%
FY13 FY14 FY15 FY16
Non-Apparels Apparels
2100
2400
2700
3000
1000
1050
1100
1150
FY13 FY14 FY15 FY16
Average Selling Price (LHS) Transaction Size (RHS)
5.0%
5.5%
6.0%
6.5%
0.30%
0.35%
0.40%
0.45%
FY13 FY14 FY15 FY16
Shrinkage (%) LHS EBITDA margins (%) RHS
0.0
1.0
2.0
3.0
4.0
5.0
FY13 FY14 FY15 FY16
GMROI GMROF ('000) GMROL (mn)
-1 +1 +0 +2
-1
-15
+15 +0
0
10
20
30
40
50
60
FY13 FY14 FY15 FY16
Inventory days Working capital days
-2000
-1000
0
1000
2000
FY13 FY14 FY15 FY16
Capex Increase in Debt

Shoppers Stop (SHOP IN) India Equity Research | Annual Report Analysis
Emkay Research | July 27, 2016 22
Key Financials (Standalone)
Income Statement
Y/E Mar (Rs mn) FY14 FY15 FY16 FY17E FY18E
Net Sales 26,807 30,076 33,496 38,135 43,855
Expenditure 25,599 28,531 33,711 36,255 41,499
EBITDA 1,537 1,889 421 2,643 3,271
Depreciation 618 858 977 1,067 1,187
EBIT 919 1,031 (555) 1,576 2,084
Other Income 134 177 213 254 280
Interest expenses 419 512 573 590 515
PBT 634 696 (916) 1,240 1,849
Tax 257 288 346 514 766
Extraordinary Items (7) 0 (238) 0 0
Minority Int./Income from Assoc. 0 0 0 0 0
Reported Net Income 370 407 (1,500) 727 1,084
Adjusted PAT 377 407 (1,261) 727 1,084
Balance Sheet
Y/E Mar (Rs mn) FY14 FY15 FY16 FY17E FY18E
Equity share capital 416 417 417 417 417
Reserves & surplus 6,871 7,236 7,437 8,089 9,097
Net worth 7,287 7,653 7,854 8,506 9,514
Minority Interest 0 0 0 0 0
Loan Funds 3,746 5,184 5,902 5,502 4,452
Net deferred tax liability 100 96 17 17 17
Total Liabilities 11,133 12,932 13,773 14,024 13,983
Net block 5,490 5,963 6,315 6,598 6,607
Investment 3,876 4,065 4,047 4,047 4,047
Current Assets 6,903 7,732 8,440 9,435 10,527
Cash & bank balance 87 49 53 26 21
Other Current Assets 149 116 79 79 79
Current liabilities & Provision 5,456 4,971 5,309 6,331 7,472
Net current assets 1,448 2,762 3,131 3,105 3,054
Misc. exp 0 0 0 0 0
Total Assets 11,133 12,932 13,773 14,024 13,983
Cash Flow
Y/E Mar (Rs mn) FY14 FY15 FY16 FY17E FY18E
PBT (Ex-Other income) (NI+Dep) 164 175 (1,764) 223 654
Other Non-Cash items 0 0 0 0 0
Chg in working cap 710 (1,356) (445) 0 45
Operating Cashflow 1,654 (99) (1,005) 1,367 1,635
Capital expenditure (1,593) (1,155) (1,465) (1,345) (1,195)
Free Cash Flow 61 (1,254) (2,470) 21 440
Investments (567) (189) 18 0 0
Other Investing Cash Flow 0 0 0 0 0
Investing Cashflow (1,696) (823) (599) (328) 0
Equity Capital Raised 52 34 1,776 0 0
Loans Taken / (Repaid) 453 1,437 718 (400) (1,050)
Dividend paid (incl tax) (73) (75) (75) (75) (75)
Other Financing Cash Flow 0 0 (238) 0 0
Financing Cashflow 13 884 1,608 (1,065) (1,640)
Net chg in cash (30) (38) 4 (27) (5)
Opening cash position 117 87 49 53 26
Closing cash position 88 49 53 26 21

Shoppers Stop (SHOP IN) India Equity Research | Annual Report Analysis
Emkay Research | July 27, 2016 23
Key Ratios
Profitability (%) FY14 FY15 FY16 FY17E FY18E
EBITDA Margin 5.7 6.2 1.2 6.8 7.3
EBIT Margin 3.4 3.4 (1.6) 4.1 4.7
Effective Tax Rate 40.5 41.4 (37.8) 41.4 41.4
Net Margin 1.4 1.3 (3.7) 1.9 2.4
ROCE 9.8 10.0 (2.6) 13.2 16.9
ROE 5.3 5.5 (16.3) 8.9 12.0
RoIC 13.7 13.3 (6.1) 16.5 21.6
Per Share Data (Rs) FY14 FY15 FY16 FY17E FY18E
EPS 4.5 4.9 (15.1) 8.7 13.0
CEPS 11.9 15.2 (3.4) 21.5 27.2
BVPS 87.3 91.7 94.1 101.9 114.0
DPS 0.7 0.7 0.7 0.7 0.7
Valuations (x) FY14 FY15 FY16 FY17E FY18E
PER 83.0 76.8 (24.8) 43.1 28.9
P/CEPS 31.5 24.7 (109.9) 17.4 13.8
P/BV 4.3 4.1 4.0 3.7 3.3
EV / Sales 1.3 1.2 1.1 1.0 0.8
EV / EBITDA 22.7 19.3 88.2 13.9 10.9
Dividend Yield (%) 0.2 0.2 0.2 0.2 0.2
Gearing Ratio (x) FY14 FY15 FY16 FY17E FY18E
Net Debt/ Equity 0.5 0.7 0.7 0.6 0.5
Net Debt/EBIDTA 2.4 2.7 13.9 2.1 1.4
Working Cap Cycle (days) 18.3 32.5 32.9 28.9 24.7
Growth (%) FY14 FY15 FY16 FY17E FY18E
Revenue 20.3 12.2 11.4 13.8 15.0
EBITDA 21.6 23.0 (77.7) 527.4 23.8
EBIT 21.4 12.2 (153.9) 0.0 32.3
PAT (7.2) 10.0 (468.1) 0.0 49.1
Quarterly (Rs mn) Q4FY15 Q1FY16 Q2FY16 Q3FY16 Q4FY16
Revenue 8,157 7,112 8,943 9,118 8,959
EBITDA 491 327 610 712 523
EBITDA Margin (%) 6.0 4.6 6.8 7.8 5.8
PAT 103 24 128 236 102
EPS (Rs) 1.2 0.3 1.5 2.8 1.2
Shareholding Pattern (%) Mar-15 Jun-15 Sep-15 Dec-15 Mar-16
Promoters 67.2 67.2 67.2 67.1 67.1
FIIs 3.8 4.1 4.5 4.4 3.7
DIIs 13.9 13.4 12.2 13.0 13.1
Public and Others 15.1 15.3 16.2 15.5 16.1

Emkay Research is also available on www.emkayglobal.com, Bloomberg EMKAY<GO>, Reuters and DOWJONES. Emkay Global Financial Services Ltd.
©
Your success is our success
Emkay
India Equity Research | Retail
July 27, 2016
Annual Report Analysis
Titan Company
Banking on demand revival
CMP Target Price
Rs414 Rs330 ()
Rating Upside
HOLD () (20.3) %
Change in Estimates
EPS Chg FY17E/FY18E (%) NA
Target Price change (%) NA
Previous Reco HOLD
Emkay vs Consensus
EPS Estimates
FY17E FY18E
Emkay 9.7 11.9
Consensus 9.6 11.6
Mean Consensus TP Rs 359
Stock Details
Bloomberg Code TTAN IN
Face Value (Rs) 1
Shares outstanding (mn) 888
52 Week H/L 435 / 302
M Cap (Rs bn/USD bn) 368 / 5.46
Daily Avg Volume (nos.) 604,407
Daily Avg Turnover (US$ mn) 3.7
Shareholding Pattern Mar '16
Promoters 53.1%
FIIs 19.7%
DIIs 5.4%
Public and Others 21.9%
Price Performance
(%) 1M 3M 6M 12M
Absolute 6 11 17 22
Rel. to Nifty 1 3 2 22
Relative price chart
Source: Bloomberg
Amit Purohit
+91 22 66121340
Sameep Kasbekar, CFA
+91 22 66121281
Dhaval Mehta
+91 22 66121284
-10
-2
6
14
22
30
300
325
350
375
400
425
Jul-15 Sep-15 Nov-15 Jan-16 Mar-16 May-16 Jul-16
%Rs
Titan Industries (LHS) Rel to Nifty (RHS)
Weak consumer sentiments, regulatory hurdles and jewellers strike in March
2016 impacted growth. Expect store expansion, revival in discretionary
demand and reinstatement of Golden Harvest Scheme (GHS) to drive growth.
Weak demand and macro factors impacts jewellery sales - Titan’s standalone
revenues declined by 5.4% to Rs 112.6bn impacted by weak performance in the jewellery
segment (-7.6% yoy) due to new PAN card rule, weak demand environment and jewellers
strike despite reintroduction of the GHS in H2FY16. Watches reported a muted growth of
1.7% yoy in FY16 while the Eyewear division registered a healthy 11.8% growth aided by
aggressive store expansion.
Regulatory hurdles persist – The government introduced regulations making PAN card
compulsory for purchases over Rs 0.2mn from January 2016. While sales over Rs 0.2mn
contributes c.10% of sales, the company witnessed overall dampening of sentiments
amongst customers. The company has seen some visible impact in some products and
price bands, but expect sales to stabilise in the medium term as customers adjust to the
new norm (previous limit set at Rs 0.5mn).
Space addition – Titan remained aggressive in their store addition. In the watches
segment, the number of stores of World of Titan increased to 452, Fastrack to 159 and
Helios to 41. In jewellery, Tanishq increased its store count to 195 and Gold Plus stores
stood at 32. In Eyewear, Titan retained its vigour for growth adding 70 stores during FY16
taking the store count to 402.
5 pillars for Tanishq – Acting on the overall slowdown in jewellery consumption, Titan
has set 5 long term initiatives for its flagship brand Tanishq. These initiatives include i)
Reduction in making charges of gold jewellery while increasing the value-for-money
proposition of Tanishq. This move is expected to drive brand metrics and increase
customer share. ii) To increase share of wedding jewellery and to correct trousseau pricing
while communicating these initiatives with customers. This initiative is expected to begin
in H2FY17. iii) Increased innovation, development and inventory of high valued diamond
jewellery (> Rs 0.2mn) to attract affluent customers and thereby increase market share.
iv) To introduce new jewellery collections including market following and customer leading
segments to increase footfalls in stores. v) Store expansion especially in middle India to
drive network expansion led growth.
Online presence beefed up – Disruptive discounting by ecommerce players has
adversely impacted all the established retailers over the past 24 months. Titan is looking
to address this issue and has consequently acquired CaratLane for its online retailing
capabilities. Titan has acquired c.62% of CaratLane for Rs 3.57bn in July ‘16, valuing the
entity at 4x FY16 sales.
Financial Snapshot (Standalone)
(Rs mn) FY14 FY15 FY16 FY17E FY18E
Net Sales 109,158 119,032 112,645 134,700 154,201
EBITDA 10,484 11,534 9,455 12,737 15,323
EBITDA Margin (%) 9.6 9.7 8.4 9.5 9.9
APAT 7,411 8,231 7,058 8,637 10,538
EPS (Rs) 8.3 9.3 8.0 9.7 11.9
EPS (% chg) 2.2 11.1 (14.2) 22.4 22.0
ROE (%) 33.0 29.3 21.4 22.8 24.0
P/E (x) 49.6 44.7 52.1 42.6 34.9
EV/EBITDA (x) 35.0 31.8 38.9 28.7 23.7
P/BV (x) 14.6 11.9 10.5 9.1 7.8
Source: Company, Emkay Research

Titan Company (TTAN IN) India Equity Research | Annual Report Analysis
Emkay Research | July 27, 2016 25
Innovation and new launches to drive growth in watches – Consolidation and facelift for
World of Titan stores resulted in a disproportionate retail growth. Growth across retail
channels was flat in FY16, with Helios outperforming with a double digit growth. During the
year Titan launched new and differentiated products such as Raga Moonlight Collection, Titan
Regal Crest, Sonata Shagun watch, Sonata Rahu Kaal watch, Fastract Tribe and Animal
Instinct collections. Titan also entered the smart watch category with the launch of Juxt and
expects to introduce Favre Leuba (heritage Swiss brand that Titan acquired) by the end of
FY17. Company is focused on innovation and reducing imports both by enhancing in-house
capabilities and developing Indian vendors. Titan has commenced commercial production in
Stainless Steel Case Plant in Coimbatore in this regard. The international business reported
a double digit growth driven by improved brand scores in Vietnam, UAE and Malaysia.
Massive potential in Eyewear – Rapid store expansion (+70 stores) and new products (+300
new products in FY16) has resulted in a 12% growth in FY16. The market size of Eyewear is
estimated at Rs 50bn and is expected to grow at 12-15% CAGR implying a great potential for
this business to grow.
Precision engineering – A leading player in aerospace, the company has over 750 customer
qualified parts that helps boost the outlook. Company expects strengthening relationship with
UTC group internationally, and HAL domestically should propel growth. The Machine Building
and Automation (MBA) segment acquired 85 customers in FY16 and improved their overall
order position (+50% yoy). Depreciating rupee, reduction in operating costs and focus on
niche areas and innovative products are likely to provide key levers to this segment.
Contingent liabilities – The contingent liabilities have marginally declined to Rs 2.9bn from
Rs 3bn in FY15 due to lower sales tax, customs and excise duties.
Outlook – Strategic initiatives set for Tanishq coupled with revival in discretionary spending
are expected to be key metrics that the company would be closely tracking. In addition,
acquisition of CaratLane and reinstatement of GHS would provide further fillip for growth in
FY17.
View and valuation – While growth drivers in jewellery business are in place, demand uptick
remains essential. Regulatory overhang (Pan Card rule) is expected to lead to near term
headwinds. We maintain Hold rating with price target of Rs 330/share.

Titan Company (TTAN IN) India Equity Research | Annual Report Analysis
Emkay Research | July 27, 2016 26
Jewellery revenue declines; EBITDA margins impacted by higher employee and advertisement costs; Free cash flows and working capital stable
Exhibit 36: Tepid demand and jewellers strike hits jewellery growth
Source: Company, Emkay Research
Exhibit 37: EBITDA margins impacted by higher employee & ad costs
Source: Company, Emkay Research
Exhibit 38: Debt has marginally increased in FY16
Source: Company, Emkay Research
Exhibit 39: However free cash flows remain robust
Source: Company, Emkay Research
Exhibit 40: Poor profitability impacts return ratios
Source: Company, Emkay Research
Exhibit 41: Working capital has remained stable
Source: Company, Emkay Research
-10%
-5%
0%
5%
10%
15%
20%
FY13 FY14 FY15 FY16
Jewellery Sales growth Watches Sales growth
7.5%
8.0%
8.5%
9.0%
9.5%
10.0%
10.5%
25.8%
26.2%
26.6%
27.0%
27.4%
FY13 FY14 FY15 FY16
Gross Margin EBITDA Margin
-0.05
0.00
0.05
0.10
0.15
0.20
0.25
0.30
0.35
0
2000
4000
6000
8000
10000
FY13 FY14 FY15 FY16
Total Borrowings (Rs mn) LHS D/E (x) RHS
-8000
-6000
-4000
-2000
0
2000
4000
FY13 FY14 FY15 FY16
FCF (Rs mn)
20.0%
25.0%
30.0%
35.0%
40.0%
45.0%
20.0%
30.0%
40.0%
50.0%
60.0%
70.0%
FY13 FY14 FY15 FY16
ROCE ROE
0.0
50.0
100.0
150.0
200.0
FY13 FY14 FY15 FY16
Inventory Days Debtor Days
Creditor Days Working Capital Days

Titan Company (TTAN IN) India Equity Research | Annual Report Analysis
Emkay Research | July 27, 2016 27
Key Financials (Standalone)
Income Statement
Y/E Mar (Rs mn) FY14 FY15 FY16 FY17E FY18E
Net Sales 109,158 119,032 112,645 134,700 154,201
Expenditure 98,673 107,499 103,190 121,963 138,878
EBITDA 10,484 11,534 9,455 12,737 15,323
Depreciation 656 874 969 1,073 1,176
EBIT 9,829 10,660 8,486 11,664 14,147
Other Income 1,202 706 644 772 927
Interest expenses 871 807 423 452 452
PBT 10,159 10,559 8,707 11,984 14,622
Tax 2,748 2,328 1,648 3,347 4,084
Extraordinary Items 0 0 0 0 0
Minority Int./Income from Assoc. 0 0 0 0 0
Reported Net Income 7,411 8,231 7,058 8,637 10,538
Adjusted PAT 7,411 8,231 7,058 8,637 10,538
Balance Sheet
Y/E Mar (Rs mn) FY14 FY15 FY16 FY17E FY18E
Equity share capital 888 888 888 888 888
Reserves & surplus 24,352 30,032 34,258 39,676 46,371
Net worth 25,240 30,920 35,146 40,563 47,258
Minority Interest 0 0 0 0 0
Loan Funds 8,063 998 1,131 1,131 1,131
Net deferred tax liability (93) (197) (239) (239) (239)
Total Liabilities 33,209 31,721 36,037 41,455 48,150
Net block 5,962 6,832 7,686 8,113 8,437
Investment 266 326 740 740 740
Current Assets 54,420 50,818 54,040 63,626 74,447
Cash & bank balance 8,889 2,102 1,117 3,446 5,859
Other Current Assets 167 44 37 48 55
Current liabilities & Provision 27,768 26,804 27,489 32,085 36,535
Net current assets 26,652 24,013 26,551 31,541 37,912
Misc. exp 0 0 0 0 0
Total Assets 33,209 31,721 36,037 41,455 48,150
Cash Flow
Y/E Mar (Rs mn) FY14 FY15 FY16 FY17E FY18E
PBT (Ex-Other income) (NI+Dep) 8,957 9,853 8,063 11,212 13,695
Other Non-Cash items 0 0 0 0 0
Chg in working cap (14,661) (4,252) (3,566) (2,661) (3,957)
Operating Cashflow (5,513) 5,078 5,979 7,501 8,209
Capital expenditure (2,044) (1,964) (2,334) (1,500) (1,500)
Free Cash Flow (7,557) 3,114 3,645 6,001 6,709
Investments (81) (61) (413) 0 0
Other Investing Cash Flow (1,007) (498) 286 (772) (927)
Investing Cashflow (1,930) (1,818) (1,818) (1,500) (1,500)
Equity Capital Raised 0 0 0 0 0
Loans Taken / (Repaid) 8,063 (7,065) 133 0 0
Dividend paid (incl tax) (1,852) (1,852) (4,757) (3,220) (3,843)
Other Financing Cash Flow (371) (317) 0 0 0
Financing Cashflow 4,968 (10,041) (5,048) (3,672) (4,295)
Net chg in cash (2,474) (6,780) (887) 2,329 2,414
Opening cash position 11,365 8,889 2,102 1,117 3,446
Closing cash position 8,889 2,102 668 3,446 5,859

Titan Company (TTAN IN) India Equity Research | Annual Report Analysis
Emkay Research | July 27, 2016 28
Key Ratios
Profitability (%) FY14 FY15 FY16 FY17E FY18E
EBITDA Margin 9.6 9.7 8.4 9.5 9.9
EBIT Margin 9.0 9.0 7.5 8.7 9.2
Effective Tax Rate 27.0 22.0 18.9 27.9 27.9
Net Margin 6.8 6.9 6.3 6.4 6.8
ROCE 41.8 35.0 26.9 32.1 33.6
ROE 33.0 29.3 21.4 22.8 24.0
RoIC 62.7 40.6 27.4 33.6 36.9
Per Share Data (Rs) FY14 FY15 FY16 FY17E FY18E
EPS 8.3 9.3 8.0 9.7 11.9
CEPS 9.1 10.3 9.0 10.9 13.2
BVPS 28.4 34.8 39.6 45.7 53.2
DPS 2.1 2.1 5.4 3.6 4.3
Valuations (x) FY14 FY15 FY16 FY17E FY18E
PER 49.6 44.7 52.1 42.6 34.9
P/CEPS 44.1 39.0 44.3 36.6 30.3
P/BV 14.6 11.9 10.5 9.1 7.8
EV / Sales 3.4 3.1 3.3 2.7 2.4
EV / EBITDA 35.0 31.8 38.9 28.7 23.7
Dividend Yield (%) 0.5 0.5 1.3 0.9 1.0
Gearing Ratio (x) FY14 FY15 FY16 FY17E FY18E
Net Debt/ Equity 0.0 0.0 0.0 (0.1) (0.1)
Net Debt/EBIDTA (0.1) (0.1) 0.0 (0.2) (0.3)
Working Cap Cycle (days) 59.4 67.2 82.4 76.1 75.9
Growth (%) FY14 FY15 FY16 FY17E FY18E
Revenue 7.9 9.0 (5.4) 19.6 14.5
EBITDA 3.7 10.0 (18.0) 34.7 20.3
EBIT 2.8 8.5 (20.4) 37.5 21.3
PAT 2.2 11.1 (14.2) 22.4 22.0
Quarterly (Rs mn) Q4FY15 Q1FY16 Q2FY16 Q3FY16 Q4FY16
Revenue 24,962 27,086 26,735 34,262 24,563
EBITDA 2,701 2,227 2,028 3,099 2,101
EBITDA Margin (%) 10.8 8.2 7.6 9.0 8.6
PAT 2,151 1,511 1,454 2,253 1,841
EPS (Rs) 2.4 1.7 1.6 2.5 2.1
Shareholding Pattern (%) Mar-15 Jun-15 Sep-15 Dec-15 Mar-16
Promoters 53.1 53.1 53.1 53.1 53.1
FIIs 21.6 21.5 21.1 20.5 19.7
DIIs 3.2 3.2 4.1 4.7 5.4
Public and Others 22.2 22.2 21.8 21.8 21.9

Retail Sector India Equity Research | Annual Report Analysis
Emkay Research | July 27, 2016 29 www.emkayglobal.com
Emkay Rating Distribution
BUY Expected total return (%) (Stock price appreciation and dividend yield) of over 25% within the next 12-18 months.
ACCUMULATE Expected total return (%) (Stock price appreciation and dividend yield) of over 10% within the next 12-18 months.
HOLD Expected total return (%) (Stock price appreciation and dividend yield) of upto 10% within the next 12-18 months.
REDUCE Expected total return (%) (Stock price depreciation) of upto (-) 10% within the next 12-18 months.
SELL The stock is believed to underperform the broad market indices or its related universe within the next 12-18 months.
DISCLAIMERS AND DISCLOSURES: Emkay Global Financial Services Limited (CIN-L67120MH1995PLC084899) and its affiliates are a full-service, brokerage, investment banking, investment
management and financing group. Emkay Global Financial Services Limited (EGFSL) along with its affiliates are participants in virtually all securities trading markets in India. EGFSL was established in
1995 and is one of India's leading brokerage and distribution house.EGFSL is a corporate trading member of Bombay Stock Exchange Limited (BSE), National Stock Exchange of India Limited(NSE),
MCX Stock Exchange Limited (MCX-SX).EGFSL along with its subsidiaries offers the most comprehensive avenues for investments and is engaged in the businesses including stock broking (Institutional
and retail), merchant banking, commodity broking, depository participant, portfolio management, insurance broking and services rendered in connection with distribution of primary market issues and
financial products like mutual funds, fixed deposits. Details of associates are available on our website i.e. www.emkayglobal.com
EGFSL is registered as Research Analyst with SEBI bearing registration Number INH000000354 as per SEBI (Research Analysts) Regulations, 2014. EGFSL hereby declares that it has not defaulted
with any stock exchange nor its activities were suspended by any stock exchange with whom it is registered in last five years, except that NSE had disabled EGFSL from trading on October 05, October
08 and October 09, 2012 for a manifest error resulting into a bonafide erroneous trade on October 05, 2012. However, SEBI and Stock Exchanges have conducted the routine inspection and based on
their observations have issued advice letters or levied minor penalty on EGFSL for certain operational deviations in ordinary/routine course of business. EGFSL has not been debarred from doing business
by any Stock Exchange / SEBI or any other authorities; nor has its certificate of registration been cancelled by SEBI at any point of time.
EGFSL offers research services to clients as well as prospects. The analyst for this report certifies that all of the views expressed in this report accurately reflect his or her personal views about the subject
company or companies and its or their securities, and no part of his or her compensation was, is or will be, directly or indirectly related to specific recommendations or views expressed in this report.
Other disclosures by Emkay Global Financial Services Limited (Research Entity) and its Research Analyst under SEBI (Research Analyst) Regulations, 2014 with reference to the subject
company(s) covered in this report-:
EGFSL or its associates may have financial interest in the subject company.
Research Analyst or his/her relative’s financial interest in the subject company. (NO)
EGFSL or its associates and Research Analyst or his/her relative’s does not have any material conflict of interest in the subject company. The research Analyst or research entity (EGFSL) have not been
engaged in market making activity for the subject company.
EGFSL or its associates may have actual/beneficial ownership of 1% or more securities of the subject company at the end of the month immediately preceding the date of publication of Research Report.
Research Analyst or his/her relatives have actual/beneficial ownership of 1% or more securities of the subject company at the end of the month immediately preceding the date of publication of Research
Report: (NO)
EGFSL or its associates may have received any compensation including for investment banking or merchant banking or brokerage services from the subject company in the past 12 months. EGFSL or its
associates may have received compensation for products or services other than investment banking or merchant banking or brokerage services from the subject company in the past 12 months. EGFSL
or its associates may have received any compensation or other benefits from the Subject Company or third party in connection with the research report. Subject Company may have been client of EGFSL
or its associates during twelve months preceding the date of distribution of the research report and EGFSL may have co-managed public offering of securities for the subject company in the past twelve
months.
The research Analyst has served as officer, director or employee of the subject company: (NO)
The Research Analyst has received any compensation from the subject company in the past twelve months: (NO)
The Research Analyst has managed or co‐managed public offering of securities for the subject company in the past twelve months: (NO)
The Research Analyst has received any compensation for investment banking or merchant banking or brokerage services from the subject company in the past twelve months: (NO)
The Research Analyst has received any compensation for products or services other than investment banking or merchant banking or brokerage services from the subject company in the past twelve
months: (NO)
The Research Analyst has received any compensation or other benefits from the subject company or third party in connection with the research report: (NO)
EGFSL and/or its affiliates may seek investment banking or other business from the company or companies that are the subject of this material. Our salespeople, traders, and other professionals may
provide oral or written market commentary or trading strategies to our clients that reflect opinions that are contrary to the opinions expressed herein, and our proprietary trading and investing businesses
may make investment decisions that may be inconsistent with the recommendations expressed herein. In reviewing these materials, you should be aware that any or all of the foregoing, among other
things, may give rise to real or potential conflicts of interest including but not limited to those stated herein. Additionally, other important information regarding our relationships with the company or
companies that are the subject of this material is provided herein. This report is not directed to, or intended for distribution to or use by, any person or entity who is a citizen or resident of or located in any
locality, state, country or other jurisdiction where such distribution, publication, availability or use would be contrary to law or regulation or which would subject EGFSL or its group companies to any
registration or licensing requirement within such jurisdiction. Specifically, this document does not constitute an offer to or solicitation to any U.S. person for the purchase or sale of any financial instrument
or as an official confirmation of any transaction to any U.S. person. Unless otherwise stated, this message should not be construed as official confirmation of any transaction. No part of this document may
be distributed in Canada or used by private customers in United Kingdom. All material presented in this report, unless specifically indicated otherwise, is under copyright to Emkay. None of the material,
nor its content, nor any copy of it, may be altered in any way, transmitted to, copied or distributed to any other party, without the prior express written permission of EGFSL . All trademarks, service marks
and logos used in this report are trademarks or registered trademarks of EGFSL or its Group Companies. The information contained herein is not intended for publication or distribution or circulation in
any manner whatsoever and any unauthorized reading, dissemination, distribution or copying of this communication is prohibited unless otherwise expressly authorized. Please ensure that you have read
“Risk Disclosure Document for Capital Market and Derivatives Segments” as prescribed by Securities and Exchange Board of India before investing in Indian Securities Market. In so far as this report
includes current or historic information, it is believed to be reliable, although its accuracy and completeness cannot be guaranteed.
Emkay Global Financial Services Ltd.
CIN - L67120MH1995PLC084899
7th Floor, The Ruby, Senapati Bapat Marg, Dadar - West, Mumbai - 400028. India
Tel: +91 22 66121212 Fax: +91 22 66121299 Web: www.emkayglobal.com


