
6th
International Conference on Advances in Experimental Structural Engineering
11th
International Workshop on Advanced Smart Materials and Smart Structures Technology
August 1-2, 2015, University of Illinois, Urbana-Champaign, United States
Development Of Real-Time Monitoring System For Multi-hazard Bridge
Kuo-Chun Chang1, Yung-Bin Lin
2
1 Director, National Center for Research on Earthquake Engineering, Taipei, Taiwan.
E-mail: [email protected]
2 Research Fellow, National Center for Research on Earthquake Engineering, Taipei, Taiwan.
E-mail: [email protected]
ABSTRACT
Natural Hazards is an interdisciplinary and international dedicated research. Streams at waterway bridges
present significant challenges for bridge engineers. They create highly variable situations and can damage
bridge structures in many different ways. Bridge collapses happen suddenly and unpredictably and often lead to
tragic loss of human lives. Understanding the processes leading to bridge scour and burial is crucial for hazard
assessment. In previous research, our team developed a scour sensor based on wireless and MEMS technologies.
Collaborated with the interdisciplinary institute of NARLabs, we have developed and successfully demonstrated
the bridge multi-hazards early warning system in the field of Taiwan river basins. The system permits real-time
monitoring of water and bed levels along bridge piers. It was successfully deployed on several bridges such as
No3. National Freeway Bridge at Dajia River in Taiwan. The wireless sensor network has been applied widely,
and in many fields. In this study, a wireless scour monitoring system has been developed and deployed in the
laboratory and the field, respectively. This system can measure the scouring/deposition process and the
variations of water levels at a bridge pier. The results indicate that the proposed system has the potential
applicability to monitor scour evolution in the field.
KEYWORDS: bridge, scour, wireless sensor network, monitoring system
1. GENERAL INSTRUCTIONS
Scour problem plays a key role in many bridge failures that occur around the globe. More than 1000 bridges
have collapsed over the past 30 years in the U.S.A., with 60% of the failures due to scour. This serious problem
also happens in many East-Asian countries such as Taiwan and Japan, owing to the fact that these areas are
subject to several typhoon, hurricanes and flood events each year during the summer and fall seasons. Therefore,
it is necessary to have a reliable estimation of scour hole around bridge piers to ensure that adequate measures
are taken to prevent erosion related failure throughout the service life of the structure. However, due to the
complicated interaction between fluid flow patterns caused by obstructing pier and erosion of sediment leading
to the formation of scour hole, it is extremely difficult to develop a reliable analytical/numerical model capable
of taking into account various controlling and inter-related factors without over simplification. Collaborated
with the interdisciplinary institute of NARLabs including the National Science and Technology Center for
Disaster Reduction (NCDR), Taiwan Typhoon and Flood Research Institute (TTFRI), National Center for
Research on Earthquake Engineering (NCREE), Instrument Technology Research Center (ITRC), National Chip
Implementation Center (CIC), National Nano Device Laboratories (NDL), and National Center for
High-performance Computing (NCHC), we have developed and successfully demonstrated the bridge
multi-hazards early warning system in the field of Taiwan river basins.
A real time scour monitoring system improves the safety of a bridge, as well as being cost-effective by guarding
against premature or unnecessary maintenance of a bridge. In addition, it should be able to be applied to bridges
with different foundations. However, around piers/abutments the combined effects of the turbulent boundary
layer, the vortex system, the time-dependent flow pattern and the sediment transport mechanism make the
phenomenon of scouring extremely complex. Consequently, experimental studies must be conducted by
considering only certain aspects as simply constants. A scour hole generally gets filled in as the flood flow
diminishes, and bridge inspections are not adequate to fully determine the extent of scour damage after a flood.
Field data are limited due to observational difficulties. Therefore, in the traditional bridge design approach, the
safety margin allowed for scour is usually large enough to compensate for any uncertainties, and consequently a
lot of money may be wasted through over-design and unnecessary costs for protection. However, at the same
time, critical scour damage to bridges often cannot be repaired immediately, nor are bridges that are susceptible
to scour being evaluated at appropriate time intervals. Critical bridges subject to scour problems require proper

safety hazard monitoring.
There are a number of methods and equations in the literature for estimating scour depth at bridge supports.
Most of the scour studies are limited to predicting the maximum scour depth based on empirical equations.
These empirical equations and their derived simulation models are based mainly on laboratory data from
steady-flow experimental results which may not be accurate enough for field applications. Due to the
complexity of the flow and the sediment transport associated with scour processes, there are a number of factors
involved that characterize the real-time scour-depth evolution in a flood. Furthermore, the lack of development
of measuring instruments and data acquisition systems presents difficulties in the application of scour models
for large-scale hydraulic and transportation structures in the field. As mentioned previously, if the scour
processes are understood, an appropriate bridge design or remedial measures during construction can be both
efficient and cost-effective. However, these processes are complicated. Scour mostly occurs during high water
stages and is often filled in as the peak flow subsides. Unfortunately, acquiring in situ scour-depth information
using direct measurements is very difficult as well as very dangerous in a typhoon flood, heave storm or
hurricane which is usually accompanied by high speed winds and torrential downpours.
Many instruments have been developed for measuring, monitoring and predicting the scour depth at bridge
foundations, including sonar, radar, time-domain reflectometry (TDR) and an optical fiber sensor. However,
most of these techniques have been found to have limited application. For instance, both sonar and radar can
receive substantial noise caused by the turbidity of the flow to make those systems unreliable for real-time
monitoring of the scour process. The TDR technique works by generating an electromagnetic pulse which may
attenuate and disperse its signal due to the environment of the transmission line. This drawback of the TDR
technique reduces its ability to detect subtle changes in the scour process.
Fig. 1 Bridges failure during typhoon flood scour in Taiwan
Therefore, the bridge scour-monitoring system faces the challenge of developing a real-time, reliable and robust
system, which can be installed in a river bed at a bridge pier or abutment. Moreover, it is well known that the
established scour formula for estimating the maximum scour depth relates to the scour characteristics, including
the flow depth, velocity and sediment size. In reality, these limitations of the scour formula must be addressed
before the formula can be properly applied. The recognition of any possible aggradation and degradation of the
river-bed level in response to a channel disturbance is important for the prediction of channel bed variations.
The scour process around the pier or abutment is essentially complex due to the three-dimensional flow patterns

interacting with the sediments. However, most of the data obtained to develop the scour formula are collected
from the laboratory instead of from the field. Thus, it is necessary to develop a real-time system for monitoring
to observe and measure the scour-depth variations in the field.
Wireless sensor network (WSN) system has been widely used in recent years as a promising technology in civil
engineering and industrial applications that will greatly influence the way of structural health monitoring. Smart,
wirelessly networked sensors can collect and process a vast amount of data, from monitoring and control of
structural damage, air quality, traffic conditions, to weather conditions and tidal flows. In the present study, the
monitoring system that consists of a combination of vibration-based MEMS sensors and WSN is developed and
utilized to obtain real-time measurements in the scour/deposition processes. By applying the wireless MEMS
sensors network system, the laboratory data of the water level, scour depth and deposition height are collected
and analyzed in this study.
2. FIELD DEPLOYMENT AND RESULTS
The study area is located in the downstream river reach of Dajia River basin which is one of the major rivers for
municipal and public water demand in central Taiwan. The monitoring bridge, named Dajia Bridge, pier, named
P28L, of National Freeway Bridge is situated in the Dajia River, which is one of the major transportation routes
between Miaoli county and Taichung city. The Dajia Bridge is situated in the flood channel, and consisted of 38
spans and 37 cylindrical columns (2.7 m in diameter). The study reach, as shown in Fig. 2, is about 3285 m long
and 1165 m wide between the cross section 7 (as the downstream outflow boundary) and cross section 13 (as the
upstream inflow boundary). Fig. 2 also shows the bed elevations in the simulation domain range from EL. 51.89
m to EL. 97.50 m above the sea surface level. The averaged bed slope of the simulation domain along
longitudinal main river channel is 0.01. The median size of bed material, d50, is 91.5mm and the assumed
sediment porosity is 0.4. The monitoring bridge pier (x = 211264.51 m, y = 2689692 m) at Dajia Bridge is
adopted for numerical verification. Our main objective in this case is to test the capability of total scour depth
estimation to consist with developed real-time Freeway Bridge scour early warning system.
Fig. 2 Scouring sensor field deployed
Measuring vibration is very essential in detecting and diagnosing any deviation from normal conditions. The use
of conventional accelerometers in vibration measurements is well known and accepted. The recent advances in
wireless and embedded system technologies such as Micro-Electro Mechanical systems (MEMS) sensors hold a
great promise for the future of wireless smart vibration measurement based condition monitoring which are
much cheaper alternatives. MEMS accelerometers are one of the simplest and most applicable
micro-electromechanical systems. They became indispensable in automobile industry, computer and
audio-video technology. MEMS sensors are well recognized as the key building blocks for implementing
Wireless Station
Scouring Sensors
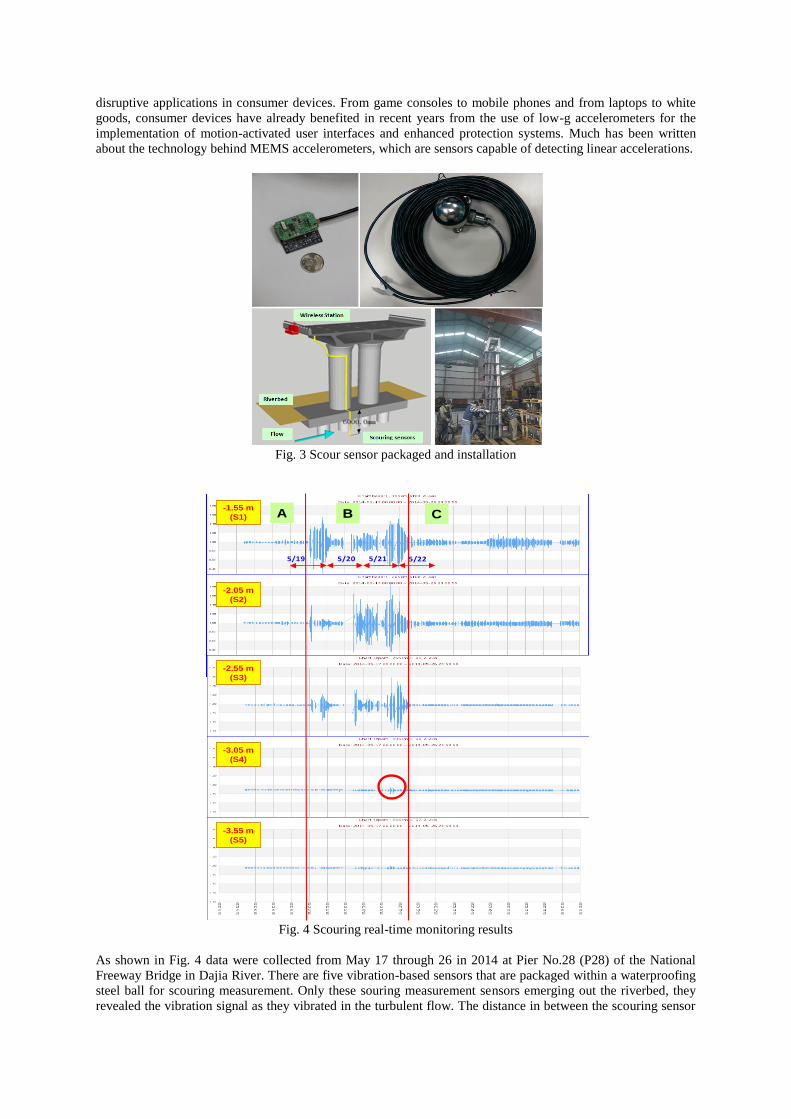
disruptive applications in consumer devices. From game consoles to mobile phones and from laptops to white
goods, consumer devices have already benefited in recent years from the use of low-g accelerometers for the
implementation of motion-activated user interfaces and enhanced protection systems. Much has been written
about the technology behind MEMS accelerometers, which are sensors capable of detecting linear accelerations.
Fig. 3 Scour sensor packaged and installation
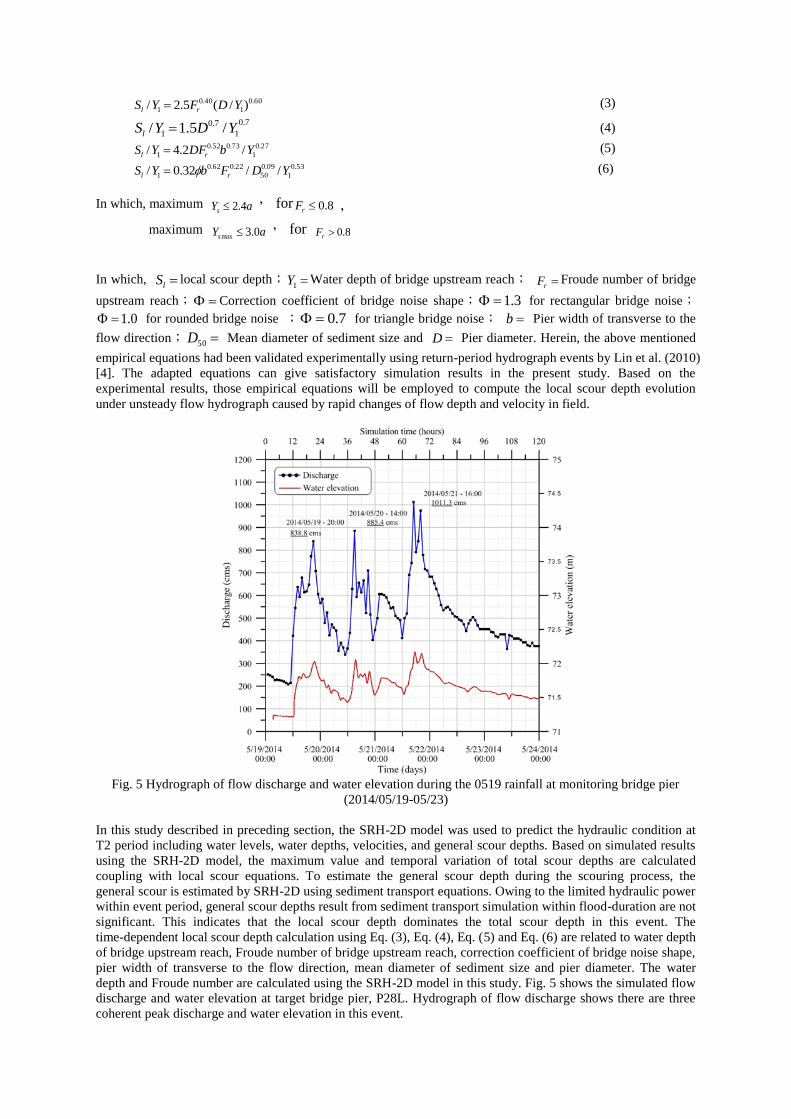
Fig. 4 Scouring real-time monitoring results
As shown in Fig. 4 data were collected from May 17 through 26 in 2014 at Pier No.28 (P28) of the National
Freeway Bridge in Dajia River. There are five vibration-based sensors that are packaged within a waterproofing
steel ball for scouring measurement. Only these souring measurement sensors emerging out the riverbed, they
revealed the vibration signal as they vibrated in the turbulent flow. The distance in between the scouring sensor
-3.55 m
(S5)
-3.05 m
(S4)
-2.55 m
(S3)
-2.05 m
(S2)
-1.55 m
(S1) A B C
5/19 5/20 5/21 5/22

is 0.5m as named S1(-1.55m) to S5(-3.55m) that are protected in the steel reinforcement cage and deployed
under the pier foundation. Their locations are installed from the top of the pier foundation and there are three
scour sensors (S1 to S3) exposed to the free air in the initial status due to the hydraulic structure construction
project while S4 and S5 are embedded in the riverbed.
It is quite obvious to find the fluctuations of S1, S2, and S3 induced by the flow during the storming period from
19th to 22th May, 2014. From the signal response in the Fig. 4 on 21st, the S4 was emerged out the riverbed at
about 16:00pm and deposit into the riverbed again later at about 21:00pm. From the sensor response it is
obtained that there was 0.5m depth scoured in this storm event.
Most open-channel flows considering hydraulic scour depths are assumed shallow and the effect of vertical flow
motions are not calculated if the down flow along the bridge pier is implicated in hydraulic scour equations. As
a result, the 3D Navier-Stokes equations may be vertically averaged to obtain a set of depth-averaged 2D
equations to calculate water depth and flow velocity. The SRH-2D model is one of a depth-averaged 2D model
developed for studying open-channel flows. The model is used for solving the 2D shallow-water flow equations
by using the finite-volume numerical method on unstructured hybrid mesh system. The model can simulate the
sub/supercritical flow and steady/unsteady flows in rivers that are generated by hydraulic structures such as
bridge piers. Moreover, the model has been tested in several experimental or field cases in shallow water
flows, which has demonstrated that the model is suitable for practical applications in hydraulic engineering.
However, SRH-2D model cannot be used to compute the local scour evolution directly. Therefore, we adopt
four different empirical equations to predict the local scour depth based on the simulated hydraulic patterns from
the SRH-2D model. Therefore, the SRH-2D model is used in this study to simulate the temporal variation of
general scour depth coupling with local scour depth.
The total hydraulic scour depth in front of a pier is affected by general scour, local scour, contraction scour, and
bend scour. In this study, because of the river reach near the Freeway Bridge is roughly straight the effects of
bend scours could be neglected. Owing to the spans of the bridge piers are substantially larger than the pier
diameters the contraction scours also could be ignored. Therefore, the total scour depth of Freeway Bridge piers
is dominated by the general scour and local scour. The general scour is resulted from bed material transportation
which includes suspended load and bed load. The best general scour estimation from the calibration and
verification processing were obtained using the bed load equation of Parker (1990) [5] for the bed load in
combination with advection dispersion equation for the suspended load in the study area. The Parker’s (1990)
equation is well suited to rivers composed of both coarse sediments (e.g., gravels) and fine sediments (e.g.,
sands). The transport equation for sediment size class k may be expressed as:
)()/(
)1(/)3/)2/(4(5.1
3
kak
b
okgGP
sgpdS
)(
50d
dk
r
kk
(1)
2.14
2
5.4
00218.
])1(28.9)1(2.14exp[00218.
)/853.01(933.11
k
kk
k
G
0.1
59.10.1
59.1
k
k
k
(2)
In the above, gS is the general scour per unit width,
op is the sediment porosity (=0.4), akP is the volumetric
fraction of sediment size class k on the bed surface, 1/ ss , and s are the water and sediment
density, respectively, g is the gravitational acceleration, b is bed shear stress, ])1(/[ kbk dsg is
Shield’s parameter of sediment size class k ; r is the reference Shield’s parameter,
kd is the diameter of
sediment size class k , and 50d is the median diameter of the sediment mixture in bed. In this study, the same
values (r =0.0385 and α=0.905) adopted by Greimann and Vandeburg (2008) [8] are used. The local scour
depth evolution at the pier nose under unsteady flow is computed by a specific position proposed by Shen et al.
(1969) [7], Laursen (1962) [8], Inglis (1949) [9], and Froehlich (1991) [10] in this study. The selected four
different empirical equations are described as following:
60.0
1
40.0
1 )/(5.2/ YDFYS rl (3)
7.0
1
7.0
1 /5.1/ YDYSl (4)
27.0
1
73.052.0
1 /2.4/ YbDFYS rl (5)
53.0
1
09.0
50
22.062.0
1 //32.0/ YDFbYS rl (6)
In which, maximum aYs 4.2 , for 8.0rF ,
maximum aYs 0.3max , for 8.0rF
In which, lS local scour depth; 1Y Water depth of bridge upstream reach; rF Froude number of bridge
upstream reach; Correction coefficient of bridge noise shape; 3.1 for rectangular bridge noise;
0.1 for rounded bridge noise ; 7.0 for triangle bridge noise; b Pier width of transverse to the
flow direction; 50D Mean diameter of sediment size and D Pier diameter. Herein, the above mentioned
empirical equations had been validated experimentally using return-period hydrograph events by Lin et al. (2010)
[4]. The adapted equations can give satisfactory simulation results in the present study. Based on the
experimental results, those empirical equations will be employed to compute the local scour depth evolution
under unsteady flow hydrograph caused by rapid changes of flow depth and velocity in field.
Fig. 5 Hydrograph of flow discharge and water elevation during the 0519 rainfall at monitoring bridge pier
(2014/05/19-05/23)
In this study described in preceding section, the SRH-2D model was used to predict the hydraulic condition at
T2 period including water levels, water depths, velocities, and general scour depths. Based on simulated results
using the SRH-2D model, the maximum value and temporal variation of total scour depths are calculated
coupling with local scour equations. To estimate the general scour depth during the scouring process, the
general scour is estimated by SRH-2D using sediment transport equations. Owing to the limited hydraulic power
within event period, general scour depths result from sediment transport simulation within flood-duration are not
significant. This indicates that the local scour depth dominates the total scour depth in this event. The
time-dependent local scour depth calculation using Eq. (3), Eq. (4), Eq. (5) and Eq. (6) are related to water depth
of bridge upstream reach, Froude number of bridge upstream reach, correction coefficient of bridge noise shape,
pier width of transverse to the flow direction, mean diameter of sediment size and pier diameter. The water
depth and Froude number are calculated using the SRH-2D model in this study. Fig. 5 shows the simulated flow
discharge and water elevation at target bridge pier, P28L. Hydrograph of flow discharge shows there are three
coherent peak discharge and water elevation in this event.
Compare to the monitoring results in Fig. 4, the scouring process begins at T2 owing to the acceleration
responses were apparently reacted. The acceleration responses in T2 present three coherent acceleration
responses and this reaction phenomenon consistent flow discharge. After the scouring process begins at T2 as
the origin presented in Fig. 4, the acceleration response of sensor S1, sensor S2 and sensor S3 were continually
reacted in flood period. It means these three monitoring sensors exposed before flood coming and appeared
acceleration signal accompanied with flow pattern. In addition, the maximum total scour depth was happened at
third peak flow discharge results from the acceleration response of S4 was occurred. After the sensor S4 is
exposed by scouring, the fluctuating responses of acceleration result from near-bed moving sediments attacking
the diaphragm of the sensor to produce relatively weak variations. The measured total scour depth was between
0.5m and 1m due to the distance of monitoring sensor is 0.5m. When the monitoring process begins at T3, the
acceleration signal is vanished at sensor S3 and sensor S4. This appearance might illustrates that the scour
process is changed to deposition process result from flow velocity is decreases quickly after third peak discharge.
Moreover, the latest deposition elevation could higher than original river bed.
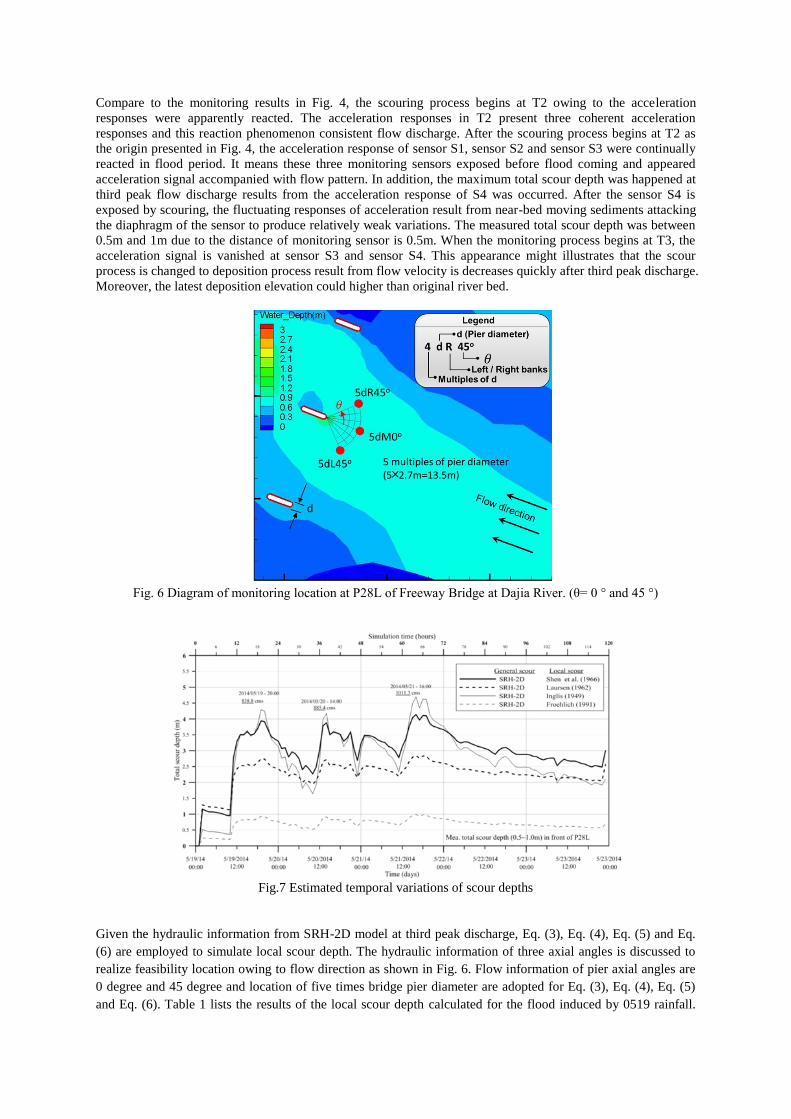
Fig. 6 Diagram of monitoring location at P28L of Freeway Bridge at Dajia River. (θ= 0 ° and 45 °)
Fig.7 Estimated temporal variations of scour depths
Given the hydraulic information from SRH-2D model at third peak discharge, Eq. (3), Eq. (4), Eq. (5) and Eq.
(6) are employed to simulate local scour depth. The hydraulic information of three axial angles is discussed to
realize feasibility location owing to flow direction as shown in Fig. 6. Flow information of pier axial angles are
0 degree and 45 degree and location of five times bridge pier diameter are adopted for Eq. (3), Eq. (4), Eq. (5)
and Eq. (6). Table 1 lists the results of the local scour depth calculated for the flood induced by 0519 rainfall.

The results show that the local pier-scour equations of Shen et al., Laursen, and Inglis were an overestimation of
the local scour depth. Because of the equations of Shen et al., Laursen, and Inglis were developed using limited
laboratory data that were collected under steady and equilibrium scour conditions, the effect of the unsteadiness
of a hydrograph was not considered. This could explain why using these equations may have resulted in an
overestimation of local scour depth. By contrast, incorporating with the SRH-2D model and the algorithm of
Froehlich was appropriately estimation of local scour depth. The Froehlich equation developed on larger data
bases and this lead to the calculated local scour depth is further agreed with measured data.
Although local scour depth is concerned with three pier axial angles in Table 1, the variation of calculated
results is not significant. Therefore, the temporal variations of local scour depths are estimated by 0 pier axial
angle coupling with general scour depths as shown in Fig. 7. It is found that the simulated scour depths in early
scouring process, A, by Shen et al. and Laursen equations are slightly more than the measured depth and Inglis
and Froehlich equations are closed to the measured depth. As the flow discharge increases, the simulated scour
depth by Shen et al., Laursen, and Inglis trend much deeper and accompanied with flow hydrograph during B
period. After the peak-flow, C, the discharge decreases quickly, and the simulated scour depth by Shen et al.,
Laursen, Inglis, and Froehlich slightly decreases during the recession period. It evidence that the deposition
process is taken into consideration in the adopted scour models. Froehlich’s equation is shown to yield good
simulated results compared with the collected monitoring data of maximum scour depth.
Table. 1 Estimated local scour depth of empirical equations (Units: m)
By real-time Freeway Bridge scour early warning system in the field, the investigated results indicate that the
real-time warning system has the potential for further applications coupling with hydraulic simulation and
feasibility scour depth equation. It is evident that the study results from acceleration responses are much more
convenient to detect river bed revolution. In addition, the proposed bridge scour warning system is not only
useful for monitoring the water depth, scour depth and deposition height at piers, but it also could promote the
accelerometers onto a single sensor board to diagnose the structural health of a bridge during footing failure.
3. SUMMARY
Scour problem plays a key role in many bridge failures that occur around the globe. More than 1000 bridges
have collapsed over the past 30 years in the U.S.A., with 60% of the failures due to scour. This serious problem
also happens in many East-Asian countries such as Taiwan and Japan, owing to the fact that these areas are
subject to several typhoon, hurricanes and flood events each year during the summer and fall seasons. Therefore,
it is necessary to have a reliable estimation of scour hole around bridge piers to ensure that adequate measures
are taken to prevent erosion related failure throughout the service life of the structure. However, due to the
complicated interaction between fluid flow patterns caused by obstructing pier and erosion of sediment leading
to the formation of scour hole, it is extremely difficult to develop a reliable analytical/numerical model capable
of taking into account various controlling and inter-related factors without over simplification. Collaborated
with the interdisciplinary institute of NARLabs, we have developed and successfully demonstrated the bridge
multi-hazards early warning system in the field of Taiwan river basins.
REFERENCES
1. K. W. Gee, Action: compliance with the national bridge inspection standards – plan of action for scour
critical bridges, FHWA Bridge Technology Memorandum (2003)
http://www.fhwa.dot.gov/bridge/072403.htm.
Location
Water
Depth
(m)
𝑉
(m/s)
Froude
Number
General
Scour Depth
of Bridge (m)
Local Scour Depth
of Bridge (m)
SRH-2D Shen et al.,
1966
Laursen,
1962
Inglis,
1949
Froehlich
, 1991
5dL45* 0.789 2.577 0.926 0.033 4.002 2.800 4.439 0.954
5dM0* 0.809 2.628 0.933 0.035 4.054 2.821 4.537 0.967
5dR45* 0.800 2.622 0.936 0.036 4.041 2.811 4.508 0.963

2. G. Oliveto and W. H. Hager, Further results to time-dependent local scour at bridge elements, Journal of
Hydraulic Engineering, v 131, n 2 (2005) 97-105
3. W. Y. Chang, J. S. Lai and C. L. Yen, Evolution of scour depth at circular bridge piers, Journal of
Hydraulic Engineering, v 130, n 9 (2004) 905-913
4. Y. B. Lin, J. C. Chen, K. C. Chang, J. C. Chern and J. S. Lai, Real-time monitoring of local scour by using
fiber Bragg grating sensors, Smart Materials & Structures, volume 14 (2005) 664-670
5. Parker, G., (1990) , “Surface-Based Bedload Transport Relation for Gravel Rivers” ,J. Hydraulic Research,
28(4):417-436.
6. Greimann, B.P., and Vandeberg, M., (2008). Predicting Rock Scour, Technical Report SRH-2008-01,
Technical Service Center, Bureau of Reclamation, Denver, CO.
7. H. W. Shen, V. R. Schneider and S. S. Karaki (1969) , “Local scour around bridge piers,”Journal of the
Hydraulic Division, A.S.C.E., 95(HY 6), pp. 1919-1940.
8. E. M. Laursen (1962) , “Scour at bridge crossings,” Transactions of the American Society of Civil
Engineers, vol., 127, pt I, no. 3294, pp. 166-209.
9. S. C. Inglis (1949) , “Maximum depth of scour at heads of guide bands and groynes, pier noses, and
downstream bridges-the behavior and control of rivers and canals,” Indian Waterways Experimental
Station, Poona, India.
10. D. C. Froehlich (1991) , “Analysis of Onsite Measurements of Scour at Piers ,” Proc., A.S.C.E., National
Hydraulic Engineering Conference, Colorado Springs, CO.


