Download - Discussion Materials for: Dallas CPA Society May 26, 2011 Raising Capital in Today’s Market

Discussion Materials for:
Dallas CPA Society
May 26, 2011
Raising Capital in Today’s Market
2
1. Current Economic Climate
2. Middle Market Bank Financing
3. Asset Based Loan Market
4. Syndicated Loan Market
A. Investment Grade
B. Leveraged Loans
5. Capital Markets
A. High Yield Debt
B. Mezzanine
Table of Contents

Current Economic Climate
US Recovery Gains Momentum but Unemployment High
■ Real GDP to grow 2.5% to 3% in 2011 despite ongoing housing problems
Stronger consumption will stimulate production, jobs
Rapid rebounds in exports and business investment in equipment & software
Corporate profits and cash flows rebound sharply
No. African & Middle East tensions boost oil prices, restraining pace of rebound
■ Employment gains strengthen gradually, and unemployment rate begins to fall from very high levels
■ Household sector deleveraging
■ Core inflation to rise only modestly while commodity prices soar
10-yr treasury rate – key driver of U.S. housing – expected to increase to 4%
Uncertainty still remains
Key Themes
4

U.S. Macroeconomic Outlook
U.S. Consumer Update
An Improving U.S. Economic Outlook For 2011
3.0%2.5%
3.1%3.2%
0.0%
1.0%
2.0%
3.0%
4.0%
2011
2.9%
2012
3.1%
U.S. GDP
Consensus:
Consumer Credit(2)
$2.44$2.45
$2.56
$2.52
$2.30
$2.40
$2.50
$2.60($tn)
2007
2008
2009
2010
____________________Source: Bloomberg and BofAML Economic Research as of April 15, 2011.Note: Old estimates as of January 28, 2011.(1) Source: University of Michigan Consumer Sentiment survey.(2) Dollars in trillions. Per Federal Reserve statistical release dated February 7, 2011. Includes revolving credit such as credit cards and nonrevolving credit such as
loans for automobiles and education. Excludes loans secured by real estate.
Consumer Sentiment(1)
50
60
70
80
90
100
Jan-07 May-08 Sep-09 Feb-11
72.0
77.5
Avg
Personal Savings
0.0%
2.0%
4.0%
6.0%
8.0%
10.0%
Jan-07 May-08 Sep-09 Jan-11
4.5%
5.8%
Avg
(% disp. income)
Inflation Outlook
Consensus:
3.1%
1.6%
1.6%1.1%
0.0%
1.0%
2.0%
3.0%
4.0%
2011
2.6%
2012
2.0%
U.S. Unemployment
Consensus:
OldNew
8.6%
7.9%
9.4%8.9%
6.0%
7.5%
9.0%
10.5%
2011
8.7%
2012
8.2%
5

Unemployment Remains High
An Improving U.S. Economic Outlook For 2011
Civilian Unemployment Rate: 16 yr +
SA, %
100500959085807570Source: Bureau of Labor Statistics /Haver Analytics 03/04/11
12
10
8
6
4
2
12
10
8
6
4
2
6

Housing Activity Remains Weak & Inventory Lingers
An Improving U.S. Economic Outlook For 2011
Housing StartsSAAR, Thous.Units
NAR Single Fam Homes Avail for Sale at End of Period, United StatesUnits,NSA
100908070605040302010099989796Sources: CENSUS, REALTOR /Haver 01/14/11
2400
2000
1600
1200
800
400
4000000
3500000
3000000
2500000
2000000
1500000
7

Distressed Mortgages
An Improving U.S. Economic Outlook For 2011
8

Middle Market Bank Financing

Bank of America Offers Financing of Long-term Assets such as Fixed Assets, Permanent Working Capital and Business Expansion and Acquisition on a Structured Payment Schedule
Bank Financing – Term Loans
■ Features
Predetermined payment schedule for your cash flow planning
Repayment schedule matched to the estimated depreciated life of the asset financed
Alternative fixed-rate pricing
■ Benefits
Allows you to retain your operating cash flow
Leverages your capital for expansion and acquisitions
Eliminates the guesswork around cash needed for repayment
10
Bank of America Offers Flexible Credit Facilities to Match Your Borrowing Needs with Your Working Capital Requirements
Bank Financing – Revolving Lines of Credit
■ Features
Draw down from an available amount (non-revolving line), or draw and pay back with an option to draw again (revolving line)
Can include sub-facilities for other financing instruments, such as letters of credit or bankers' acceptances
Terms and conditions are customized to fit your business
Principal amortization not required
Monthly interest payments only
■ Benefits
Reduces your interest expense through daily borrowings or reductions on the line of credit
Enables you to borrow only what you need when you need it
Evens out your seasonal working capital needs
Increases your liquidity by providing available cash flow for unexpected needs
11

Asset Based Loan Market

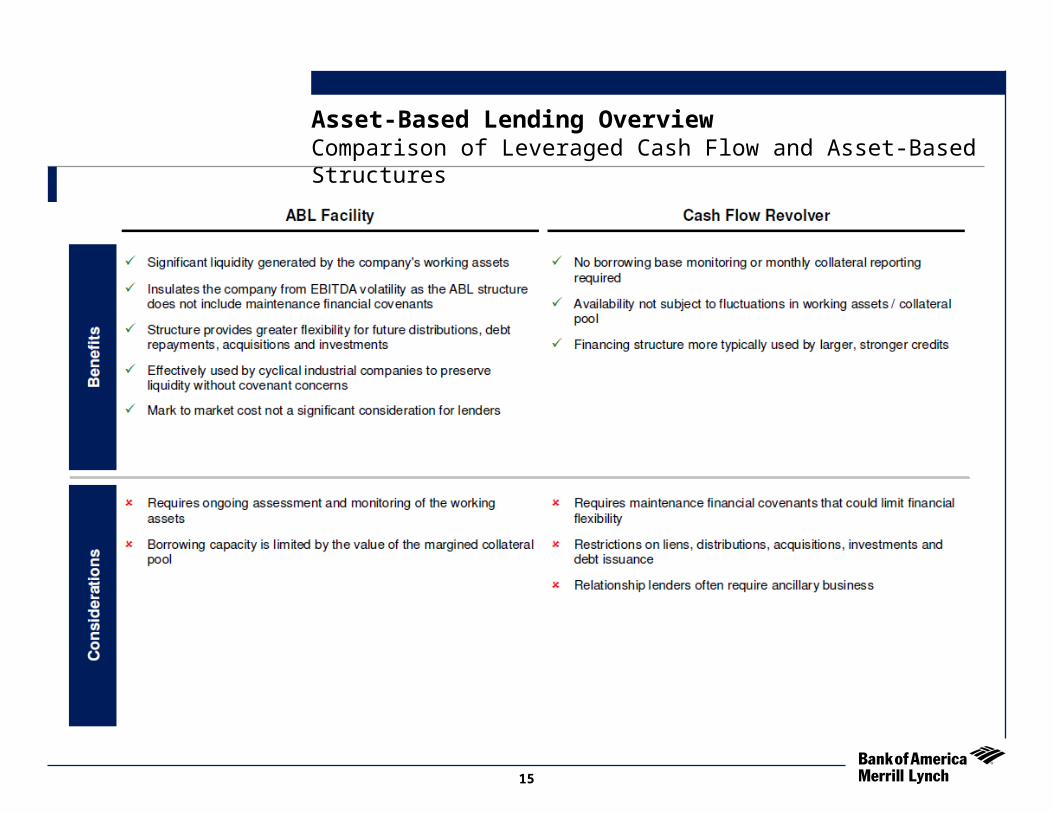
Asset-Based Lending OverviewComparison of Leveraged Cash Flow and Asset-Based Structures
13

Asset-Based Lending OverviewComparison of Leveraged Cash Flow and Asset-Based Structures
14
Asset-Based Lending OverviewComparison of Leveraged Cash Flow and Asset-Based Structures
15

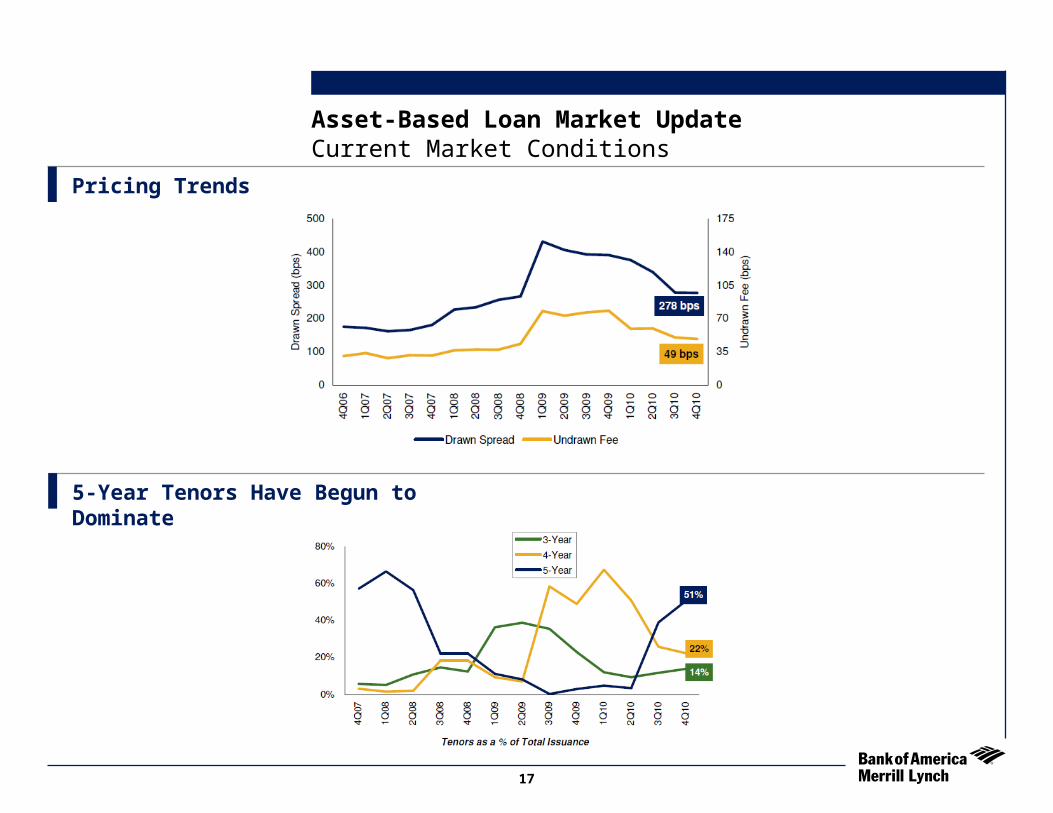
Based on current deals in-market and the slate of forward calendar transactions, BofAML anticipates average LIBOR spreads will trend to the 225-250 bps area, with unused fees ranging from 37.5 bps – 50.0 bps Refinancing
Investors remain focused on structure:
5 year tenors have become the standard
Cash dominion typically triggered at 12.5% – 15.0% availability
Appraisal and field exam frequency (1-2 times per year, with a trigger to 1 additional)
Financial covenant generally springs at 12.5% availability
Restricted payments generally allowed with 17.5% - 20.0% availability and 1.1x pro forma fixed charge coverage
Asset-Based Loan Market UpdateCurrent Market Conditions
Pricing and Structure Continue to Tighten
16
Asset-Based Loan Market UpdateCurrent Market Conditions
Pricing Trends
5-Year Tenors Have Begun to Dominate
17

Syndicated Loan MarketInvestment GradeLeveraged Finance
Investment Grade Market
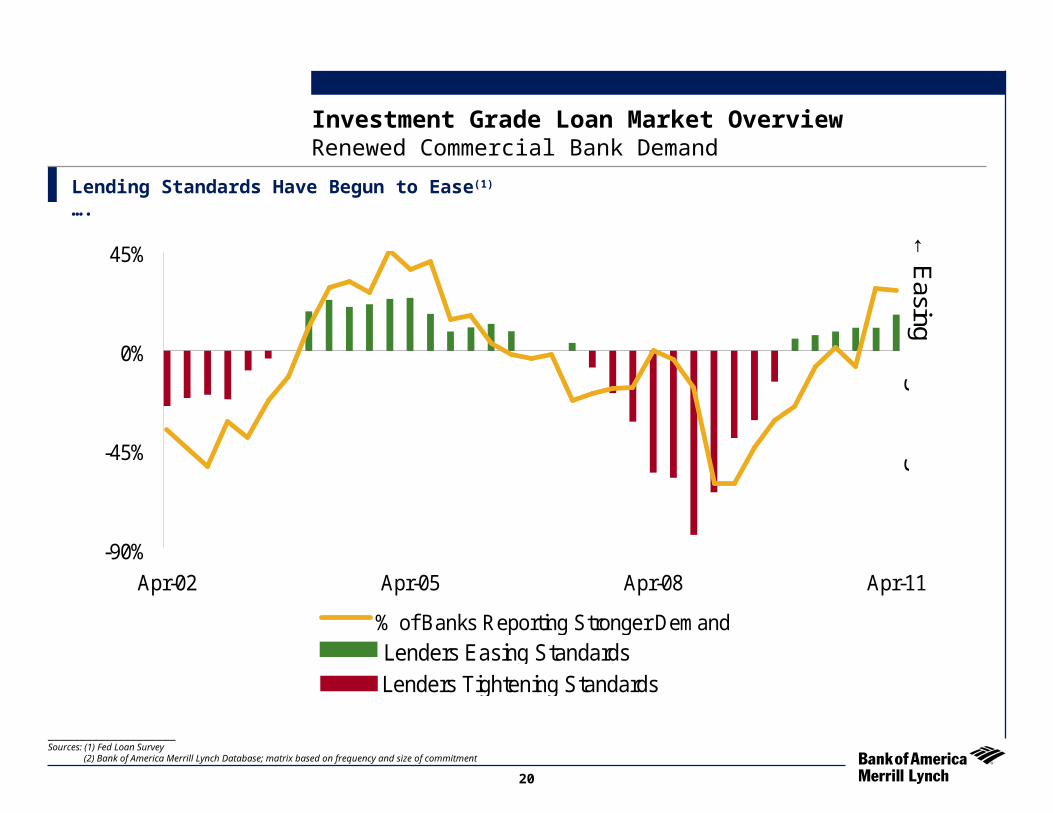
Renewed Commercial Bank Demand
Lending Standards Have Begun to Ease(1)….
Investment Grade Loan Market Overview
____________________Sources: (1) Fed Loan Survey (2) Bank of America Merrill Lynch Database; matrix based on frequency and size of commitment
20
Lenders Tightening Standards
-90%
-45%
0%
45%
Apr-02 Apr-05 Apr-08 Apr-11
% of Banks Reporting Stronger Demand
←E
asing T
ightening→
Lenders Easing Standards
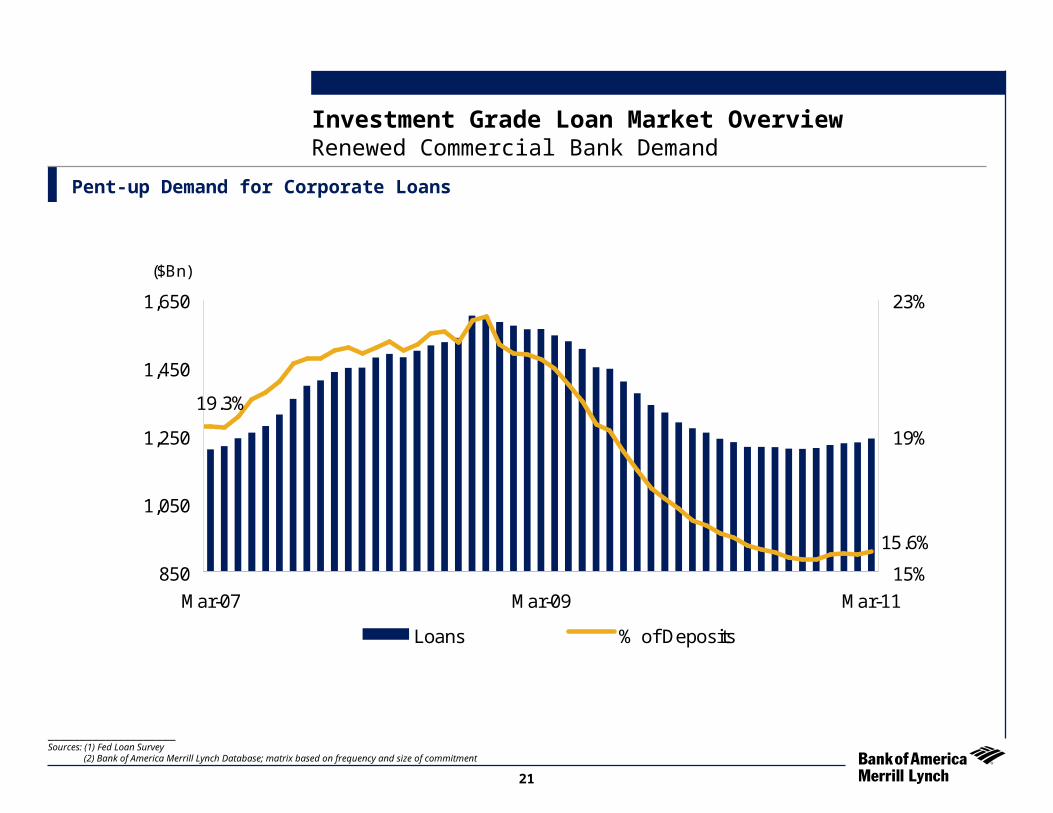
Renewed Commercial Bank Demand
Pent-up Demand for Corporate Loans
Investment Grade Loan Market Overview
____________________Sources: (1) Fed Loan Survey (2) Bank of America Merrill Lynch Database; matrix based on frequency and size of commitment
15.6%
19.3%
850
1,050
1,250
1,450
1,650
Mar-07 Mar-09 Mar-11
15%
19%
23%
Loans % of Deposits
($Bn)
21

…As the Markets Recovered, IG Loan Volume Was Strong Across All Sectors
____________________Sources: Bloomberg and Bank of America Merrill Lynch Database
Capital Markets RecoveryInvestment Grade Loan Market Overview
IG Loan Volume Rebounds Alongside Solid Bond Issuance
LTM Investment Grade Loan Volume: $538.5
$114.5
$93.7
$104.6 $105.2
$51.8
$64.0
Fin
anci
alIn
stitu
tions
En
ergy
&P
ow
er
Te
ch,
Med
ia,
Te
leco
m
Gen
era
lIn
dust
ries
Hea
lthca
re
Con
sum
erR
etai
l
$689
$879 $9
60
$748
$1,0
12
$737
$855
$539
$638 $6
77
$606
$283
$21
6
$376
2005 2006 2007 2008 2009 2010 LTM
IG Bonds IG Loans
$Bn
22
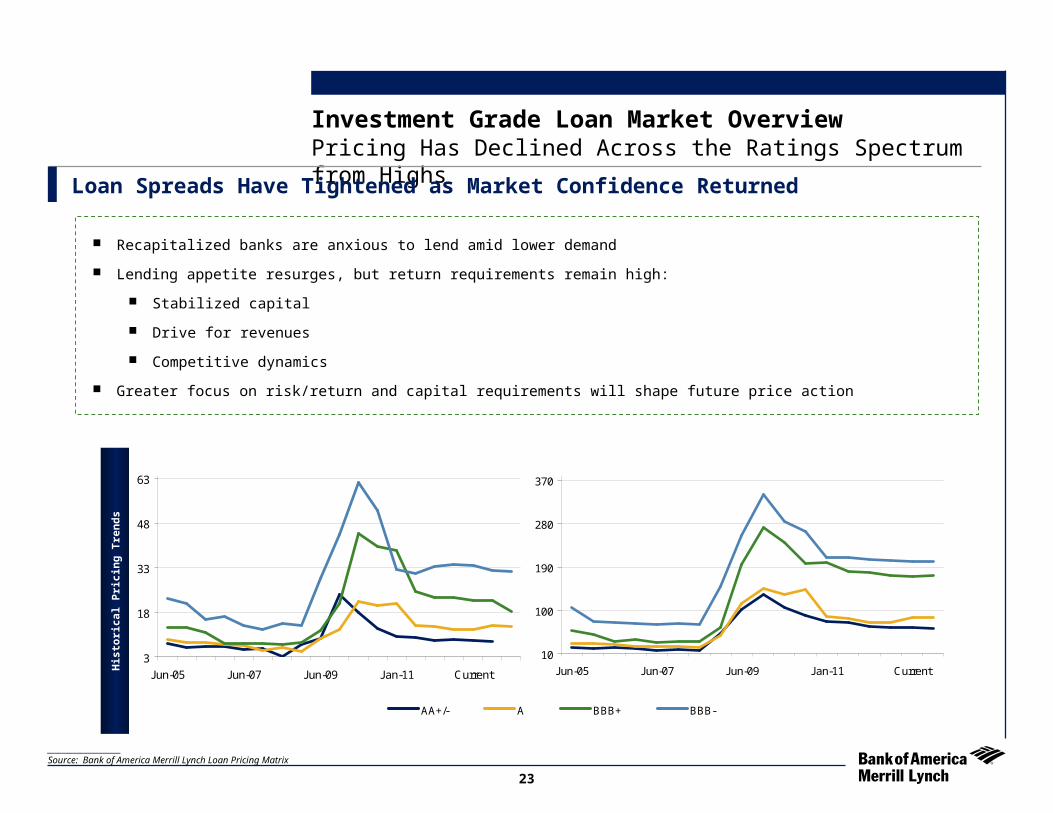
Recapitalized banks are anxious to lend amid lower demand
Lending appetite resurges, but return requirements remain high:
Stabilized capital
Drive for revenues
Competitive dynamics
Greater focus on risk/return and capital requirements will shape future price action
Pricing Has Declined Across the Ratings Spectrum from HighsLoan Spreads Have Tightened as Market Confidence Returned
____________________Source: Bank of America Merrill Lynch Loan Pricing Matrix
Investment Grade Loan Market OverviewH
isto
rica
l P
rici
ng
Tre
nd
s
10
100
190
280
370
Dec-03 Jun-05 Dec-06 Jun-08 Dec-09 Current
AA+/- A BBB+ BBB-
3
18
33
48
63
Jun-05 Jun-07 Jun-09 Jan-11 Current
(Undrawn bps)
10
100
190
280
370
Jun-05 Jun-07 Jun-09 Jan-11 Current
AA+/- A BBB+ BBB-
(L+bps Drawn)
3
18
33
48
63
Jun-05 Jun-07 Jun-09 Jan-11 Current
(Undrawn bps)
23

Pricing Expectations
3 Month LIBOR Expectations Remain Subdued
Investment Grade Loan Market Overview
0.0%
1.0%
2.0%
3.0%
4.0%
2011 2012 2013 2014
2Q11 3Q11 4Q11 1Q12 2Q12
BofAMLResearch 0.30% 0.30% 0.35% 0.45% 0.60%
BloombergConsensus 0.32% 0.38% 0.52% 0.79% 1.16%
ForwardCurve 0.26% 0.28% 0.37% 0.48% 0.66%
24

Renewed Commercial Bank Demand
Most Active Lenders(1)
Investment Grade Loan Market Overview
____________________Sources: (1) Bank of America Merrill Lynch Database; matrix based on frequency and size of commitment
Rank Rank Lender
1 Bank of America 9 Crédit Suisse
2 JP Morgan Chase 10 Morgan Stanley
3 Wells Fargo 11 Deutsche Bank
4 Citigroup 12 BNP Paribas
5 Barclays 13 Goldman Sachs
6 Royal Bank of Scotland 14 HSBC
7 US Bank 15 Bank of Nova Scotia
8 Mitsubishi UFJ 16 Bank of New York
Lender
25

____________________Source: Bank of America Merrill Lynch Database
The tenor distribution in the high grade loan market tilts toward longer maturities
More than 63% of forward calendar volume is multi-year
Nearly 75% of closed LTM volume is multi-year
Increasingly, there is a willingness to structure facilities with 4- and 5-year maturities
The maturity schedule is manageable given current market conditions and lender demand in the market
Investment Grade Loan Market OverviewMulti-Year Facilities Dominate the Market
Forward Calendar Volume Illustrates a Shift Toward Longer Maturities (1)
$134
$79$90
$169$158
$448
$502$515
$2$14
$38
$219
$390$390
$160
$230
$99
2005 2006 2007 2008 2009 1H'09 2H'09 1H'10 2H'10 1H'11 2H'11 2011 2012 2013 201620152014 2017
Forward Calendar Mix Investment Grade Loan Maturity Wall Through 2017
5+ Years45%
3+ to 4 Years12%
3 Years7%
364 days36%
1 to < 3 Years0%
26
Leveraged Loan Market

Robust Volume in 2011
Current Leveraged Loan Market ConditionsLeveraged Loan Market Overview
____________________Source: S&P/LCD
$33.3$35.4$35.1
$67.1
$29.8
$18.1
$27.5
$21.0
$31.4
$8.5$13.1
Jul-10 Sep-10 Nov-10 Jan-11 Mar-11 May-11Institutional Pro Rata
YTD Volume: $200.7 Bn YTD Volume: $200.7 Bn
Market Conditions Strong
The technical position in the leveraged finance market remains attractive as demand continues to outweigh supply, however heavy volumes are beginning to balance the technical picture
Despite equity and commodity volatility, and the large primary calendar, overall tone is solid
A recent wave of jumbo leveraged loan executions has tested market capacity, proving demand limits
28

Inflows Remain Positive
Current Leveraged Loan Market ConditionsLeveraged Loan Market Overview
____________________Source: S&P/LCD
Technical Position
Leveraged loan mutual fund inflows total $22.6 Bn over the LTM (46 consecutive weeks)
LTM flows: $22.6 Bn with 46 consecutive inflows
LTM flows: $22.6 Bn with 46 consecutive inflows
$532
$937
$604
$419
$597
$708
$569
$721$627
$381
$639$686
$1,053
$927$941
$1,048
$206
$848
$951
$482
$890
$417
$609
$897
$707
$804
Nov-10 Dec-10 Jan-11 Feb-11 Mar-11 Apr-11 May-11
Loan Weekly Flows 3 Week Moving Average
29
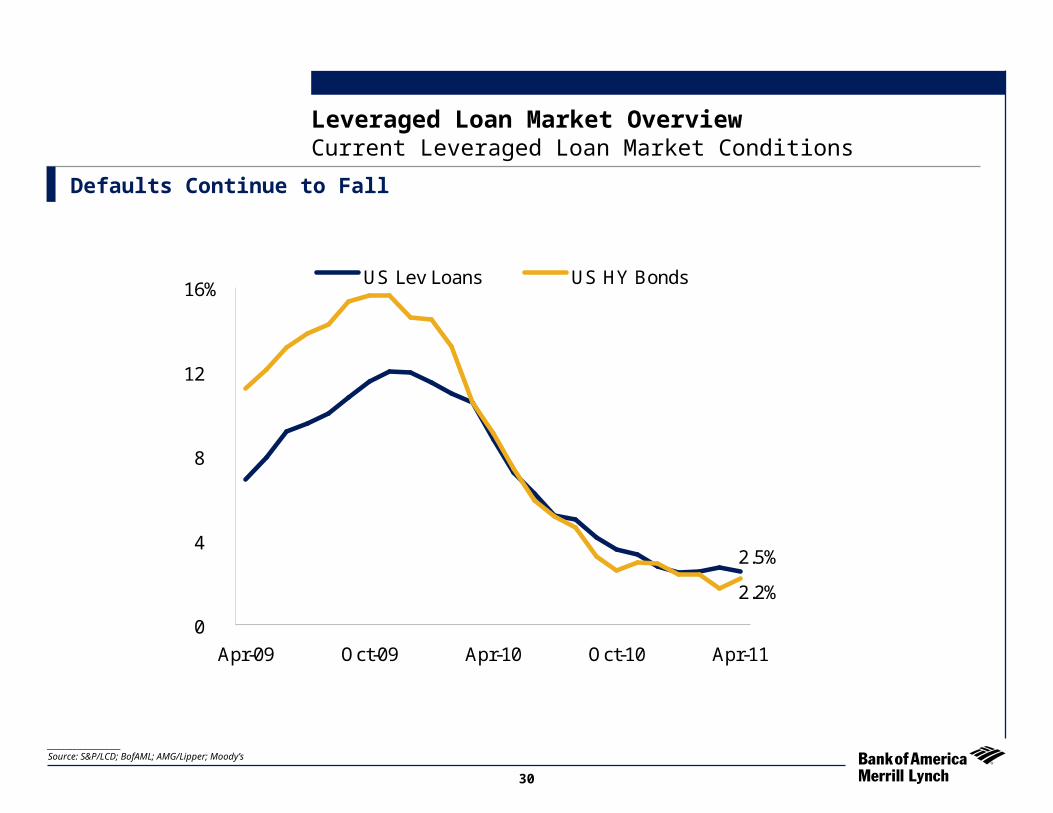
Defaults Continue to Fall
Leveraged Loan Market OverviewCurrent Leveraged Loan Market Conditions
____________________Source: S&P/LCD; BofAML; AMG/Lipper; Moody’s
2.5%
2.2%
0
4
8
12
16%
Apr-09 Oct-09 Apr-10 Oct-10 Apr-11
US Lev Loans US HY Bonds
30
4.46%
2.50%3.22%
3.83%
0.92%
0.26%
0%
6%
Jun-11 Jan-12 Aug-12 Feb-13 Sep-13 Mar-14
10 Yr UST 3 Mo LIBOR
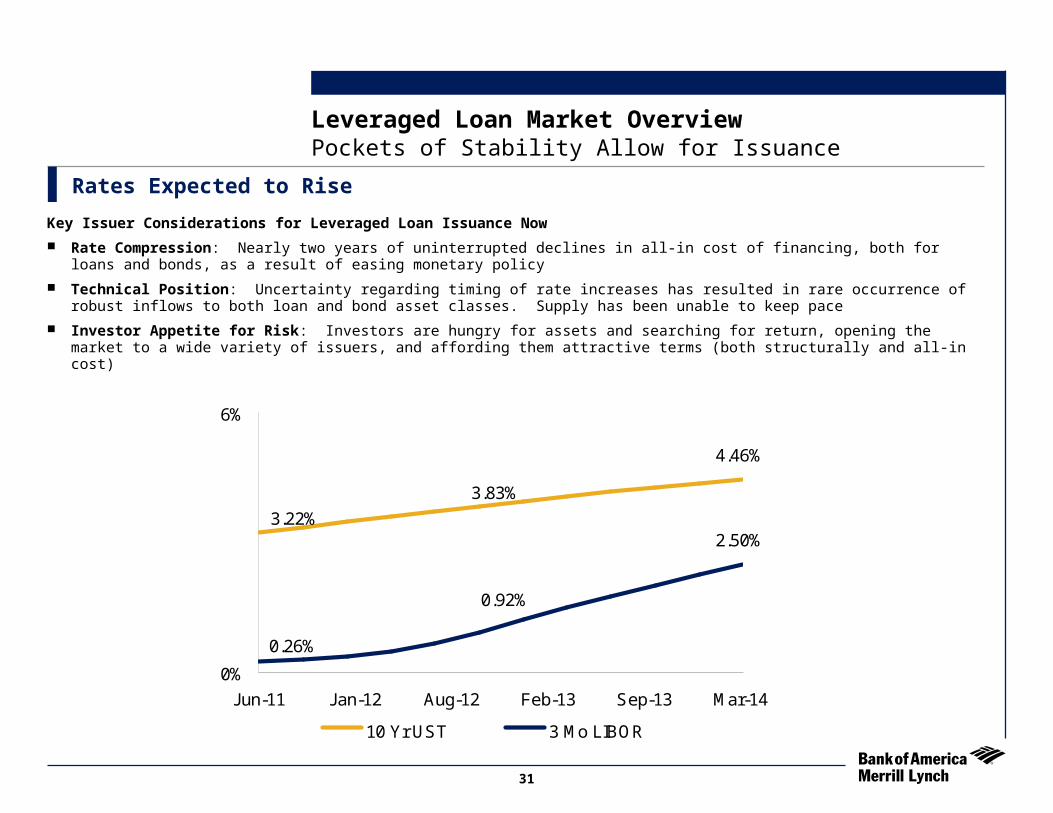
Leveraged Loan Market OverviewPockets of Stability Allow for Issuance
Rates Expected to Rise
Key Issuer Considerations for Leveraged Loan Issuance Now
Rate Compression: Nearly two years of uninterrupted declines in all-in cost of financing, both for loans and bonds, as a result of easing monetary policy
Technical Position: Uncertainty regarding timing of rate increases has resulted in rare occurrence of robust inflows to both loan and bond asset classes. Supply has been unable to keep pace
Investor Appetite for Risk: Investors are hungry for assets and searching for return, opening the market to a wide variety of issuers, and affording them attractive terms (both structurally and all-in cost)
31
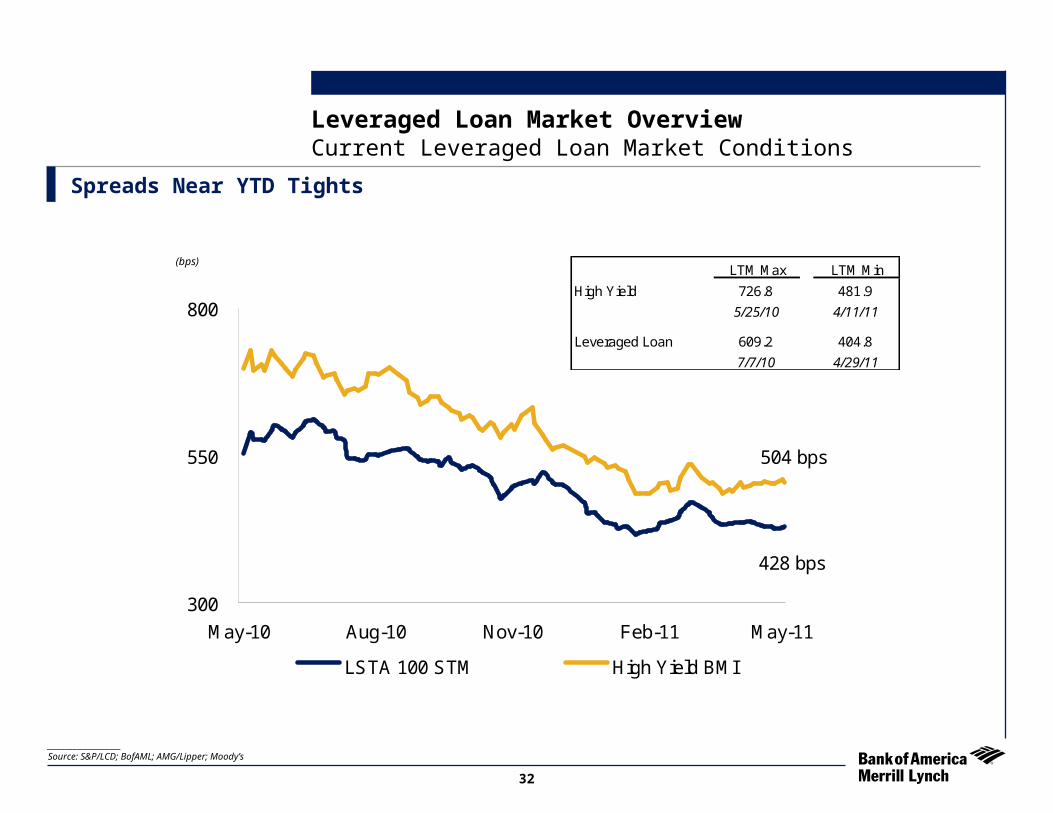
Spreads Near YTD Tights
Leveraged Loan Market OverviewCurrent Leveraged Loan Market Conditions
____________________Source: S&P/LCD; BofAML; AMG/Lipper; Moody’s
LTM Max LTM Min
High Yield 726.8 481.9
5/25/10 4/11/11
Leveraged Loan 609.2 404.8
7/7/10 4/29/11
428 bps
504 bps
300
550
800
May-10 Aug-10 Nov-10 Feb-11 May-11
LSTA 100 STM High Yield BMI
(bps)
32
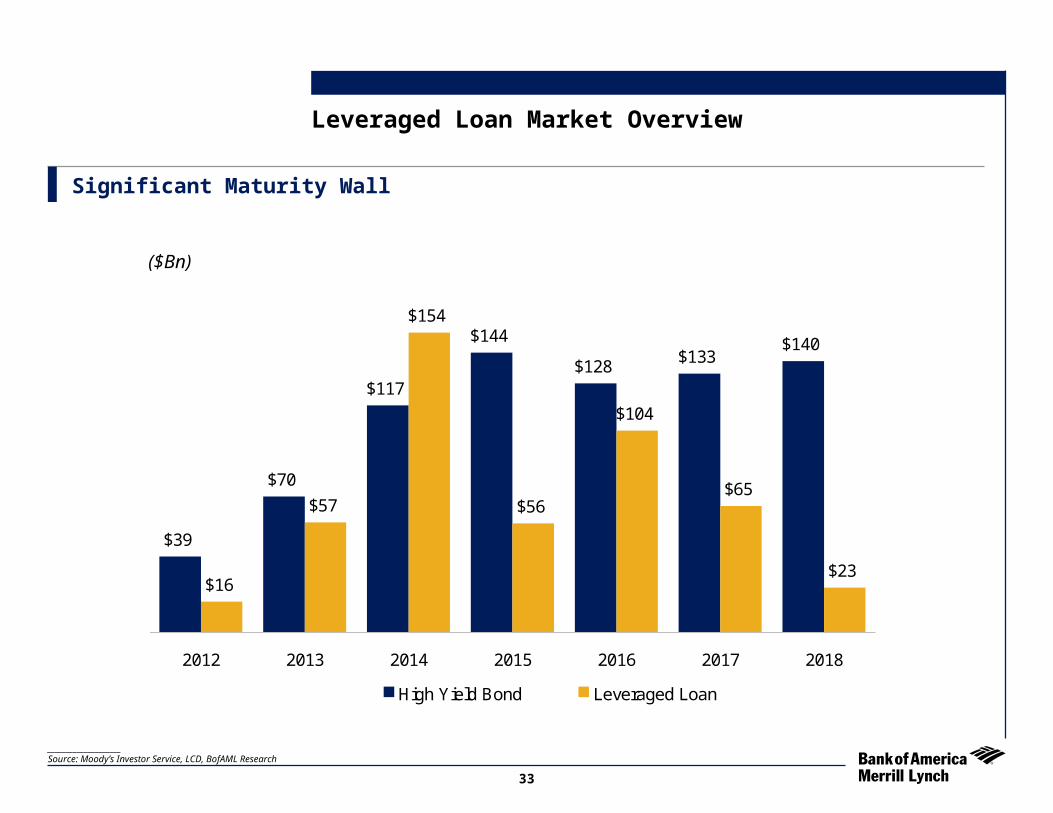
____________________Source: Moody’s Investor Service, LCD, BofAML Research
Leveraged Loan Market Overview
Significant Maturity Wall
($Bn)
$39
$70
$117
$144
$128$133
$140
$16
$56
$154
$23
$65
$104
$57
2012 2013 2014 2015 2016 2017 2018
High Yield Bond Leveraged Loan
33

Recent Use of Proceeds
Current Leveraged Loan Market ConditionsLeveraged Loan Market Overview
____________________Source: S&P/LCD
LBO12%
Dividend19%
M&A6%
Refi63%
34
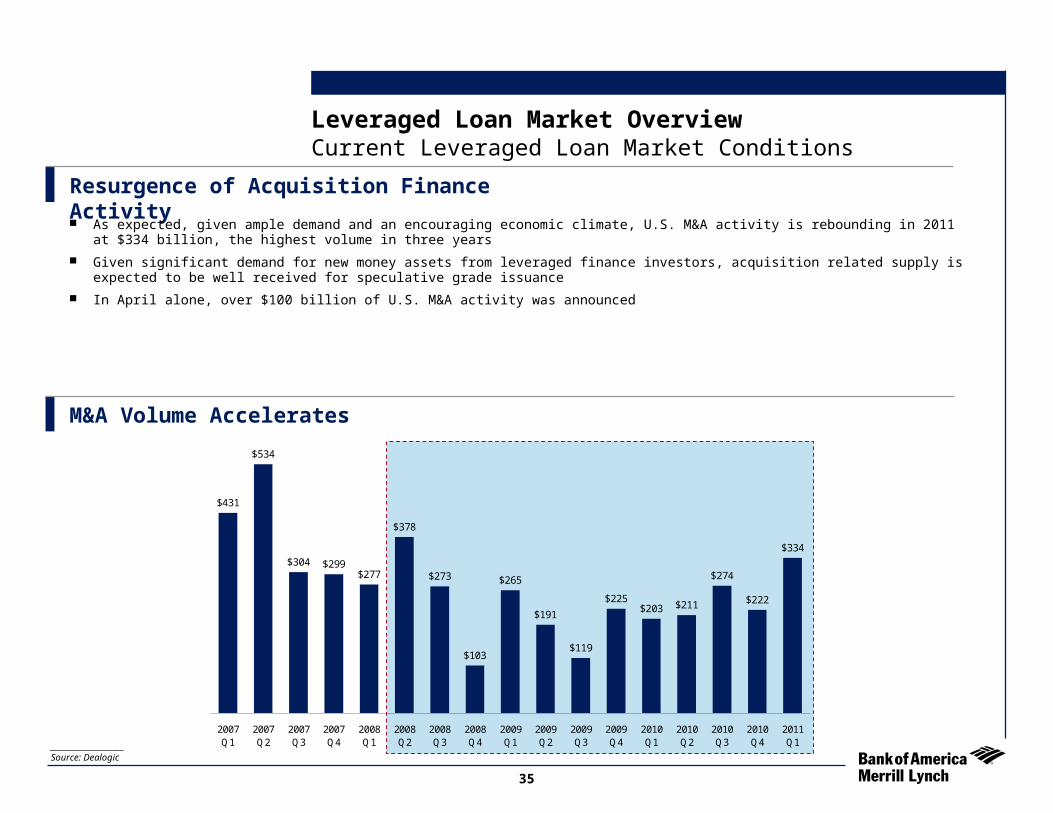
Resurgence of Acquisition Finance Activity As expected, given ample demand and an encouraging economic climate, U.S. M&A activity is rebounding in 2011 at $334 billion,
the highest volume in three years
Given significant demand for new money assets from leveraged finance investors, acquisition related supply is expected to be well received for speculative grade issuance
In April alone, over $100 billion of U.S. M&A activity was announced
Current Leveraged Loan Market Conditions
M&A Volume Accelerates
$431
$534
$304 $299$277
$378
$273
$103
$265
$191
$119
$225$203 $211
$274
$222
$334
2007Q1
2007Q2
2007Q3
2007Q4
2008Q1
2008Q2
2008Q3
2008Q4
2009Q1
2009Q2
2009Q3
2009Q4
2010Q1
2010Q2
2010Q3
2010Q4
2011Q1____________________
Source: Dealogic
Leveraged Loan Market Overview
35

Strong Secondary Market
Current Leveraged Loan Market ConditionsLeveraged Loan Market Overview
____________________Source: S&P/LCD
95.59
428 bps
90
97
May-11Mar-11Jan-11Nov-10
410
540
LSTA 100 Bid LSTA 100 STM
36

Forward Calendar Builds
Current Leveraged Loan Market ConditionsLeveraged Loan Market Overview
____________________Source: S&P/LCD
$41$41$40$41$39
$29
$23$22
$16
$25
$51
$31
$25
18-May4-May20-Apr6-Apr23-Mar9-Mar23-Feb
($ Bn)
37
Capital MarketsHigh YieldMezzanine
High Yield Market
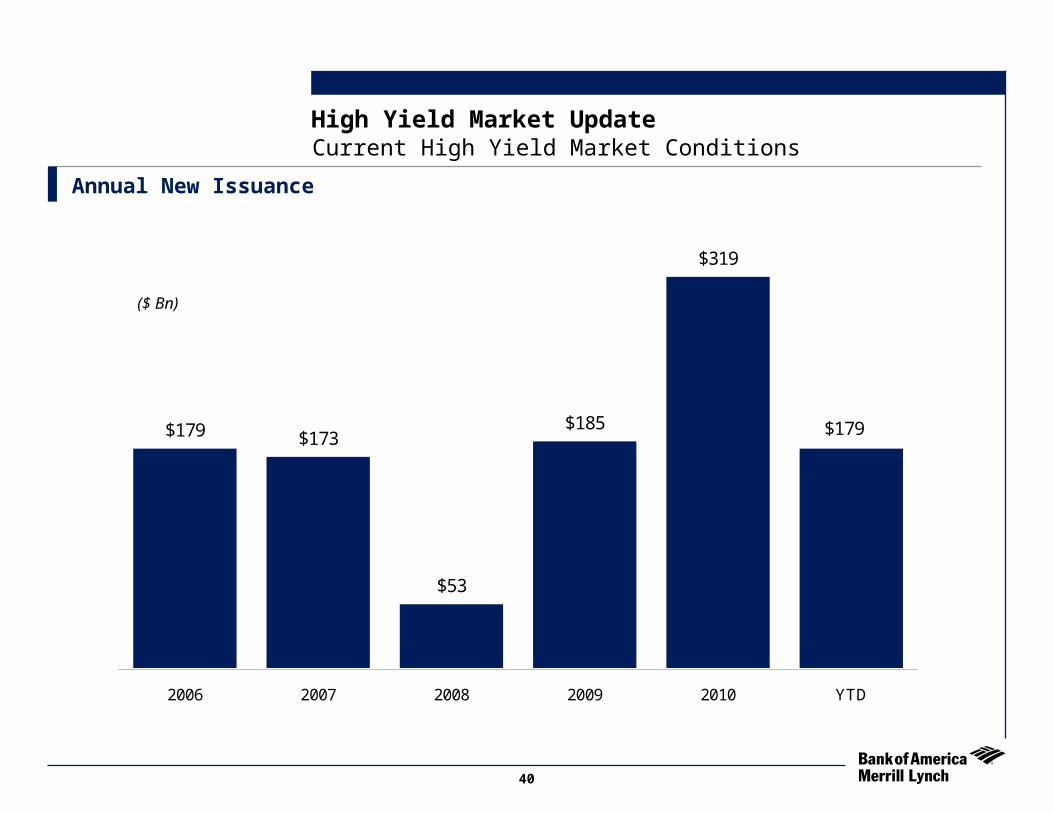
Current High Yield Market ConditionsHigh Yield Market Update
Annual New Issuance
$179 $173
$53
$185
$319
$179
2006 2007 2008 2009 2010 YTD
40
($ Bn)

New Issue Volume at Record Breaking Pace in 2011
Current High Yield Bond Market ConditionsHigh Yield Market Update
____________________Source: S&P/LCD.
Historical Market Perspective
$17.8
$10.2
$40.9 $38.9 $38.9
$49.1
$37.9$34.0
$22.8$25.9
$18.5$22.2 $22.1
$27.1
$19.3$22.6
$15.1
$35.3
$7.7 $9.7
$20.2$24.8
$39.0
$23.7
$35.5
May-09
Jun-09
Jul-09
Aug-09
Sep-09
Oct-09
Nov-09
Dec-09
Jan-10
Feb-10
Mar-10
Apr-10
May-10
Jun-10
Jul-10
Aug-10
Sep-10
Oct-10
Nov-10
Dec-10
Jan-11
Feb-11
Mar-11
Apr-11
May-11
Year-to-Date: $179.3 BnYear-to-Date: $179.3 Bn
$13
$83$61
$115
$179$157$140
$43 $67$37 $43 $60
$101$138
$101
$48
$173
$53
$185
$319
$179
1991
1992
1993
1994
1995
1996
1997
1998
1999
2000
2001
2002
2003
2004
2005
2006
2007
2008
2009
2010
2011
YT
D
41
($ Bn)
($ Bn)

Current High Yield Market ConditionsHigh Yield Market Update
High Yield Mutual Funds Flow
($186)
$1,037
($471)
$1,290
$375
$739
$439
($1,154)
$492
$967
$196$403
$1,037
$315$421
$510
($87)
$373$574
$131
($4)
$466
$743
$234
($677)
$358
Nov-10 Dec-10 Jan-11 Feb-11 Mar-11 Apr-11 May-11
HY Weekly Flows 3 Week Moving Average
42
($ MM)

Refinancing Activity Continues to Dominate
Structures and Uses of Proceeds have Evolved Since the Credit Crisis
High Yield Market Update
35%
20%25%
45%
57%
61%
43%
52%42%
39%27%33%
33%
23%
23%
24%
15% 19%
29%
31%
37%29%
15%
15%
13%
8%
16%
75%
75%
36%
17%
16%
0
55
110
Q4-07 Q1-08 Q2-08 Q3-08 Q4-08 Q1-09 Q2-09 Q3-09 Q4-09 Q1-10 Q2-10 Q3-10 Q4-10 Q1-11 Q2-11
Vol
ume
($ B
illio
ns)
20,000
40,000
60,000
$80,000
Q1 2007 Q2 2007 Q3 2007 Q4 2007 Q1 2008 Q2 2008 Q3 2008 Q4 2008 Q1 2009 Q2 2009 Q3 2009 Q4 - YTD2009
Bank Refi Bond Redemptions GCP Cap Ex M&A Dividend
42%
57%
17%
2007
2008 2009 2010 2011
43

Refinancing Activity Continues to Dominate
Current High Yield Bond Market ConditionsHigh Yield Market Update
____________________Source: S&P/LCD.
Use of HY Proceeds – 2011 YTD
Bank Refi34%
M&A16%
Dividend7%
Cap Ex2%
GCP15%
Bond Redemptions
26%
44
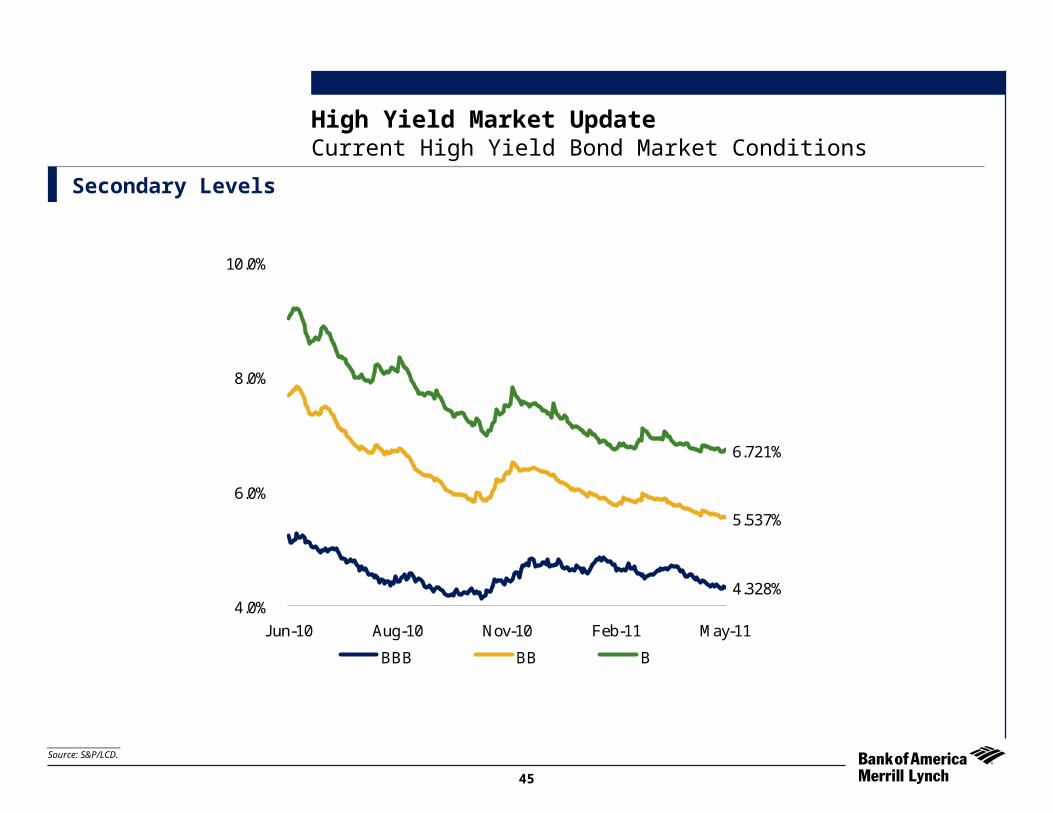
Secondary Levels
Current High Yield Bond Market ConditionsHigh Yield Market Update
____________________Source: S&P/LCD.
4.328%
5.537%
6.721%
4.0%
6.0%
8.0%
10.0%
Jun-10 Aug-10 Nov-10 Feb-11 May-11
BBB BB B
45
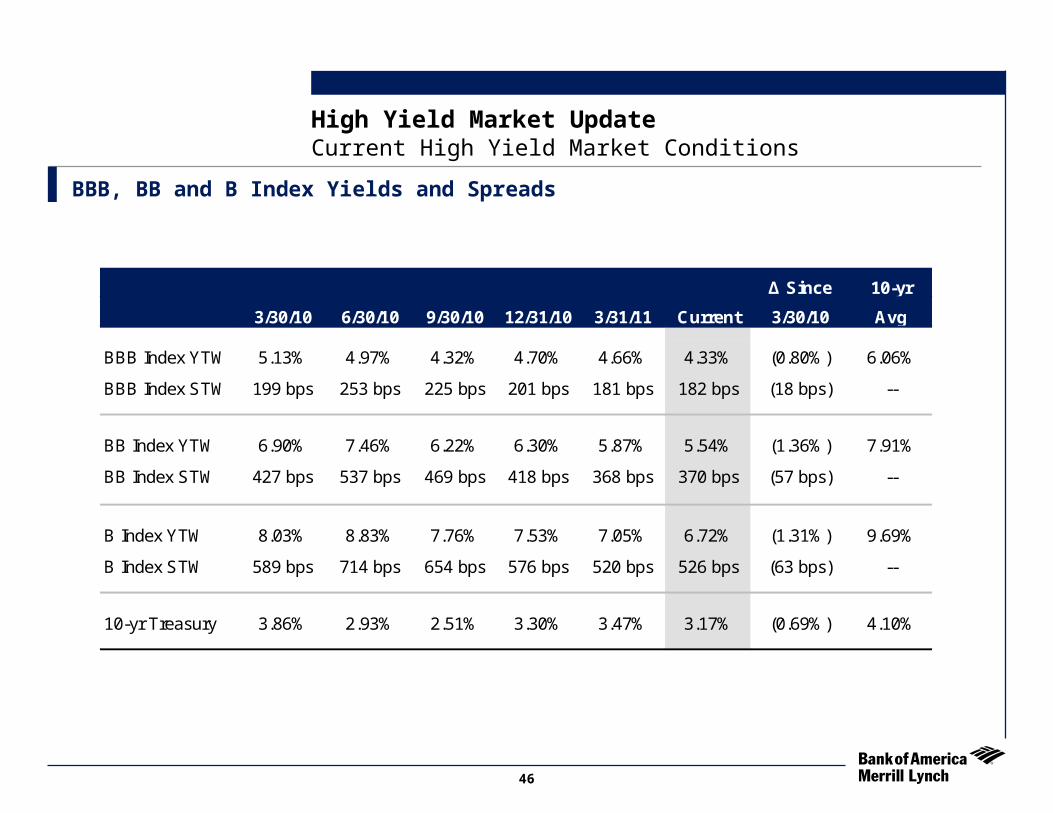
High Yield Market UpdateCurrent High Yield Market Conditions
BBB, BB and B Index Yields and Spreads
Δ Since 10-yr
3/30/10 6/30/10 9/30/10 12/31/10 3/31/11 Current 3/30/10 Avg
BBB Index YTW 5.13% 4.97% 4.32% 4.70% 4.66% 4.33% (0.80%) 6.06%
BBB Index STW 199 bps 253 bps 225 bps 201 bps 181 bps 182 bps (18 bps) --
BB Index YTW 6.90% 7.46% 6.22% 6.30% 5.87% 5.54% (1.36%) 7.91%
BB Index STW 427 bps 537 bps 469 bps 418 bps 368 bps 370 bps (57 bps) --
B Index YTW 8.03% 8.83% 7.76% 7.53% 7.05% 6.72% (1.31%) 9.69%
B Index STW 589 bps 714 bps 654 bps 576 bps 520 bps 526 bps (63 bps) --
10-yr Treasury 3.86% 2.93% 2.51% 3.30% 3.47% 3.17% (0.69%) 4.10%
46

Mezzanine

Creates financial flexibility by increasing senior debt capacity and preserving bank facilities for future needs
Adds a layer of long-term capital which will be viewed by banking institutions as equity-like capital
Creates minimal equity dilution, when compared to an equity offering
Mezzanine Capital Benefits
Typical Issuer Profile
Mezzanine
EBITDAEBITDA Generally $5 million or greater
Typical LeverageTypical Leverage Total Debt : EBITDA less than 4.0x to 4.5x
SituationsSituations Expansion / growth capital
Acquisition capital
Buy-out / ownership change
Restructuring / recapitalization
48

Typical Offering Parameters
Mezzanine
CompaniesCompanies
IssueIssue Subordinated debt
Security InterestSecurity Interest Typically Unsecured
Occasionally requires second lien
MaturityMaturity Typically 6 – 8 Years
PricingPricing 12-14% cash pay coupon
1-2% payment in kind
Issue SizeIssue Size > $5MM
WarrantsWarrants Generally required
49

Typical Offering Parameters
Mezzanine
Financial CovenantsFinancial Covenants Typically maintenance based (coverages)
Generally more lenient than senior debt
RatingsRatings Credit ratings are not required to complete a financing
RedemptionRedemption Optional Redemption: At anytime with scaling premium
Mandatory Redemption: Usually bullet maturities, sometimes amortizing
Target ReturnsTarget Returns 15-17% (including Warrants)
Board SeatBoard Seat Negotiable
Observation rights
50

“Bank of America Merrill Lynch” is the marketing name for the global banking and global markets businesses of Bank of America Corporation. Lending, derivatives, and other commercial banking activities are performed globally by banking affiliates of Bank of America Corporation, including Bank of America, N.A., member FDIC. Securities, strategic advisory, and other investment banking activities are performed globally by investment banking affiliates of Bank of America Corporation (“Investment Banking Affiliates”), including, in the United States, Merrill Lynch, Pierce, Fenner & Smith Incorporated and Merrill Lynch Professional Clearing Corp., all of which are registered broker dealers and members of FINRA and SIPC, and, in other jurisdictions, by locally registered entities.
Investment products offered by Investment Banking Affiliates: Are Not FDIC Insured * May Lose Value * Are Not Bank Guaranteed.
These materials have been prepared by one or more subsidiaries of Bank of America Corporation for the client or potential client to whom such materials are directly addressed and delivered (the "Company") in connection with an actual or potential mandate or engagement and may not be used or relied upon for any purpose other than as specifically contemplated by a written agreement with us. These materials are based on information provided by or on behalf of the Company and/or other potential transaction participants, from public sources or otherwise reviewed by us. We assume no responsibility for independent investigation or verification of such information (including, without limitation, data from third party suppliers) and have relied on such information being complete and accurate in all material respects. To the extent such information includes estimates and forecasts of future financial performance prepared by or reviewed with the managements of the Company and/or other potential transaction participants or obtained from public sources, we have assumed that such estimates and forecasts have been reasonably prepared on bases reflecting the best currently available estimates and judgments of such managements (or, with respect to estimates and forecasts obtained from public sources, represent reasonable estimates). No representation or warranty, express or implied, is made as to the accuracy or completeness of such information and nothing contained herein is, or shall be relied upon as, a representation, whether as to the past, the present or the future. These materials were designed for use by specific persons familiar with the business and affairs of the Company and are being furnished and should be considered only in connection with other information, oral or written, being provided by us in connection herewith. These materials are not intended to provide the sole basis for evaluating, and should not be considered a recommendation with respect to, any transaction or other matter. These materials do not constitute an offer or solicitation to sell or purchase any securities and are not a commitment by Bank of America Corporation or any of its affiliates to provide or arrange any financing for any transaction or to purchase any security in connection therewith. These materials are for discussion purposes only and are subject to our review and assessment from a legal, compliance, accounting policy and risk perspective, as appropriate, following our discussion with the Company. We assume no obligation to update or otherwise revise these materials. These materials have not been prepared with a view toward public disclosure under applicable securities laws or otherwise, are intended for the benefit and use of the Company, and may not be reproduced, disseminated, quoted or referred to, in whole or in part, without our prior written consent. These materials may not reflect information known to other professionals in other business areas of Bank of America Corporation and its affiliates.
Bank of America Corporation and its affiliates (collectively, the "BAC Group") comprise a full service securities firm and commercial bank engaged in securities, commodities and derivatives trading, foreign exchange and other brokerage activities, and principal investing as well as providing investment, corporate and private banking, asset and investment management, financing and strategic advisory services and other commercial services and products to a wide range of corporations, governments and individuals, domestically and offshore, from which conflicting interests or duties, or a perception thereof, may arise. In the ordinary course of these activities, parts of the BAC Group at any time may invest on a principal basis or manage funds that invest, make or hold long or short positions, finance positions or trade or otherwise effect transactions, for their own accounts or the accounts of customers, in debt, equity or other securities or financial instruments (including derivatives, bank loans or other obligations) of the Company, potential counterparties or any other company that may be involved in a transaction. Products and services that may be referenced in the accompanying materials may be provided through one or more affiliates of Bank of America Corporation. We have adopted policies and guidelines designed to preserve the independence of our research analysts. These policies prohibit employees from offering research coverage, a favorable research rating or a specific price target or offering to change a research rating or price target as consideration for or an inducement to obtain business or other compensation. We are required to obtain, verify and record certain information that identifies the Company, which information includes the name and address of the Company and other information that will allow us to identify the Company in accordance, as applicable, with the USA Patriot Act (Title III of Pub. L. 107-56 (signed into law October 26, 2001)) and such other laws, rules and regulations as applicable within and outside the United States.
We do not provide legal, compliance, tax or accounting advice. Accordingly, any statements contained herein as to tax matters were neither written nor intended by us to be used and cannot be used by any taxpayer for the purpose of avoiding tax penalties that may be imposed on such taxpayer. If any person uses or refers to any such tax statement in promoting, marketing or recommending a partnership or other entity, investment plan or arrangement to any taxpayer, then the statement expressed herein is being delivered to support the promotion or marketing of the transaction or matter addressed and the recipient should seek advice based on its particular circumstances from an independent tax advisor. Notwithstanding anything that may appear herein or in other materials to the contrary, the Company shall be permitted to disclose the tax treatment and tax structure of a transaction (including any materials, opinions or analyses relating to such tax treatment or tax structure, but without disclosure of identifying information or, except to the extent relating to such tax structure or tax treatment, any nonpublic commercial or financial information) on and after the earliest to occur of the date of (i) public announcement of discussions relating to such transaction, (ii) public announcement of such transaction or (iii) execution of a definitive agreement (with or without conditions) to enter into such transaction; provided, however, that if such transaction is not consummated for any reason, the provisions of this sentence shall cease to apply. ©2011 Bank of America Corporation.
Notice to RecipientConfidential
51


