
Economic outlook for the West of
England LEP
Prepared for the
West of England LEP
September 2015

Contents
2
Introduction
Oxford Economics were commissioned by the West of England LEP to produce sector-based employment and GVA
forecasts and scenario analysis for the West of England LEP, four constituent local authorities, South West and UK. This
report provides a summary of these forecasts, and is accompanied by a detailed database of economic, labour market and
demographic variables for each location.
This report has 4 sections:
1. An overview of the current performance and outlook for the UK economy. This provides the context within which the
West of England LEP economy will be operating over the medium to long term;
2. The current demographic and labour market structure of the South West economy, and the outlook to 2036;
3. The current demographic and labour market structure of the local authorities within the West of England LEP economy,
and the outlook to 2036;
4. The current demographic and labour market structure of the West of England LEP economy, and the outlook to 2036;
5. An overview of the scenario assumptions and key results.
The annex to this report provides a technical section setting out data sources and assumptions.
Please contact Oxford Economics for further information:
Kerry Houston [email protected]
Niall Dowds [email protected]

The macroeconomic context

Global environment
A key area for concern is the slowdown in China.
The recent sharp sell-off in equities has increased
concerns about financial stability and growth. And
with the rally before the crash having been so debt-
fuelled there are real risks to consumption and
investment.
Estimates for 2015 suggest Emerging Markets are
forecast to have their worst year since 2001
(excluding 2009), mainly impacted by the strong
dollar. Falling commodity prices, slowing capital
inflows and rising debt burdens in these economies
skew risk growth forecasts downward.
The global economic recovery is firming but the outlook is uncertain; with positive outlooks for the US, UK and
Europe: whilst greater downside risks loom for emerging markets and China . The US emerges as a driver of global
growth, with strong economic momentum underpinned by consumer spending and confidence. Solid growth in
business activity and a buoyant labour market have also helped to support firm growth. Fuelling global growth, the
US will face the threats of a Greek exit which still linger, a slowdown in the Chinese economy and a strong dollar.
The Eurozone emerged again from recession in 2014, as uncertainty started to ease from the continent. Despite the
shock of the Greek crisis, growth will accelerate in 2015 supported by weak oil prices. The pace of the recovery will
remain weak, with Greek insecurity, fiscal tightening and unemployment remaining high. But as the recovery
broadens growth will rise slightly in the medium term.
4
2014 2015 2016 2015-2019 2015-2036
US 2.4 2.3 2.8 2.7 2.5
Japan -0.1 1.0 1.8 1.0 0.7
China 7.4 6.6 6.1 5.9 4.8
Eurozone 0.9 1.5 1.8 1.6 1.3
Germany 1.6 1.9 2.1 1.6 0.9
France 0.2 1.3 1.6 1.5 1.5
Italy -0.4 0.5 1.0 0.9 0.7
Ireland 4.8 3.7 3.8 3.2 2.7
Greece 0.7 -0.7 -0.2 1.0 2.0
Spain 1.4 3.2 2.7 2.5 1.6
UK 3.0 2.6 2.8 2.5 2.3
Brazil 0.1 -1.6 0.3 1.0 2.0
OPEC 2.5 2.0 3.3 3.7 3.7
Source: Oxford Economics
Annual average GDP growth (%)

UK: Growth remaining firm
Following a strong GVA outturn of 3.0% in 2014, we expect the
UK’s pace of growth to ease to 2.6% in 2015 before rebounding
to 3.0% in 2016. The data at the start of this year was
surprisingly soft. Expansion in Q1 was distinctly two-speed, with
a strong performance by the service sector limited by a fall in
manufacturing output, and export demand sapped by the strong
pound.
The preliminary estimate for Q2 is positive with growth
rebounding on the back of stronger business surveys and other
economic indicators. The pick up in Q2 highlights the imbalance
in the economy, a strong performance in the service sector
contrasted with a weak construction and manufacturing data.
After ten consecutive periods of quarterly growth, GDP per head
is estimated to have approximately returned to the pre-crisis
peak. Admittedly, this is a reassuring milestone but it means
living standards are only what they once were seven years ago.
Further out we expect the ‘Summer Budget’ to impact on growth,
with the cutting of in-work benefits weakening consumer
spending. The introduction of a compulsory ‘living-wage’ in 2020
is estimated by the Office for Budget Responsibility (OBR) to
have a moderate impact on employment, but this is highly
uncertain, as firms may respond to higher wages by cutting jobs.
5
-0.6
-0.4
-0.2
0.0
0.2
0.4
0.6
0.8
1.0
1.2
2010 2011 2012 2013 2014 2015
Services Construction Production
UK: Contributions to quarterly GDP growth%pts
Source : Oxford Economics/Haver Analytics
-6
-4
-2
0
2
4
6
2004 2006 2008 2010 2012 2014 2016 2018
% year
Consumer spending
Real disposableincome
Source: Oxford Economics
Forecast
UK: Consumer spending and income

UK: Drivers of growth
Rising household spending in the short-run – CPI inflation is expected to remain broadly flat until latter this year,
when it is expected to approach 1% by the end of the year. Underlying price pressure is expected to remain modest and
we forecast inflation remaining well below the 2% target through 2016. When combined with stronger wage growth, as a
result of a tightening labour market, it should deliver a substantial boost to household spending power. We expect real
consumer spending grow by 3.3% in 2015, easing to 2.8% in 2016. In the medium term beyond 2017 we expect
consumer spending to weaken as the effects of the recent ‘Summer Budget’ take hold. As the deep cuts to in-work
benefits are introduced, the impact will more than offset the boost from the new ‘living wage’, subduing growth in
household incomes.
Strong corporate finances supporting investment – Strong corporate finances have allowed firms to remain
confident, with business investment unaffected by uncertainty surrounding the general election and the Greece bailout.
UK corporate finances are in a secure position, with profitability at their highest levels since the 1990s and cash
reserves are at record levels. The future outlook for business investment remains positive with business surveys
reporting strong investment plans. We expect business investment growth of 5.3% in 2015 and 6.1% in 2016.
Sustained strength in house building – Despite a cooling in the housing market, residential investment grew by 9.6%
in the year to Q1 2015. The existence of government support programmes, such as ‘Help to Buy’ and ‘Shared equity
schemes’, have given builders ample confidence to continue development. This will provide direct support to the
economy, supporting employment and GVA growth, while also alleviating any potential supply side constraints, keeping
house prices in check.
Further austerity –A combination of welfare cuts, tax rises and a slower pace of fiscal consolidation, has allowed the
Chancellor to smooth out the departmental spending ‘rollercoaster’. The planned path of government spending is slightly
higher over the next five years than we had previously anticipated, though fiscal policy will remain a drag on growth.
6

UK: Drivers of growth
Subdued export outlook – Survey data suggest that the 10%
appreciation of sterling against the euro since the start of 2015
has driven a weakening in export order books. Our forecasts
assume that both the US and Eurozone economies strengthen
over the coming two years, providing some support to UK
exports, but we do not expect net trade to make any
meaningful contribution to GDP growth in the short-term.
Low inflation - Our forecast continues to assume that the first
rate hike comes in Q1 2016, as the majority of the MPC are
unlikely to move until inflation has moved decisively away from
zero and the situation in Greece has become clearer.
Subsequent tightening is assumed to come at the very
measured pace of 50bps per year.
Longer-term growth will be underpinned by:
Helpful demographics – the UK is expected to see its
working-age population continue to expand strongly, driven by
natural increases, persistent net inward migration and further
rises in the state pension age.
Leading position in several service sectors – the UK
economy has strong representation in dynamic private
services sectors and is a global leader in the provision of
several parts of financial and business services.
7
0
1
2
3
4
5
6
2004 2006 2008 2010 2012 2014 2016 2018
UK: Interest rates%
Source : Oxford Economics
Bank Rate
10-year gilt yield
Forecast
-16
-12
-8
-4
0
4
8
12
16
2004 2006 2008 2010 2012 2014 2016 2018
World trade Exports (non-fuel goods)
Source: Oxford Economics
Forecast
UK: Exports & world trade
% year

UK: Employment sectoral outlook
UK employment is forecast to rise by an
additional 3.2million jobs by 2036, equivalent to
average annual growth of 0.5%. Employment
growth will be strongest over the next few years
before easing into the longer-term.
Providing the largest absolute increase in jobs
over the forecast period to 2036 are professional
services (890,000 jobs), administration & support
(800,000 jobs) and construction (540,000 jobs).
The majority of sectors are expected to see
employment rise over this period, including the
relatively small but rapidly growing information &
communications sector.
Job shedding will be experienced in a small
number of sectors over the forecast period. The
most significant reduction in absolute terms is
expected in the manufacturing sector, where
more than 630,000 jobs are forecast to be lost
across the UK by 2036.
Austerity measures to be implemented over the next parliament by the Conservative government will lead to job losses
in the public sector. Cuts are expected in public administration and education, with the greatest impact to be felt early in
our forecast period. We forecast stable employment growth in the healthcare sector as political pressure to ‘ring-fence’
front line services will save jobs.
8
000sAnnual
Avg (%)000s
Annual
Avg (%)
Agriculture, forestry and fishing -33 -1.6 -43 -1.0
Mining and quarrying -19 -2.3 -16 -3.4
Manufacturing -285 -1.0 -350 -1.4
Electricity, gas, steam -15 -1.0 -17 -1.5
Water supply; sewerage -13 -0.6 -17 -0.9
Construction 276 1.4 263 1.0
Wholesale and retail trade 204 0.6 72 0.1
Transportation and storage 108 0.7 -7 0.0
Accommodation and food service 147 0.9 59 0.2
Information and communication 176 1.4 109 0.6
Financial and insurance activities -9 0.0 10 0.1
Real estate activities 82 1.4 67 0.9
Professional, scientific and technical 494 2.0 399 1.0
Administrative and support services 468 1.9 331 0.9
Public administration and defence -149 -1.3 -45 -0.3
Education 3 0.1 36 0.1
Human health and social work 199 0.5 257 0.5
Arts, entertainment and recreation 147 1.6 124 1.0
Other service activities 115 1.2 84 0.7
Total 1,895 0.7 1,317 0.3
Source: Oxford Economics
2015-2025 2025-2036

UK: risks to the outlook
There are a number of risks which would impact on our forecast outlook for the UK economy. These include:
Austerity – though the ‘Summer Budget’ eased the pace of austerity a little, the government is still planning to tighten
policy significantly over the period to 2020, with unprotected government departments having been asked to plan for
real terms spending cuts of 25% and 40%. There is a risk that this retrenchment causes GDP growth to slow sharply,
particularly if monetary policy is tightened too aggressively or external demand softens.
Labour market – our forecast assumes that the recovery in activity will be accompanied by a rebound in productivity,
offsetting some of the productivity losses of the past five years. Were the productivity response to be weaker, we would
see stronger employment growth and, potentially, a pick-up in wage pressures in the short term as firms face skills
shortages. However, it would imply weaker prospects for growth over the medium-term.
Housing bubble – with house price growth having cooled in H1 2015, concerns about a housing bubble have receded.
However, a bubble could still develop if demand rebounds strongly and the supply response disappoints.
‘Grexit’ - Miraculously a Greek bailout was agreed and conditions approved by the Greek parliament. But the threat of
‘Grexit’ remains. An exit from the single currency would elevate financial stress across member states as contagion risk
gripped the Eurozone. The resultant slowdown would severely impact on the UK’s economic growth prospects.
US and Eurozone upside surprise - further falls in oil prices could amplify the effects of an upside surprise in the US
and Eurozone economies. The combination of stronger demand from our main trading partners and low inflation
boosting the purchasing power of domestic consumers could be particularly potent for the UK and lead GDP growth to
accelerate towards 4% in 2016-17.
The probability of each of these shocks is relatively low, but each would have put a significant effect on our UK outlook.
Under any scenario where the headline UK growth figure was skewed from the baseline outlook, there would be a notable
impact on the South West region and the West of England LEP.
9

South West
This section summarises the outlook for the South West region, focusing on demographic and labour market
developments, including comparisons with the UK economy.
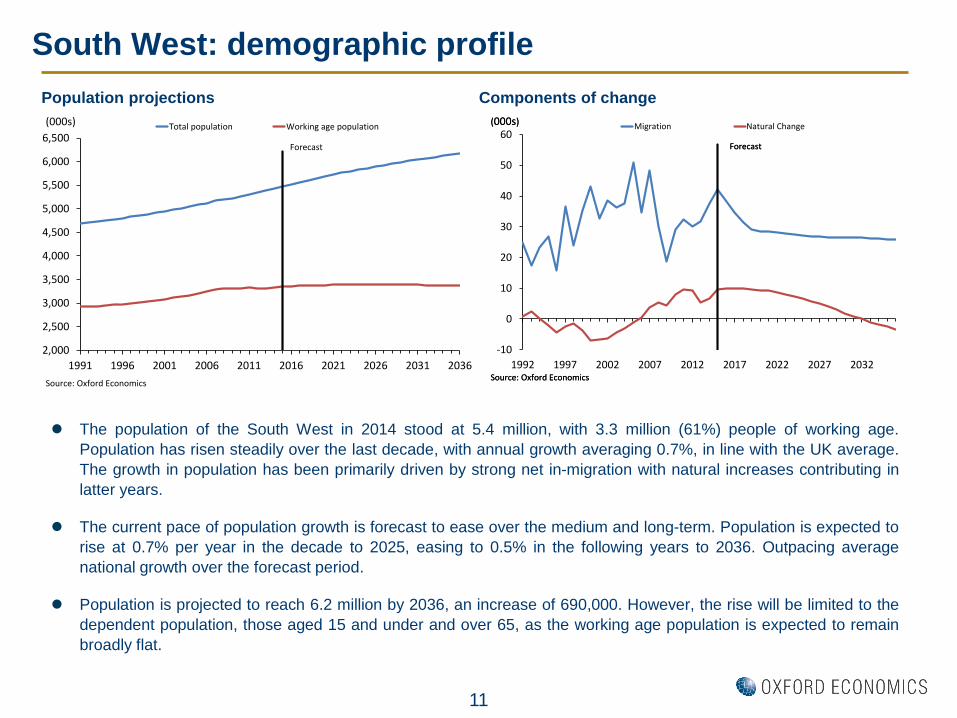
South West: demographic profile
The population of the South West in 2014 stood at 5.4 million, with 3.3 million (61%) people of working age.
Population has risen steadily over the last decade, with annual growth averaging 0.7%, in line with the UK average.
The growth in population has been primarily driven by strong net in-migration with natural increases contributing in
latter years.
The current pace of population growth is forecast to ease over the medium and long-term. Population is expected to
rise at 0.7% per year in the decade to 2025, easing to 0.5% in the following years to 2036. Outpacing average
national growth over the forecast period.
Population is projected to reach 6.2 million by 2036, an increase of 690,000. However, the rise will be limited to the
dependent population, those aged 15 and under and over 65, as the working age population is expected to remain
broadly flat.
Population projections Components of change
11
2,000
2,500
3,000
3,500
4,000
4,500
5,000
5,500
6,000
6,500
1991 1996 2001 2006 2011 2016 2021 2026 2031 2036
Total population Working age population
Source: Oxford Economics
Forecast
(000s)
-10
0
10
20
30
40
50
60
1992 1997 2002 2007 2012 2017 2022 2027 2032
Migration Natural Change
Source: Oxford Economics
Forecast
(000s)
Source: Oxford Economics
Forecast
(000s)

South West: current structure
Total employment in the South West in 2014 was 2,839,000. Services are the dominant employers in the region,
providing 81% of jobs, marginally below the UK’s breakdown of 83%. The largest sectors in the region are wholesale &
retail, healthcare and education, employing 410,000 (14.5%), 390,000 (13.8%) and 239,000 (8.4%) people respectively.
Relative to the UK, the South West has a high concentration of jobs in accommodation & food, healthcare and
construction. Administration & support and professional services are under-represented in the South West relative to
the UK. The region’s large exposure to the public administration sector, and low relative concentration in administration
& support and professional services, will constrain growth over the forecast period.
Employment structure: South West v UK, 2014 Key indicators: 2014
12
-2.0 -1.0 0.0 1.0 2.0
Accommodation and foodHealthcare
ConstructionPublic admin & defence
Agriculture, forestry and fishingManufacturing
Real estateOther service s
Water supply; sewerageFinancial and insurance
Electricity, gas, steamMining and quarrying
Wholesale & retail tradeArts and entertainment
EducationInformation & communication
Transportation & storageProfessional, scientific &technicalAdministrative & support service
Source: Oxford Economics
UK more dependent
South West more dependent
Percentage point difference
South West UK
Population (000s) 5,423 64,597
Population aged 16-64 (000s) 3,328 41,037
Net migration (000s) 37.5 260.0
Employment (000s) 2,839 33,330
GVA (£m, 2011) 110,389 1,458,027
Consumer expenditure (£m, 2011) 95,685 1,035,160
Resident employment rate (%) 59.8 59.7
Unemployment rate (%) 1.8 3.0
Productivity (£000s/job) 38.9 43.7
Source: Oxford Economics

South West: outlook
The South West has had a historically strong
labour market. Employment growth averaged
1.2% in the years preceding the crisis, ahead of
the UK average of 1.0%. The impact of the
crisis was significant in the South West but
limited in a UK context. Employment growth
weakened since 2008, halving to 0.6% per year,
on par with the UK average. Whilst the South
West’s labour market recovery has been quite
strong relative to other regions, the robust and
sustained rebound of London job market has
driven up the UK average overall.
Total employment in the South West is estimated to increase by 31,000 additional jobs in 2015, equivalent to
growth of 1.1%, this will lag UK growth of 1.4% in the year. Growth will slow in the South West and UK in 2016 to
0.7% and 0.9% respectively. The pace of employment growth will slow in the South West from current rates over
the forecast period. Rising by 0.5% per year in the period to 2025, then slowing to 0.3% in the years 2025 to 2036.
Total jobs in the region are forecast to reach almost 3.1million by 2036, an increase of 210,000 on current levels.
Working age population remaining flat will place a drag on labour market growth in the years ahead, as historically
low unemployment rates restrict the ability of increased labour market participation.
GVA in the South West increased by 2.9% in 2014, its largest expansion since 2007. The pace of acceleration is
expected to ease in the coming years but remain robust, rising by 2.3% in 2015, and 2.7% in 2016.Looking over
the forecast period we see that GVA growth in the South rest will remain solid, however it is expected to
consistently underperform the UK average. The pace of economic growth is forecast to be higher in the coming
decade to 2025, rising on average by 2.5% per year, followed by 2.1% per year thereafter.
Employment performance
13
90
95
100
105
110
115
120
125
130
2000 2005 2010 2015 2020 2025 2030 2035
South West UK
Source: Oxford Economics
Forecast
(Index 2000=100)

South West: sector outlook
Sectorally, construction and professional services are
expected to underpin employment growth over the
forecast period, each adding approximately 50,000
additional jobs. Healthcare and administration & support
will also contribute significantly to job creation, adding
46,000 and 40,000 jobs respectively.
Production industries are expected to experience job
shedding in the period ahead to 2036. The largest
declines are in the manufacturing sector, with the loss of
57,000 jobs predicted by 2036. The fall in employment
is expected due to productivity gains.
Education and public administration are forecast to face
job losses in the years leading to 2020, as the new
government’s austerity policy reduces public sector
spending. Cuts will be deepest in public administration,
with the sector not expected to recover over the forecast
period. However, employment in healthcare is expected
to rise in the period 2015-2036, due to increased
demand owing to the growing elderly population.
Economic activity will be lead by professional services,
with growth expected to average 3.6%. Information &
communications and administration & support are also
forecast to experience high growth rates, rising at 3.5%
and 3.2% per year respectively.
Employment outlook
14
Level
000s 000s 000s
Agriculture, forestry and fishing 55 44 -11 -1.3
Mining and quarrying 4 2 -2 -2.9
Manufacturing 241 183 -57 -1.2
Electricity, gas, steam 9 7 -2 -1.3
Water supply; sewerage 16 14 -2 -0.7
Construction 209 259 50 1.1
Wholesale and retail trade 417 438 21 0.3
Transportation and storage 101 113 12 0.6
Accommodation and food service 238 253 16 0.4
Information and communication 82 92 10 0.6
Financial and insurance activities 95 95 0 0.1
Real estate activities 62 77 15 1.0
Professional, scientific and technical 208 257 49 1.1
Administrative and support services 188 228 40 1.0
Public administration and defence 148 134 -14 -0.5
Education 241 243 3 0.1
Human health and social work 393 439 46 0.5
Arts, entertainment and recreation 78 98 20 1.1
Other service activities 85 103 17 0.9
Total 2,870 3,081 211 0.4
Source: Oxford Economics
20362015Annual
Avg (%)
Change

West of England LEP
This section summarises the outlook for the West of England LEP, focusing on demographic and labour market
developments.

West of England LEP: demographic profile
The population of West of England LEP is currently 1.1 million, accounting for one fifth of the total population in the
South West. The working age population of the LEP stands at 712,000, 64.5% of the total population. Population
growth in the last decade has averaged 0.9%, marginally ahead of the South West and the UK. The LEP has
benefited from strong levels of net inward migration in the past decade, mirroring trends across the South West. The
natural change in population also continued to make a positive contribution to growth.
Population growth is expected to continue at a similar pace, rising by 1.0% in 2015 and 0.9% in 2016. The pace of
population growth is forecast to ease over the medium and long-term. With growth expected to average 0.6% - a
similar rate as the South West. Net migration is expected to be weaker over the forecast, than recently, averaging
2,600 people per year. This reflects a general reduction in net migration into the UK as the one off influence of the
EU enlargement fades and economic growth on the continent improves.
Population projections Components of change
16
500
600
700
800
900
1,000
1,100
1,200
1,300
1991 1996 2001 2006 2011 2016 2021 2026 2031 2036
Total population Working age population
Source: Oxford Economics
Forecast
(000s)
-2
0
2
4
6
8
10
12
14
1992 1997 2002 2007 2012 2017 2022 2027 2032
Migration Natural Change
Source: Oxford Economics
Forecast
(000s)

West of England LEP: current structure
In 2014, 634,000 people were employed in the West of England LEP region. At the same time, 544,000 people living in
the LEP were in employment, signifying net-in commuting to the region. 13,000 residents where registered on the
claimant count measure, equivalent to 1.8%. This is in line with the South West and compares favourably to the national
average.
Services play a dominant role in the West of England, providing 86% of jobs, above the South and UK averages of 81%
and 83% respectively. Healthcare and wholesale & retail contribute the greatest number of jobs to the LEP, employing
89,000 (14.0%) and 86,000 (13.5%) workers respectively, following the trend across the South West. Also providing a
large minority of jobs are professional services and education, employing 58,000 (9.1%) and 57,000 (9.0%) of jobs.
In comparison to the South West, the LEP has a high concentration of jobs in professional services, administration &
support and financial services. Whereas manufacturing, accommodation & food, and agriculture are under-represented
in the LEP.
Employment structure: LEP vs South West, 2014 Key indicators: 2014
17
-2.0 -1.0 0.0 1.0 2.0
Professional, scientific & technicalAdministrative & support service
Financial & insuranceInformation & communication
Transportation & storageEducation
HealthcareWater supply; sewerage
Mining & quarryingReal estate
Electricity, gas, steamArts, entertainment & recreationPublic administration & defence
Other serviceConstruction
Wholesale & retail tradeAgriculture, forestry & fishing
Accommodation & food serviceManufacturing
Source: Oxford Economics
South West more dependent
LEP more dependent
Percentage point difference
West of
England LEPSouth West
Population (000s) 1,105 5,423
Population aged 16-64 (000s) 712 3,328
Net migration (000s) 6.8 37.5
Employment (000s) 634 2,839
GVA (£m, 2011) 27,930 110,389
Consumer expenditure (£m, 2011) 21,112 95,685
Resident employment rate (%) 60.2 59.8
Unemployment rate (%) 1.8 1.8
Productivity (£000s/job) 44.1 38.9
Source: Oxford Economics

West of England LEP: outlook
The West of England LEP has enjoyed strong
employment growth since 2000, despite small
declines in 2006, 2010 and 2012. The LEP had
a strong recovery from the financial crisis with
22,000 additional jobs created since 2008,
equivalent to a 0.8% average annual increase.
The pace of recovery compares favourably with
the South West and UK.
Employment grew by 3.4% in the West of
England economy in 2014, the highest pace of
growth in over a decade. Despite an increase
of 21,000 jobs in the year, the rate of growth
marginally lagged that across the South West.
Job creation in the LEP is set to continue in 2015, with employment estimated to rise by 10,000. This still represents
solid growth of 1.5%, comparing favourably to the South West (1.1%) and the UK (1.4%). In 2016 and 2017,
employment rises will ease to 0.8% and 0.6% respectively, ahead of forecasts for the South West.
The pace of employment growth in the West of England economy will slow over the long run as demographic
developments, most notably a slowdown in the growth of working age population, become less supportive of
employment growth. Nonetheless, employment in the West of England LEP is forecast to reach 697,000 by 2036, an
increase of 54,000 jobs.
The West of England economy grew by 3.3% in 2014, outperforming the South West (2.9%) and the UK (3.0%). The
pace of GVA growth is estimated to grow at 2.7% in 2015, matching UK expansion. We expect the West of England
LEP to outperform the South West over the forecast period, with average annual growth of 2.4%.
Employment performance
18
90
95
100
105
110
115
120
125
130
2000 2005 2010 2015 2020 2025 2030 2035
South West UK West of England LEP
Source: Oxford Economics
Forecast
(Index 2000=100)

West of England LEP: sector outlook
The majority of job creation in the West of England
LEP is forecast within the service sector. The greater
reliance on services, follows a regional and national
trend of increasingly services-orientated economies
that will help deliver growth. Professional services
and administration & support are expected to drive
employment growth between 2015 and 2036, adding
16,000 and 12,000 new jobs respectively. Also
construction and healthcare are forecast to
contribute significantly to employment growth,
creating an additional 9,500 and 9,100 jobs
respectively.
Production industries are forecast to constrain
employment growth in the years ahead to 2036. Job
shedding will be most significant in the
manufacturing sector, with losses numbering 9,700
between 2015 and 2036. The decline in the sector is
consistent with losses experienced in the wider
South West region.
Employment outlook
19
Public administration and education are forecast to face job losses in the years leading to 2020, as government rein in
expenditure to reduce the deficit. Public administration will face the severest losses over the medium term, which will
not be recovered over the remainder of the forecast period. Only a moderate contraction is expected in the education
sector over the next few years, with post 2020 gains reclaiming most losses.
Economic activity in the LEP will be driven by professional services, wholesale & retail, and financial services, as they
make the largest contribution to growth in the period.
Level
000s 000s 000s
Agriculture, forestry and fishing 3.4 2.7 -0.6 -1.3
Mining and quarrying 0.2 0.1 -0.1 -2.8
Manufacturing 42.2 32.5 -9.7 -1.1
Electricity, gas, steam 0.9 0.6 -0.3 -1.6
Water supply; sewerage 4.0 3.4 -0.6 -0.7
Construction 40.6 50.2 9.5 1.1
Wholesale and retail trade 87.4 89.5 2.1 0.2
Transportation and storage 26.5 29.8 3.3 0.6
Accommodation and food service 43.0 45.1 2.0 0.3
Information and communication 27.4 30.6 3.1 0.6
Financial and insurance activities 31.1 31.0 0.0 0.0
Real estate activities 13.0 16.6 3.6 1.1
Professional, scientific and technical 60.1 76.1 16.0 1.3
Administrative and support services 54.6 66.6 12.0 1.1
Public administration and defence 30.8 27.2 -3.7 -0.7
Education 57.2 57.1 -0.1 0.0
Human health and social work 88.5 97.6 9.1 0.4
Arts, entertainment and recreation 15.6 19.7 4.1 1.2
Other service activities 17.0 20.7 3.7 1.0
Total 643.6 697.1 53.5 0.4
Source: Oxford Economics
2015 2036Change
Annual
Avg (%)

West of England LEP: Local authority comparison
Bath and North
East SomersetBristol North Somerset
South
Gloucestershire
West of England
LEP
Population (000s) 13.6 52.2 20.5 26.8 113.1
Population 16-64 (000s) 9.5 43.8 6.6 12.8 72.7
Net migration (000s) 0.9 1.3 1.5 1.0 4.7
Total employment (000s) 13.3 8.3 20.3 38.0 79.8
GVA (Annual average, %) 2.2 1.4 3.3 3.6 2.3
Source: Oxford Economics
Share of West of England LEP growth (%), 2000-2014
Growth in key indicators: 2000-2014
0
5
10
15
20
25
30
35
40
45
50
Population Employment GVA
Bath and North East Somerset Bristol North Somerset South Gloucestershire(%)
Source: Oxford Economics

West of England LEP comparison: 2013 sector variation
*BRES data for Agriculture, forestry and fishing unavailable
The location quotient (LQ) for each sector is calculated as its proportion of employment relative to the same proportion at
the Great Britain (GB) level. An LQ of 1 signifies the sector has the same concentration in the region as the average in GB.
An LQ above 1 highlights a relatively high concentration of the sector in the region. An LQ below 1 signifies a relatively low
concentration of the sector in the region.
Bath and North
East SomersetBristol North Somerset
South
Gloucestershire
Agriculture, forestry and fishing - - - -
Mining and quarrying 0.2 0.0 0.2 0.4
Manufacturing 0.6 0.5 1.1 1.5
Electricity, gas, steam 0.2 0.7 0.2 0.1
Water supply; sewerage 2.1 0.7 1.5 1.4
Construction 1.0 0.8 1.0 1.3
Wholesale and retail trade 1.0 1.0 1.0 0.9
Transportation and storage 0.5 1.0 1.3 1.0
Accommodation and food service 1.3 0.9 1.1 0.8
Information and communication 1.0 1.0 0.6 1.3
Financial and insurance activities 0.8 1.9 0.5 1.3
Real estate activities 1.3 1.0 1.8 0.7
Professional, scientific and technical 0.9 1.3 0.8 0.9
Administrative and support services 0.5 1.1 1.0 1.0
Public administration and defence 0.6 1.0 1.0 1.9
Education 1.7 1.1 0.8 0.9
Human health and social work 1.4 1.2 1.2 0.8
Arts, entertainment and recreation 1.0 0.9 0.9 0.5
Other service activities 1.1 0.9 1.1 0.7Source: BRES Red shading denotes a location quotient below 0.8. Green shading denotes a location quotient above 1.3

West of England LEP: Local authority outlook
Annual average growth (%), 2015-2036
South Gloucestershire is expected to lead employment growth in the period 2015-2036, growing at a pace of 0.7%
annually, followed by 0.6% in North Somerset. With 54,000 additional jobs created in the LEP over the period,
South Gloucestershire and North Somerset contribute almost two-thirds (35,000 jobs) of the total.
GVA growth follows a similar pattern to employment, with fastest growth forecast within South Gloucestershire
(2.6%) followed by North Somerset (2.5%), each outpacing the LEP average of 2.4%. Though growing at a lesser
rate of 2.3% per annum, Bristol is the largest driver of LEP growth, contributing 1.0% of the total average each
year.
0.0
0.5
1.0
1.5
2.0
2.5
3.0
Population Employment GVA
Bath and North East Somerset
Bristol
North Somerset
South Gloucestershire
West of England LEP
(%)
Source: Oxford Economics

LEP comparison: 2013 sector variation
The location quotient (LQ) for each sector is calculated as its proportion of employment relative to the same proportion at
the Great Britain (GB) level. An LQ of 1 signifies the sector has the same concentration in the region as the average in GB.
An LQ above 1 highlights a relatively high concentration of the sector in the region. An LQ below 1 signifies a relatively low
concentration of the sector in the region.
23
*BRES data for Agriculture, forestry and fishing unavailable
West of England
LEP
Greater
Cambridge and
Greater
Peterborough
LEP
Oxfordshire LEPThames Valley
Berkshire LEP
Gloucestershire
LEP
Swindon and
Wiltshire LEP
Agriculture, forestry and fishing - - - - - -
Mining and quarrying 0.2 0.2 0.3 1.7 0.5 0.3
Manufacturing 0.9 1.3 0.9 0.7 1.6 1.1
Electricity, gas, steam 0.4 0.5 0.4 1.1 1.8 0.9
Water supply; sewerage 1.2 1.3 0.8 1.4 1.0 1.3
Construction 1.0 1.0 1.0 0.8 1.1 1.0
Wholesale and retail trade 1.0 1.0 1.0 1.1 1.0 1.1
Transportation and storage 0.9 1.0 0.7 0.9 0.7 1.0
Accommodation and food service 1.0 0.9 1.1 0.9 1.0 1.1
Information and communication 1.0 1.0 1.4 3.4 0.8 0.8
Financial and insurance activities 1.4 0.6 0.4 0.6 0.9 1.5
Real estate activities 1.1 1.0 0.8 0.8 1.1 1.0
Professional, scientific and technical 1.0 1.0 1.4 1.4 0.8 1.1
Administrative and support services 1.0 1.2 0.8 1.0 0.9 0.9
Public administration and defence 1.2 0.8 0.7 0.6 1.1 1.0
Education 1.1 1.2 1.7 0.9 1.0 0.9
Human health and social work 1.1 0.9 0.9 0.6 1.0 0.9
Arts, entertainment and recreation 0.8 0.8 1.1 1.2 0.8 0.8
Other service activities 0.9 0.9 1.1 1.5 1.0 1.0Source: BRES Red shading denotes a location quotient below 0.8. Green shading denotes a location quotient above 1.3

LEP comparison: outlook
24
Key indicators: 2014
0.0
0.5
1.0
1.5
2.0
2.5
3.0
3.5
Population growth Employment growth GVA growth
West of England LEP Greater Cambridge and Greater Peterborough LEP
Oxfordshire LEP Thames Valley Berkshire LEP
Gloucestershire LEP Swindon and Wiltshire LEP
(%)
Source: Oxford Economics
Annual average growth (%), 2015-2036
West of England
LEP
Greater Cambridge
and Greater
Peterborough LEP
Oxfordshire LEPThames Valley
Berkshire LEPGloucestershire LEP
Swindon and
Wiltshire LEP
Population (000s) 1,105 1,409 673 884 611 699
Population 16-64 (000s) 712 882 431 569 378 435
Net migration (000s) 6.8 9.6 3.8 1.0 4.8 3.0
Total employment (000s) 634 744 398 558 332 367
GVA (£m 2011) 27,930 32,966 18,324 33,305 13,665 15,605
Source: Oxford Economics

Scenarios
As the economic outlook is uncertain, we have looked at two potential scenarios. Our baseline forecast has a 50%
probability.

Upside scenario assumptions
High growth scenario (5% probability). This scenario assumes that faster growth can be achieved through:
Increased investment and exports performance at the UK level. This provides a significant boost to manufacturing,
information & communications and professional services.
Consumers play a big role in the recovery. The faster growth of the above sectors raises consumer confidence and
produces a multiplier effect through local economies with high concentrations of those sectors, which benefits consumer
led sectors including wholesale & retail trade and accommodation & food services.
No further public spending cuts. Given the improved economic conditions, the government benefits from increased
revenue and is able to ease the austerity program. As a result public sector employment remains relatively flat, rather
than falling.
Medium-high growth scenario (10% probability). This scenario assumes that faster growth can be achieved through:
Increased investment and exports performance at the UK level. This provides a significant boost to manufacturing,
information & communications and professional services.
Consumers play less of a role in the recovery than in the high growth scenario. The faster growth in the above
sectors fails to raise consumer confidence significantly and the multiplier effect on consumer led sectors is dampened.
Public spending cuts remain. Despite the improved economic conditions, the government sticks to the austerity
program outlined in our baseline view.
26

Upside scenarios: summary results
West of England LEP: GVA performance West of England LEP: Total employment performance
In the event of a more robust macroeconomic performance envisaged under the high growth scenario, the West of
England LEP will benefit from a more positive economic outlook over the forecast period. Higher levels of investment
and an improved export performance will help drive growth in construction and manufacturing. Although the West of
England is somewhat underrepresented in these sectors, they provide a catalyst for growth amongst consumer led
sectors. Under the high growth scenario, GVA will grow on average by 3.3% per year in the decade to 2025,
significantly above the baseline forecast of 2.6%. GVA growth is more sustained under the high growth scenario, with
post-2025 growth averaging 3.2% annually compared to 2.2% under baseline assumptions. Employment will also
receive a notable increase under this scenario, rising by 0.9% in the period to 2036, creating 69,000 jobs in addition to
the baseline. The region’s supply-side constraint is likely to be eased against a backdrop of greater economic growth as
the LEP benefits from greater levels of inward net migration
In the medium-high growth scenario, the West of England LEP receives a boost in employment and GVA,
outperforming the baseline forecasts. But with austerity cuts still on the table and dampened consumer confidence,
employment and GVA growth will be restricted on the upside. 27
500
550
600
650
700
750
800
2000 2005 2010 2015 2020 2025 2030 2035
Medium-high High Base
Source: Oxford Economics
ForecastForecast
(000s)
-4.0
-2.0
0.0
2.0
4.0
6.0
8.0
10.0
2000 2005 2010 2015 2020 2025 2030 2035
Medium-high High Base
Source: Oxford Economics
ForecastForecast
(%)

Scenario comparison
28
West of England LEP: The decade ahead
West of England LEP: Long-term forecasts
When comparing the decade ahead to our long-term forecasts it is evident that the initial period will provide the impetus for
growth. However, the ‘cooling’ of the economy is only marginal in the high growth scenario and limited in the medium-high
growth scenario. The baseline forecasts for the West of England LEP exhibits the most pronounced drag on growth in the long-
term. Most notably shown in total and FTE employment forecasts, with annual average growth expected to average 0.6% per
year until 2025, with the average declining to half this pace in the subsequent years to 2036.
Baseline Medium-high HighEmployment (000s) 32.8 48.2 61.0
Annual average (%) 0.6 0.8 1.0
FTE employment (000s) 27.4 41.0 52.2
Annual average (%) 0.6 0.8 1.0
GVA Annual average (%) 2.6 3.0 3.3
Population (000s) 81.3 83.5 95.3
Annual average (%) 0.7 0.7 0.8
Net Migration Annual average (000s) 3.3 3.5 4.6
Source: Oxford Economics
Change 2015-2025
Baseline Medium-high HighEmployment (000s) 53.5 87.9 122.3
Annual average (%) 0.4 0.7 0.9
FTE employment (000s) 43.9 74.3 104.6
Annual average (%) 0.4 0.6 0.9
GVA Annual average (%) 2.4 2.8 3.2
Population (000s) 141.4 152.1 176.7
Annual average (%) 0.6 0.6 0.7
Net Migration Annual average (000s) 2.6 3.1 4.3
Source: Oxford Economics
Change 2015-2036

Summary

Summary
The global economy is forecast to enter a period of solid growth with the world’s largest economies experiencing an
improved economic outlook. The US looks set to be the driver of the global economy as it experiences robust
growth on the back of high levels of consumer confidence and spending. With the Eurozone returning to growth in
2014, the outlook for Europe looks positive, despite uncertainty surrounding the details of the Greek deal presenting
some downside risk. This is important for the UK and West of England LEP as Europe remains a key trading
partner, with developments on the continent affecting demand, confidence and influencing government policy.
The UK’s economy has experienced a strong recovery with GVA growth reaching 3.0% in 2014. After a soft start to
2015 in Q1, a firming in Q2, underpinned by services, has buoyed growth estimates for the year. UK growth will be
underpinned by a number of factors including: rising household expenditure - driven by rising wages and low
inflation; strong corporate finances supporting investment; and sustained rises in housebuilding.
UK jobs are forecast to rise by 3.2 million between 2015 and 2036, with total employment reaching 37.0 million.
Employment growth is primarily in private services, with 1.7 million additional jobs expected in professional services
and administration & support. Notable exceptions to this trend are construction and healthcare which are forecast to
rise by 1.0 million.
Employment in the West of England LEP is forecast to rise on average by 0.6% per year over the decade ahead to
2025, before halving to around 0.3% per year thereafter. This will increase employment in the LEP to 697,000 by
2036, creating an additional 54,000 jobs. Accounting for the largest rises in employment are professional services
(16,000 additional jobs), administration & support (12,000), construction (9,500) and healthcare (9,100). These gains
will be partially offset by losses in manufacturing (9,700) and public administration (3,700). As a result the
employment structure is likely to become further dominated by services, which will account for 87% of total
employment by 2036.
30

Annex A: Data sources and assumptions

Model overview
This annex provides technical information on the structure of Oxford Economics Local Authority District Forecasting
Model and details of the data sources and definitions of variables within the model. The model should be viewed as
one piece of evidence in making policy decisions and tracking economic and demographic change. As with all
models it is subject to margins of error which increase as the level of geographical detail becomes smaller, and
relies heavily upon published data.
Models, though predominantly quantitative, also require a degree of local knowledge and past experience, or more
generally forecasting art, to make plausible long term projections. To this end the Oxford model has been developed
by a team of senior staff who have a long history in model building and forecasting at both local and regional levels.
The Local Authority District Forecasting Model sits within the Oxford suite of forecasting models. This structure
ensures that global and national factors (such as developments in the Eurozone and UK Government fiscal policy)
have an appropriate impact on the forecasts at a local authority level. This empirical framework (or set of ‘controls’)
is critical in ensuring that the forecasts are much more than just an extrapolation of historical trends. Rather, the
trends in our global, national and sectoral forecasts have an impact on the local area forecasts.
32

Hierarchal structure of Oxford Economics’ suite of models
Oxford Economics
Global model
Oxford Economics
UK industry model
Oxford Economics
UK macro model
Oxford Economics
UK regional model
Oxford Economics
UK LAD forecasting model
33

Local forecasting model
The Local Authority District Forecasting Model produces base forecasts, which can be compared with other
published forecasts (though care should be taken over data definition issues), and as a guide to aid commentary or
analysis of West of England LEP and its local authority economies. These forecasts can in one sense be considered
to provide baseline ‘policy off’ projections with which the actual outturn under policy initiatives could be compared.
However it must be realised that there are inherent difficulties in using the forecasts as a ‘policy-off’ baseline. In
particular the base projections are ‘unconstrained’ in the sense that they make no allowance for constraints on
development which may be greater than in the past.
Our local forecasting model depends essentially upon three factors:
■ National/regional outlooks – all the forecasting models we operate are fully consistent with the broader global
and national forecasts which are updated on a monthly basis.
■ Historical trends in an area (which implicitly factor in supply side factors impinging on demand), augmented
where appropriate by local knowledge and understanding of patterns of economic development built up over
decades of expertise, and
■ Fundamental economic relationships which interlink the various elements of the outlook.
34

Model structure
The main internal relationships between variables are summarised below. Each variable is related to others within
the models. Key variables are also related to variables in the other Oxford Economics models.
Households
Workplace wages
(by sector)
UK macro
trends
House prices
Commuting
(by occupation)
Employment
(residence based)
Resident wages
(total)
Population Unemployed/Inactive Migration
Natural increase
Employment
(workplace based)
GVA by sector
Key
South West trends
35

Data sources and assumptions
Population and migration
Population and migration data are collected from the Mid-Year estimates (MYE) for each area. These have been
revised in line with the 2011 Census results. The latest data available is for 2014.
Oxford Economics produce their own forecasts of population which are economically driven and thus differ from the
official population projections. Official births and deaths projections from 2012-based population projections are used
but we have our own view on UK migration. The chart below sets out the Oxford migration forecast for the UK
compared with the 2012-based population projection. Oxford Economics expect UK net migration to average
157,000 per annum from 2015-2036, compared to 167,000 in the official projections. The latest data suggests that
UK net migration reached 260,000 in 2014, which is already considerably above the official projections (166,000).
36
West of England LEP: Net migration projections UK: Net migration projections
-50
0
50
100
150
200
250
300
350
1992 1997 2002 2007 2012 2017 2022 2027 2032
Oxford Economics Official 2012-based
Source: Oxford Economics
Forecast
(000s)
Source: Oxford Economics
Forecast
(000s)
-2
0
2
4
6
8
10
12
14
1992 1997 2002 2007 2012 2017 2022 2027 2032
Oxford Economics Official 2012-based
Source: Oxford Economics
Forecast
(000s)
Source: Oxford Economics
Forecast
(000s)

Data sources and assumptions
Population and migration (continued)
The divergence reflects stronger economic prospects and displacement affects from the Middle East and North
Africa. Oxford Economics’ population forecasts are derived from an economically driven model whereas official
projections are trend based and do not consider how demand in the economy (and the likely impact on employment
rates) affects migration.
At the local level, migration is linked to the employment rate forecast. If the employment rate within an area is falling
too fast, migration reacts as the model assumes that people would not be attracted into this area to live, given that
the employment prospects are weak. This approach ensures that the relationship between the labour market outlook
and the demographic forecasts is sensible. This series is scaled to be consistent with the migration forecast for the
South West from the UK Regional Model.
The total population forecast is then constructed using the forecast of migration and the natural increase
assumptions. Natural increase for local areas is forecast based upon recent trends in both the historical data and the
official projections.
Working age population
Working age population data is also collected from the Mid-Year estimates (MYE) for each area up to 2014. It is
defined as all people aged 16 to 64.
The share of working age to total population is forecast using both trends in the official projections and trends in the
South West forecast from our UK Regional Model. This is applied to the total population forecast and scaled to be
consistent with the working age population for the South West.
37

Data sources and assumptions
Employees in employment
There are two key sources for the employee jobs data – ONS Workforce Jobs (WFJ) and the Business Register and
Employment Survey (BRES):
The WFJ series is reported on a quarterly basis, providing estimates of employee jobs by sector (based on the 2007
Standard Industrial Classification – SIC 2007) for the UK and its constituent government office regions, over the
period 1981Q3 to 2015Q1.
The BRES is an employment survey which has replaced the Annual Business Inquiry (ABI). Similar to WFJ, BRES
data is based upon SIC 2007, but it is only published for the years 2008-13. Prior to this, ABI and Annual
Employment Survey (AES) data is available for employee jobs data, however this is based on an older industrial
classification (SIC 2003). Data is available at local authority level and more detailed sector definitions. It is worth
noting that the BRES is first and foremost a survey and is therefore subject to volatility, particularly when the level of
detail becomes more refined. The survey is collected in September of each year and not seasonally adjusted.
There are a number of steps in constructing regional employee jobs, due to changes in sectoral classifications
across the various sources, and restrictions on data availability over particular periods of time. Initially, we take
employee jobs data for each sector directly from the BRES over the years 2009-13, which reflects recent
methodological changes to the BRES in accounting for working proprietors. This relates to September figures and is
based upon SIC 2007 sectors. In 2008, levels of employee jobs are constructed by extrapolating back the trend in
the old BRES. Data from the ABI and AES is used to construct the data back to 1991.
This constructed local dataset is then scaled to be consistent with the UK employee jobs series from WFJ, by
applying an adjustment factor to all sectors which converts the data to annual average values (seasonally adjusted).
38

Data sources and assumptions
Employees in employment (forecasts)
The starting point in producing employment forecasts is the determination of workplace-based employees in
employment in each of the broad 19 SIC2007 based sectors consistent with the South West and UK outlooks. At
local authority level some of the sectors are driven predominantly by population estimates, others by total
employment in the area and the remainder relative to the regional performance (largely exporting sectors). All
sectors are also influenced by past trends in the local area. Taken in totality, employment is cross referenced with a
number of variables (including population, relative performance across similar areas, historical cyclical performance
and known policy) for checking and validation purposes. Where necessary, manual adjustments are made to the
projected trends to reflect this validation process. The methods of sectoral projection are as follows, each of which
are forecast based upon recent trends:
Share of the South West: Agriculture; Mining and quarrying; Manufacturing; Electricity, gas & steam; Water
supply; sewerage, waste management; Information and communication; Financial and insurance activities
Location quotient based upon total employment: Construction; Real estate activities; Professional,
scientific and technical activities; Administrative and support service activities
Location quotient based upon consumer spending: Wholesale and retail trade; Transportation and
storage; Accommodation and food service activities; Arts, entertainment and recreation; Other service activities
Location quotient based upon population: Public administration and defence; Education; Human health
and social work activities
These sectors are then split out into their detailed 2 digit sector forecasts using shares from the raw BRES data. The
shares are forecast in line with changes in the detailed sector for South West and then constrained to both the broad
sector forecast within the local area and also to the detailed South West forecasts produced in the UK Regional
Model.
39

Data sources and assumptions
Self-employment
Self-employment data for the South West is taken from Workforce jobs (19 sector detail). The data is broken down
into detailed sectors using both employee trends and the UK data for self-employment by 2 digit SIC2007 sector.
Data for the local authorities is Census based (and scaled to the South West self-employed jobs estimates) and is
broken down using the employees in employment sectoral structure. The sectors are forecast using the growth in
the sectoral employees in employment data and the estimates are scaled to the regional estimate of self-
employment by sector.
Total employment
Total employment includes employees in employment, the self-employed and Her Majesty’s Forces. No specific
forecasting for this measure is required - it is calculated from the forecasted elements discussed above.
Note that this estimate is a jobs and not people measure (i.e. one person can have more than one job and would be
counted more than once in this indicator).
Unemployment
Claimant count unemployment data is taken from ONS, via NOMIS. Annual average values are calculated from the
monthly data. The latest data available is July 2015.
Unemployment (claimant count) is projected based on regional trends and a measure of overall labour market
tightness (relative employment rate) in the local area. It is not at present directly affected by migration though they
do impact indirectly through the employment rate (which has working age population as its denominator).
Unemployment rate is defined as claimant count unemployment as a percentage of the working age population. No
specific forecasting of this measure is required.
40

Data sources and assumptions
Resident employment
Resident employment data is taken from the Annual Population Survey. The latest year of available data is 2014.
Given that this data is survey based and tends to be very volatile, data is ‘smoothed’ by taking a 3 year average.
Residence employment is based on a commuting matrix taken from the 2011 Census. This matrix tells us where
employed residents of an area work. Using this information each available job (see workplace employment people
based above) is allocated to a resident of a given authority. This method assumes the proportions of commuting do
not change over time.
Employment rate is defined as residence employment as a percentage of the population aged 16 plus. No specific
forecasting of this measure is required.
Gross Value Added
GVA forecasts are available for detailed sectors for the South West region from our UK Regional Model. For areas
within the region, data on total GVA is available at NUTS 3 level. This includes counties and former Metropolitan
counties. Our forecasts at local authority level are obtained firstly by calculating an ‘expected’ GVA in each area.
This is calculated by multiplying the South West region’s GVA per employee in each sector by workplace
employment in each sector within each local authority area. An adjustment factor based upon relative earnings is
also applied as areas with higher wages should produce higher levels of GVA. Expected GVA is then scaled to add
the GVA at NUTS 3 level and the South West sectoral forecasts from the UK Regional Model.
41


