Download - EPP Summary - Mississippi State University
Environmental Plant PhysiologySummary
K. Raja ReddyMississippi State University
Mississippi State, MS
Environmental Plant PhysiologyObjectives
• The objectives of this course are to learn plant responses to abiotic stresses, particularly plant growth and development, and to learn modeling methodologies on how to integrate those plant processes under multiple stress conditions.
• At the end, the students are expected to:
understand individual as well as interactive abioticstress effects on photosynthesis, respiration, growth, development and finally yield.
understand on how to develop methodologies to integrate multiple stress factor effects on various plant/canopy processes.

Trends That Shape Our Future

Year0 500 1000 1500 2000 2500
Popu
latio
n in
Billi
ons
0
2
4
6
8
10
12
14World Population
Trends, Signs and Signatures from the EarthPast, Present and Future World Population
Pop
ulat
ion,
mill
ions
0
500
1000
1500
2000
2500
300020002050
AsiaOceania
(less China and India)
China India Africa Europe LatinAmerica
NorthAmerica
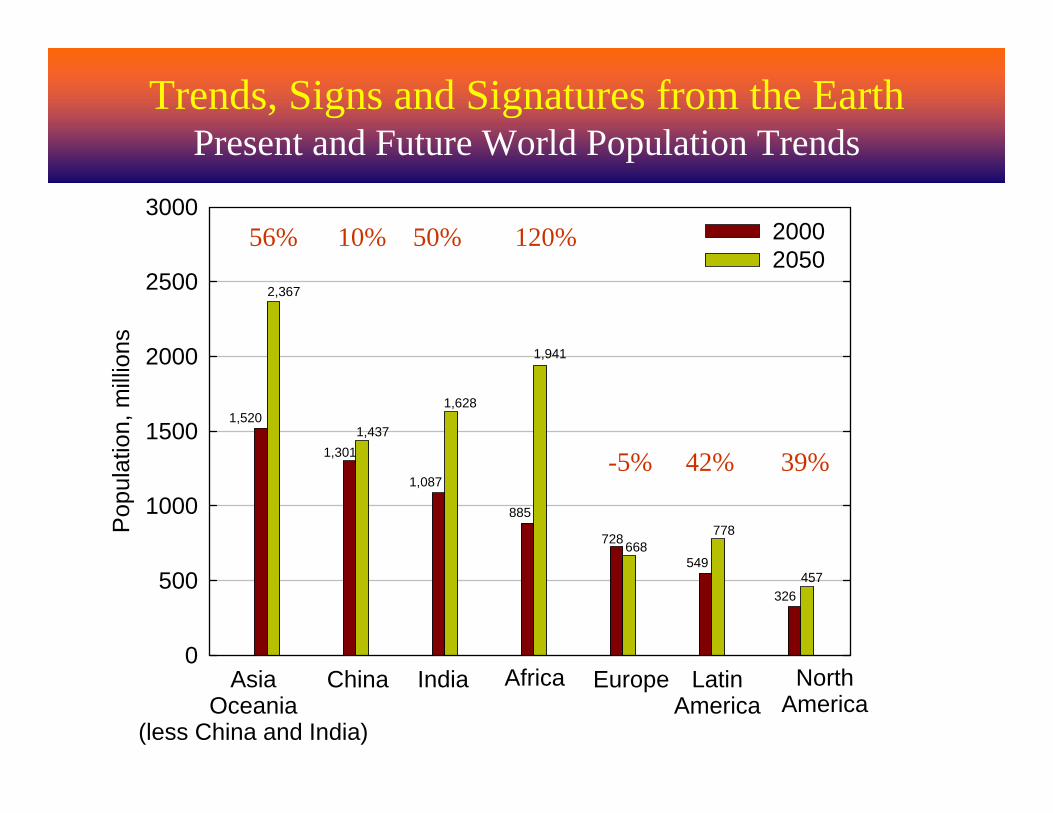
2,367
1,437
1,628
1,941
668778
457
1,520
1,301
1,087
885
728
549
326
Trends, Signs and Signatures from the EarthPresent and Future World Population Trends
56% 10% 50% 120%
-5% 42% 39%

Trends, Signs and Signatures from the EarthGlobal Major Foods – Per Capita Consumption
Year1965 1970 1975 1980 1985 1990 1995 2000
Con
sum
tion,
lb/p
erso
n
100
150
200
250
300
350
400
450
Selected fruits = 1.95 lb/year
Vegetables = 3.21 lb/year
Flour and Cereals = 2.70 lb/year
Meat and Poultry = 0.65 lb/year

Trends, Signs and Signatures from the EarthGlobal Major Foods – Meat and Poultry Production
Year
1950 1960 1970 1980 1990 2000 2010
Mea
t and
Pou
ltry
prod
uctio
n, m
illion
t
0
50
100
150
200
250
300PoultryMeat
Year
1960 1970 1980 1990 2000 2010
Mea
t and
Pou
ltry
prod
uctio
n tre
nds,
1961
= 1
0
1
2
3
4
5
6
7
8
9
101961 to 2007: Million t Poultry = 9 and 87Meat = 71 and 286
Poultry
Meat
Meat and Poultry Production Meat and Poultry ProductionRelative Trends
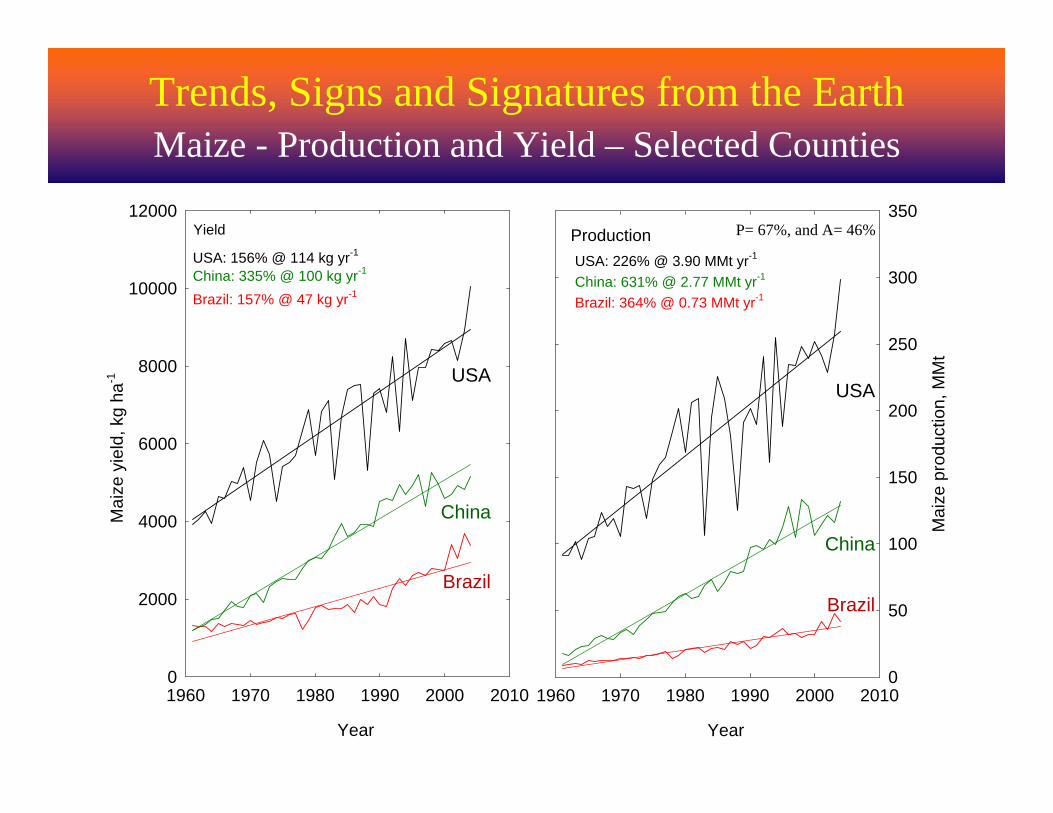
Trends, Signs and Signatures from the EarthMaize - Production and Yield – Selected Counties
Year
1960 1970 1980 1990 2000 2010
Mai
ze y
ield
, kg
ha-1
0
2000
4000
6000
8000
10000
12000
USA: 156% @ 114 kg yr-1
China: 335% @ 100 kg yr-1
USA
China
Year
1960 1970 1980 1990 2000 2010
Mai
ze p
rodu
ctio
n, M
Mt
0
50
100
150
200
250
300
350
USA
China
Yield Production
Brazil: 157% @ 47 kg yr-1
BrazilBrazil
USA: 226% @ 3.90 MMt yr-1
China: 631% @ 2.77 MMt yr-1
Brazil: 364% @ 0.73 MMt yr-1
P= 67%, and A= 46%
Year
1960 1970 1980 1990 2000 2010
Ric
e yi
eld,
kg
ha-1
0
1000
2000
3000
4000
5000
6000
7000
8000
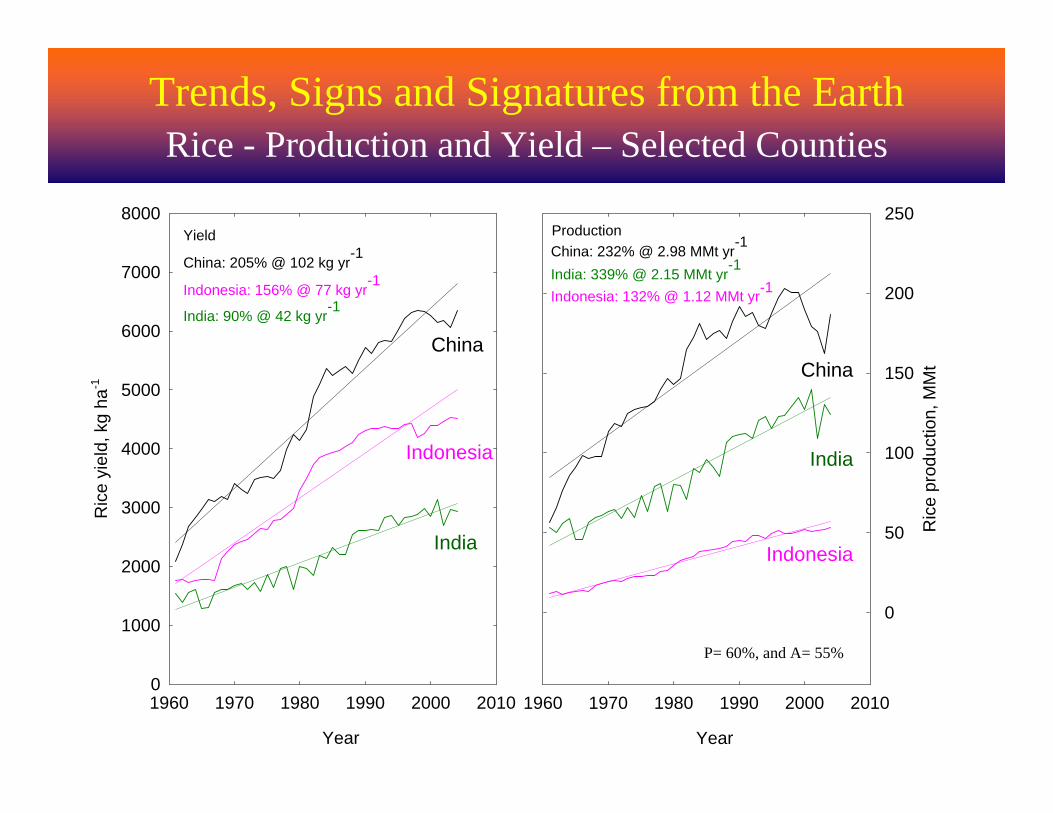
China: 205% @ 102 kg yr-1
India: 90% @ 42 kg yr-1Indonesia: 156% @ 77 kg yr-1
China
Indonesia
India
Year
1960 1970 1980 1990 2000 2010
Ric
e pr
oduc
tion,
MM
t
0
50
100
150
200
250
Indonesia: 132% @ 1.12 MMt yr-1India: 339% @ 2.15 MMt yr-1China: 232% @ 2.98 MMt yr-1
China
Indonesia
India
Yield Production
Trends, Signs and Signatures from the EarthRice - Production and Yield – Selected Counties
P= 60%, and A= 55%
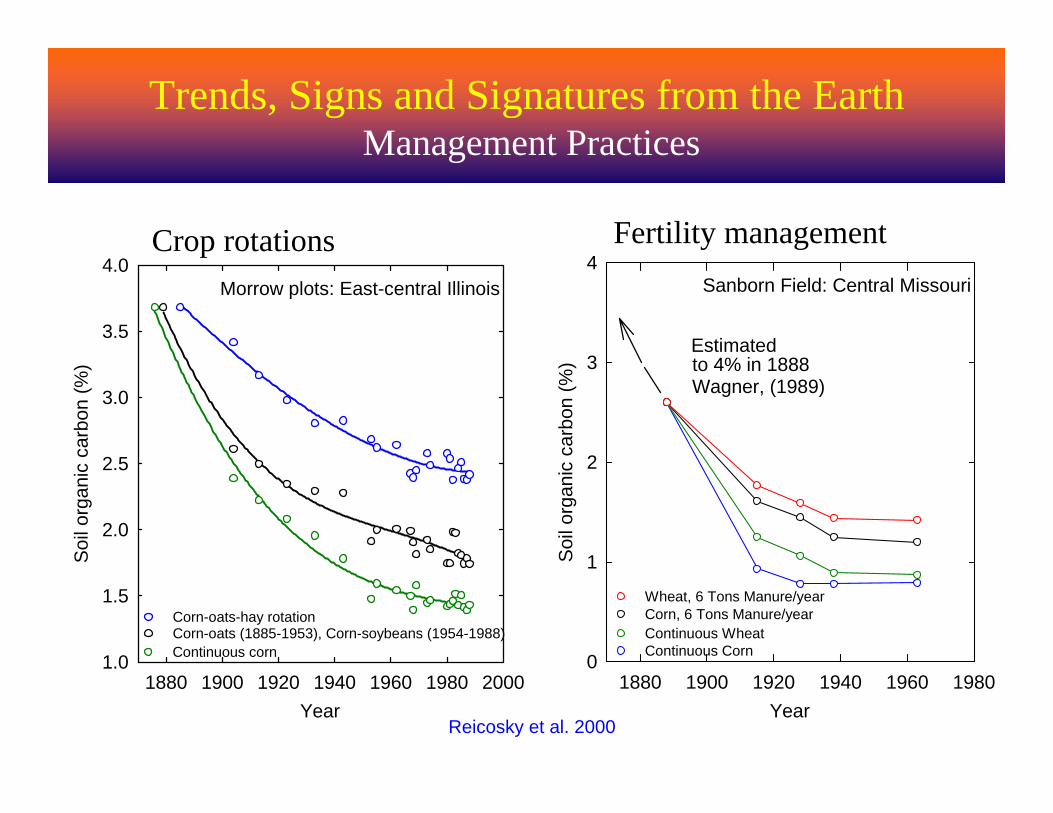
Trends, Signs and Signatures from the EarthManagement Practices
Year1880 1900 1920 1940 1960 1980 2000
Soi
l org
anic
car
bon
(%)
1.0
1.5
2.0
2.5
3.0
3.5
4.0Morrow plots: East-central Illinois
Corn-oats-hay rotationCorn-oats (1885-1953), Corn-soybeans (1954-1988)Continuous corn
Year1880 1900 1920 1940 1960 1980
Soil
orga
nic
carb
on (%
)
0
1
2
3
4
Wagner, (1989)to 4% in 1888Estimated
Sanborn Field: Central Missouri
Wheat, 6 Tons Manure/yearCorn, 6 Tons Manure/yearContinuous WheatContinuous Corn
Crop rotations Fertility management
Reicosky et al. 2000

Cropland area Irrigated area Salinized area
----------------------------- Mha --------------------------------
China 124.0 54.4 (22%) 7-8 (14%)
India 161.8 54.8 (31%) 10-30 (50%)
USA 177.0 22.4 (13%) 4.5 -6 (15%)
USSR 204.1 19.9 (2%) 2.5-4.5 (21%)
World 1364.2 271.7 (21%) 62-82 (37%)
Percent change since 1985
Trends, Signs and Signatures from the EarthCropland area, Irrigation and Salinization
Year 2000
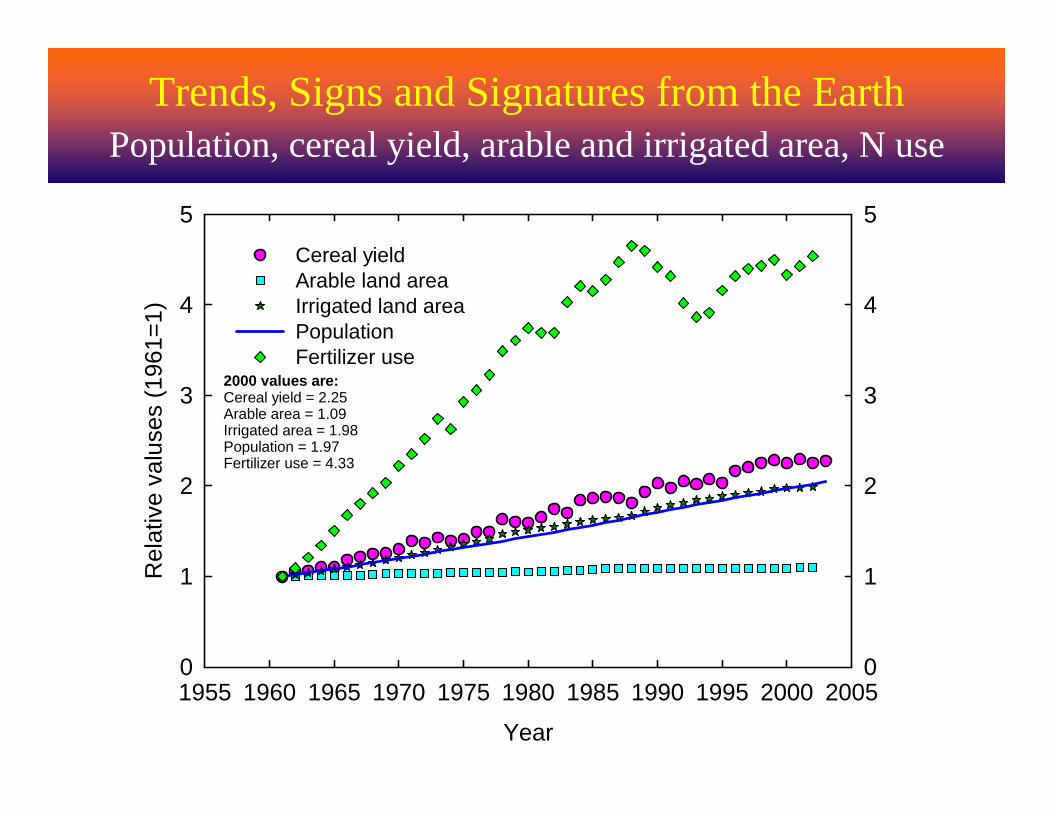
Trends, Signs and Signatures from the EarthPopulation, cereal yield, arable and irrigated area, N use
Year
1955 1960 1965 1970 1975 1980 1985 1990 1995 2000 2005
Rel
ativ
e va
luse
s (1
961=
1)
0
1
2
3
4
5
0
1
2
3
4
5Cereal yieldArable land areaIrrigated land areaPopulationFertilizer use
2000 values are:Cereal yield = 2.25Arable area = 1.09Irrigated area = 1.98Population = 1.97Fertilizer use = 4.33
Feeding 10 Billion Mouths
We must develop the capacity to feed 10 billion people within in the next 40 to 50 years.
• The average world current cereal yield is about 3 tons per ha for about 6 billion people.
• We need about 4 tons per ha for 8 billion (33 % more than the current), and 5 tons per ha for 10 billion (67 % more than the current).

Routes to Greater Food Production
• Increase in the area of land under cultivation.
• Increase in the number of crops per hectare per year(mostly practiced in tropics, requires access to irrigation, high input use, short season cultivars, and others such as labor, pest and disease control may be a problem).
• Displacement of lower yielding crops by higher yielding ones (done since the dawn of domestication).
• Efficiency of crop production in terms of:Per unit of land area (yield per ha)Per unit of timePer unit of inputs such as fertilizers, water and labor etc.

Here comes the greatest challenge of our time,
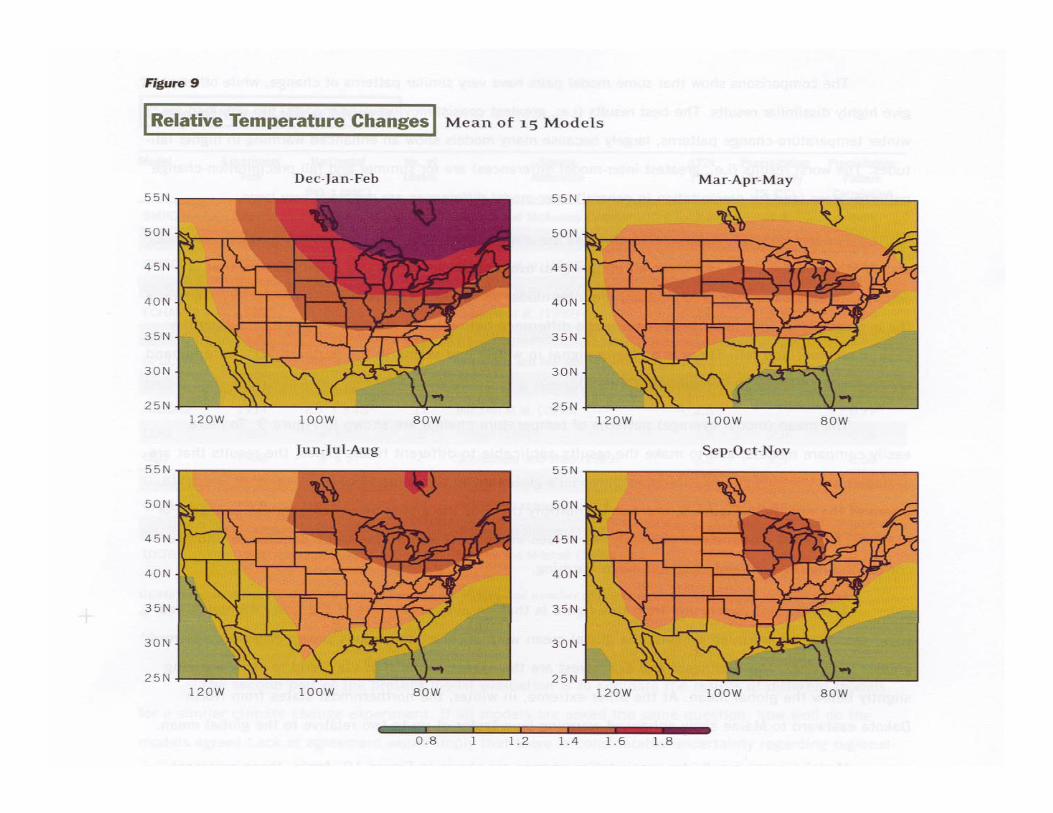
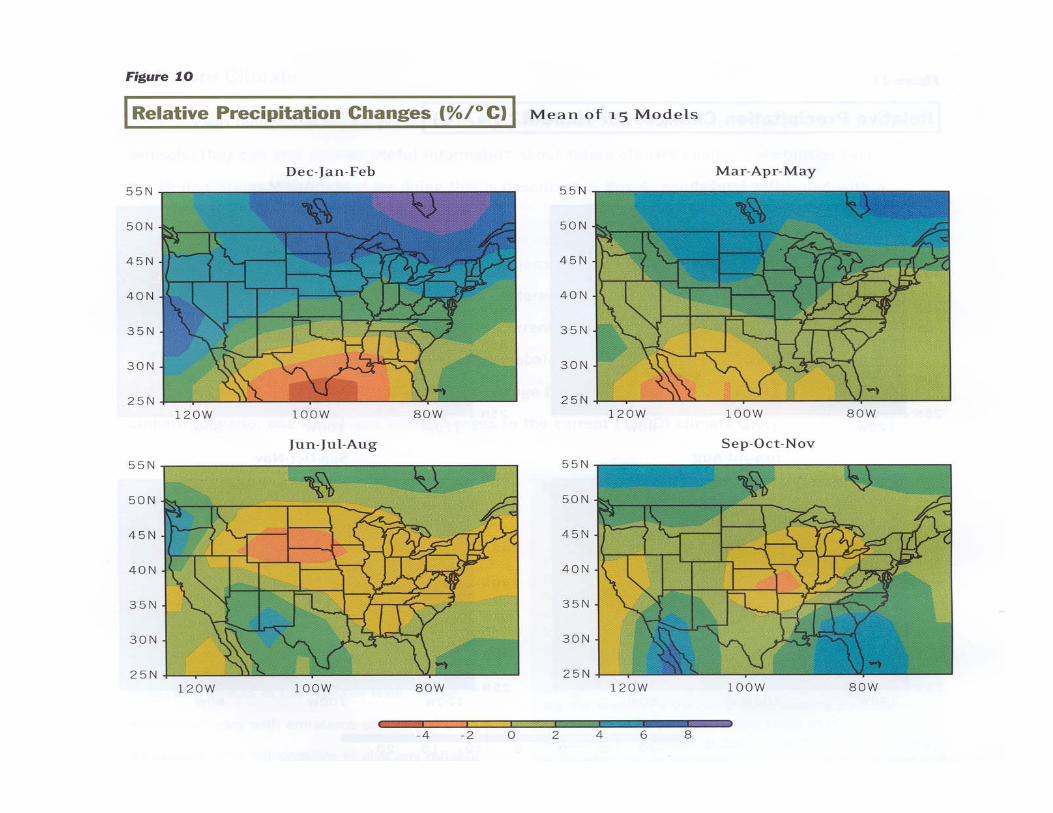
The Global Climate Change

Environmental Stresses and Plant Growing Conditions
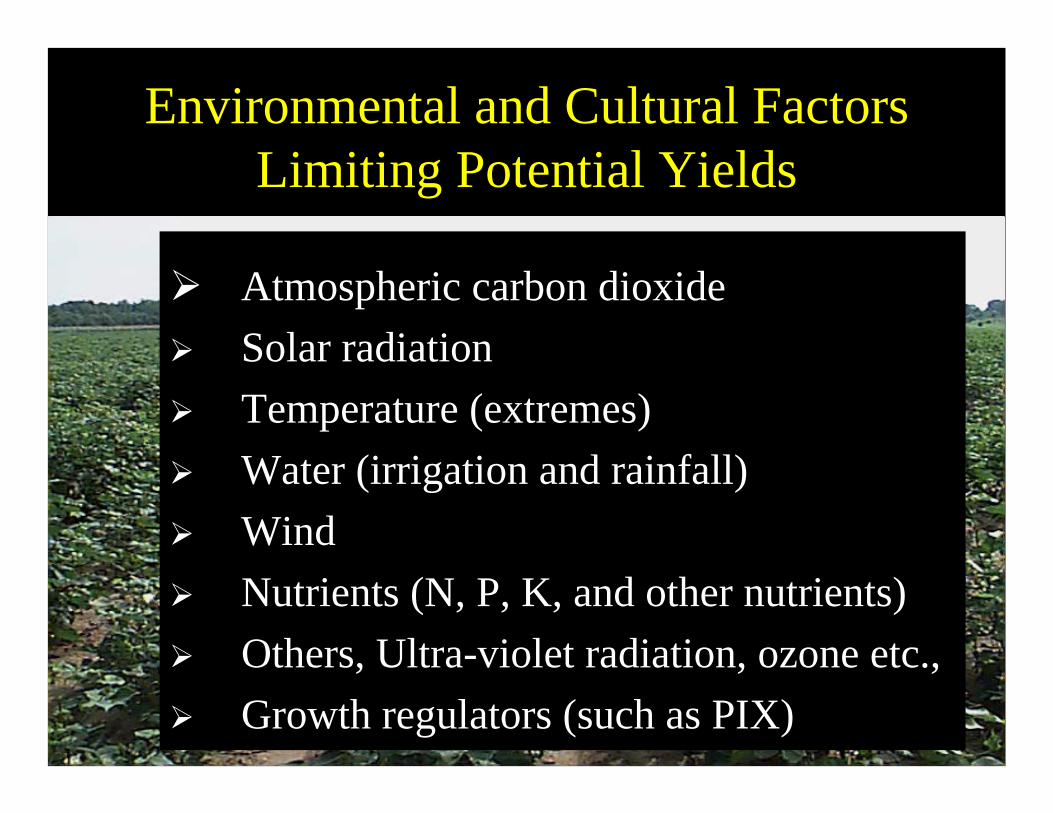
Environmental and Cultural Factors Limiting Potential Yields
Atmospheric carbon dioxideSolar radiationTemperature (extremes)Water (irrigation and rainfall)WindNutrients (N, P, K, and other nutrients)Others, Ultra-violet radiation, ozone etc.,Growth regulators (such as PIX)
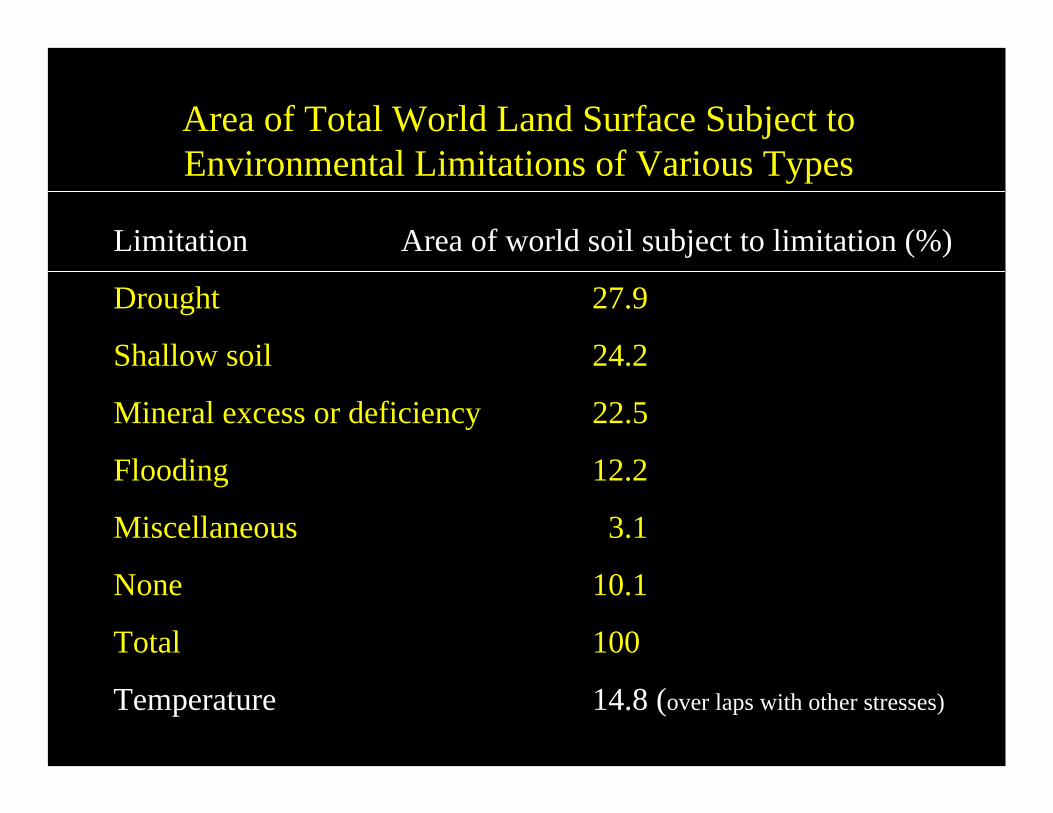
Limitation Area of world soil subject to limitation (%)
Drought 27.9
Shallow soil 24.2
Mineral excess or deficiency 22.5
Flooding 12.2
Miscellaneous 3.1
None 10.1
Total 100
Temperature 14.8 (over laps with other stresses)
Area of Total World Land Surface Subject to Environmental Limitations of Various Types

Environmental Plant Physiology
• Atmospheric carbon dioxide
• Solar radiation
• Temperature (Including extremes)
• Water
• Wind
• Nutrients
• Other factors such as ozone
• Plant growth regulators
• The facilities and tools
Chapter 1

Environmental Plant Physiology
Photosynthesis and the environment• The Environmental productivity Index (EPI)
concept.
• The photosynthesis - Species variability.
• Photosynthesis and aging process.
• Respiration.
Chapter 2
Environmental Plant Physiology
Crop growth and development
• Phenology
• Growth of various organs and whole plants.
• The concept of environmental productivity index in quantifying crop growth and development in response to the environment.
Chapter 3

Environmental Plant Physiology
Scaling of processes from leaves to whole plant, canopies or ecosystems.
Chapter 4
Special topics include:• Remote sensing and environmental plant
physiology.
Chapter 5
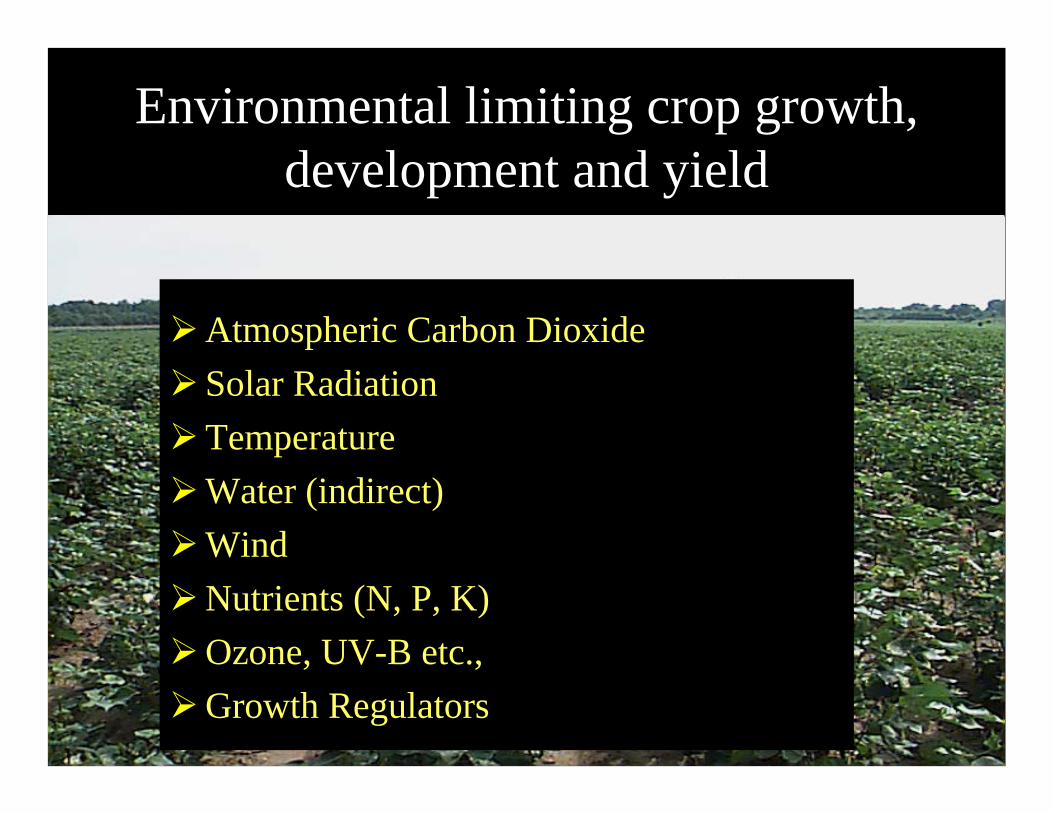
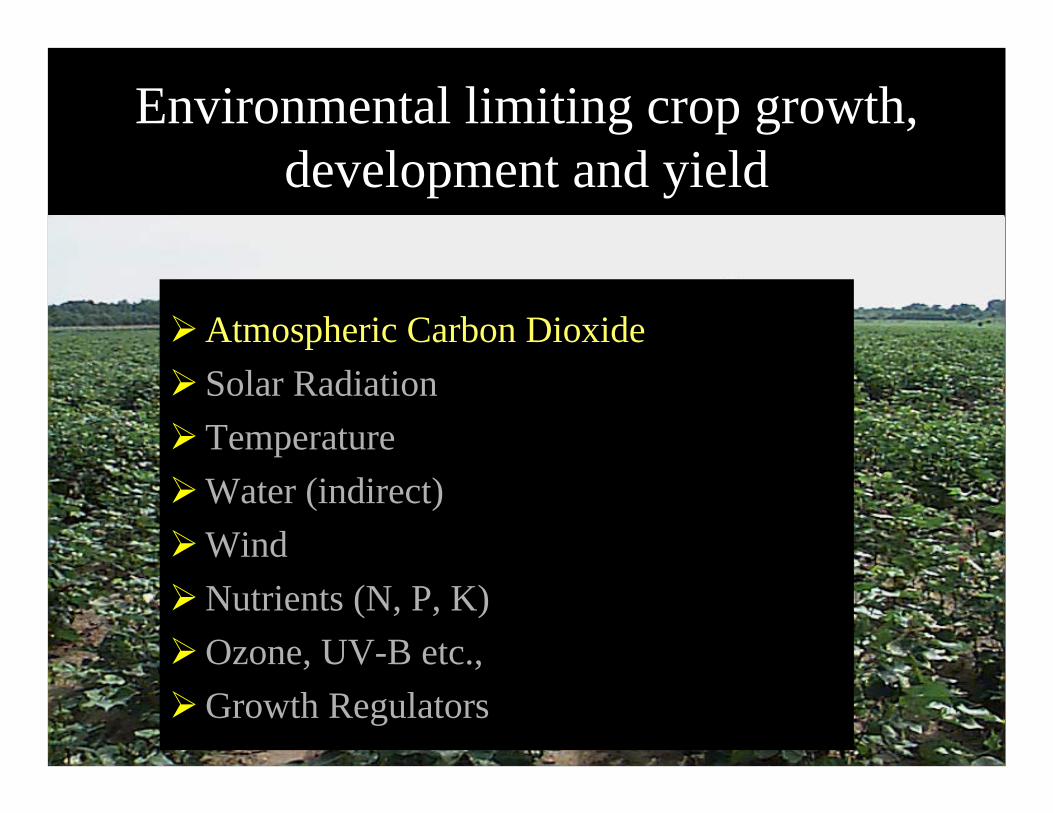
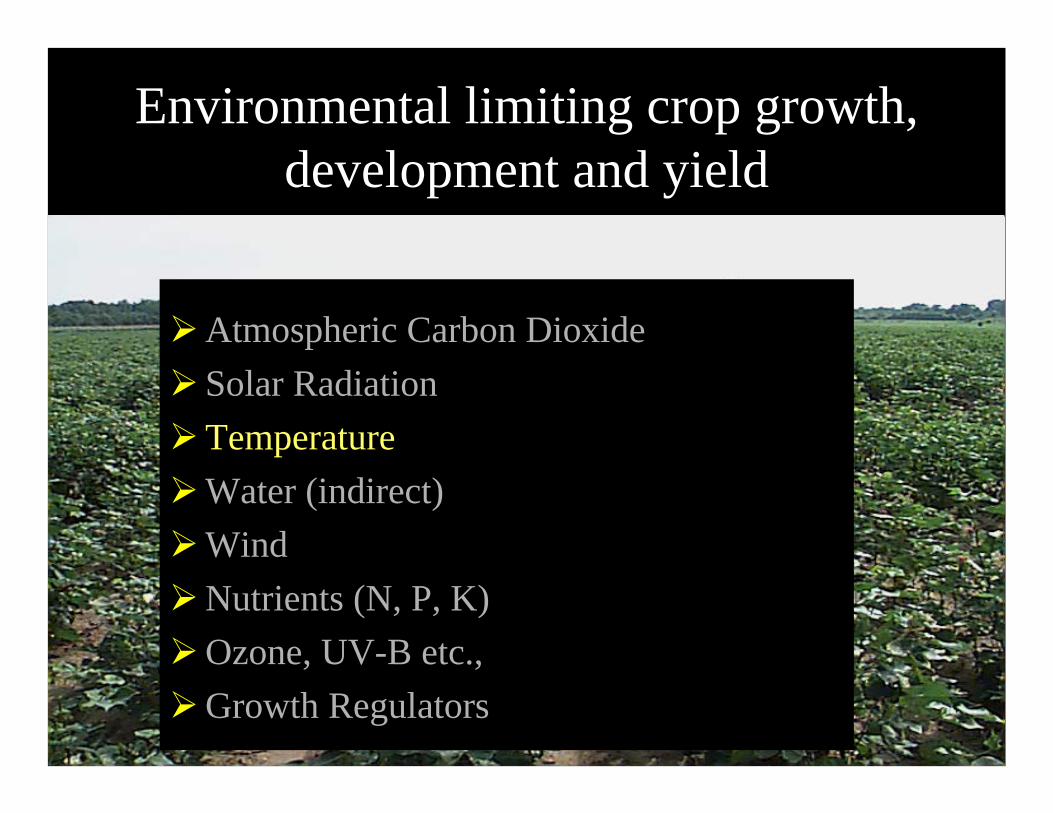
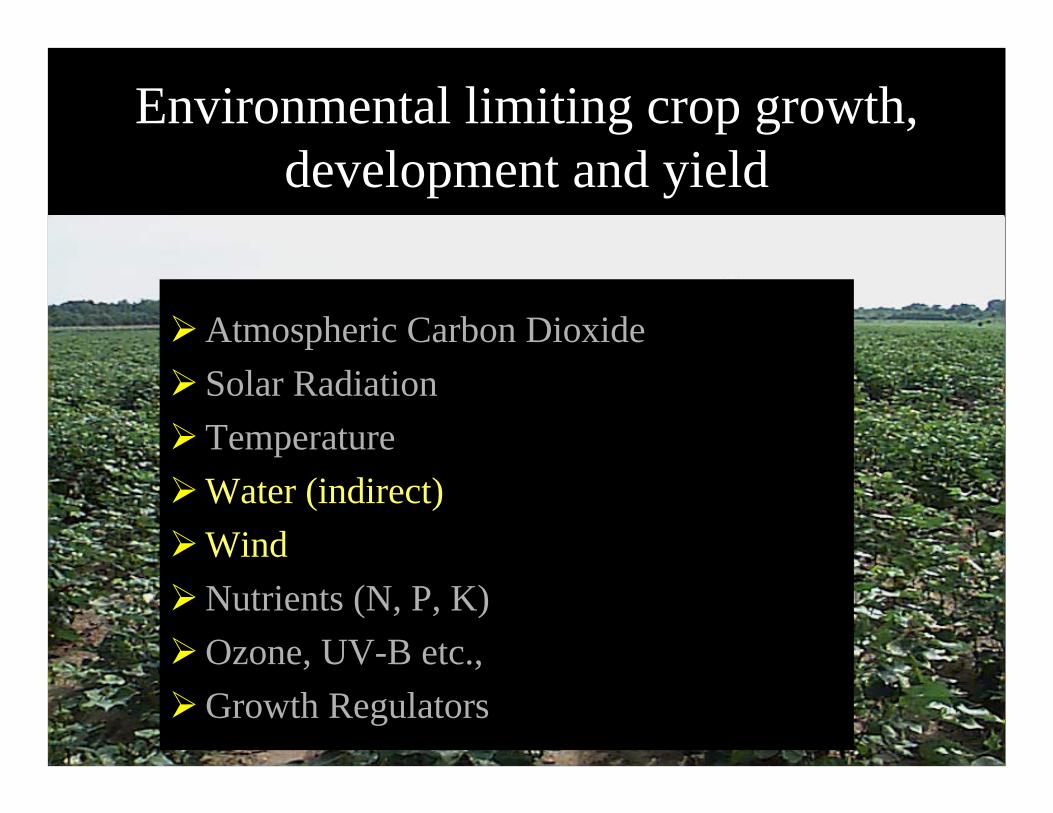
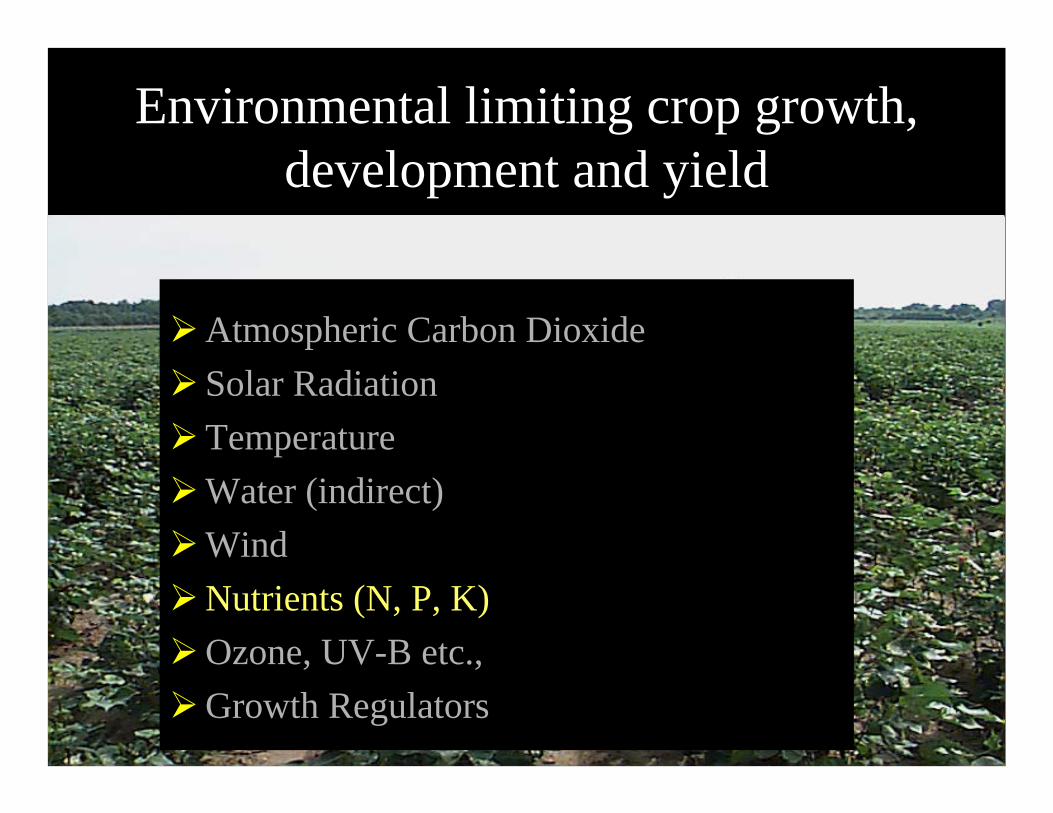
Environmental limiting crop growth, development and yield
Atmospheric Carbon DioxideSolar RadiationTemperatureWater (indirect)WindNutrients (N, P, K)Ozone, UV-B etc.,Growth Regulators
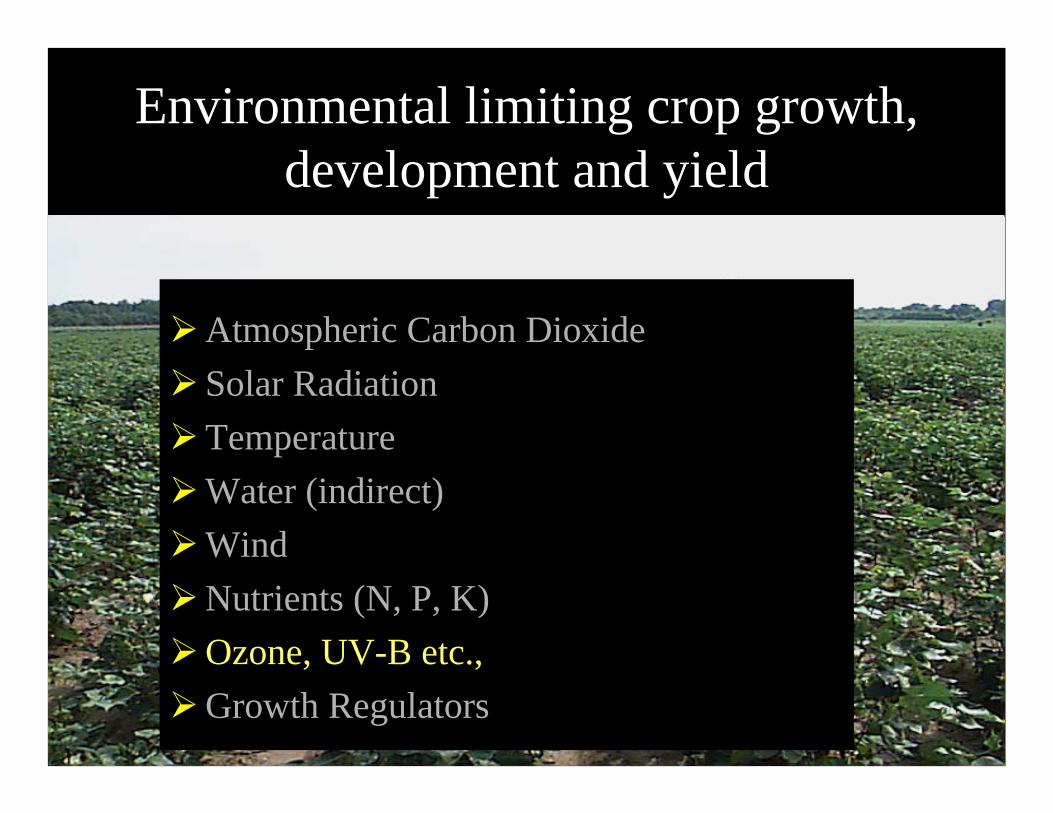
Environmental limiting crop growth, development and yield
Atmospheric Carbon DioxideSolar RadiationTemperatureWater (indirect)WindNutrients (N, P, K)Ozone, UV-B etc.,Growth Regulators
Year1700 1750 1800 1850 1900 1950 2000 2050
CO
2 Con
cent
ratio
n, p
pm
250
275
300
325
350
375
400
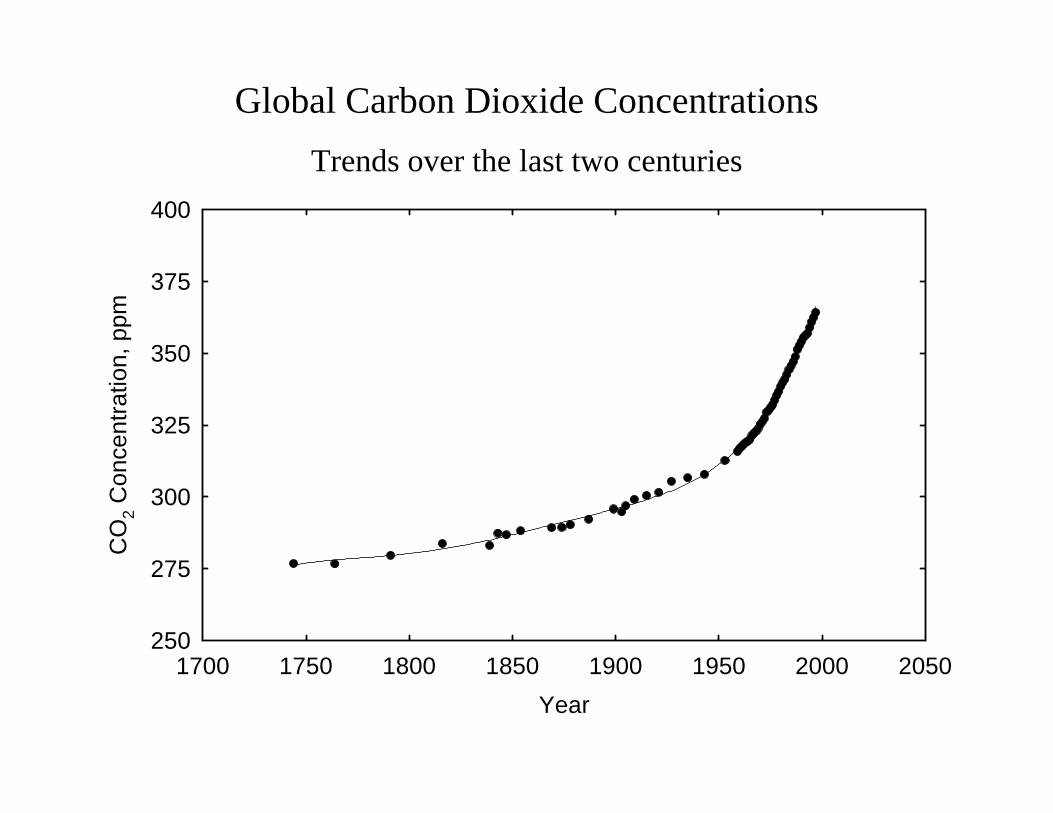
Global Carbon Dioxide ConcentrationsTrends over the last two centuries
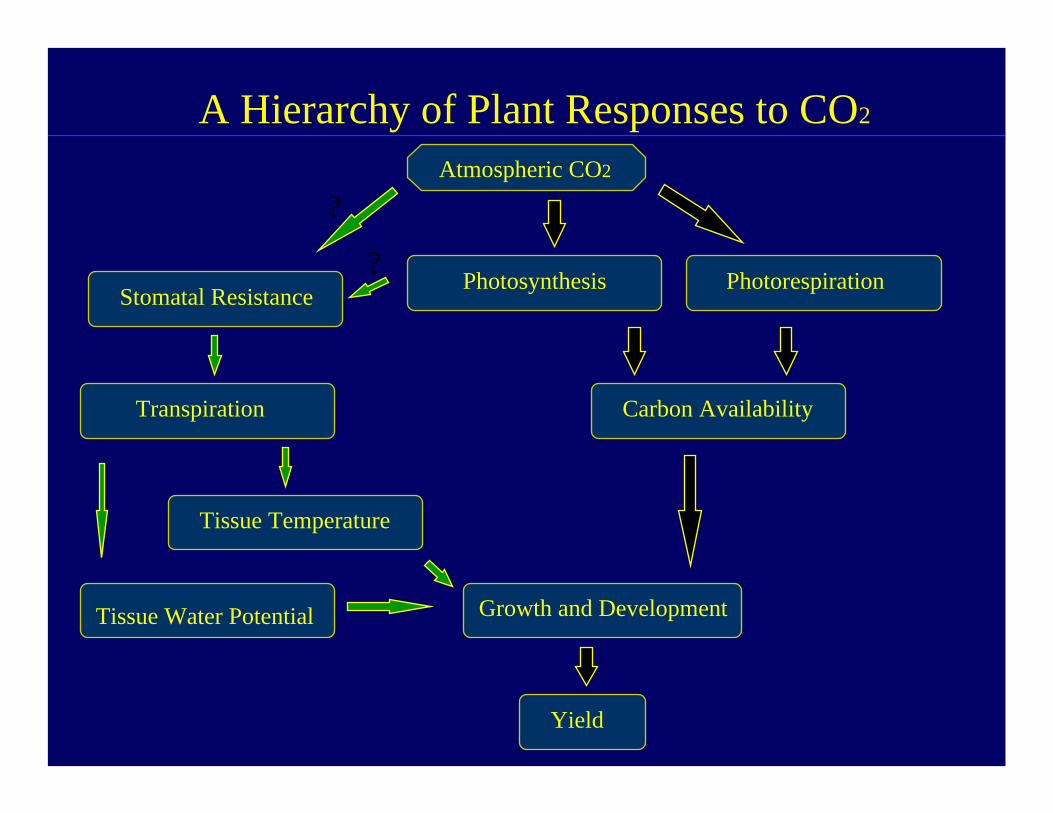
A Hierarchy of Plant Responses to CO2
Atmospheric CO2
Growth and Development
Photosynthesis Photorespiration
Carbon Availability
Stomatal Resistance
Transpiration
Tissue Water Potential
Tissue Temperature
Yield
?
?

Environmental limiting crop growth, development and yield
Atmospheric Carbon DioxideSolar RadiationTemperatureWater (indirect)WindNutrients (N, P, K)Ozone, UV-B etc.,Growth Regulators
Radiation and Plant Life
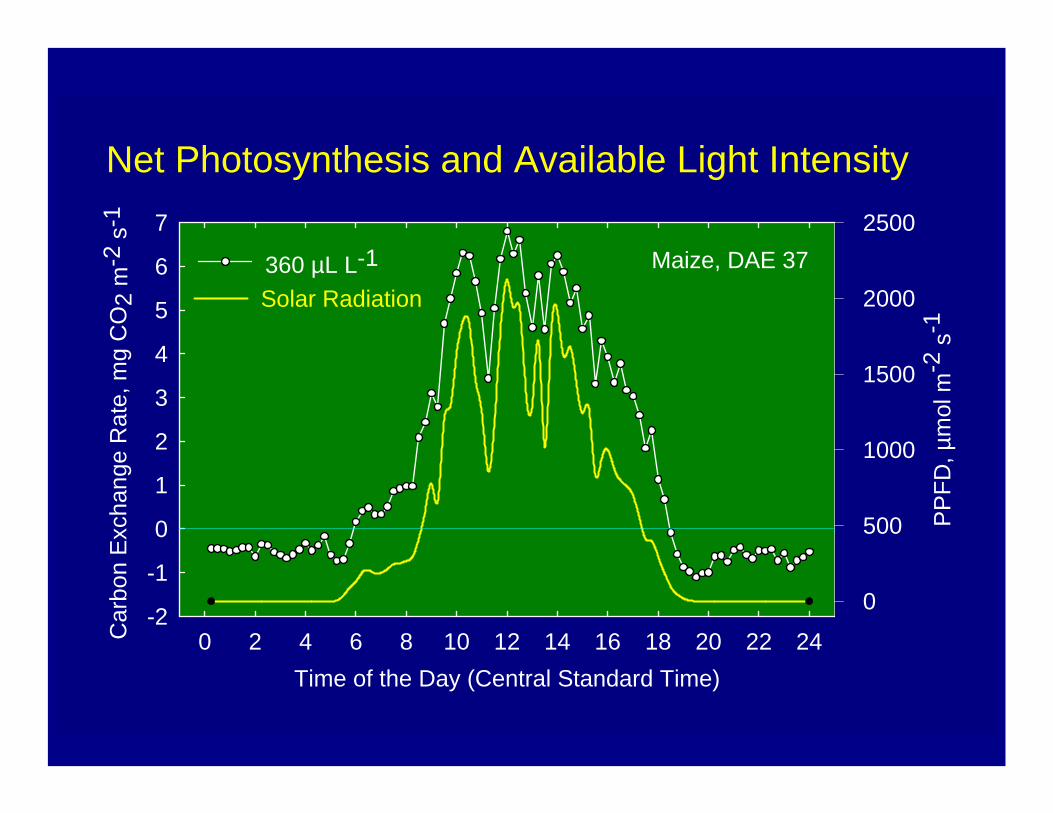
Net Photosynthesis and Available Light Intensity
Time of the Day (Central Standard Time)0 2 4 6 8 10 12 14 16 18 20 22 24
PP
FD, µ
mol
m-2
s-1
0
500
1000
1500
2000
2500
Car
bon
Exc
hang
e R
ate,
mg
CO
2 m
-2 s
-1
-2
-1
0
1
2
3
4
5
6
7
360 µL L-1
Solar RadiationMaize, DAE 37
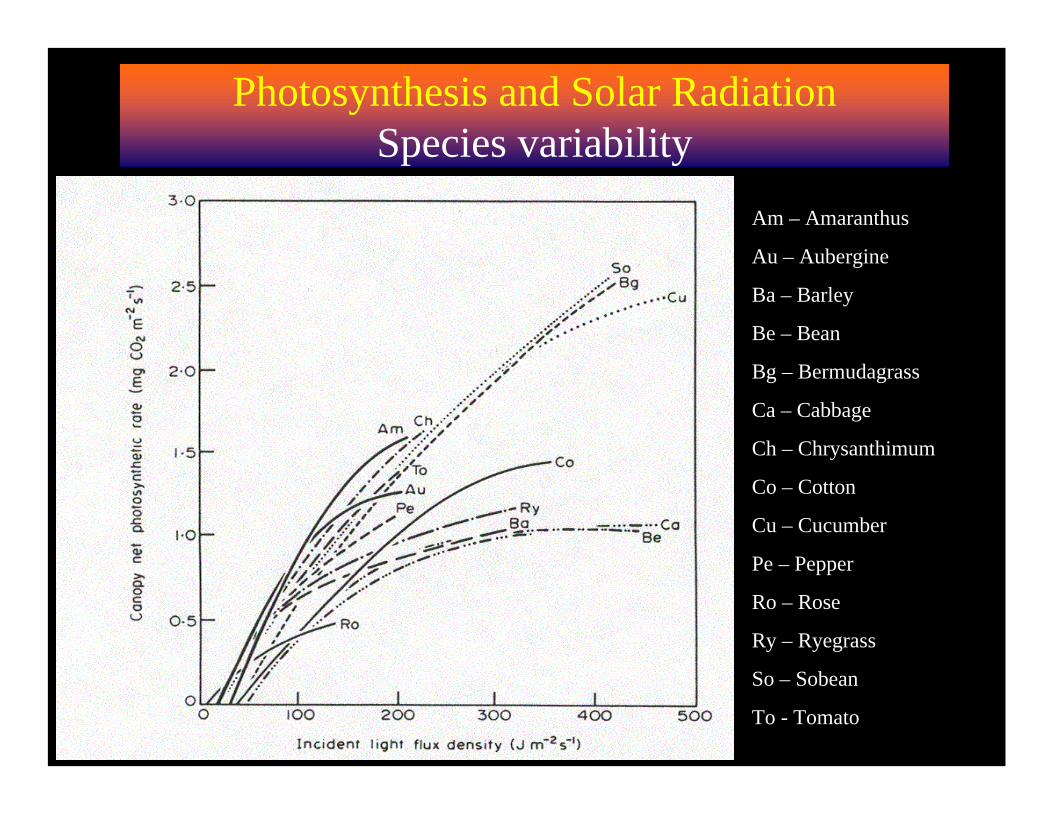
Photosynthesis and Solar RadiationSpecies variability
Am – Amaranthus
Au – Aubergine
Ba – Barley
Be – Bean
Bg – Bermudagrass
Ca – Cabbage
Ch – Chrysanthimum
Co – Cotton
Cu – Cucumber
Pe – Pepper
Ro – Rose
Ry – Ryegrass
So – Sobean
To - Tomato
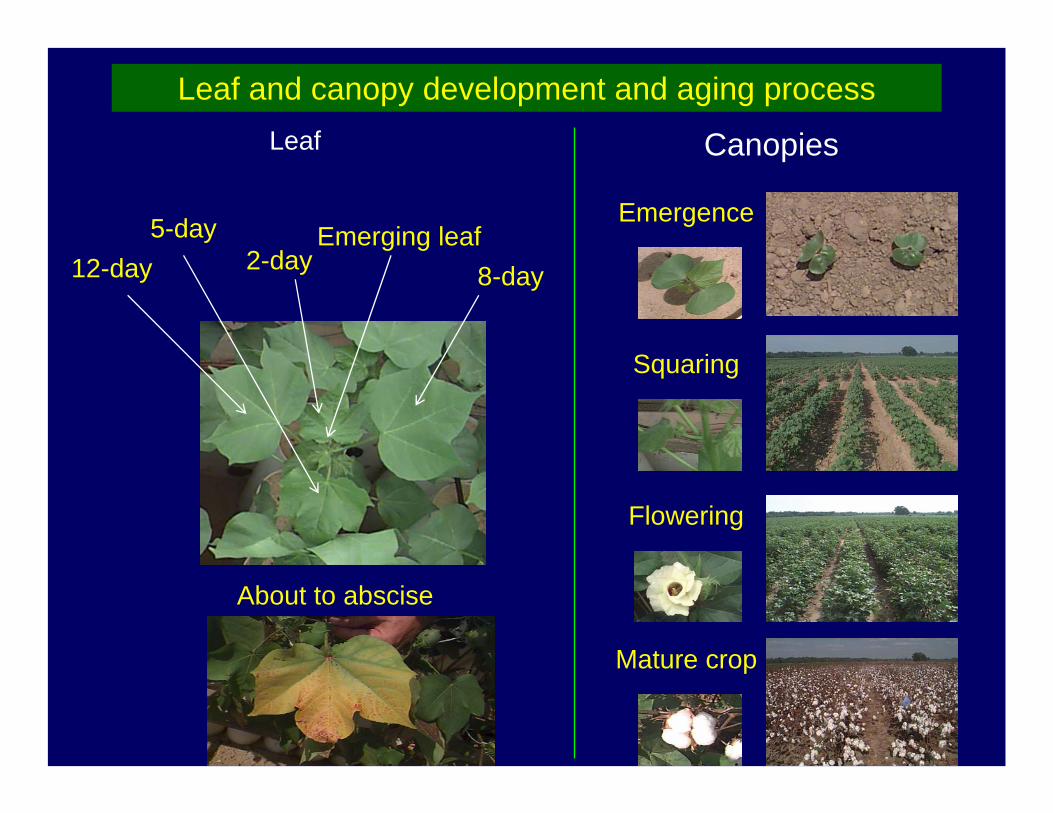
Canopies
Emergence
Squaring
Flowering
Mature crop
Emerging leaf2-day 8-day
5-day12-day
About to abscise
Leaf
Leaf and canopy development and aging process
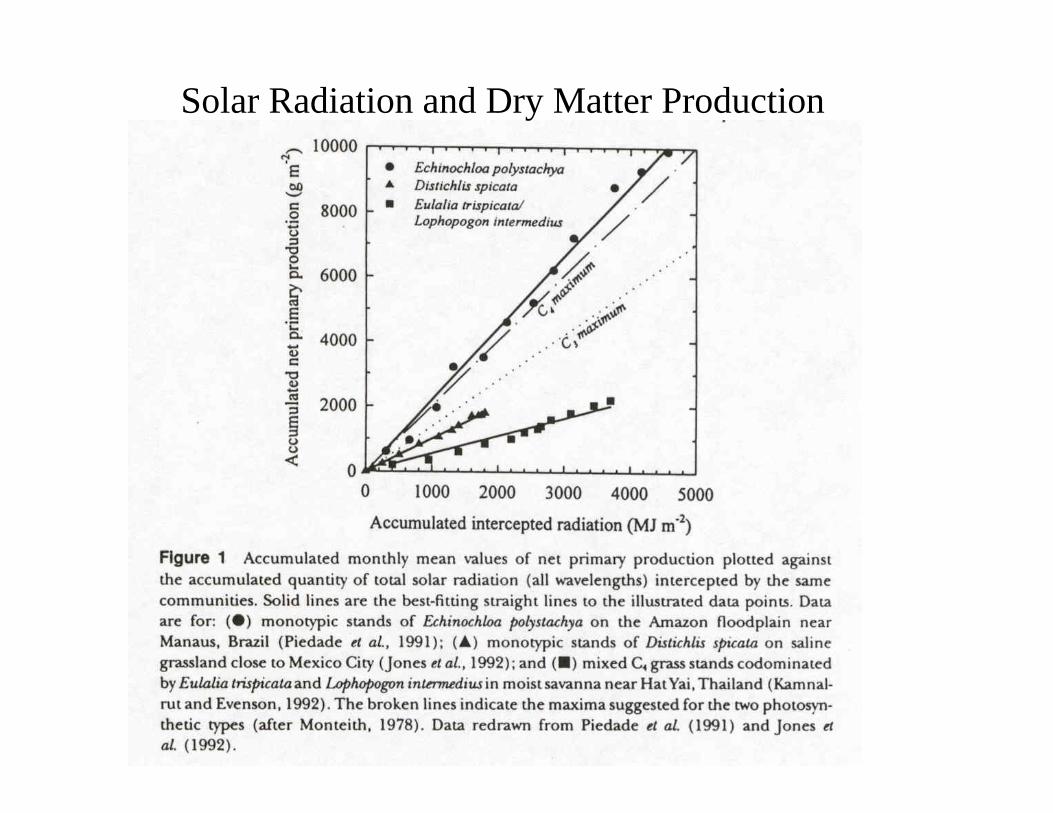
Solar Radiation and Dry Matter Production
Effects of Multiple Environmental Factors on Crop Growth and Developmental Aspects
• Introduced Environmental Productivity Index (EPI) concept.
• Photosynthesis
• Crop Phenology or Development
• Crop Growth
• Reproductive Biology

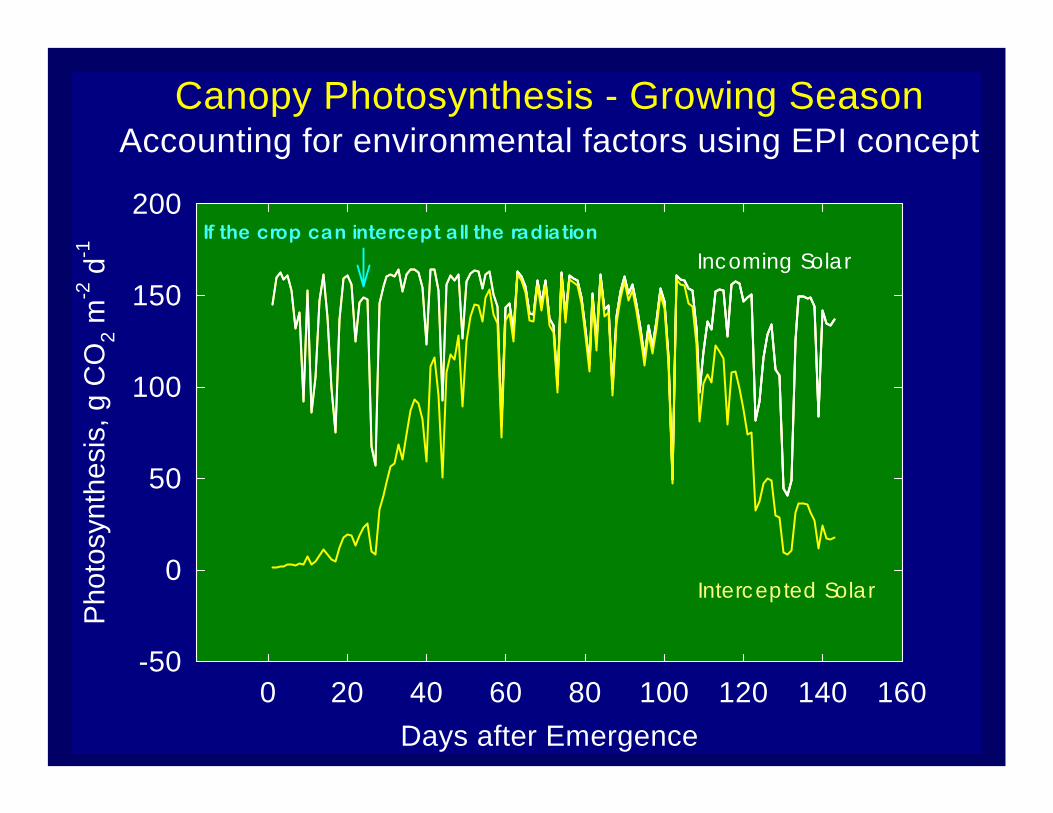
Canopy Photosynthesis - Growing SeasonAccounting for environmental factors using EPI concept
Days after Emergence0 20 40 60 80 100 120 140 160
Pho
tosy
nthe
sis,
g C
O2 m
-2 d
-1
-50
0
50
100
150
200If the crop can intercept all the radiation
Intercepted Solar
Incoming Solar
Canopy Photosynthesis - Growing SeasonAccounting for environmental factors using EPI concept
Days after Emergence0 20 40 60 80 100 120 140 160
Pho
tosy
nthe
sis,
g C
O2 m
-2 d
-1
-50
0
50
100
150
200If the crop can intercept all the radiation
Intercepted Solar
Incoming Solar

Canopy Photosynthesis - Growing SeasonAccounting for environmental factors using EPI concept
Days after Emergence0 20 40 60 80 100 120 140 160
Pho
tosy
nthe
sis,
g C
O2 m
-2 d
-1
-50
0
50
100
150
200
Incoming Solar Intercepted Solar (Potential) Potential * UV-BPotential * UV-B * TPotential * UV-B * T * LWP Potential * UV-B * T * LWP * NPotential * UV-B * T * LWP * N * K
If the crop ca n intercept a ll the ra dia tion
Inc oming Sola r
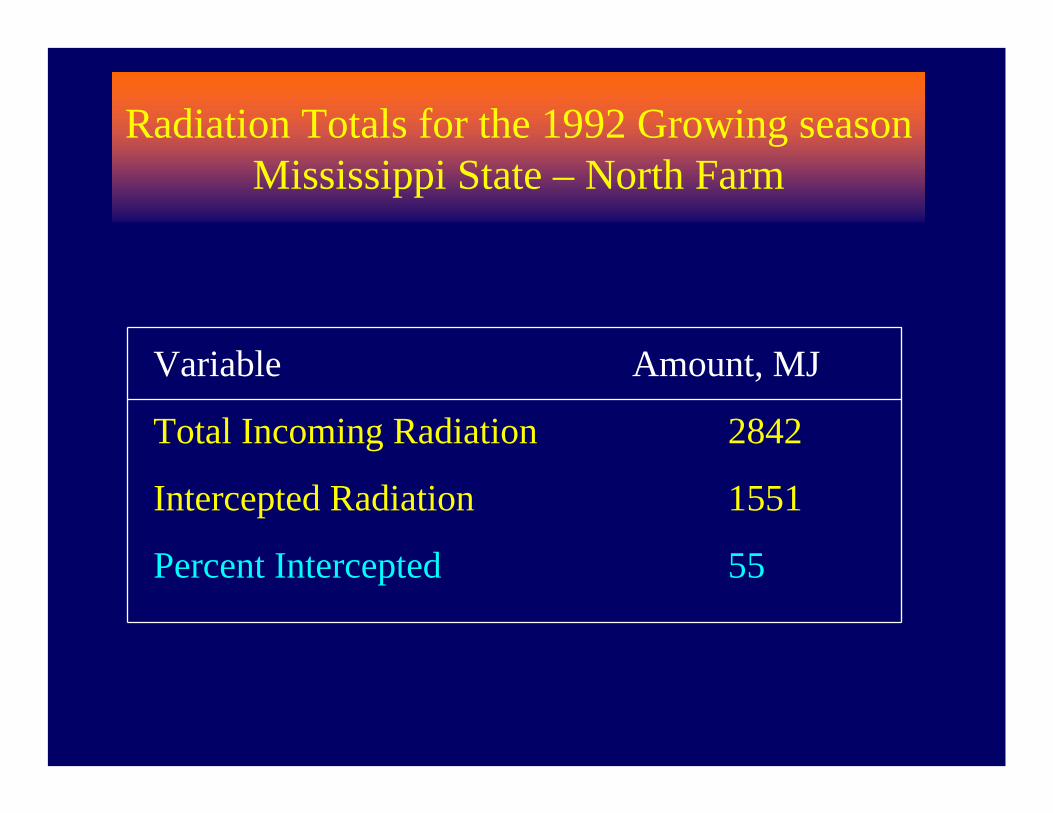
Variable Amount, MJ
Total Incoming Radiation 2842
Intercepted Radiation 1551
Percent Intercepted 55
Radiation Totals for the 1992 Growing seasonMississippi State – North Farm
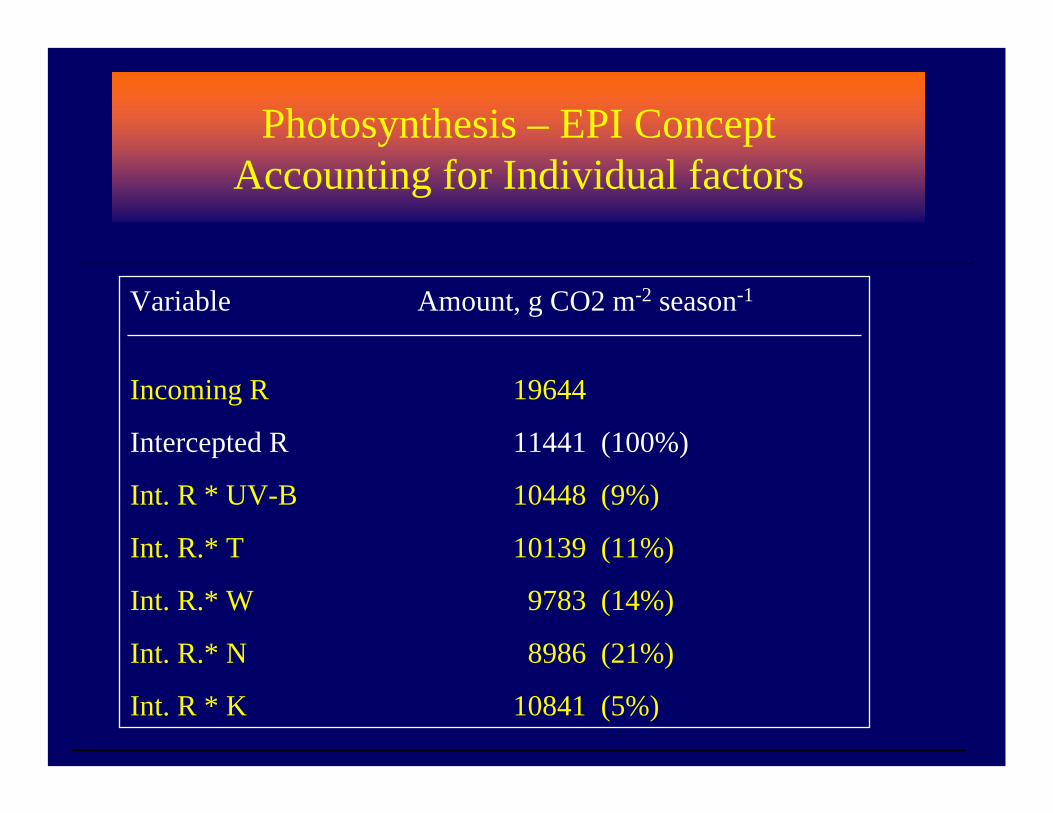
Variable Amount, g CO2 m-2 season-1
Incoming R 19644
Intercepted R 11441 (100%)
Int. R * UV-B 10448 (9%)
Int. R.* T 10139 (11%)
Int. R.* W 9783 (14%)
Int. R.* N 8986 (21%)
Int. R * K 10841 (5%)
Photosynthesis – EPI ConceptAccounting for Individual factors

Photosynthesis – EPI ConceptAccounting for Multiple Factors
Actual amount
Variable Amount, g CO2 m-2 season-1
Incoming R 19644
Intercepted R 11441 (100%)
Int. R* UV-B 10230 (9%)
Int. R* UV-B*T 9153 (20%)
Int. R* UV-B*T*W 7551 (34%)
Int. R*UV-B*T*W*N 6292 (55%)
Int. R*UV-B*T*W* K 4576 (60%)
Environmental limiting crop growth, development and yield
Atmospheric Carbon DioxideSolar RadiationTemperatureWater (indirect)WindNutrients (N, P, K)Ozone, UV-B etc.,Growth Regulators

Day of the Year0 50 100 150 200 250 300 350
Tem
pera
ture
, °C
0
5
10
15
20
25
30
35
40
Phoenix, AZ
Stoneville, MS
Maros, Indonesia
Long-Term Average Temperatures
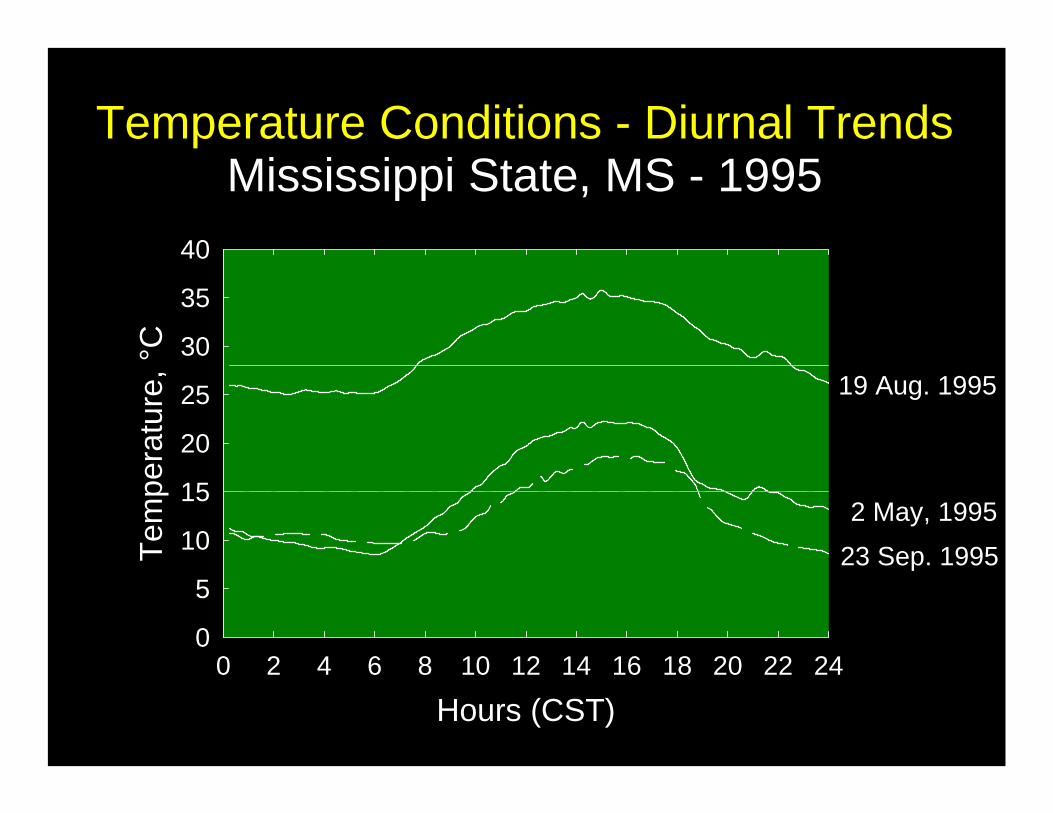
Temperature Conditions - Diurnal TrendsMississippi State, MS - 1995
Hours (CST)0 2 4 6 8 10 12 14 16 18 20 22 24
Tem
pera
ture
, °C
0
5
10
15
20
25
30
35
40
19 Aug. 1995
2 May, 1995
23 Sep. 1995

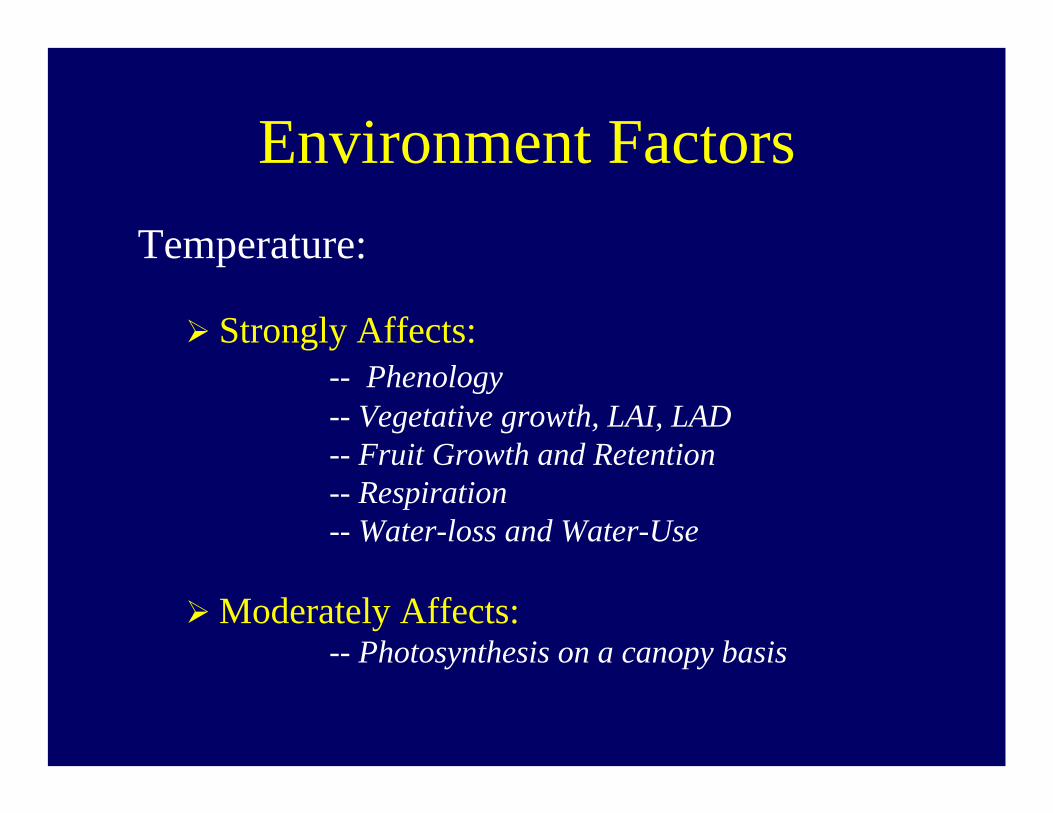
Environment FactorsTemperature:
Strongly Affects:-- Phenology-- Vegetative growth, LAI, LAD-- Fruit Growth and Retention-- Respiration-- Water-loss and Water-Use
Moderately Affects:-- Photosynthesis on a canopy basis
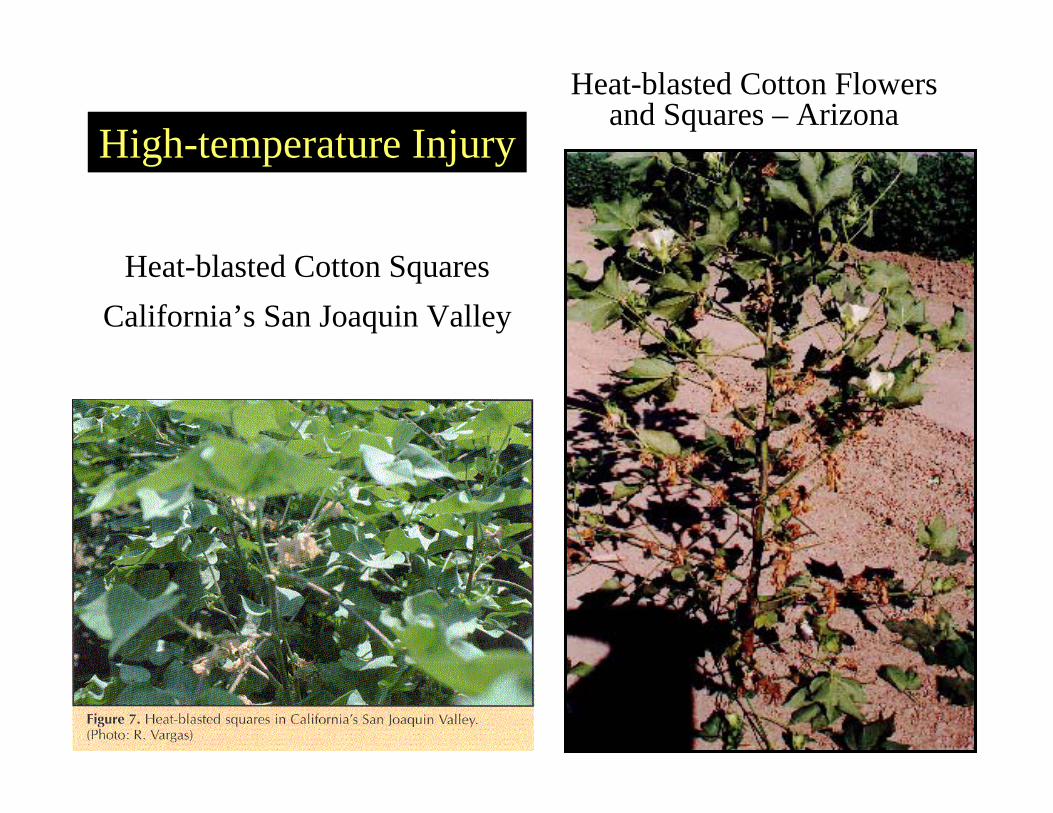
High-temperature Injury
Heat-blasted Cotton SquaresCalifornia’s San Joaquin Valley
Heat-blasted Cotton Flowers and Squares – Arizona
Environmental limiting crop growth, development and yield
Atmospheric Carbon DioxideSolar RadiationTemperatureWater (indirect)WindNutrients (N, P, K)Ozone, UV-B etc.,Growth Regulators
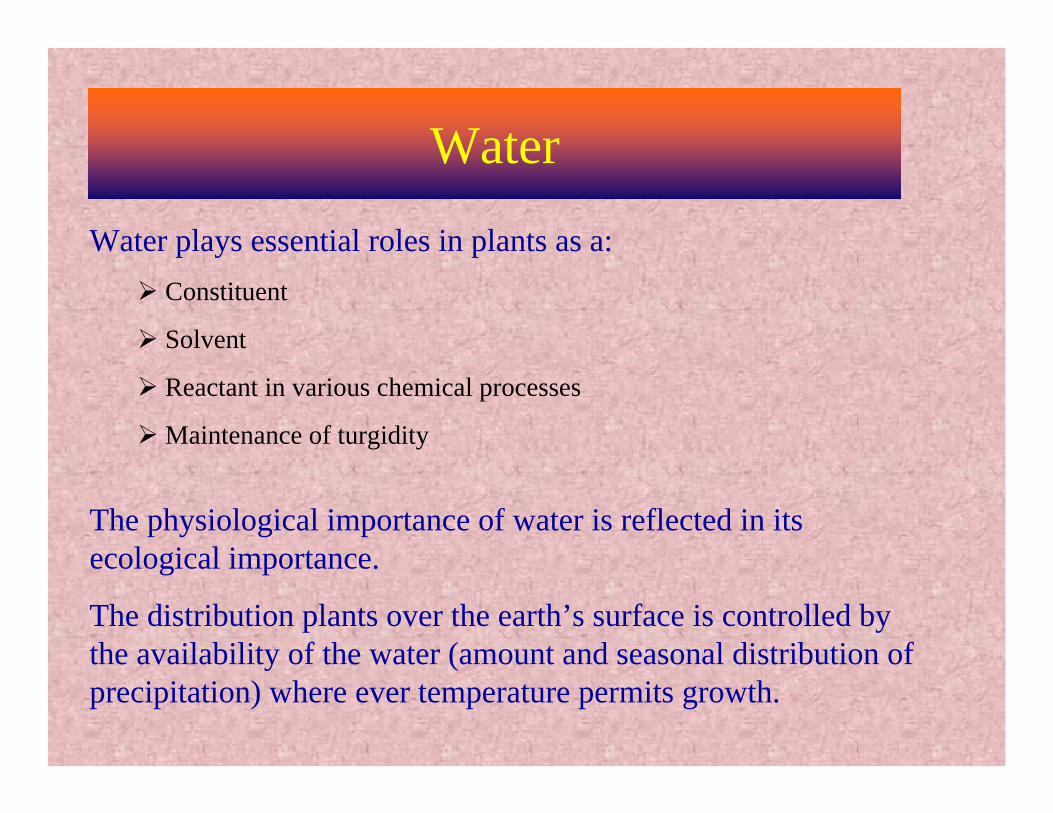
Water
Water plays essential roles in plants as a:Constituent
Solvent
Reactant in various chemical processes
Maintenance of turgidity
The physiological importance of water is reflected in its ecological importance.
The distribution plants over the earth’s surface is controlled by the availability of the water (amount and seasonal distribution of precipitation) where ever temperature permits growth.
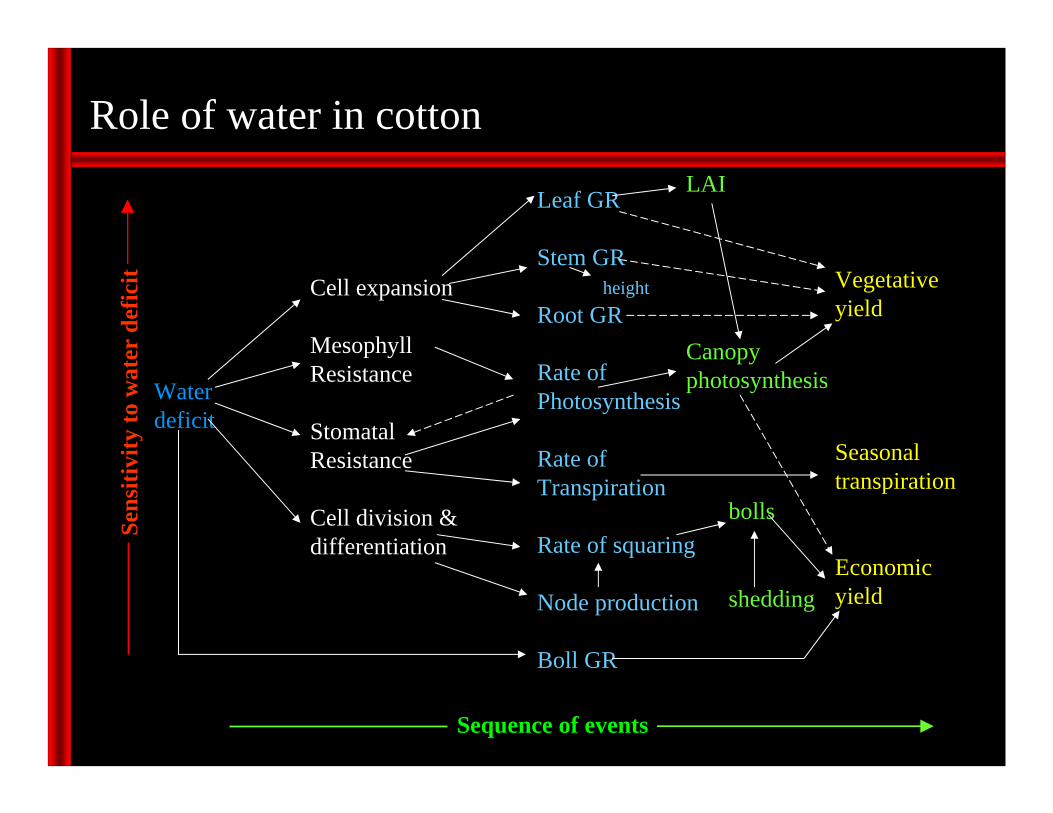
Role of water in cotton
Waterdeficit
Vegetativeyield
Seasonaltranspiration
Economic yield
Leaf GR
Stem GRheight
Root GR
Rate of Photosynthesis
Rate ofTranspiration
Rate of squaring
Node production
Boll GR
Cell expansion
MesophyllResistance
StomatalResistance
Cell division &differentiation
LAI
Canopyphotosynthesis
bolls
shedding
Sens
itivi
ty to
wat
er d
efic
it
Sequence of events
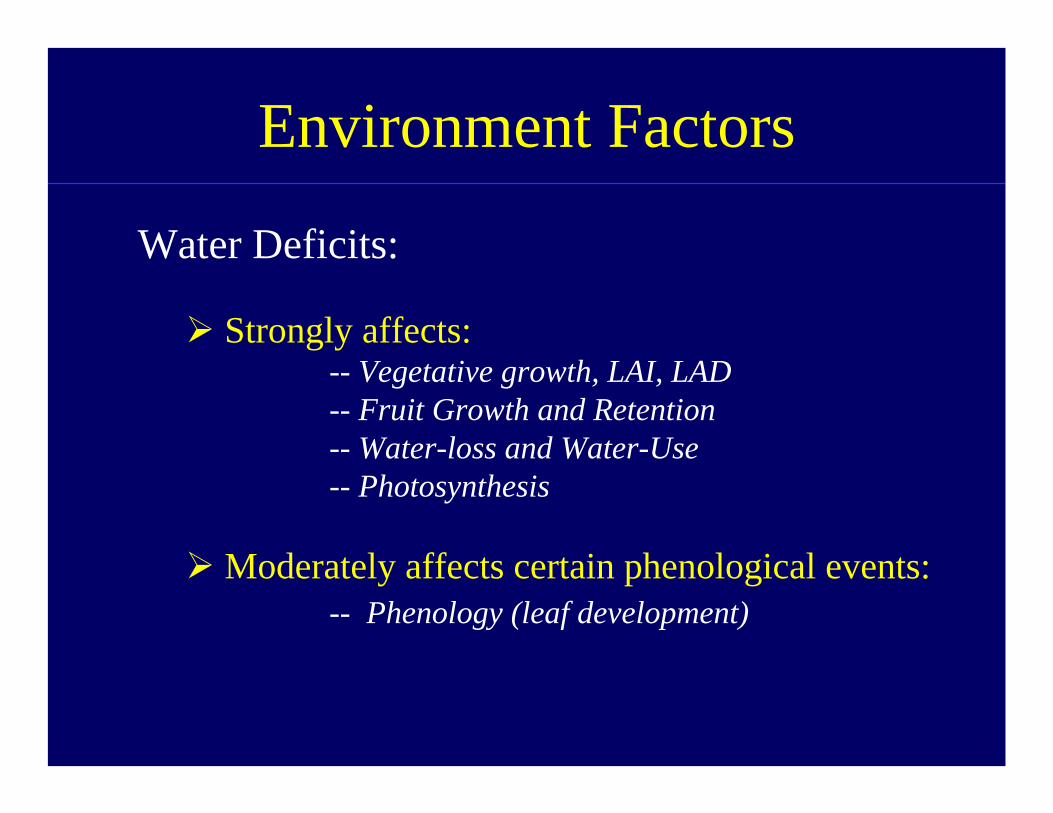
Environment Factors
Water Deficits:
Strongly affects:-- Vegetative growth, LAI, LAD-- Fruit Growth and Retention-- Water-loss and Water-Use-- Photosynthesis
Moderately affects certain phenological events:-- Phenology (leaf development)
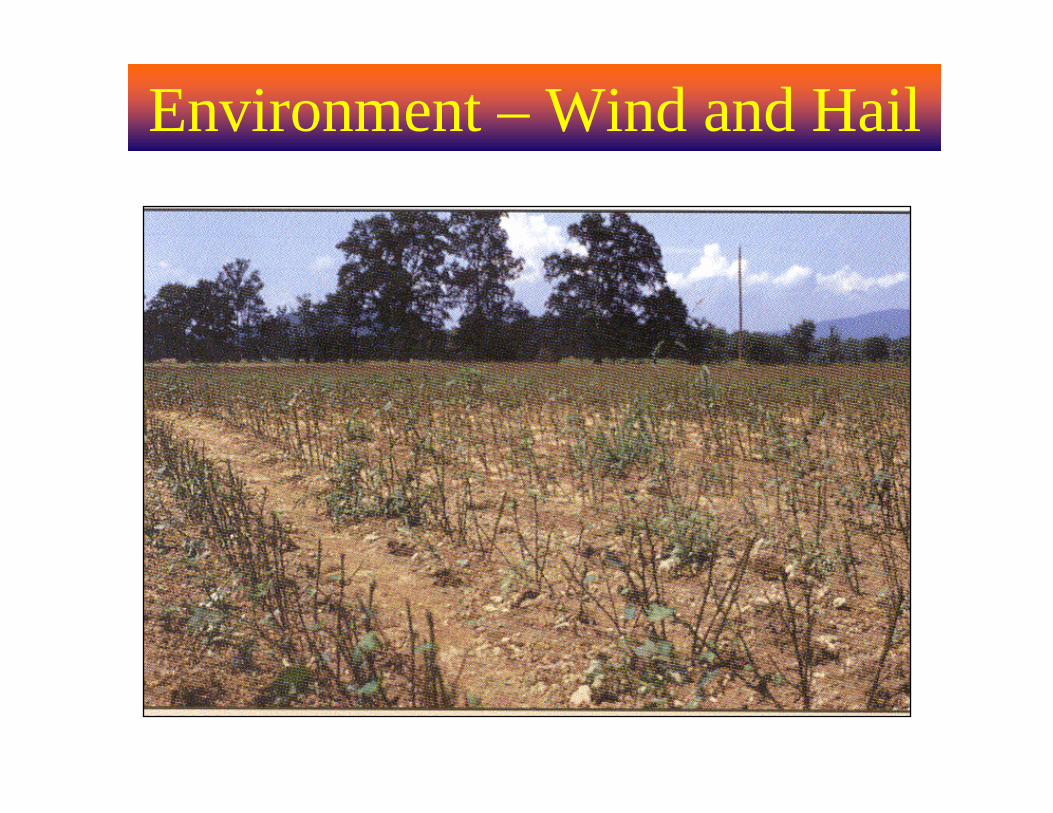
Environment – Wind and Hail
Environmental limiting crop growth, development and yield
Atmospheric Carbon DioxideSolar RadiationTemperatureWater (indirect)WindNutrients (N, P, K)Ozone, UV-B etc.,Growth Regulators

Photosynthesis - Variability Among SpeciesResponse to Leaf Nitrogen
Leaf Nitrogen, g m-20.0 0.5 1.0 1.5 2.0 2.5 3.0 3.5
Pho
tosy
nthe
sis,
mg
CO
2 m
-2 s
-1
0
1
2
3
Maize
CottonSunflowerRiceSoybean
Sorghum

Leaf Nitrogen, g m-2 leaf area
1.00 1.25 1.50 1.75 2.00 2.25 2.50
Env
ironm
enta
l Pro
duct
ivity
Idic
es fo
r Nitr
ogen
0.0
0.2
0.4
0.6
0.8
1.0
1.2
Leaf Growth
Leaf Development
Stem Growth
Photosynthesis
Environment - Nitrogen

Environment - NitrogenParameter Percent Reduction from the Optimum (2.5 g N/m-2 or 4.5%)
Leaf N, g m-2 Photosynthesis Stem growth Leaf growth Leaf Development
2.5 100 100 100 100
2.0 12 14 18 12
1.5 53 60 >99 68
1.2 76 -- -- --

Environment - Nitrogen
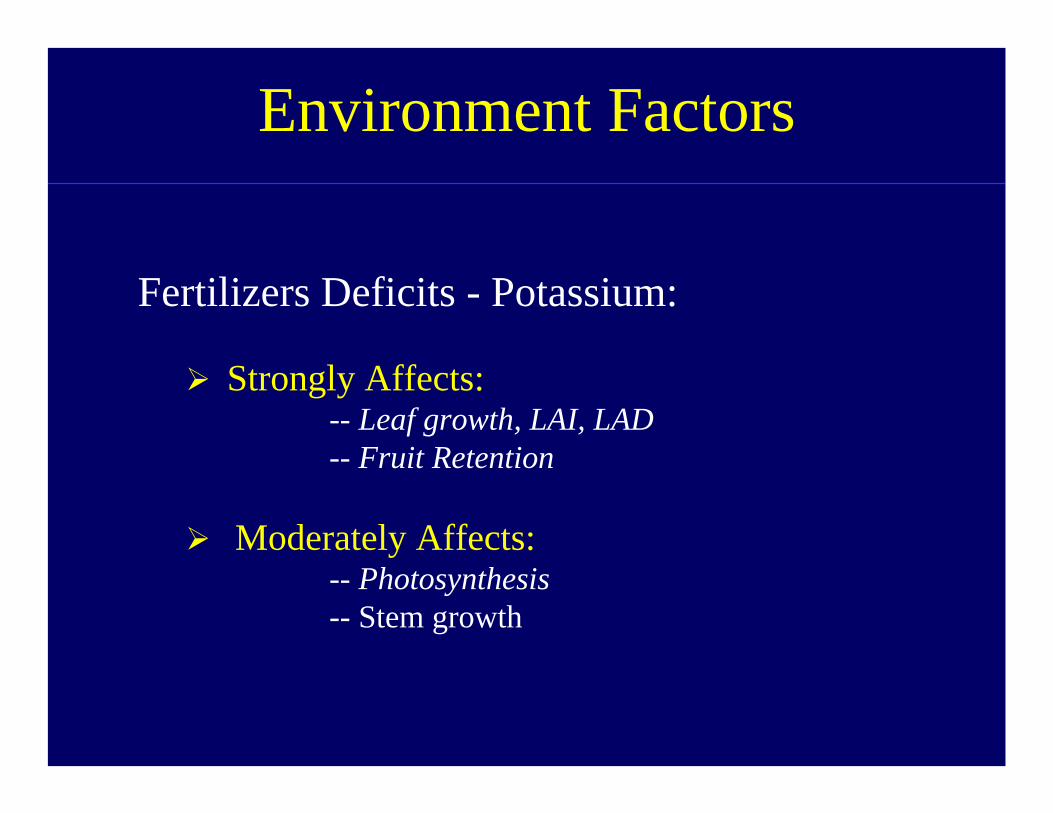
Environment Factors
Fertilizers Deficits - Potassium:
Strongly Affects:-- Leaf growth, LAI, LAD-- Fruit Retention
Moderately Affects:-- Photosynthesis -- Stem growth
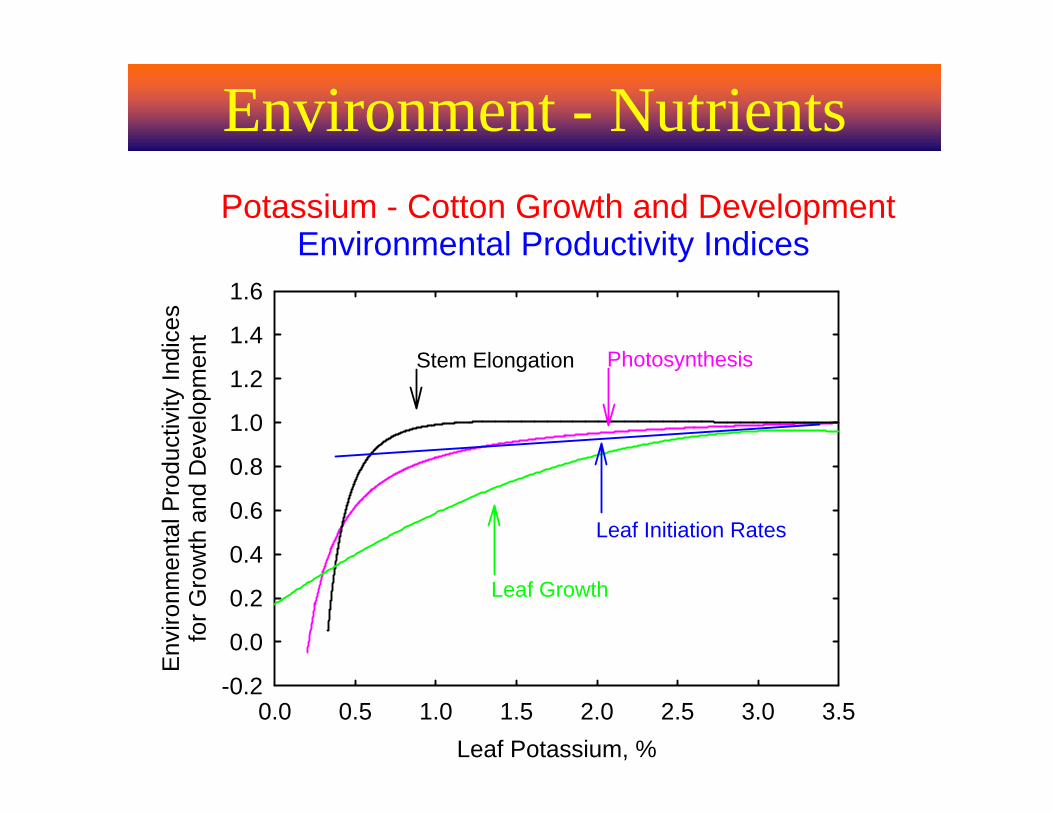
Environment - NutrientsPotassium - Cotton Growth and Development
Environmental Productivity Indices
Leaf Potassium, %0.0 0.5 1.0 1.5 2.0 2.5 3.0 3.5
Env
ironm
enta
l Pro
duct
ivity
Indi
ces
for G
row
th a
nd D
evel
opm
ent
-0.2
0.0
0.2
0.4
0.6
0.8
1.0
1.2
1.4
1.6
Leaf Growth
Stem Elongation Photosynthesis
Leaf Initiation Rates

Environment Factors
Ultraviolet-B Radiation:
Strongly Affects:-- Photosynthesis-- Stem growth
Moderately Affects:-- Leaf growth-- Leaf aging
No Effects:-- Phenology
Environmental limiting crop growth, development and yield
Atmospheric Carbon DioxideSolar RadiationTemperatureWater (indirect)WindNutrients (N, P, K)Ozone, UV-B etc.,Growth Regulators
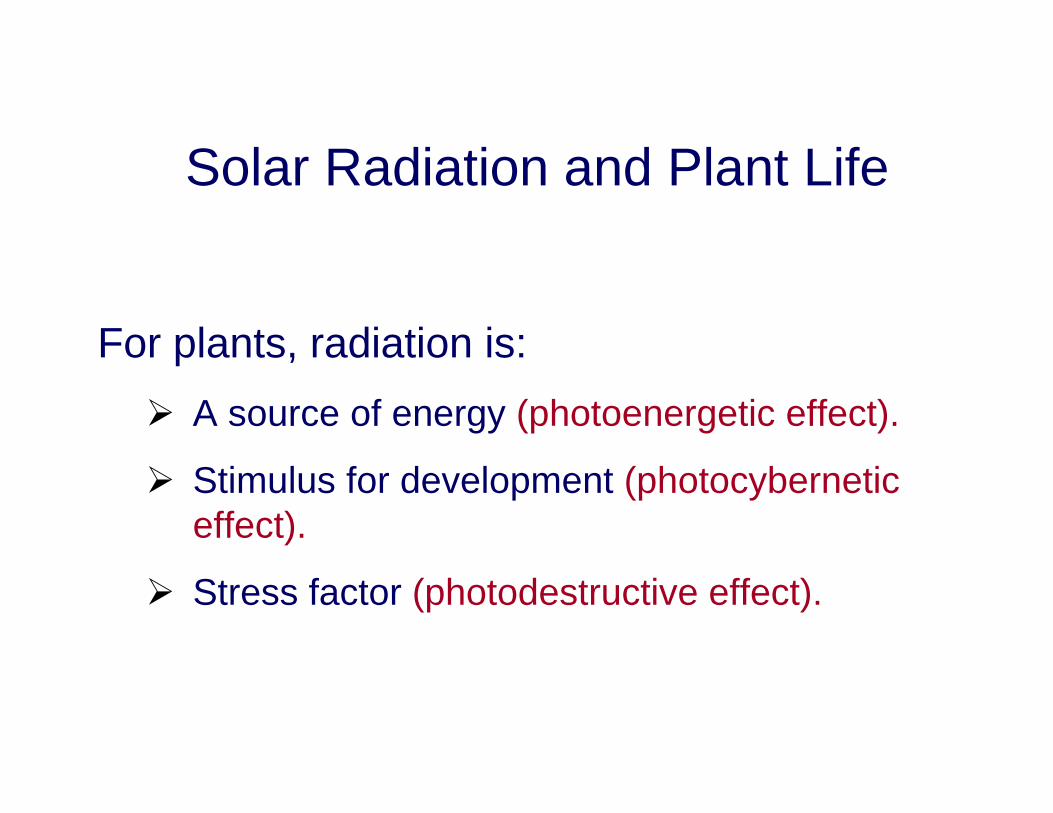
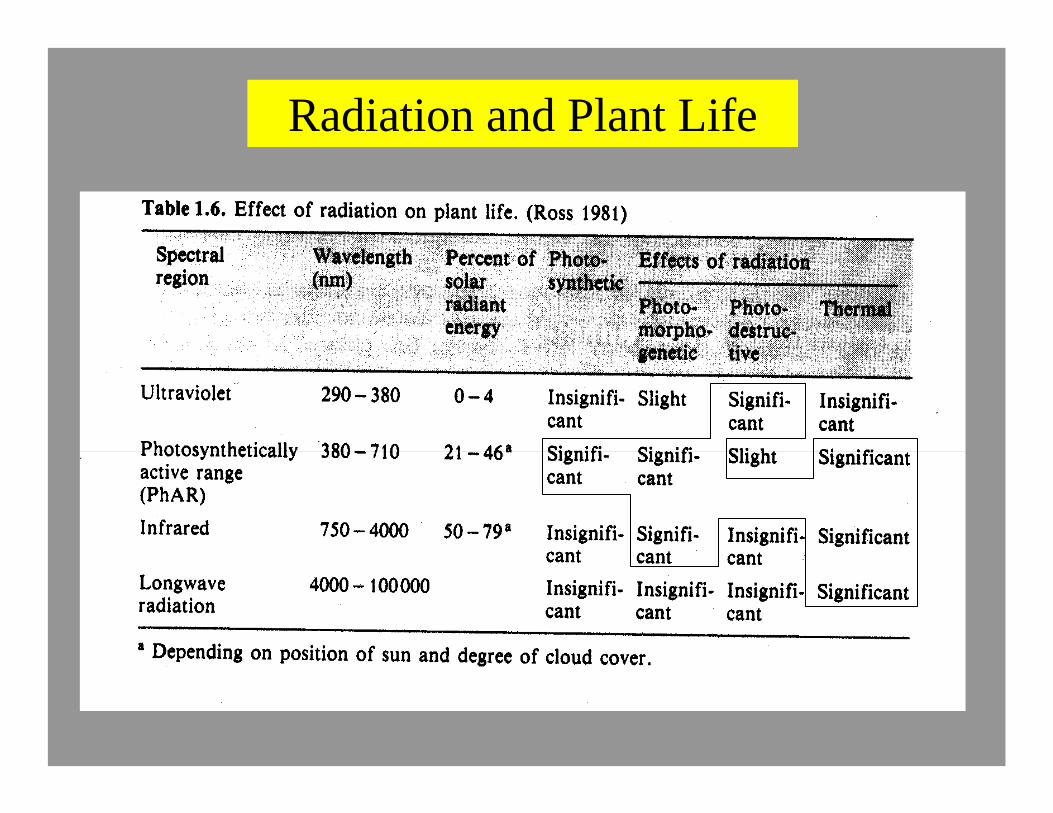
For plants, radiation is:A source of energy (photoenergetic effect).
Stimulus for development (photocyberneticeffect).
Stress factor (photodestructive effect).
Solar Radiation and Plant Life
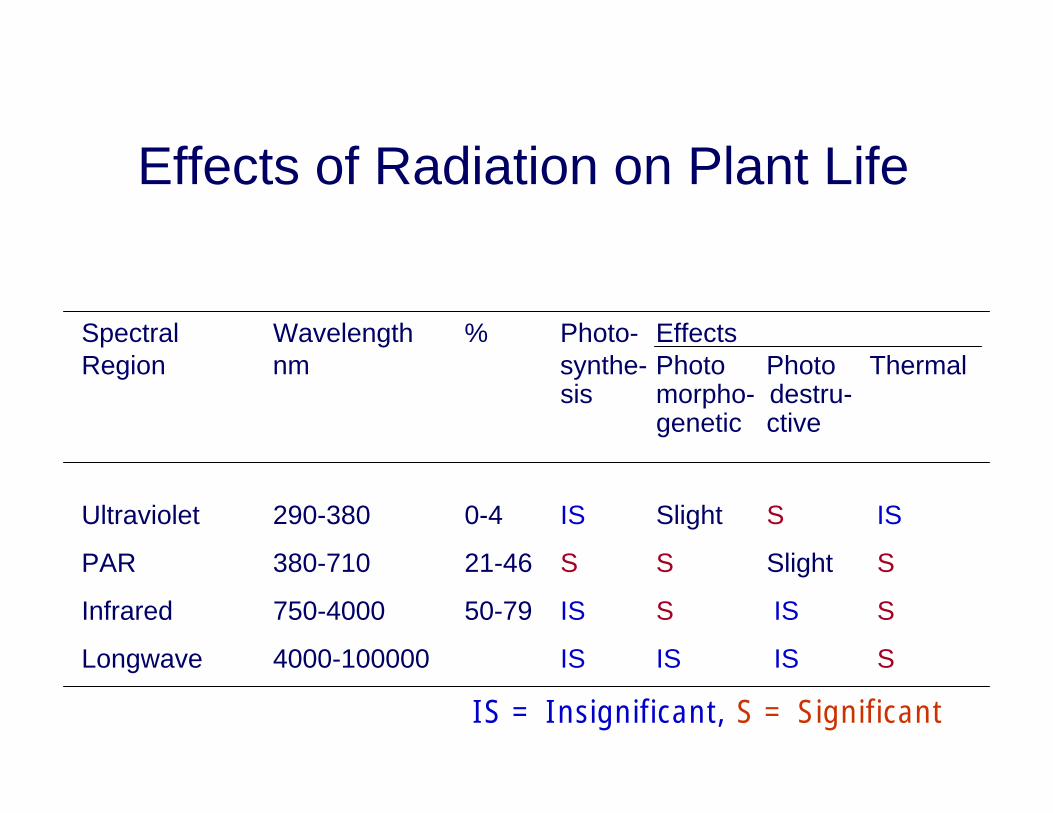
Effects of Radiation on Plant Life
Spectral Wavelength % Photo- EffectsRegion nm synthe- Photo Photo Thermal
sis morpho- destru-genetic ctive
Ultraviolet 290-380 0-4 IS Slight S IS
PAR 380-710 21-46 S S Slight S
Infrared 750-4000 50-79 IS S IS S
Longwave 4000-100000 IS IS IS S
IS = Insignificant, S = Significant
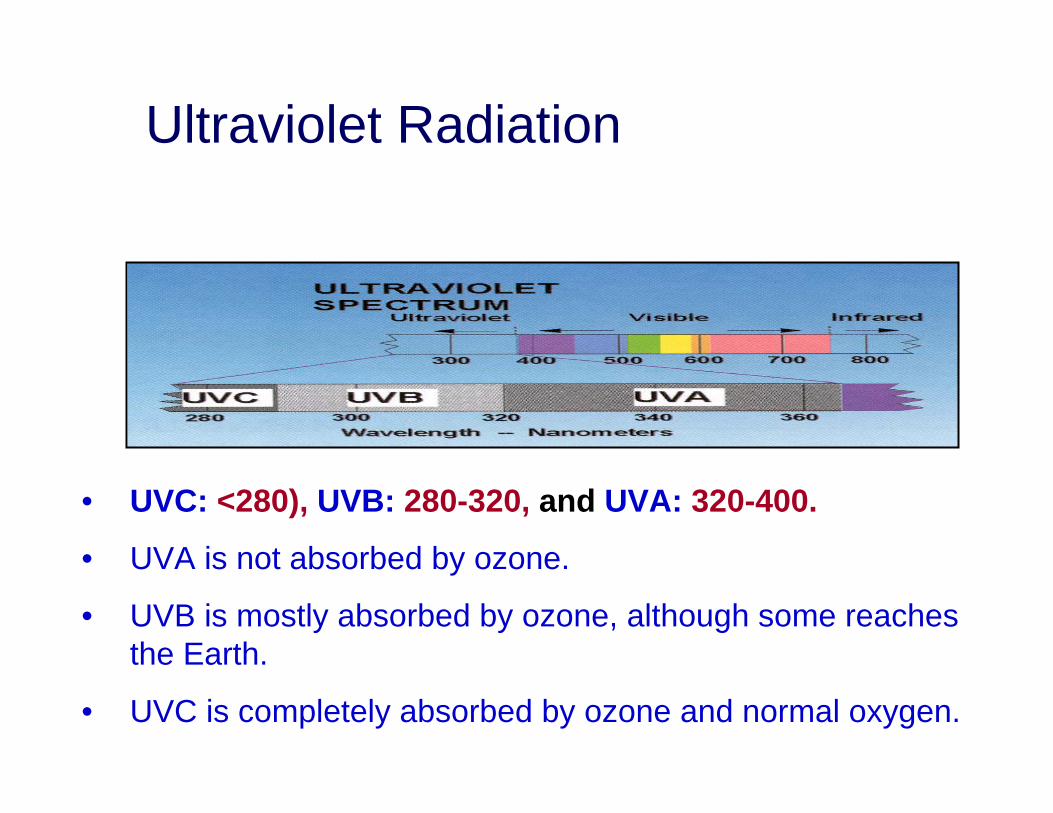
Ultraviolet Radiation
• UVC: <280), UVB: 280-320, and UVA: 320-400.
• UVA is not absorbed by ozone.
• UVB is mostly absorbed by ozone, although some reaches the Earth.
• UVC is completely absorbed by ozone and normal oxygen.
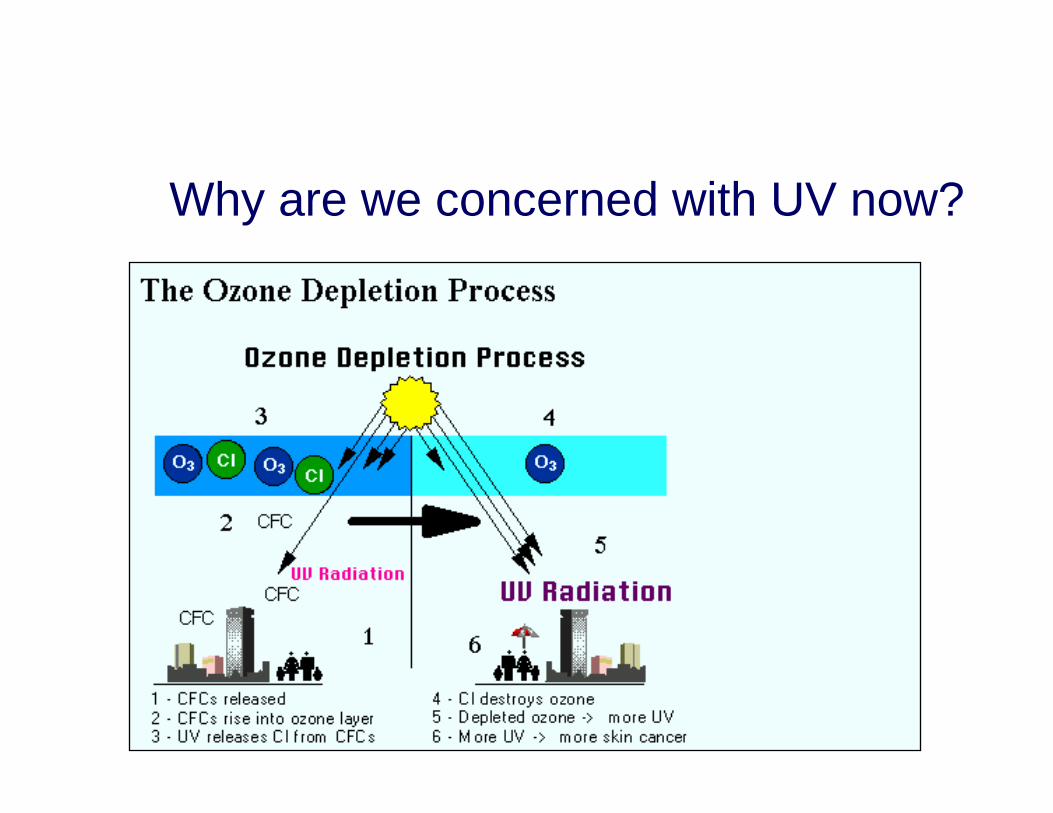
Why are we concerned with UV now?
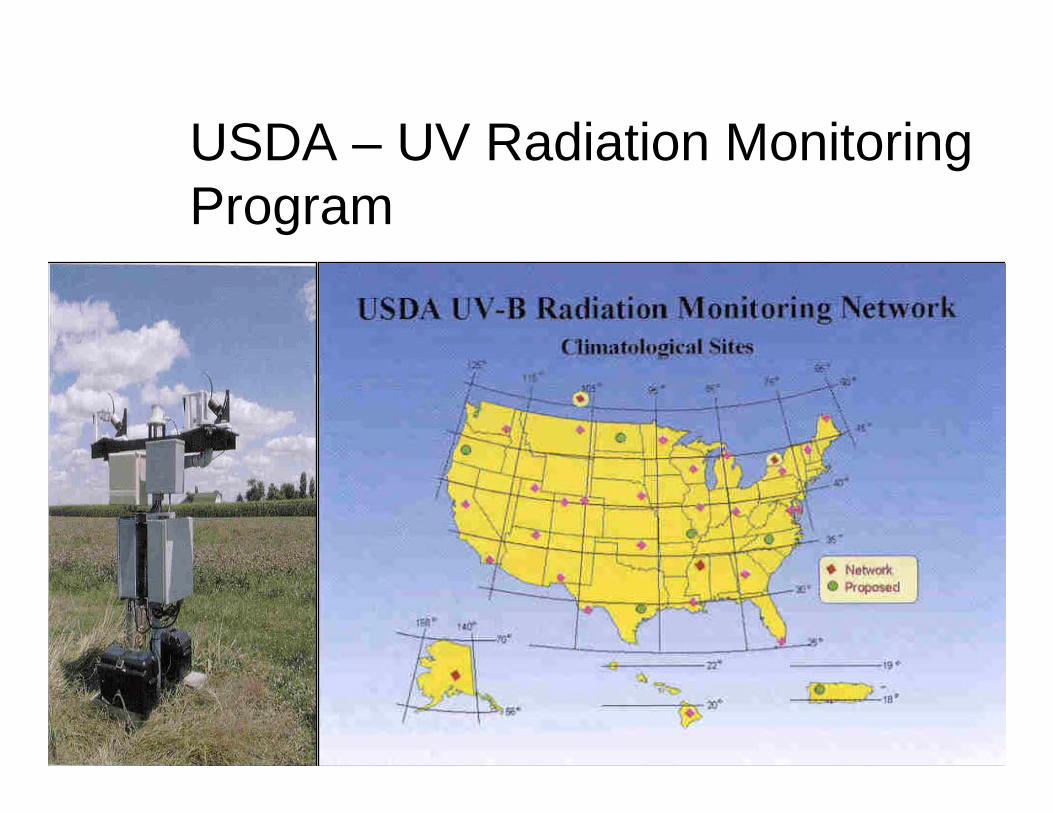
USDA – UV Radiation Monitoring Program

Satellite Based Ozone levels - 2001

Satellite Based UV Radiation levels - 2001

UV-B Radiation – Growth EPI Factors for various growth Processes
Squaring to flowering
Emergence to squaring
First fruit position
0
1
2
3
4
5
6
7
-4 0 4 8 12 16 20
UV-B treatment (kJ m-2 d-1)
Firs
t fru
it po
sitio
n on
mai
nste
m
10
15
20
25
30
Dur
atio
n (d
)
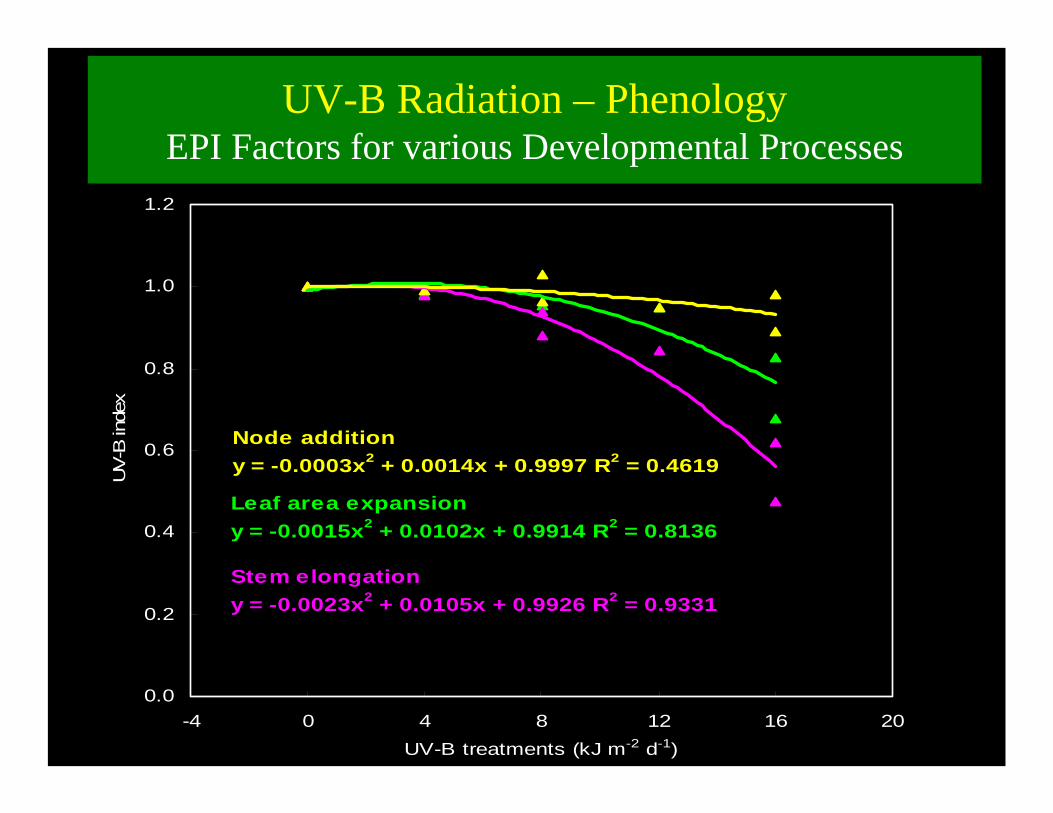
Stem elongation y = -0.0023x2 + 0.0105x + 0.9926 R2 = 0.9331
Leaf area expansion y = -0.0015x2 + 0.0102x + 0.9914 R2 = 0.8136
Node additiony = -0.0003x2 + 0.0014x + 0.9997 R2 = 0.4619
0.0
0.2
0.4
0.6
0.8
1.0
1.2
-4 0 4 8 12 16 20UV-B treatments (kJ m-2 d-1)
UV-B
inde
xUV-B Radiation – Phenology
EPI Factors for various Developmental Processes
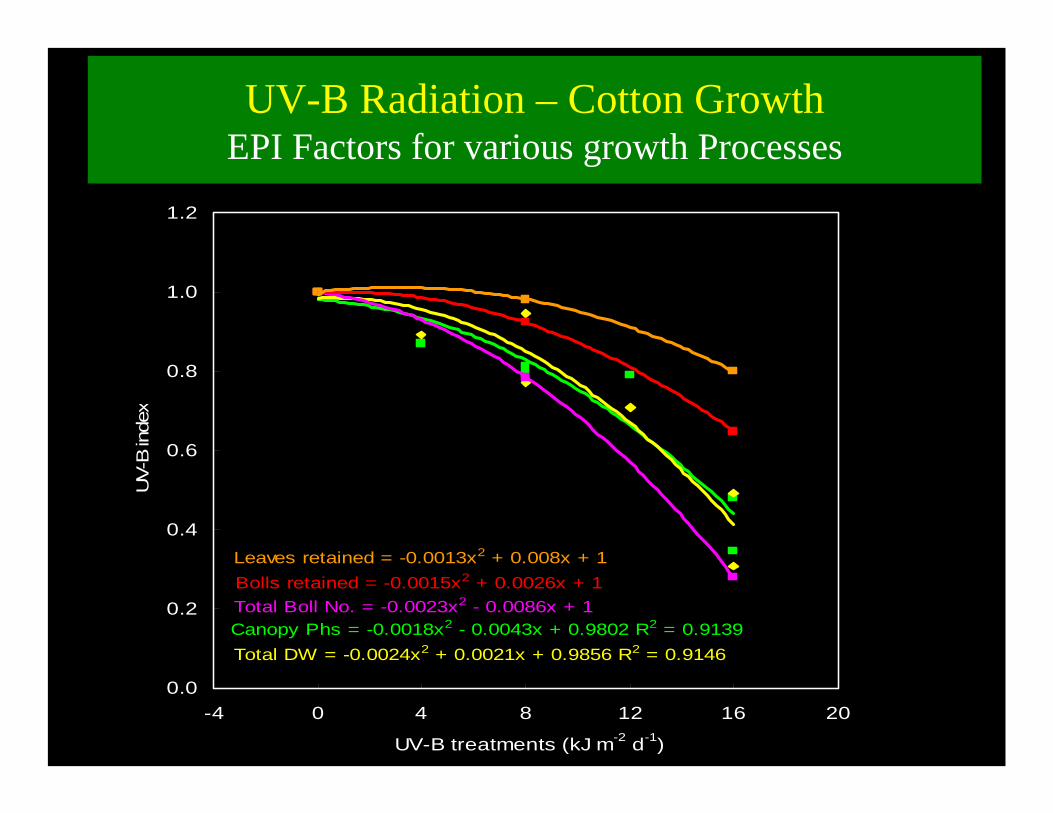
UV-B Radiation – Cotton Growth EPI Factors for various growth Processes
Canopy Phs = -0.0018x2 - 0.0043x + 0.9802 R2 = 0.9139Total DW = -0.0024x2 + 0.0021x + 0.9856 R2 = 0.9146
Total Boll No. = -0.0023x2 - 0.0086x + 1Bolls retained = -0.0015x2 + 0.0026x + 1Leaves retained = -0.0013x2 + 0.008x + 1
0.0
0.2
0.4
0.6
0.8
1.0
1.2
-4 0 4 8 12 16 20
UV-B treatments (kJ m-2 d-1)
UV-
B in
dex

Environmental limiting crop growth, development and yield
Atmospheric Carbon DioxideSolar RadiationTemperatureWater (indirect)WindNutrients (N, P, K)Ozone, UV-B etc.,Growth Regulators

Environment Factors
Growth Regulators - Mepiquat Chloride (PIX):
Moderately Affects:-- Leaf, stem and branch growth and LAI
Slightly Affects:-- Photosynthesis

Mepiquat Chloride (PIX) - GrowthEPI Factors
Mepiquat Chloride, mg g-1 dry weight
0.00 0.01 0.02 0.03
PIX
and
EP
I Ind
ices
0.0
0.2
0.4
0.6
0.8
1.0
1.2
Leaf growth
Photosynthesis
Stem growth

Environmental Plant Physiologyand Remote Sensing
• Special topicsRemote sensing
Introduction to remote sensingInterrelationships between stress physiology, crop growth condition and remote sensing signatures.
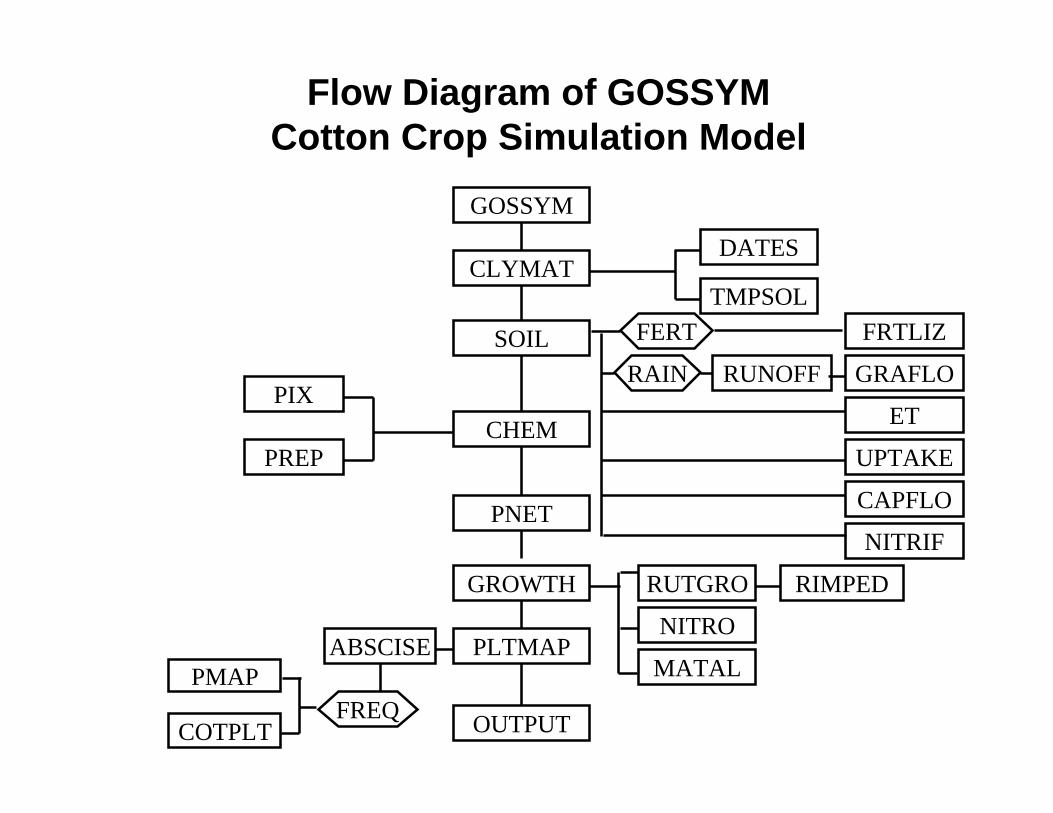
Flow Diagram of GOSSYMCotton Crop Simulation Model
PMAP
COTPLT
GOSSYM
CLYMAT
SOIL
CHEM
PNET
GROWTH
PLTMAP
OUTPUT
PIX
PREP
RUTGRO
NITRO
MATAL
DATES
TMPSOLFRTLIZ
ET
UPTAKE
CAPFLO
NITRIF
RIMPED
ABSCISE
FREQ
RAIN
FERT
RUNOFF GRAFLO

Technology Fusion and Delivery System
Crop Models GIS
Related database
Environmental Plant Physiology and Crop Modeling
• Modeling forces the organization of known information and concepts.
• Although we may not know enough to develop a comprehensive model that includes all aspects of the farm or crop production system, modeling some meaningful portions of the system provides clarity.
• For a model to correctly predict plant responses to physical conditions, the concepts and the response functions must be appropriately assembled.

• Critical environment-genotype relations should be incorporated into the model.
• When a crop model is based on appropriate concepts and processes it will have the predictive capability in new environments, and can be used either alone or with other emerging newer technologies to disseminate useful production information.
• Also, crop models should be integrated with other related technologies for technology integration and delivery.
Environmental Plant Physiology, Crop Modeling, and Technology Integration for Decision Support System
• To study the effects of environmental factors on growth, development and other processes, we need:
Controlled environmental facilities with realistic environmental conditions including solar radiation.
Breakdown whole systems into sub-systems and study the influence of environmental factors on those subsystems.
Develop some concepts such as EPI to quantify the effects of multiple environmental factors on subsystems.
Integrate sub-systems into coherent whole plant/field/ecosystem system-level models/tools.
Environmental Plant PhysiologySummary and Conclusions

• Validated/integrated system simulation models will be useful:
To test hypothesis.
To understand multiple environmental effects or interactions.
For resources management at the filed-level.
For resource management to assist policy decisions.
As an educational tool to understand the effects of environment/management effects on crop functioning.
For impact assessment of climate change on cop production systems across regions and nations.
Environmental Plant PhysiologySummary and Conclusions
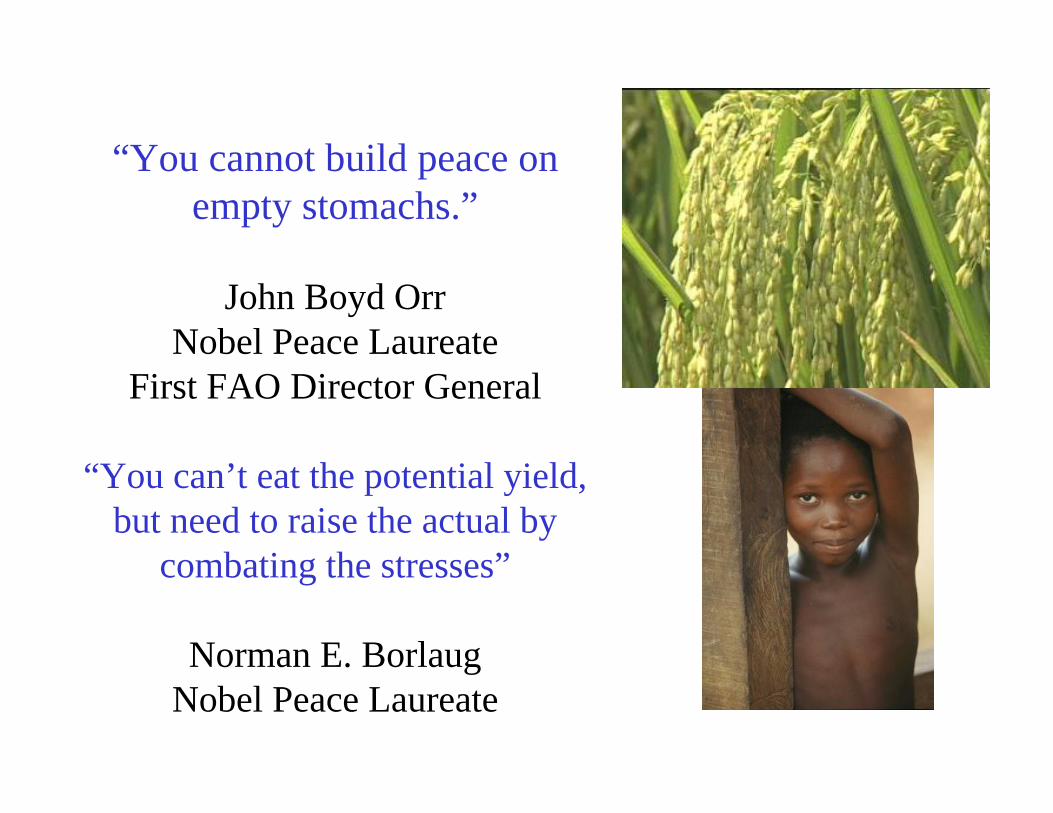
“You cannot build peace on empty stomachs.”
John Boyd OrrNobel Peace Laureate
First FAO Director General
“You can’t eat the potential yield, but need to raise the actual by
combating the stresses”
Norman E. BorlaugNobel Peace Laureate


