experience clarity //
CPAs & ADVISORS
FRAUD TRENDS AND DETECTION: AN UPDATEShauna Woody-Coussens, CFEManaging Director – Forensic & Valuation Services
COST OF INSURANCE FRAUD
Nearly $80 billion in fraudulent claims made in the US annually1
May be a conservative figure as much insurance fraud goes undetected and unreportedFraudulent claims estimated to increase the average household’s insurance costs by more than $300 per year
After narcotics trafficking, insurance fraud is the largest criminal enterprise in the US2
Insurance fraud is the 2nd most costly white-collar crime in US, behind tax evasion3
1 Coalition Against Insurance Fraud estimate2 Property Casualty 3603 National Insurance Crime Bureau
2 // experience clarity
DATA ANALYTICS AND THE INSURANCE INDUSTRY
Traditional and recent usesActuarial risk analysisBehavior-based credit scores as an enhancement to personal auto insurance underwritingPredictive and optimization models in business processes such as sales, marketing and service
3 // experience clarity
MY GOAL TODAY…
Convince you to use data analytics within your organization to help you prevent and detect occupational fraud
4 // experience clarity
OCCUPATIONAL FRAUD TRENDS
5 // experience clarity
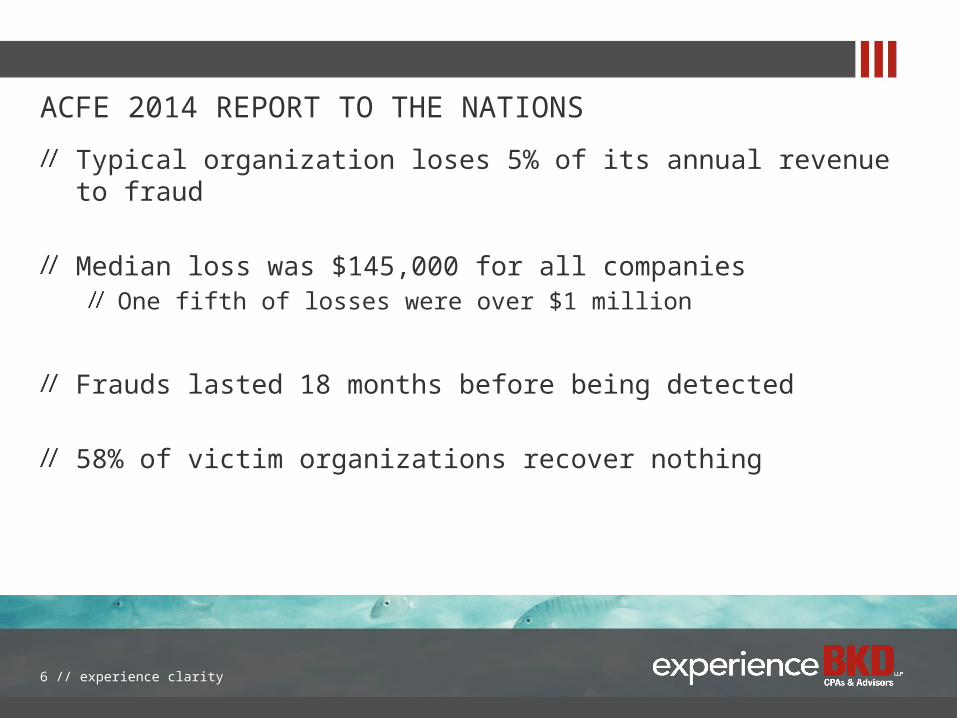
ACFE 2014 REPORT TO THE NATIONS
Typical organization loses 5% of its annual revenue to fraud
Median loss was $145,000 for all companiesOne fifth of losses were over $1 million
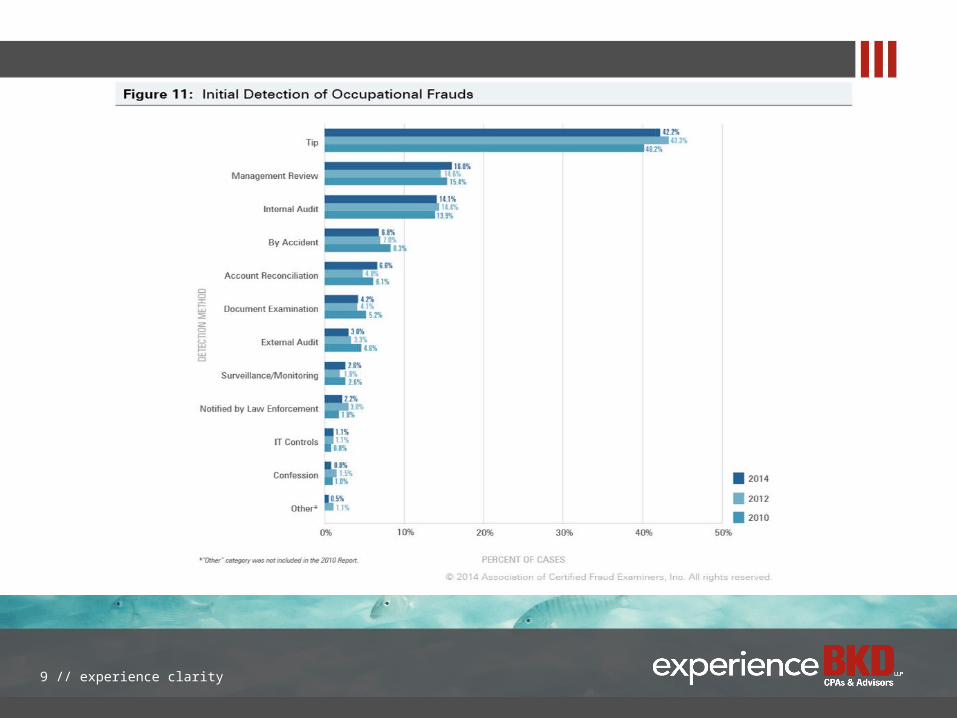
Frauds lasted 18 months before being detected
58% of victim organizations recover nothing
6 // experience clarity
7 // experience clarity
8 // experience clarity
9 // experience clarity
10 // experience clarity
11 // experience clarity
12 // experience clarity
Answer questions through use of analytical softwareAs simple as Excel
Filter Sort
As complex as you want to make itACLIDEASQL
DATA ANALYTICS
13 // experience clarity
WHAT’S THE BIG DEAL?
“Big Data” nightmare – we need helpManual review is inefficientSuspicious activity is a 96.5% match to normal, so you are less likely to notice it through a manual reviewSampling does not reveal patterns & trendsSystem weaknesses lead to fraudSo… even if no fraud is evident, weaknesses are often uncovered that can be corrected to help mitigate fraud
14 // experience clarity
APPLICATIONS IN THE INSURANCE INDUSTRY
15 // experience clarity
CorruptionBillingExpense reimbursement
Non-cashPayroll
TOP OCCUPATIONAL FRAUD SCHEMES IN THE INSURANCE INDUSTRY
16 // experience clarity
17
Corruption
CORRUPTION
An employee misuses his or her influence in a business transaction in a way that violates his or her duty to the employer in order to gain a direct or indirect benefit In my experience, the most common form of corruption is the payment of kickbacks to related to purchases
18 // experience clarity
CORRUPTION EXAMPLE
Insurance agent colluded with an auto glass vendor to bill for OEM glass replacement when wrecking yard glass often used
Data mining pointed out unusual level of OEM glass pricing for that vendor Loss was $500,000
19 // experience clarity
RED FLAGS FOR CORRUPTION
Off-book fraud, so very hard to detectPayments often do not go through the organization’s accounting recordsPayments often paid in cash
Look for “behavioral” red flagsRapidly increasing purchases from one vendorExcessive purchases of goods and servicesToo close of a relationship with a vendor
20 // experience clarity
Compare order quantity to optimal reorder quantityCompare purchase volumes/prices from like vendorsCompare quantities ordered and receivedCheck for inferior goods (# of returns by vendor)Unstructured data review (read suspected fraudster’s email….)
DATA ANALYTICS FOR CORRUPTION
21 // experience clarity
22
Billing Schemes
Fraudster creates false support for a fraudulent purchase, causing the nonprofit to pay for goods or services that are nonexistent, overpriced or unnecessary
Invoicing via shell companyInvoicing via an existing vendor
False invoicing for non-accomplice vendorsPay-and-return schemes
Personal purchases with nonprofit’s funds
BILLING SCHEMES
23 // experience clarity
BILLING FRAUD EXAMPLE
Employee set up fictitious vendors to bill employer for purchases never made
Employee made repeated purchases in the amount of $24,950 when his sole authority was $25,000Loss was $2.2 million over a 2 year period
24 // experience clarity
Vendor anomaliesPayment anomaliesPurchasing anomalies
Accounts payable invoicesCredit card/p-card purchases
RED FLAGS FOR BILLING SCHEMES
25 // experience clarity
Vendor attribute analysis
Trending of vendor activity
Identification of “high risk” payments
DATA ANALYTICS FOR BILLING SCHEMES
26 // experience clarity
27
Expense Reimbursements & Purchasing Cards
EXPENSE REIMBURSEMENT/P-CARDS
Any scheme in which an employee makes a claim for reimbursement or fictitious or inflated business expenses
Employee files fraudulent expense report, claiming personal travel, nonexistent meals, etc. Employee purchases personal items and submits and invoice to employer for paymentEmployee purchases goods/services for inappropriate uses and charges to employer for payment
28 // experience clarity
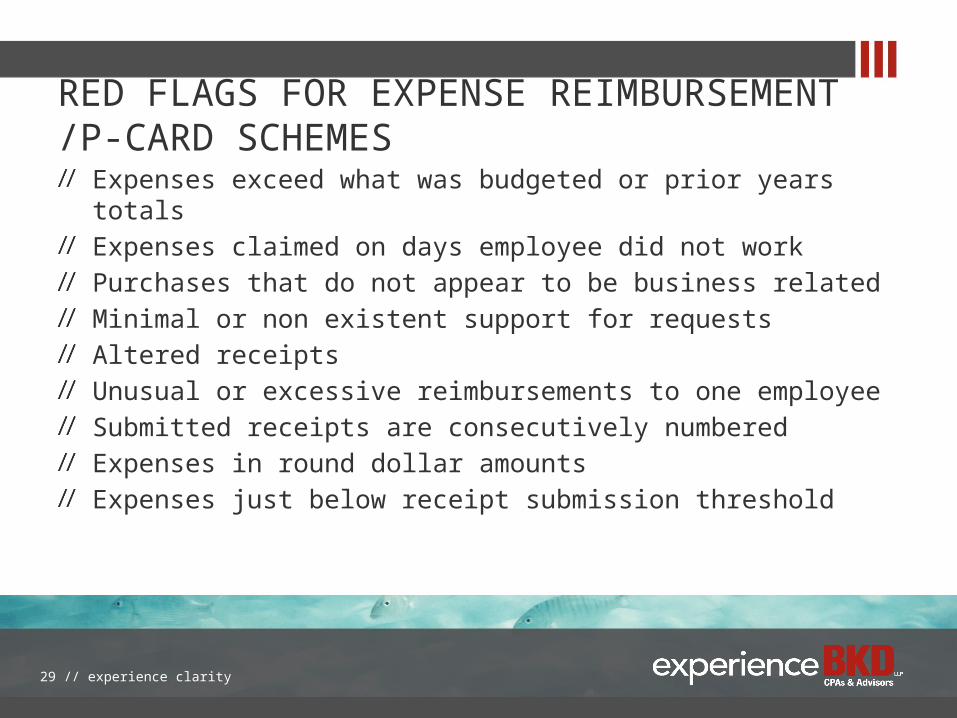
RED FLAGS FOR EXPENSE REIMBURSEMENT /P-CARD SCHEMES
Expenses exceed what was budgeted or prior years totalsExpenses claimed on days employee did not workPurchases that do not appear to be business relatedMinimal or non existent support for requestsAltered receiptsUnusual or excessive reimbursements to one employeeSubmitted receipts are consecutively numberedExpenses in round dollar amountsExpenses just below receipt submission threshold
29 // experience clarity
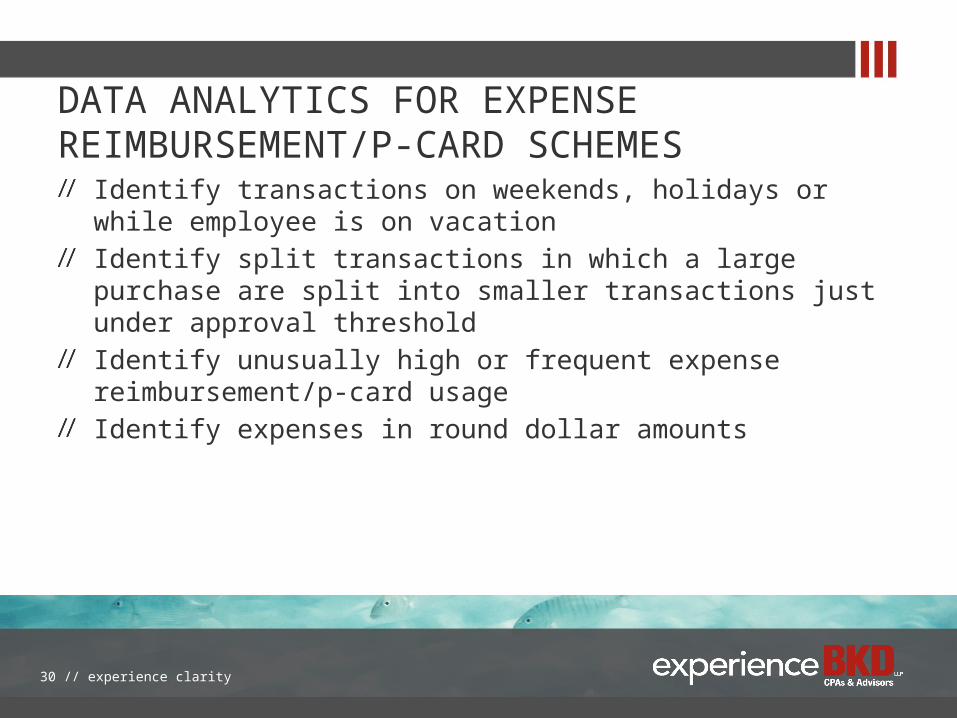
Identify transactions on weekends, holidays or while employee is on vacationIdentify split transactions in which a large purchase are split into smaller transactions just under approval thresholdIdentify unusually high or frequent expense reimbursement/p-card usageIdentify expenses in round dollar amounts
DATA ANALYTICS FOR EXPENSE REIMBURSEMENT/P-CARD SCHEMES
30 // experience clarity
31
Non-Cash
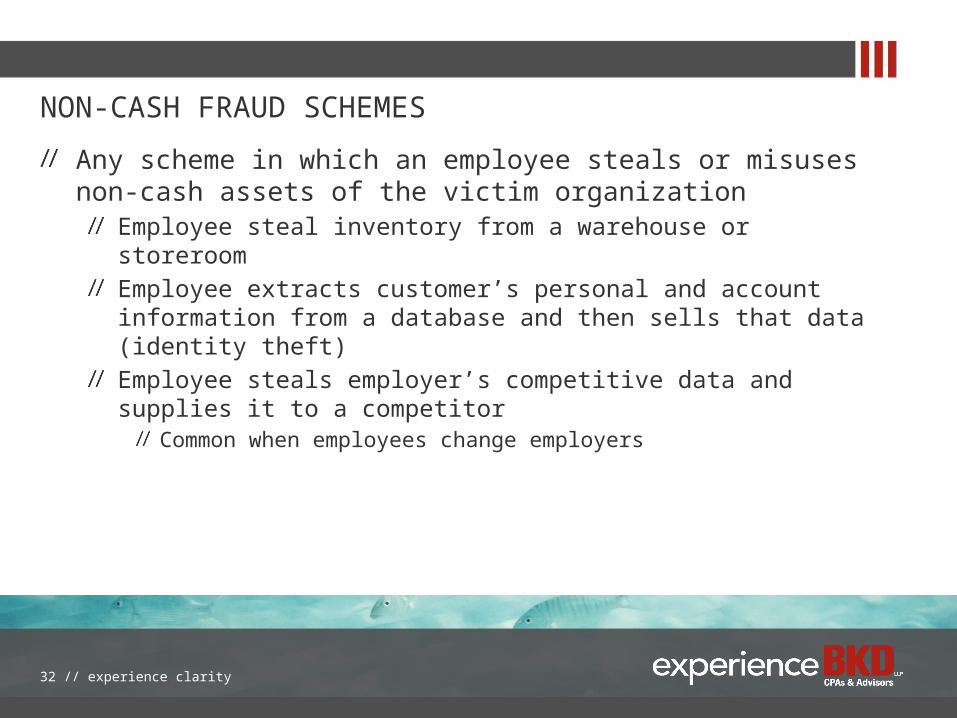
NON-CASH FRAUD SCHEMES
Any scheme in which an employee steals or misuses non-cash assets of the victim organization
Employee steal inventory from a warehouse or storeroomEmployee extracts customer’s personal and account information from a database and then sells that data (identity theft)Employee steals employer’s competitive data and supplies it to a competitor
Common when employees change employers
32 // experience clarity
RED FLAGS FOR NON-CASH SCHEMES
Shrinkage in inventory/suppliesEmployees who frequently visit the office after hoursMissing/borrowed tools, equipment, office supplies, etc.Missing, altered, or unmatched supporting documents
33 // experience clarity
DATA ANALYTICS FOR NON-CASH SCHEMES
Automated monitoring of:Online transactions and inquiriesThe date, time and source of online access, especially if the system can be accessed from a WAN or the InternetReport generation and downloading, including operational and custom reports or queries, especially those containing customer/client account informationEmails sent and received and attachment sizes
34 // experience clarity
35
Payroll
Ghost employeesFictitious employees entered into payroll system
Terminated employeesTerminated employees remain on payroll system with direct deposit to a current employee’s account
Duplicate payrollOverpayment schemes
Higher pay rates, inflated hours, unauthorized bonuses
PAYROLL SCHEMES
36 // experience clarity
PAYROLL FRAUD EXAMPLE
Payroll manager got the technical support staff at the payroll service provider to alter programming in her desktop software
Generated altered payroll reports from her desktop to hide the theft and used the altered reports to record to the ledgerLoss was $350,000 over four years
37 // experience clarity
Look for lack of:Bank accounts for electronic paymentsHome addresses and phone numbersHoliday leave, vacation or sick leaveBenefit/tax deductions
Also look forDuplicate SSNsDuplicate bank account numbersDuplicate home addressesPO box addressesPayments after termination
RED FLAGS/DATA ANALYTICS FOR PAYROLL SCHEMES
38 // experience clarity
INNOVATIONS IN ADVANCED TECHNOLOGY TOOLS
39 // experience clarity
TYPES OF UNSTRUCTURED DATA
Email (corporate and personal)Network Files and ECM SystemsPhone records, cell phonesComputer hard drives (deleted activity)Internet history, social media, chat, Skype, IMBoard minutes, performance appraisals
40 // experience clarity
LEVERAGE DATA IN YOUR ORGANIZATION
41 // experience clarity
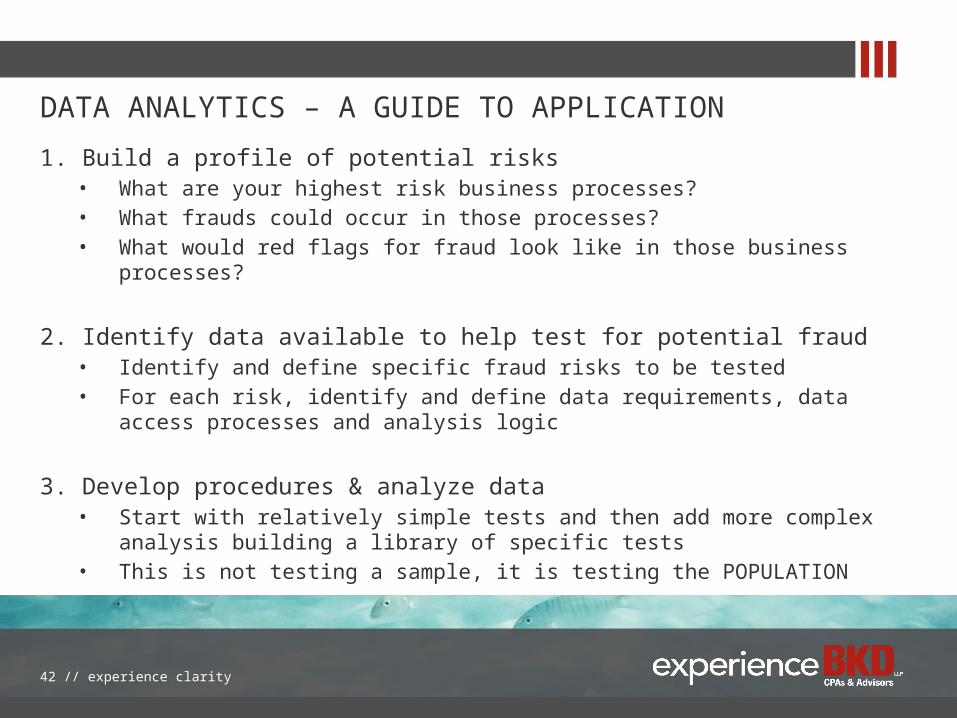
DATA ANALYTICS – A GUIDE TO APPLICATION
1. Build a profile of potential risks• What are your highest risk business processes?• What frauds could occur in those processes?• What would red flags for fraud look like in those business processes?
2. Identify data available to help test for potential fraud• Identify and define specific fraud risks to be tested• For each risk, identify and define data requirements, data access processes and
analysis logic
3. Develop procedures & analyze data• Start with relatively simple tests and then add more complex analysis building a
library of specific tests• This is not testing a sample, it is testing the POPULATION
42 // experience clarity
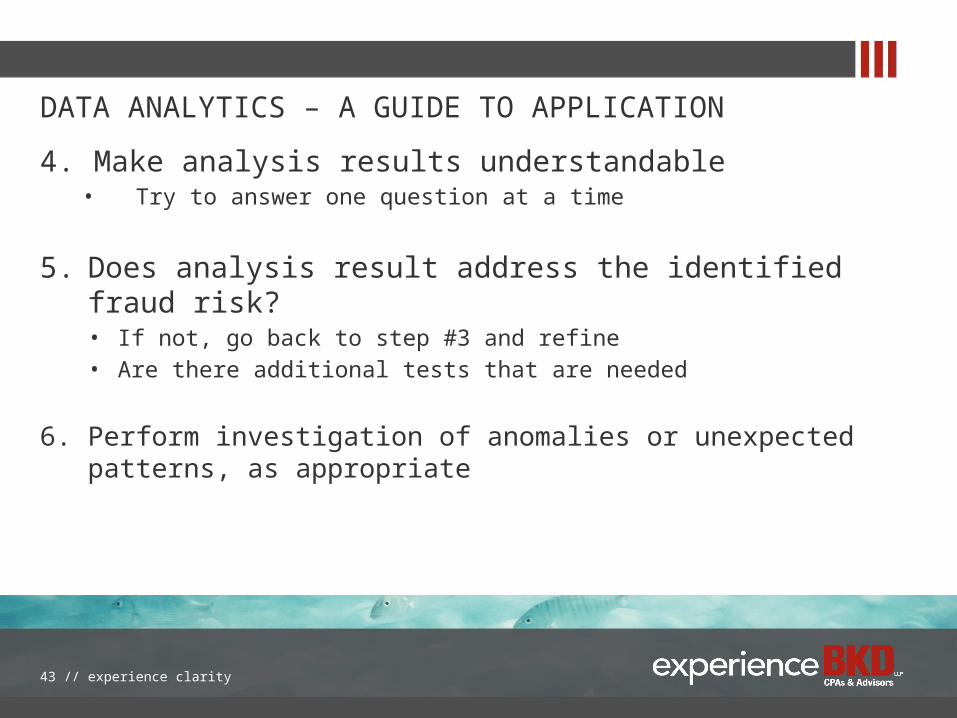
DATA ANALYTICS – A GUIDE TO APPLICATION
4. Make analysis results understandable• Try to answer one question at a time
5. Does analysis result address the identified fraud risk?• If not, go back to step #3 and refine• Are there additional tests that are needed
6. Perform investigation of anomalies or unexpected patterns, as appropriate
43 // experience clarity
QUESTIONS?
Contact Information
Shauna Woody-Coussens, CFEBKD, LLP
1201 Walnut, Ste. 1700Kansas City, MO 64106
44 // experience clarity
THANK YOU
FOR MORE INFORMATION // For a complete list of our offices and subsidiaries, visit bkd.com or contact:
Shauna Woody-Coussens, CFE // Managing [email protected] // 816.701.0150
45 // experience clarity


