2008 MACROFINANCECRASH
Explanations & Questions
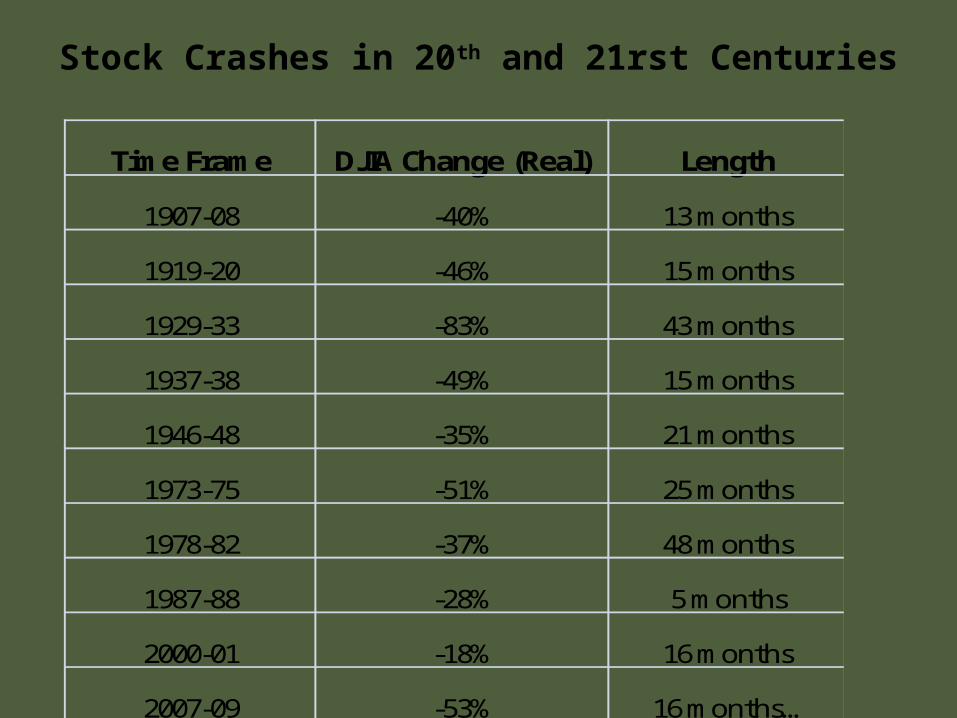
Stock Crashes in 20th and 21rst Centuries
Time Frame DJIA Change (Real) Length
1907-08 -40% 13 months
1919-20 -46% 15 months
1929-33 -83% 43 months
1937-38 -49% 15 months
1946-48 -35% 21 months
1973-75 -51% 25 months
1978-82 -37% 48 months
1987-88 -28% 5 months
2000-01 -18% 16 months
2007-09 -53% 16 months…

U.S. Stock Crashes and Macroeconomic Events
Time FrameStock Market Change (DIJA) Length
GDP Change (Real)
Stock Change/ GDP Change
Highest Unemp. Rate
1907-08 -40% 13 months -5% 8 8.00%
1919-20 -46% 15 months -23% 2 11.30%
1929-33 -83% 43 months -29% 3 25.20%
1937-38 -49% 15 months -7% 7 19.10%
1946-48 -35% 21 months -5% 7 4.00%
1973-75 -51% 25 months -5% 10 9.00%
1978-82 -37% 48 months -7% 5 10.80%
1987-88 -28% 5 months >0% NA 5.80%
2000-01 -18% 16 months -1% 18 6.10%
2007-2009 -53% 16 months -4% 13 10.10%
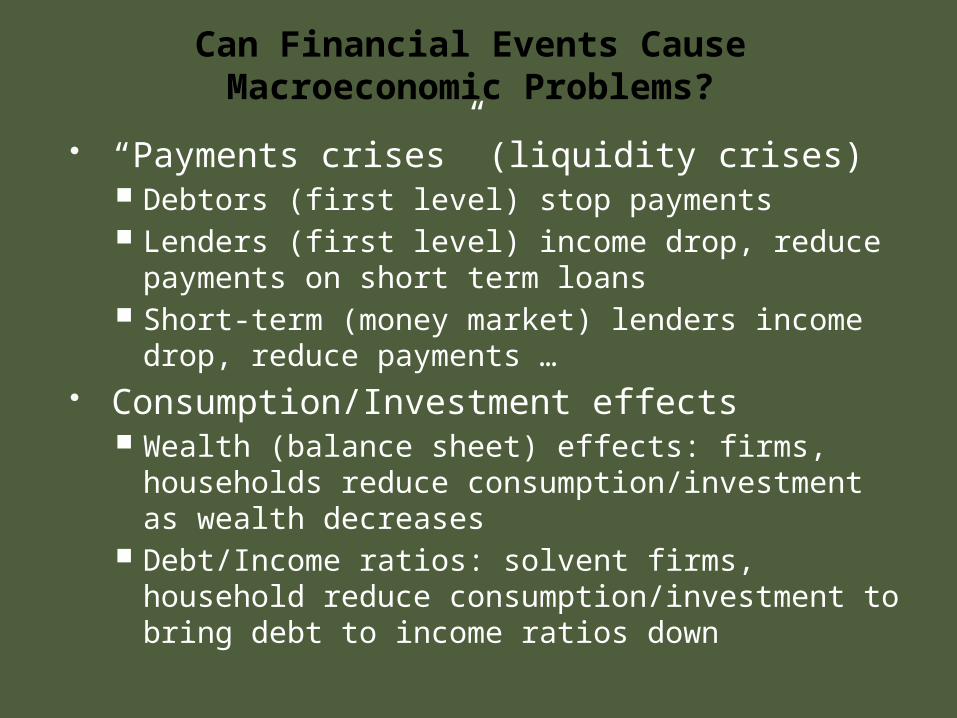
Can Financial Events CauseMacroeconomic Problems?
“Payments crises” (liquidity crises) Debtors (first level) stop payments Lenders (first level) income drop, reduce
payments on short term loans Short-term (money market) lenders income
drop, reduce payments … Consumption/Investment effects
Wealth (balance sheet) effects: firms, households reduce consumption/investment as wealth decreases
Debt/Income ratios: solvent firms, household reduce consumption/investment to bring debt to income ratios down
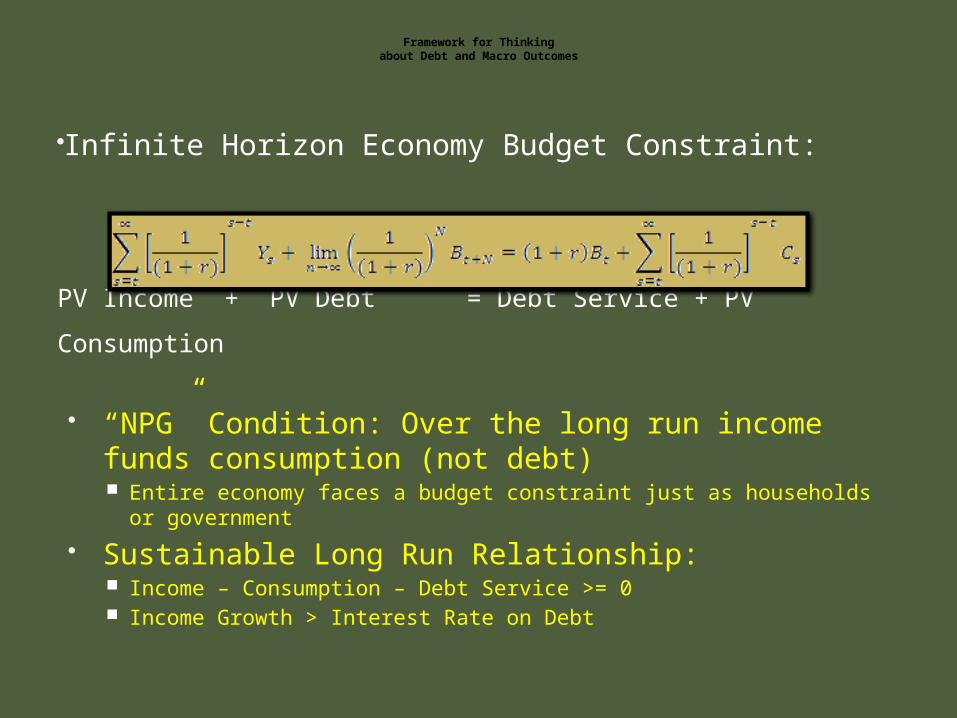
Framework for Thinking
about Debt and Macro Outcomes
Infinite Horizon Economy Budget Constraint:
PV Income + PV Debt = Debt Service + PV Consumption
“NPG” Condition: Over the long run income funds
consumption (not debt) Entire economy faces a budget constraint just as households or government
Sustainable Long Run Relationship: Income – Consumption – Debt Service >= 0 Income Growth > Interest Rate on Debt
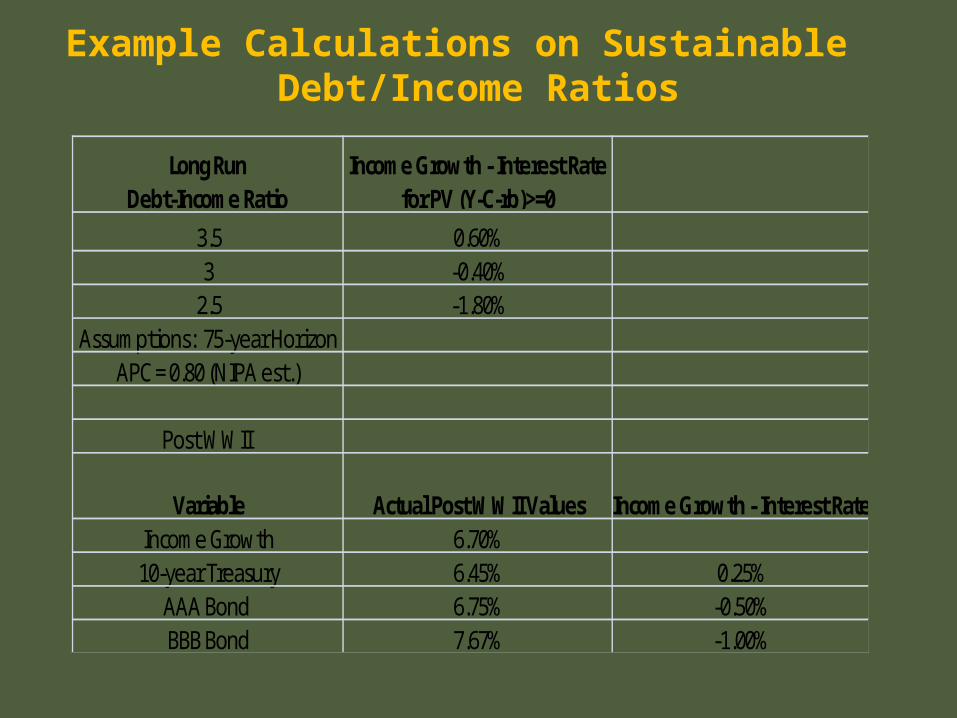
Example Calculations on Sustainable Debt/Income Ratios
Long Run Debt-Income Ratio
Income Growth - Interest Rate for PV (Y-C-rb)>=0
3.5 0.60%3 -0.40%
2.5 -1.80%Assumptions: 75-year Horizon
APC = 0.80 (NIPA est.)
Post WWII
Variable Actual Post WWII Values Income Growth - Interest RateIncome Growth 6.70%10-year Treasury 6.45% 0.25%
AAA Bond 6.75% -0.50%BBB Bond 7.67% -1.00%
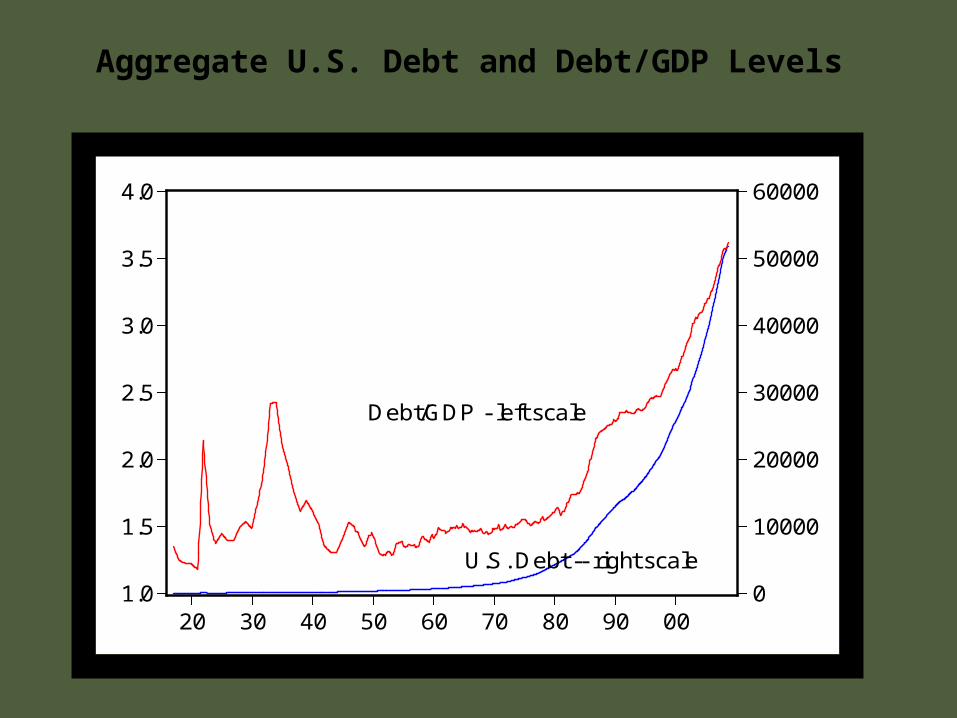
Aggregate U.S. Debt and Debt/GDP Levels
1.0
1.5
2.0
2.5
3.0
3.5
4.0
0
10000
20000
30000
40000
50000
60000
20 30 40 50 60 70 80 90 00
U.S. Debt -- right scale
Debt/GDP - left scale
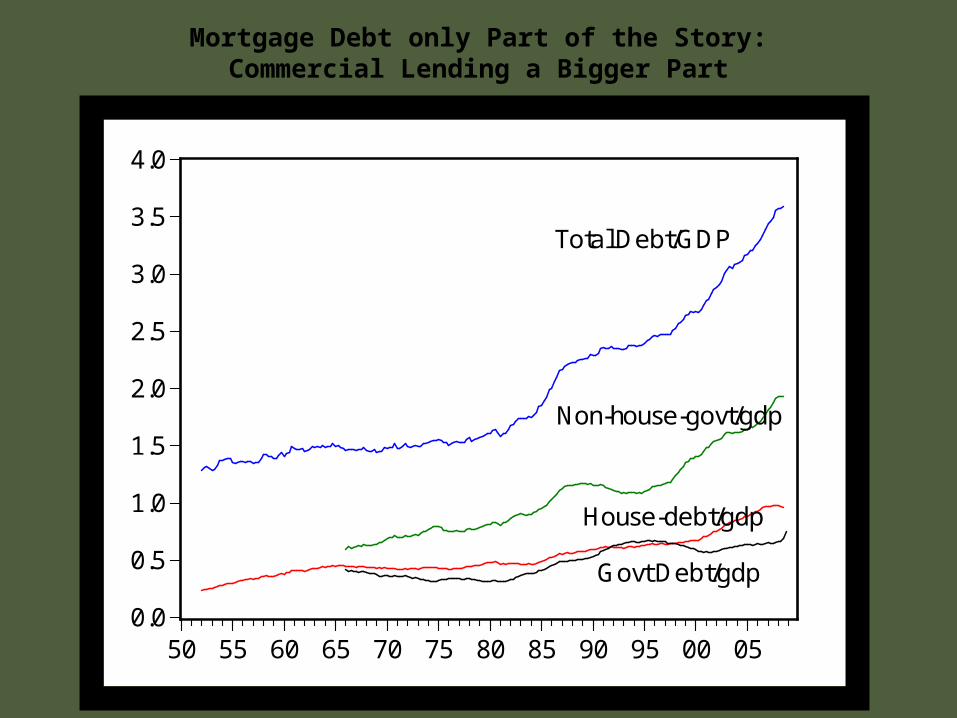
Mortgage Debt only Part of the Story:Commercial Lending a Bigger Part
0.0
0.5
1.0
1.5
2.0
2.5
3.0
3.5
4.0
50 55 60 65 70 75 80 85 90 95 00 05
Total Debt/GDP
Non-house-govt/gdp
House-debt/gdp
Govt Debt/gdp
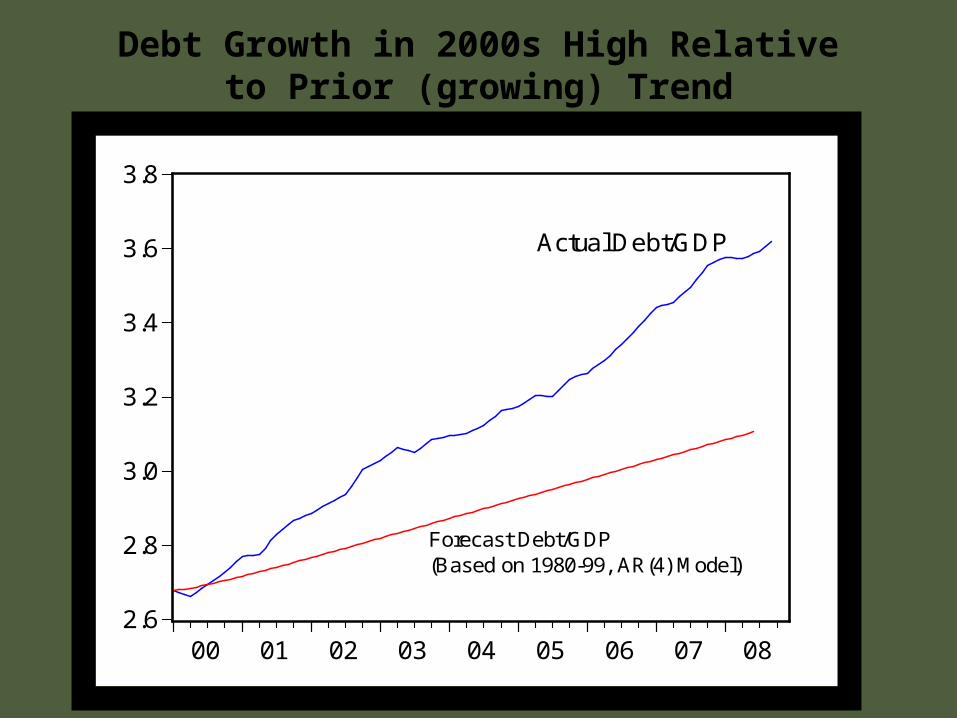
Debt Growth in 2000s High Relativeto Prior (growing) Trend
2.6
2.8
3.0
3.2
3.4
3.6
3.8
00 01 02 03 04 05 06 07 08
Actual Debt/GDP
Forecast Debt/GDP(Based on 1980-99, AR(4) Model)
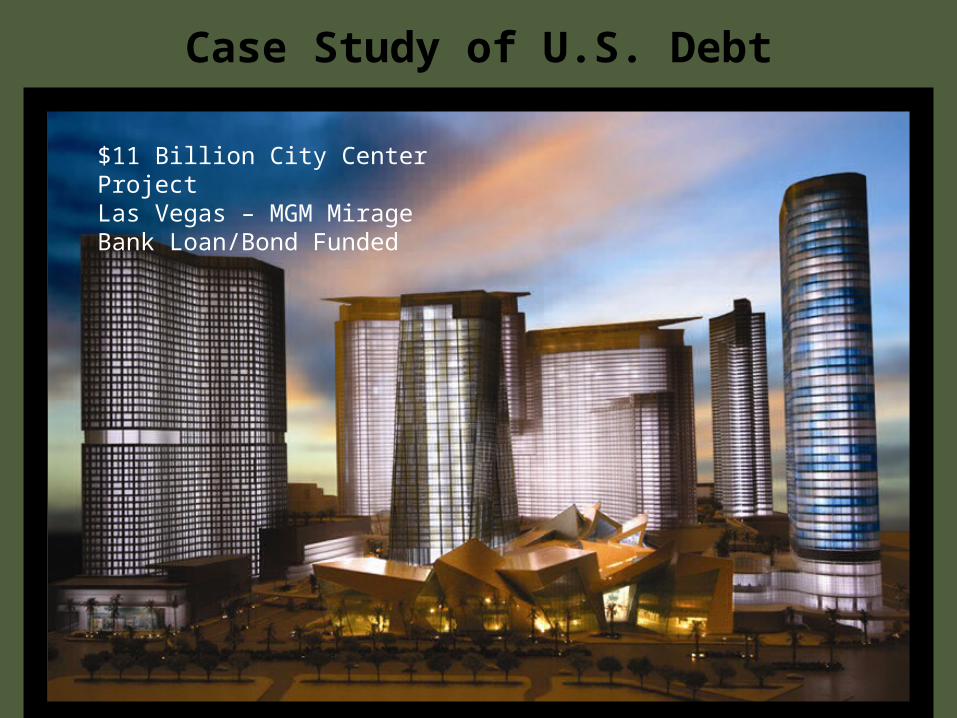
Case Study of U.S. Debt
$11 Billion City Center ProjectLas Vegas – MGM MirageBank Loan/Bond Funded
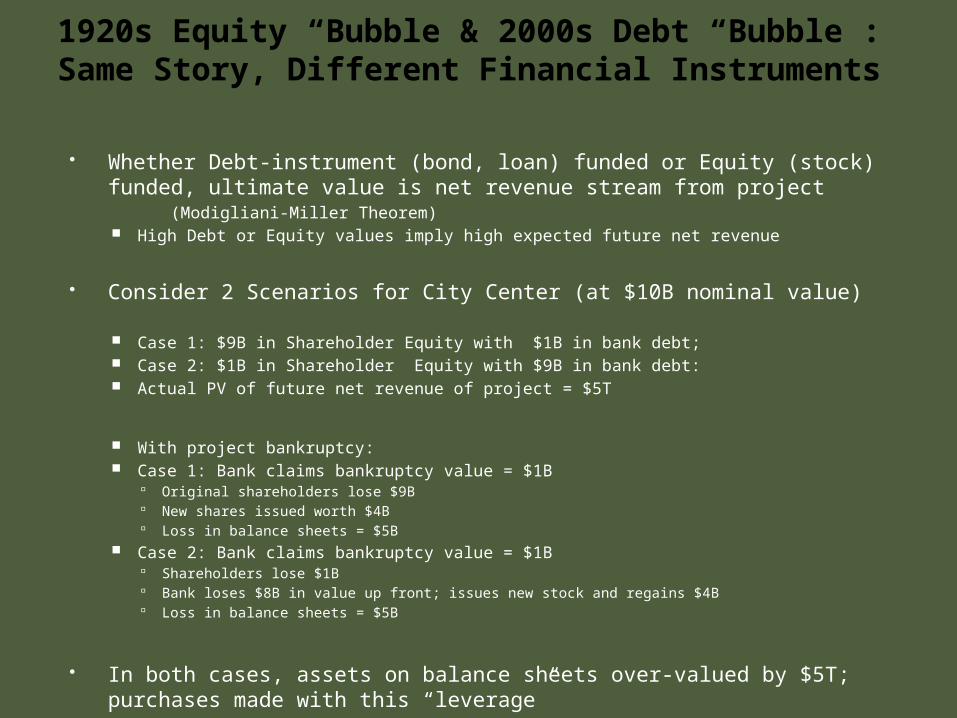
1920s Equity “Bubble & 2000s Debt “Bubble”:Same Story, Different Financial Instruments
Whether Debt-instrument (bond, loan) funded or Equity (stock) funded, ultimate value is net revenue stream from project (Modigliani-Miller Theorem) High Debt or Equity values imply high expected future net revenue
Consider 2 Scenarios for City Center (at $10B nominal value)
Case 1: $9B in Shareholder Equity with $1B in bank debt; Case 2: $1B in Shareholder Equity with $9B in bank debt: Actual PV of future net revenue of project = $5T
With project bankruptcy: Case 1: Bank claims bankruptcy value = $1B
Original shareholders lose $9B New shares issued worth $4B Loss in balance sheets = $5B
Case 2: Bank claims bankruptcy value = $1B Shareholders lose $1B Bank loses $8B in value up front; issues new stock and regains $4B Loss in balance sheets = $5B
In both cases, assets on balance sheets over-valued by $5T; purchases made with this “leverage”
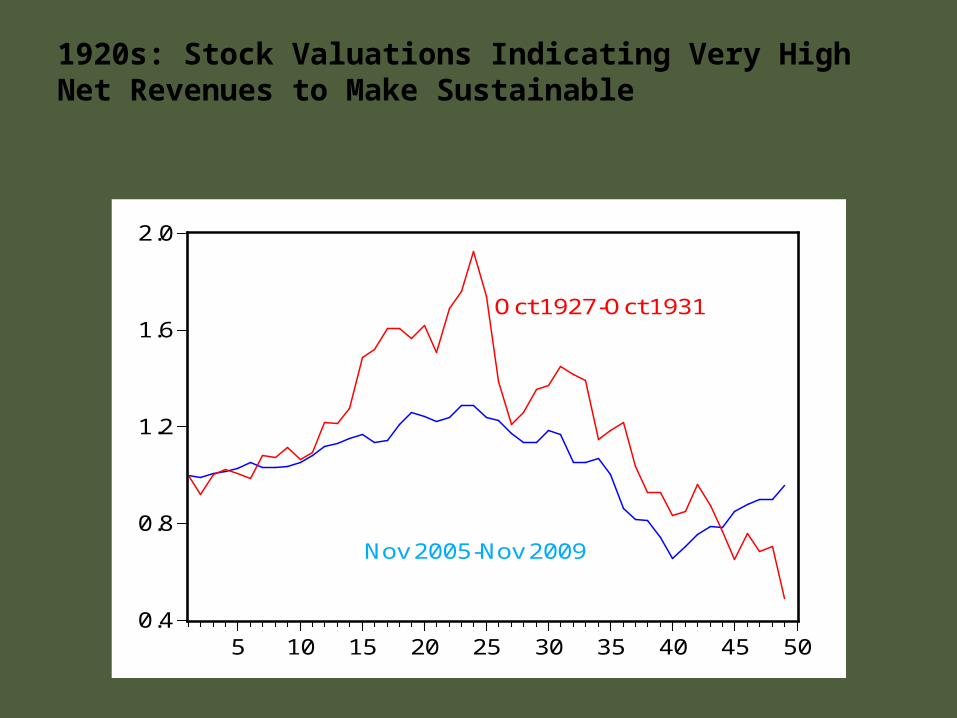
1920s: Stock Valuations Indicating Very High Net Revenues to Make Sustainable
0.4
0.8
1.2
1.6
2.0
5 10 15 20 25 30 35 40 45 50
Oct 1927-Oct 1931
Nov 2005-Nov 2009
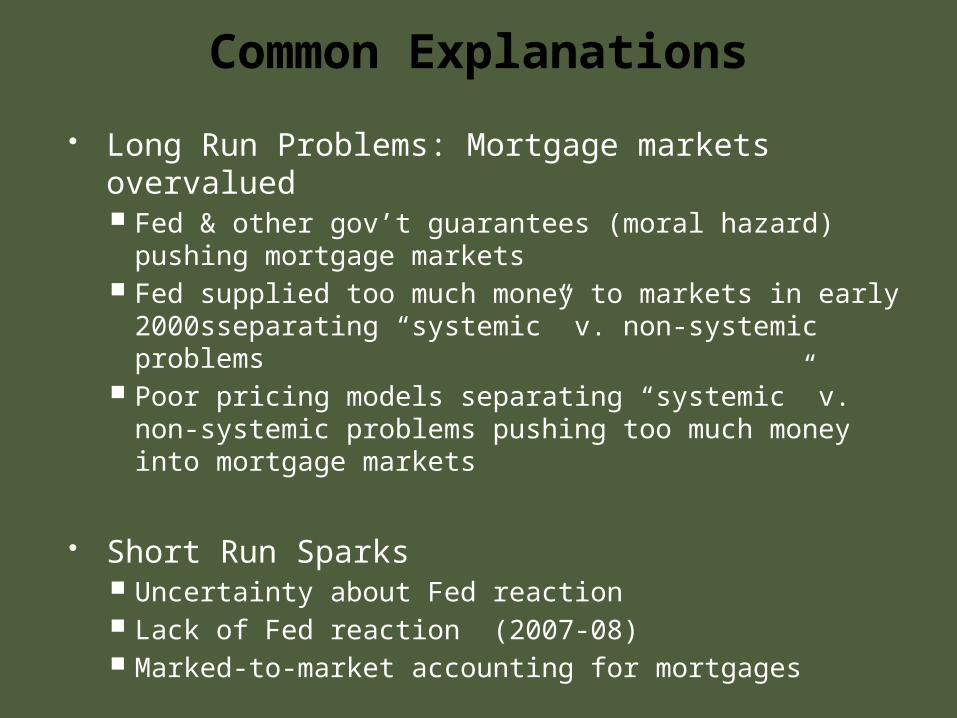
Common Explanations
Long Run Problems: Mortgage markets overvalued Fed & other gov’t guarantees (moral hazard)
pushing mortgage markets Fed supplied too much money to markets in early
2000sseparating “systemic” v. non-systemic problems
Poor pricing models separating “systemic” v. non-systemic problems pushing too much money into mortgage markets
Short Run Sparks Uncertainty about Fed reaction Lack of Fed reaction (2007-08) Marked-to-market accounting for mortgages
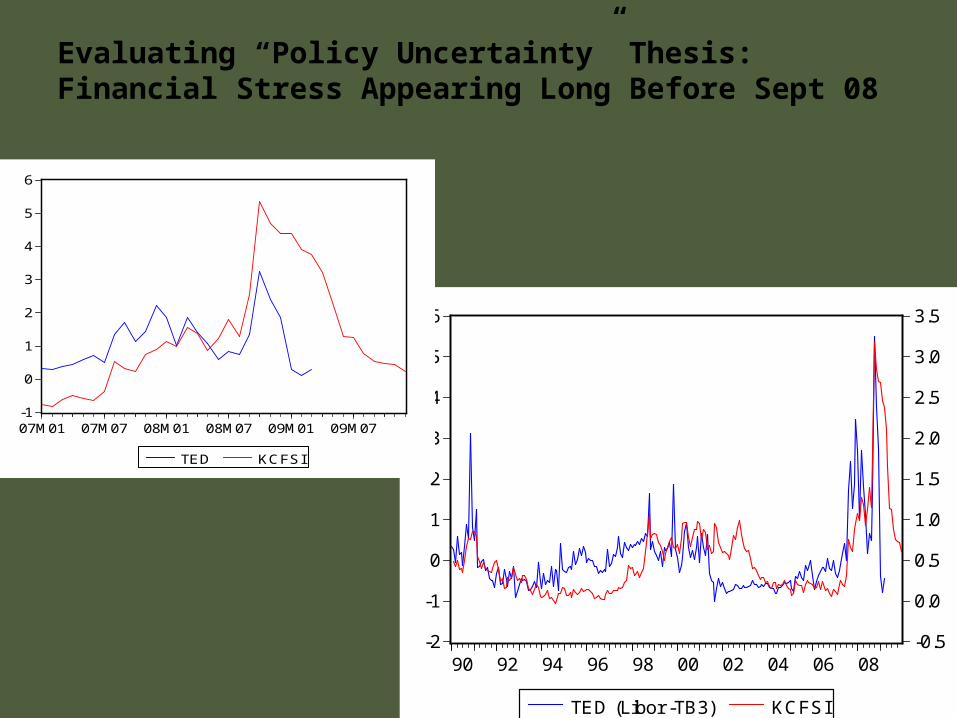
Evaluating “Policy Uncertainty” Thesis:Financial Stress Appearing Long Before Sept 08
-2
-1
0
1
2
3
4
5
6
-0.5
0.0
0.5
1.0
1.5
2.0
2.5
3.0
3.5
90 92 94 96 98 00 02 04 06 08
TED (Libor -TB3) KCFSI
-1
0
1
2
3
4
5
6
07M01 07M07 08M01 08M07 09M01 09M07
TED KCFSI
Why So Much Attention on Mortgage Debt?
See mortgage debt as leading indicator, not as only cause Fire analogy: room with fire in it first does not
tell you about the fuel and match
Mortgage debt securitized-tradeable; Quickly reflecting change in valuations
Commercial bank loans non-tradeable; Held at bank estimated values for longer
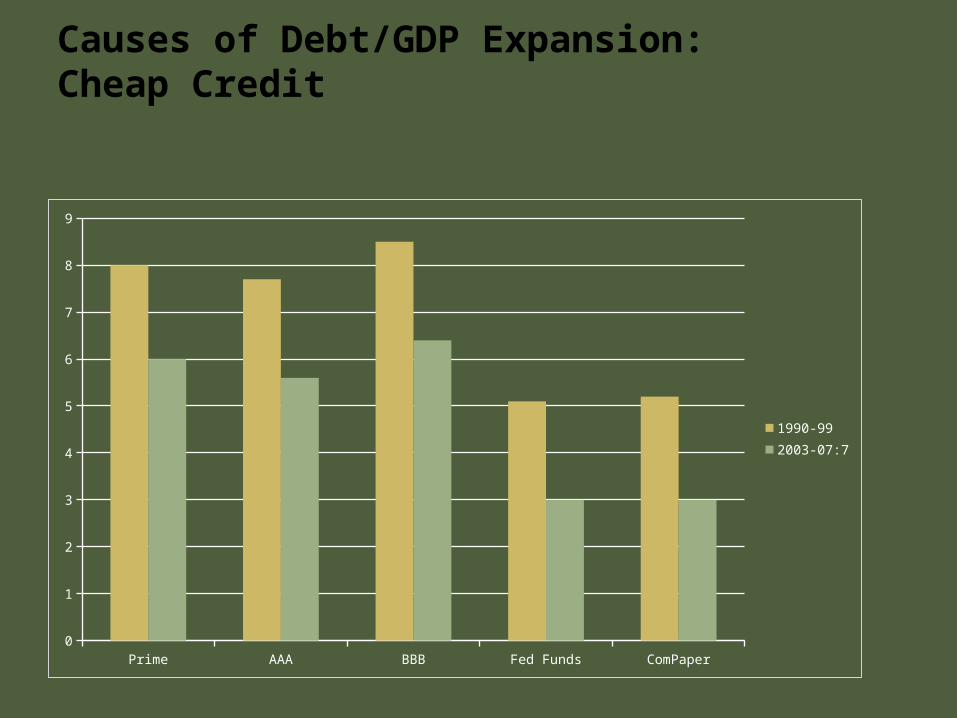
Causes of Debt/GDP Expansion:Cheap Credit
Prime AAA BBB Fed Funds ComPaper0
1
2
3
4
5
6
7
8
9
1990-992003-07:7
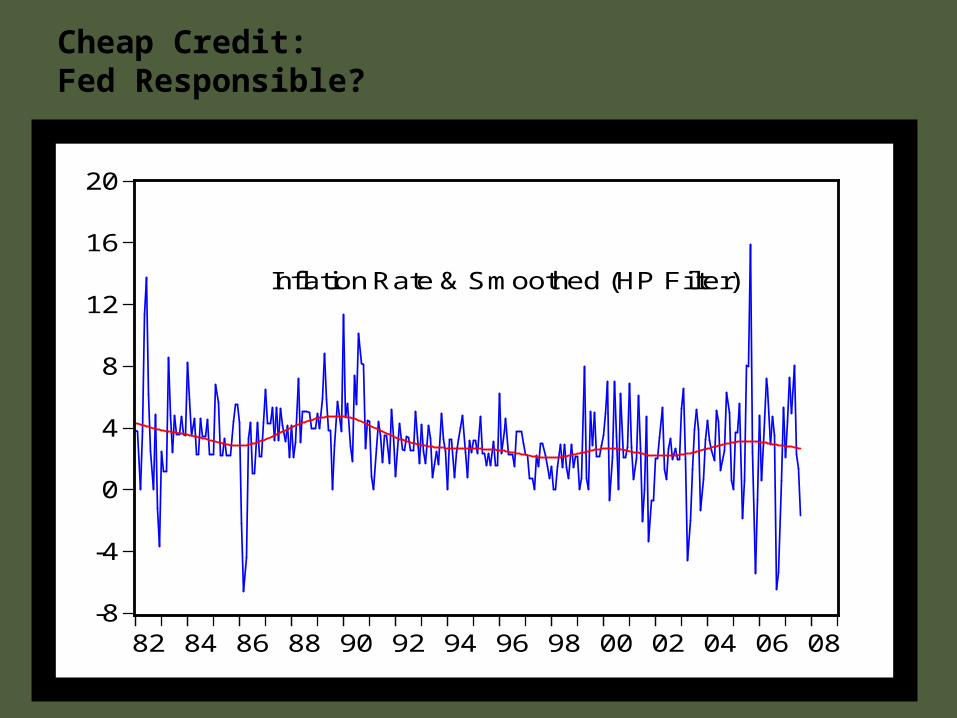
Cheap Credit:Fed Responsible?
-8
-4
0
4
8
12
16
20
82 84 86 88 90 92 94 96 98 00 02 04 06 08
Inflation Rate & Smoothed (HP Filter)
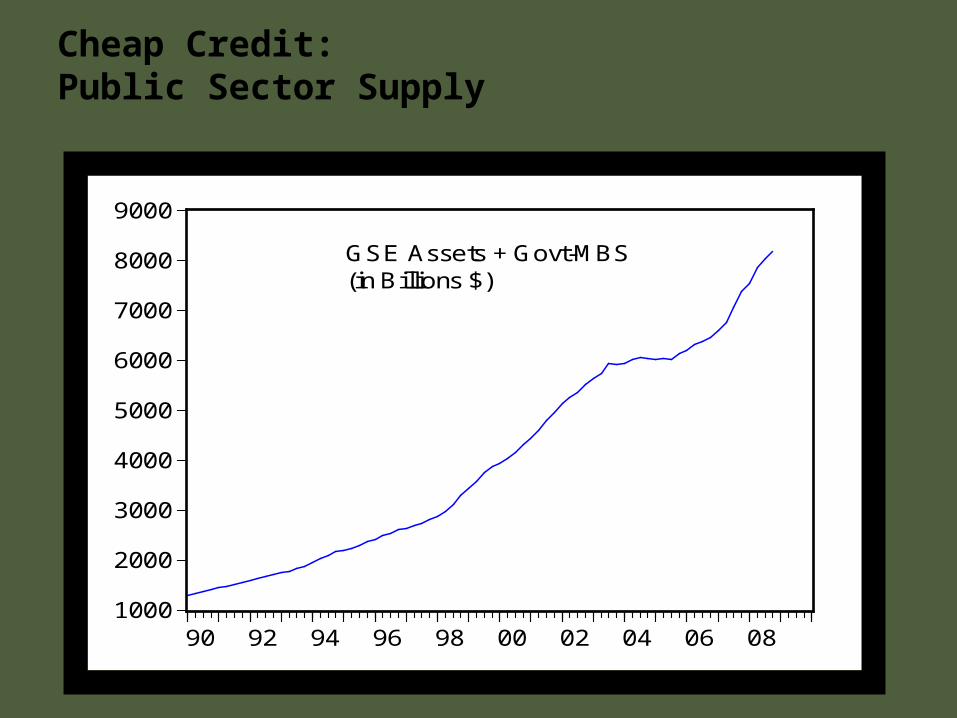
Cheap Credit: Public Sector Supply
1000
2000
3000
4000
5000
6000
7000
8000
9000
90 92 94 96 98 00 02 04 06 08
GSE Assets + Govt-MBS(in Billions $)
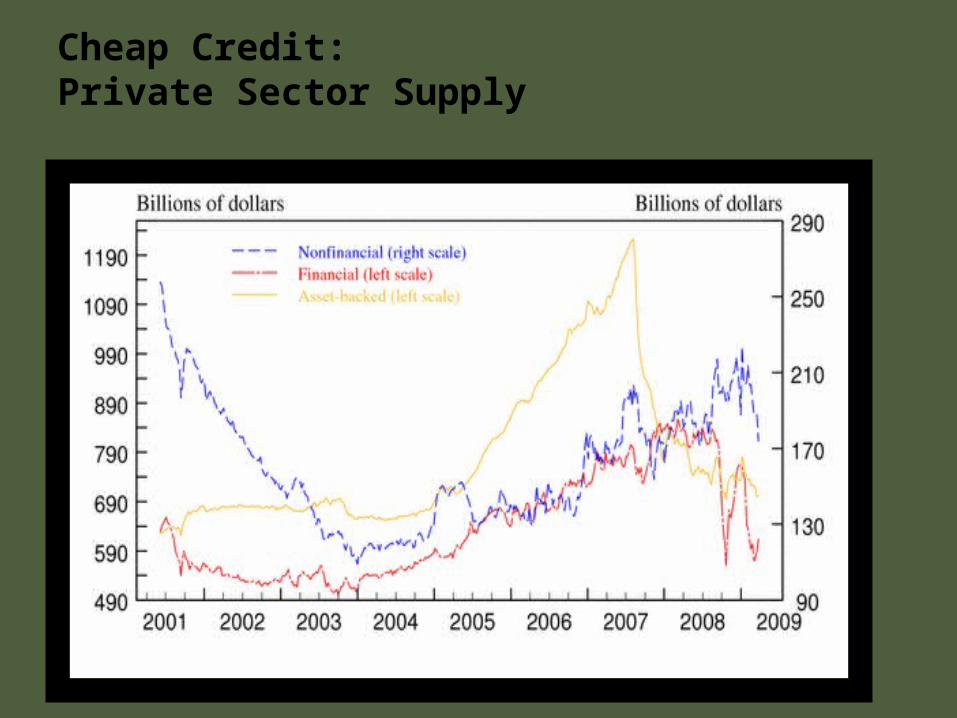
Cheap Credit: Private Sector Supply
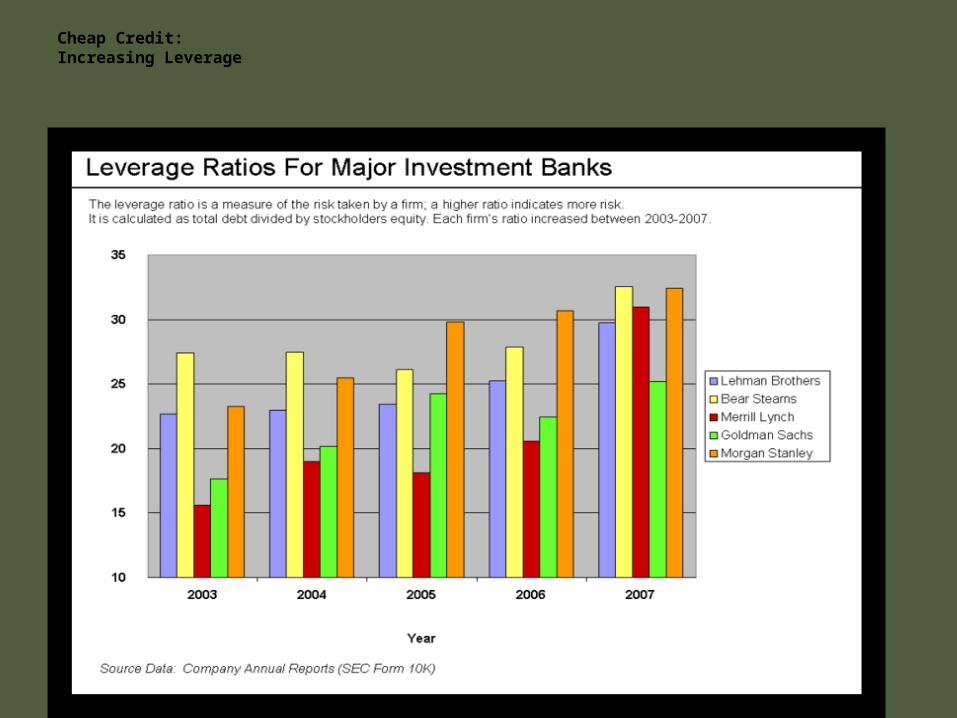
Cheap Credit: Increasing Leverage
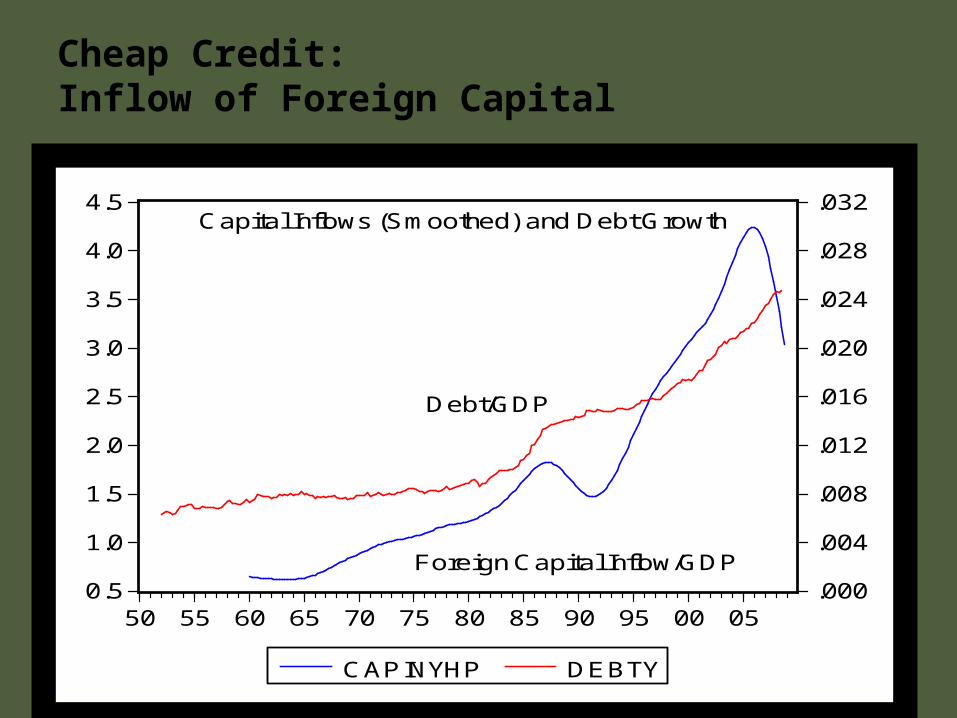
Cheap Credit:Inflow of Foreign Capital
0.5
1.0
1.5
2.0
2.5
3.0
3.5
4.0
4.5
.000
.004
.008
.012
.016
.020
.024
.028
.032
50 55 60 65 70 75 80 85 90 95 00 05
CAPINYHP DEBTY
Foreign Capital Inflow/GDP
Debt/GDP
Capital Inflows (Smoothed) and Debt Growth
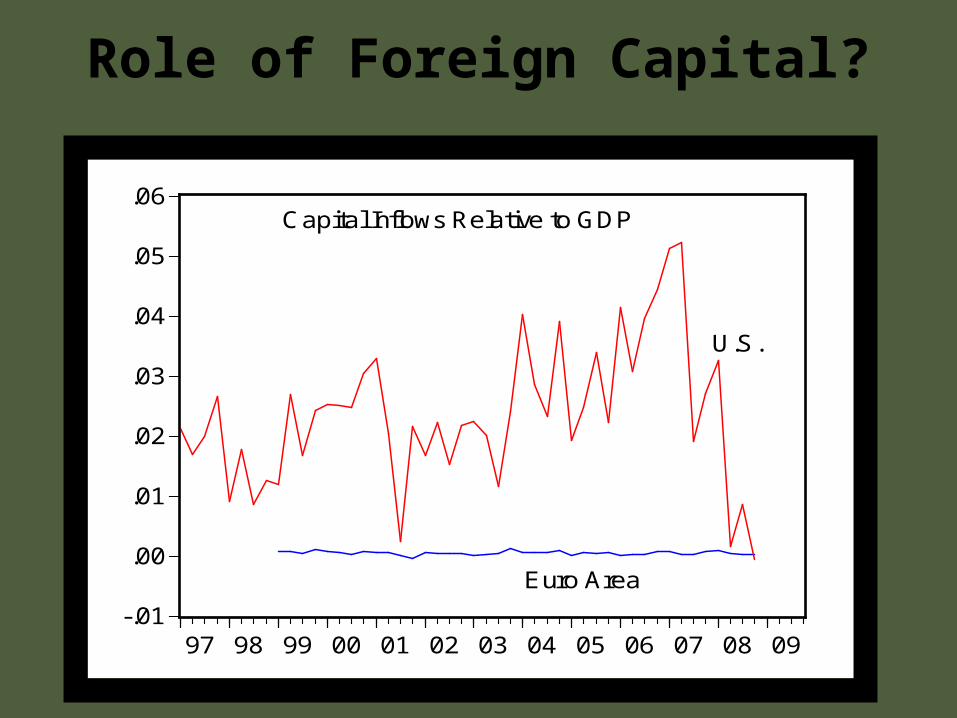
Role of Foreign Capital?
-.01
.00
.01
.02
.03
.04
.05
.06
97 98 99 00 01 02 03 04 05 06 07 08 09
U.S.
Euro Area
Capital Inflows Relative to GDP
Cheap Credit: Innovations?
Securitization, e.g. CDOs Pooling mortgage (other debt) risk (CDOs,
SPVs) Credit Insurance
Transferring Risk (CDS) Cochrane: can shuffle risk around, but not
change total amount
Evaluation: CDOs, CDS actually relatively small versus
size of overall debt growth
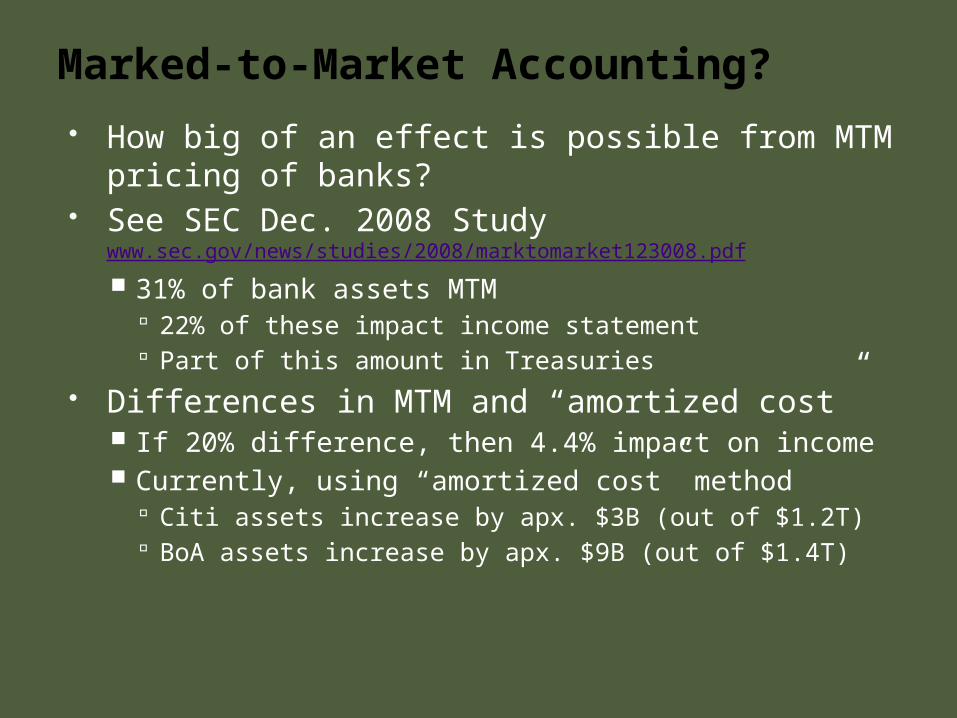
Marked-to-Market Accounting?
How big of an effect is possible from MTM pricing of banks?
See SEC Dec. 2008 Study www.sec.gov/news/studies/2008/marktomarket123008.pdf
31% of bank assets MTM 22% of these impact income statement Part of this amount in Treasuries
Differences in MTM and “amortized cost” If 20% difference, then 4.4% impact on
income Currently, using “amortized cost” method
Citi assets increase by apx. $3B (out of $1.2T) BoA assets increase by apx. $9B (out of $1.4T)
Solutions? Cochrane:
Specify systemic risk for Fed, limiting TBTF Stiglitz, …
Limit financial innovation More stringent oversight
Poole, Bullard, BG, … Raise equity standards Limit financial firm size
Charge insurance fee based on size Explicit size limitations
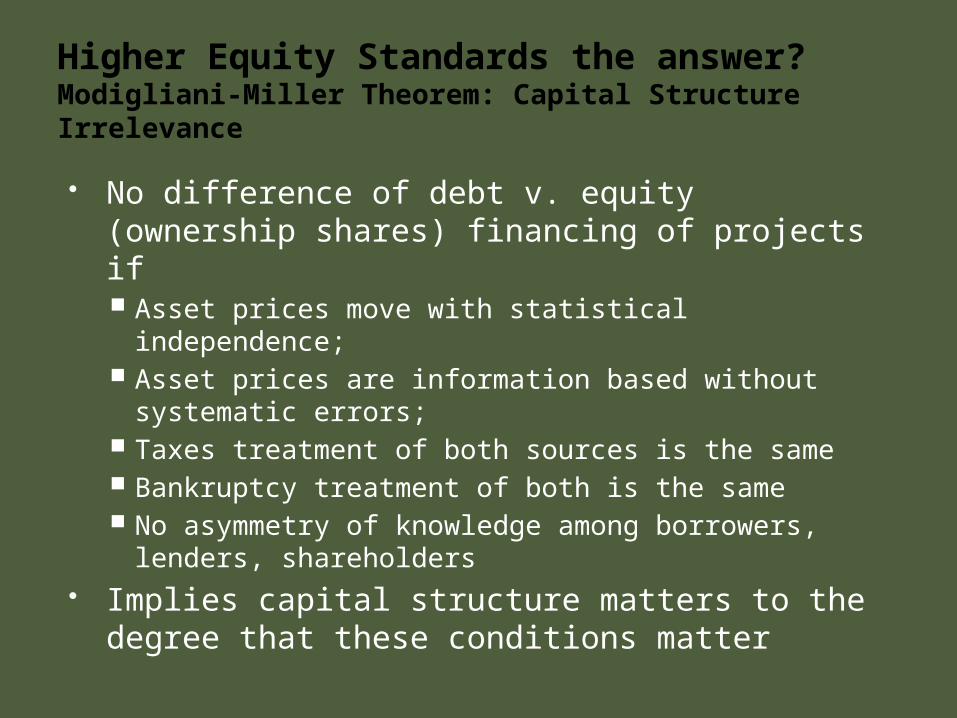
Higher Equity Standards the answer?Modigliani-Miller Theorem: Capital Structure Irrelevance
No difference of debt v. equity (ownership shares) financing of projects if Asset prices move with statistical independence; Asset prices are information based without
systematic errors; Taxes treatment of both sources is the same Bankruptcy treatment of both is the same No asymmetry of knowledge among borrowers,
lenders, shareholders Implies capital structure matters to the
degree that these conditions matter
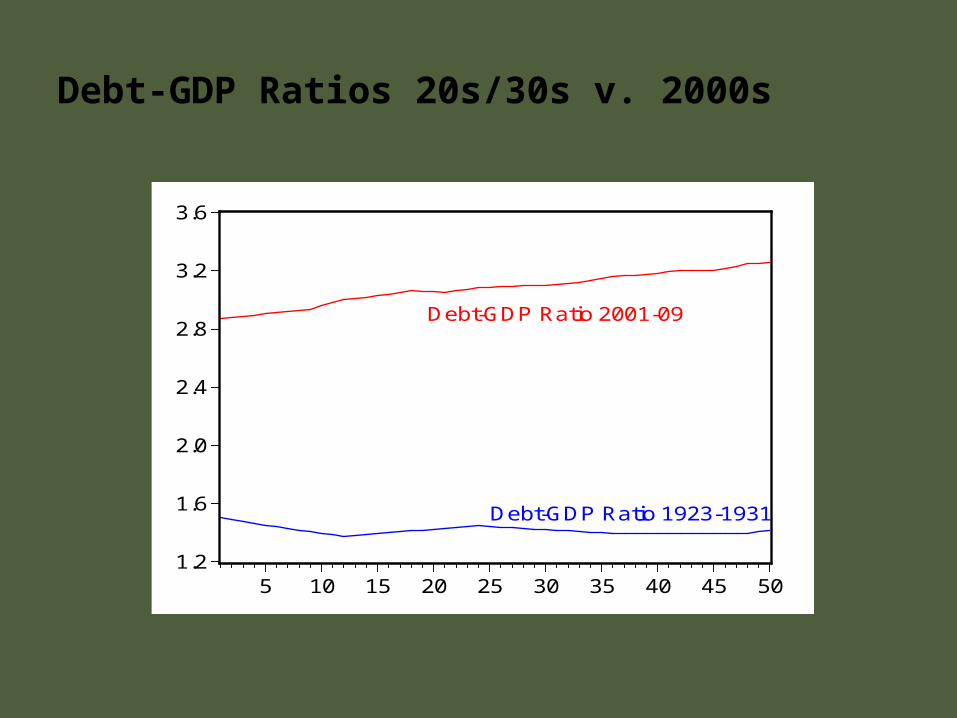
Debt-GDP Ratios 20s/30s v. 2000s
1.2
1.6
2.0
2.4
2.8
3.2
3.6
5 10 15 20 25 30 35 40 45 50
Debt-GDP Ratio 2001-09
Debt-GDP Ratio 1923-1931


