
Food consumption in India: comparison of dietary data sources
Lukasz Aleksandrowicz1,2, Mehroosh Tak2,3, Rosie Green1,2, Sanjay Kinra1, Andy Haines1
1London School of Hygiene & Tropical Medicine (LSHTM); 2Leverhulme Centre for Integrative Research on
Agriculture and Health (LICRAH); 3School of Oriental and African Studies (SOAS)
Source: CCAFS Nepal, licensed by CC

• Dietary data important for various health, agriculture and
development policies
• Several methods for measuring food consumption, with
impacts on what/how much we eat
• Relevance to India: nutrition transition & calorie puzzle
• Food intake between various Indian dietary surveys has not
been compared
Background

• National Sample Survey (NSS)
• India Human Development Survey (IHDS)
Data
• Bangalore
• Hyderabad
• Nagpur
• Lucknow
• Indian Migration Study (IMS)
• Andhra Pradesh Children & Parents Study
(APCAPS)
• Nat’l Nutrition Monitoring Bureau (NNMB)
• FAO
Food expenditure
Dietary intake
Food availability

AnalysisTable1-Descriptionofdatasets
Datatype
Yearof
survey Region
Rural/
urban
Recall
period
Sample
size
NSSO61 HCES 2004-2005 National Both 30days 353,561
NSSO66 HCES 2009-2010 National Both 30days 284,718
NSSO68 HCES 2011-2012 National Both 30days 285,954
IHDS-I HCES 2004-2005 National Both 30days 124,355
IHDS-II HCES 2011-2012 National Both 30days 121,622
IMS FFQ 2005-2007
Hyderabad,
Lucknow,Nagpur,
Bangaloredistricts Both 1year 6,867
APCAPS-3 FFQ 2009-2010
Rangareddydistrict,
AndhraPradesh Rural 1year 5,985
NNMB 24HR 2004-2005 National* Rural 24hours N/A
NNMB 24HR 2011-2012 National* Rural 24hours N/A
FAO FBS 2005-2006 National Both N/A N/A
FAO FBS 2011-2012 National Both N/A N/A
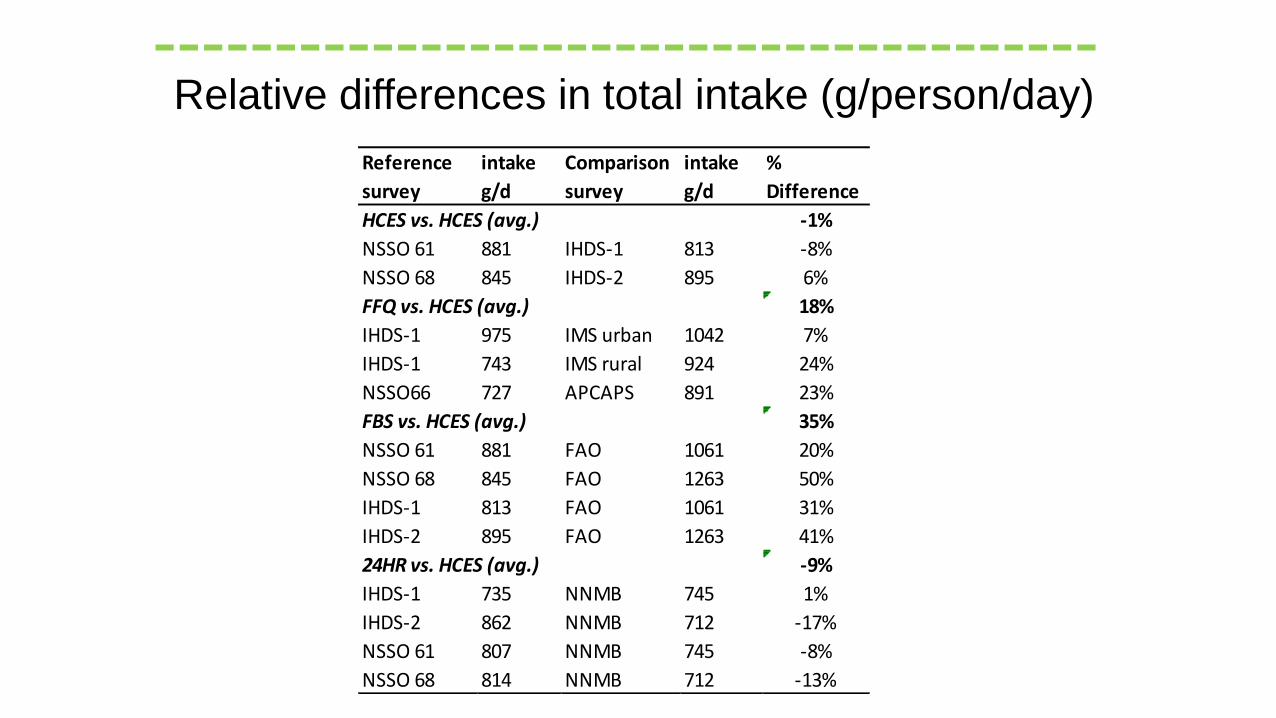
Reference
survey
intake
g/d
Comparison
survey
intake
g/d
%
Difference
HCES vs. HCES (avg.) -1%
NSSO 61 881 IHDS-1 813 -8%
NSSO 68 845 IHDS-2 895 6%
FFQ vs. HCES (avg.) 18%
IHDS-1 975 IMS urban 1042 7%
IHDS-1 743 IMS rural 924 24%
NSSO66 727 APCAPS 891 23%
FBS vs. HCES (avg.) 35%
NSSO 61 881 FAO 1061 20%
NSSO 68 845 FAO 1263 50%
IHDS-1 813 FAO 1061 31%
IHDS-2 895 FAO 1263 41%
24HR vs. HCES (avg.) -9%
IHDS-1 735 NNMB 745 1%
IHDS-2 862 NNMB 712 -17%
NSSO 61 807 NNMB 745 -8%
NSSO 68 814 NNMB 712 -13%
Relative differences in total intake (g/person/day)
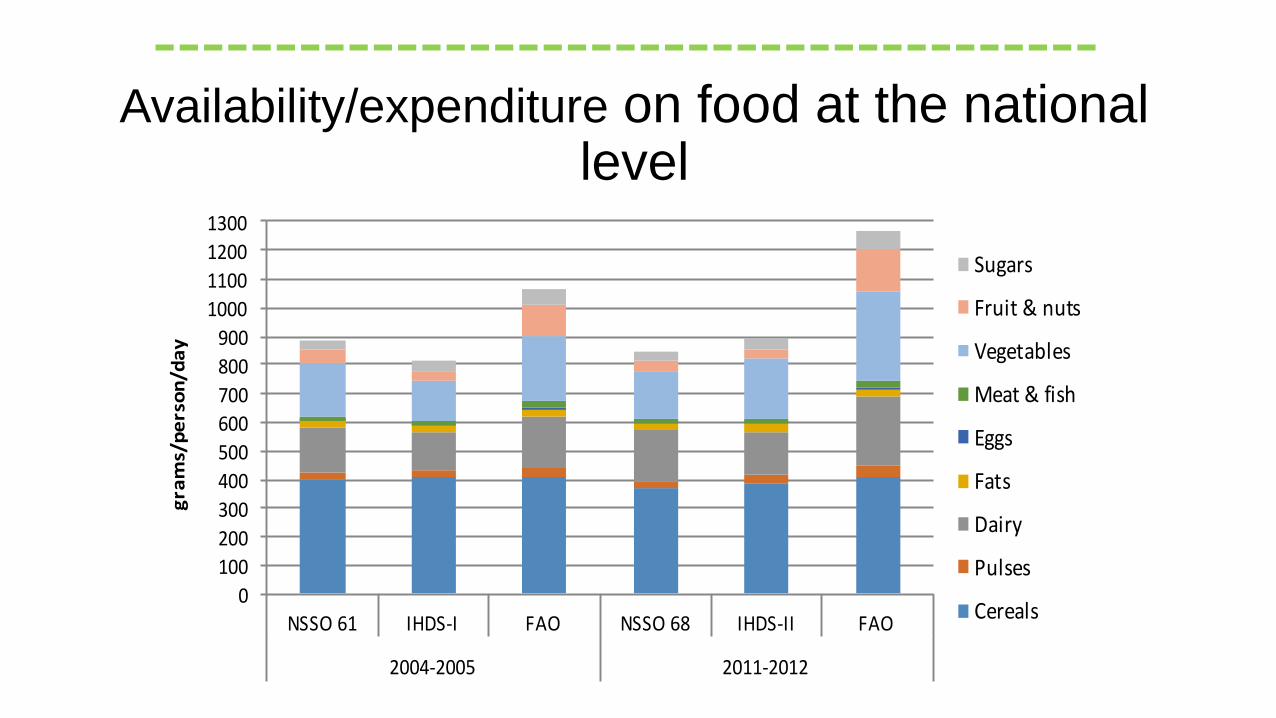
Availability/expenditure on food at the national level
0
100
200
300
400
500
600
700
800
900
1000
1100
1200
1300
NSSO61 IHDS-I FAO NSSO68 IHDS-II FAO
2004-2005 2011-2012
grams/person/day
Sugars
Fruit&nuts
Vegetables
Meat&fish
Eggs
Fats
Dairy
Pulses
Cereals

HCES vs.
HCES
FFQ vs.
HCES
FBS vs.
HCES
24HR vs.
HCES Average*
Cereals 4% -9% 4% 8% 6%
Pulses -12% 27% 22% 19% 20%
Dairy -15% 47% 26% -54% 36%
Fats 1% 24% 10% -39% 18%
Eggs 37% 48% 43% N/A 43%
Meat & fish 10% 51% 45% -21% 32%
Vegetables -4% -26% 32% -40% 26%
Fruit & nuts -56% 21% 71% -11% 40%
Sugar 30% -31% 42% -133% 59%
*Absolute magnitude, taking all relative differences as positive
Relative differences in food group intake (g/person/day)

Interpretations
• Limitations: lack of gold standard for validate
• Comparison to literature:
– Food availability data tends to overestimate
– FFQ has variable performance
– HCES: difficulty in measuring foods eaten out of home
• Summary: comparison of relative differences indicate limitations of dietary data use; further work must better validate these data sources

Funders• LCIRAH (Lukasz Aleksandrowicz, Mehroosh Tak), Wellcome Trust (Rosemary
Green)
Data• NSS (Ministry of Statistics, Government of India)
• IHDS (National Council of Applied Economic Research, New Delhi)
• Food availability (FAO)
• IMS & APCAPS (LSHTM, PHFI)
Thank you
Contact: [email protected]


